
Longer-Term Investigation of the Value of 18F-FDG-PET and Magnetic Resonance Imaging for Predicting the Conversion of Mild Cognitive Impairment to Alzheimer’s Disease: A Multicenter Study
Abstract
Background:
The value of fluorine-18-fluorodeoxyglucose positron emission tomography (18F-FDG-PET) and magnetic resonance imaging (MRI) for predicting conversion of mild cognitive impairment (MCI) to Alzheimer’s disease (AD) in longer-term is unclear.
Objective:
To evaluate longer-term prediction of MCI to AD conversion using 18F-FDG-PET and MRI in a multicenter study.
Methods:
One-hundred and fourteen patients with MCI were followed for 5 years. They underwent clinical and neuropsychological examinations, 18F-FDG-PET, and MRI at baseline. PET images were visually classified into predefined dementia patterns. PET scores were calculated as a semi quantitative index. For structural MRI, z-scores in medial temporal area were calculated by automated volume-based morphometry (VBM).
Results:
Overall, 72% patients with amnestic MCI progressed to AD during the 5-year follow-up. The diagnostic accuracy of PET scores over 5 years was 60% with 53% sensitivity and 84% specificity. Visual interpretation of PET images predicted conversion to AD with an overall 82% diagnostic accuracy, 94% sensitivity, and 53% specificity. The accuracy of VBM analysis presented little fluctuation through 5 years and it was highest (73%) at the 5-year follow-up, with 79% sensitivity and 63% specificity. The best performance (87.9% diagnostic accuracy, 89.8% sensitivity, and 82.4% specificity) was with a combination identified using multivariate logistic regression analysis that included PET visual interpretation, educational level, and neuropsychological tests as predictors.
Conclusion:
18F-FDG-PET visual assessment showed high performance for predicting conversion to AD from MCI, particularly in combination with neuropsychological tests. PET scores showed high diagnostic specificity. Structural MRI focused on the medial temporal area showed stable predictive value throughout the 5-year course.
INTRODUCTION
Mild cognitive impairment (MCI) was proposed by Petersen et al. as a summary of decline in a patient’s cognitive function. The definition describes both normal and dementia statuses, including subtypes for the latter [1]. Among these, amnestic-type MCI patients have a high likelihood of progressing to Alzheimer’s disease (AD) at a rate of about 12% to 15% per year [1]. If disease-modifying treatment for AD is developed in the near future, the onset of MCI will be an appropriate stage to begin treatment. Therefore, early diagnosis of MCI is especially important.
Fluorine-18-fluorodeoxyglucose positron emission tomography (18F-FDG-PET) and structural magnetic resonance imaging (MRI) have been defined as biomarkers for tau-mediated neural injury according to the revised criteria proposed by the National Institute of Aging and Alzheimer’s Association (NIA-AA) and the International Working Group [2]. In particular, early diagnosis at the MCI stage with 18F-FDG-PET is thought to be able to predict conversion from MCI to AD by recognizing AD-like hypometabolism in the parietotemporal cortex, posterior cingulate, and precuneus. In previous reports, predicting the conversion from MCI to AD has been highly accurate (80% or greater [3–5]). However, the follow-up periods used were not uniform and relatively short (1- or 2-years).
The Study on Diagnosis of Early Alzheimer’s Disease-Japan (SEAD-J) was a prospective multicenter study targeting amnestic MCI in Japan. This report contained the results of 3 years of observation [6]. According to this cohort study, visual assessment of 18F-FDG-PET images had a high sensitivity for detection of AD converters, but their specificity was relatively low. The study showed that some nonconverters demonstrated AD-like hypometabolism on baseline images. These false-positive cases could not be correctly interpreted until the end of the 3-year follow-up. Semi quantitative analysis using a PET score was efficient at identifying rapid converters during the 2-year follow-up, although there was also uncertainty about longer-term diagnostic power. Volumetric MRI failed to distinguish AD converters from nonconverters until the 3-year follow-up. Therefore, to clarify the predictive ability of 18F-FDG-PET and volumetric MRI, including the combination with neuropsychological tests, we extended the follow-up period for those patients with MCI recruited in the SEAD-J study termed SEAD-J-Extension.
MATERIALS AND METHODS
SEAD-J participants
The data set of SEAD-J was collated from nine institutions across Japan [6]. Patients with amnestic MCI were followed up annually for 5 years. A total of 114 patients (64 women and 50 men, mean age, 70.8±7.5 years) were enrolled in the study. This study was approved by the ethics committees of all participating institutions. Each patient signed an informed consent form after receiving full explanations of the procedures involved.
All patients were initially assessed with a series of neuropsychological tests, including the Mini-Mental State Examination (MMSE), the Alzheimer’s Disease Assessment Scale-cognitive component-Japanese version (ADAS-J cog), the Clinical Dementia Rating (CDR), the Geriatric Depression Scale (GDS), the Everyday Memory Check List (EMCL), and the Logical Memory Subset of the Wechsler Memory Scale Revised (WMS-R LM). In accordance with the inclusion criteria, patients with MCI were between 50 and 80 years of age, with an MMSE score ≥24, a GDS score ≤10, a WMS-R LM I score ≤13, a WMS-R LM II part A and part B score ≤8 (maximum = 50), and a CDR memory box score equal to 0.5. Patients with less than 6 years of formal education were excluded.
18F-FDG-PET
18F-FDG-PET scans were performed with the patient in a resting state, 40 to 60 min after venous injection of 18F-FDG (254±107 MBq). A static scan was performed for 10±5 min, either in 2D or 3D mode. Attenuation was corrected using either a transmission scan with segmentation for dedicated PET, and by a computed tomography (CT) scan for PET/CT.
The 18F-FDG-PET images were processed to produce 3-dimensional stereotactic surface projections (3D-SSP) and generate z-score maps, using iSSP (version 3.5, Nihon Medi-Physics, Tokyo, Japan). 3D-SSP was created with the Neurological Statistical Image Analysis Software (NEUROSTAT) developed by Minoshima et al. [7]. NEUROSTAT anatomically normalizes the individual PET data to the standard brain and compares the regional voxel data with the normal database, calculating the z-score ([normal mean _ individual value] / normal SD) for each voxel of the cerebral surface, and displays the sites at which voxel value is statistically reduced. The normal database was constructed from 50 control subjects (31 men and 19 women, mean age 57.6 years), with 10 subjects from each of the 5 participating institutions. All control subjects had no memory complaints and no history of neurologic or psychiatric disorders. The results of their neurologic examinations and brain imaging examinations (MRI or CT) were normal, and their cognitive function was judged to be normal by experienced neurologists (MMSE score,25 to 30).
Interpretation of PET images
Three experts, blinded to clinical information, independently assessed the reconstructed PET images. They correlated the 3D-SSP z-score maps to classify the images into the different dementia patterns according to the criteria of Silverman [8]. In these criteria, the findings of FDG-PET are classified into seven interpretive patterns as positive (P1–P3, P1+) or negative (N1–N3) for presence of a progressive neurodegenerative disease in general and AD specifically, compared with results of longitudinal or neuropathological analysis. In which P1 indicates progressive PET pattern consistent with presence of AD showing hypometabolism in parietal/temporal±frontal cortex, while P1+, P2, and P3 indicate progressive PET pattern but not consistent with AD (P1+, the presence abnormal findings other than P1; P2, frontal predominant hypometabolism; P3, hypometabolism of both caudate and lentiform nuclei). N1-N3 patterns indicate all negative scans, in which N1 represents normal metabolism. When the classification of the 3 raters did not match, the cases were discussed, and a consensus result was agreed upon. They referred to patients MRI images to exclude the partial volume effect due to severe atrophy and cerebral vascular lesion, and space-occupying lesions when a local hypometabolic area was observed with the PET image.
PET score
The AD t-sum was calculated, as described in previous publications [9, 10], by using the PALZ module in the PMOD software package (version 3.2, PMOD Technologies, Zurich, Switzerland). The AD t-sum indicates the severity of the metabolic decrease in those brain areas that are typically affected by AD (multimodal association cortices mostly located in the temporal and parietal lobes) and includes adjustment for age effects.
In this study, the AD t-sums were converted into a PET score dividing them by a previously determined upper normality limit and applying a log transformation to convert them into normally distributed values, according to the following formula [11]: PET score = log2 [(AD t-sum / 11,089) + 1].
MRI
All subjects were scanned with either a 1.5 T or 3T MRI system. T1-weighted 3-dimensional sagittal scans of the brain were acquired using a T1-weighted fast field echo sequence. Images were analyzed using the voxel-based specific regional analysis system for AD (VSRAD® advance, Eisai, Tokyo, Japan), developed based on voxel-based morphometry (VBM) [12–14]. We used the latest version of VSRAD running VBM analysis on the basis of SPM8 plus diffeomorphic anatomical registration using exponentiated Lie algebra (DARTEL). This application automatically analyzed the 3D data as a series of anatomical standardizations, segmentations, and smoothings using these algorithms. Then each processed segmented image was compared to the mean and SD values of the gray matter or white matter images of healthy subjects using voxel-by-voxelz-score analysis. The database for the healthy controls of this software contained data from 40 men and 40 women aged between 54 and 86 years (mean age, 70.2±7.3). In this study, the average z-score in the target volume of interest (VOI) for medial temporal structures, including the entorhinal cortex, head to tail of the hippocampus, and amygdala, was used for further analyses.
Follow-up
Patients were assessed at 1-year intervals for5 years. The CDR, MMSE, EMCL, and WMS-R-LM tests were re-administered at each visit. Repeat 18F-FDG-PET and MRI scans were optional. Conversion to dementia was established when CDR became ≥1.0. No further follow-up of patients reaching CDR ≥1.0 was performed. AD was diagnosed when a patient fulfilled both CDR ≥1.0 and the National Institute of Neurological and Communicative Disorders–Alzheimer’s Disease and Related Disorders Association’s (NINCDS-ADRDA) “probable AD” criteria. The diagnosis of other diseases was based on established clinical criteria, including vascular dementia (VaD) [15], dementia with Lewy bodies (DLB) [16], and frontotemporal dementia(FTD) [17]. Two researchers of the SEAD-J group, blinded to the PET results, established the final clinical outcome of each patient based on the submitted case reports.
Logistic regression analyses
Multivariate logistic regression analyses were used to assess whether baseline 18F-FDG-PET, MRI, and/or neuropsychological tests were predictive of longitudinal clinical outcome. We estimated the odds of AD conversion versus nonconversion as a function of age, sex, educational level, WMS-R-LM I, WMS-R-LM II, MMSE, ADAS-J cog, GDS, PET score, PET visual interpretation, and VSRAD z-score (average, left, and right). Results were considered significant at p < 0.05. Statistical analyses were performed with SPSS (version 22.0; SPSS, Chicago, IL, USA).
RESULTS
Baseline characteristics
Of 114 patients, 42 dropped out from the study without a complete 5-years follow-up. Of the remaining 72 patients, 53 progressed to dementia, 49 developed AD, and four developed non-AD dementia (two patients with FTD, one with DLB, and one with VaD) (Fig. 1). Among the 49 AD converters, 41 (83.7%) converted within the first 3 years, and 4 patients (8.2%) converted in the fourth year and another 4 patients converted in the fifth year. The cumulative conversion rate over the 5 years was 72%.
Fig.1
Schematic summary of clinical outcomes in all patients with mild cognitive impairment (MCI). Originally, 114 patients with MCI were included. Forty-two patients dropped out during the 5 year. Our final sample size for the analyses was 68 patients (excluding 4 patients who converted to other types of dementia).
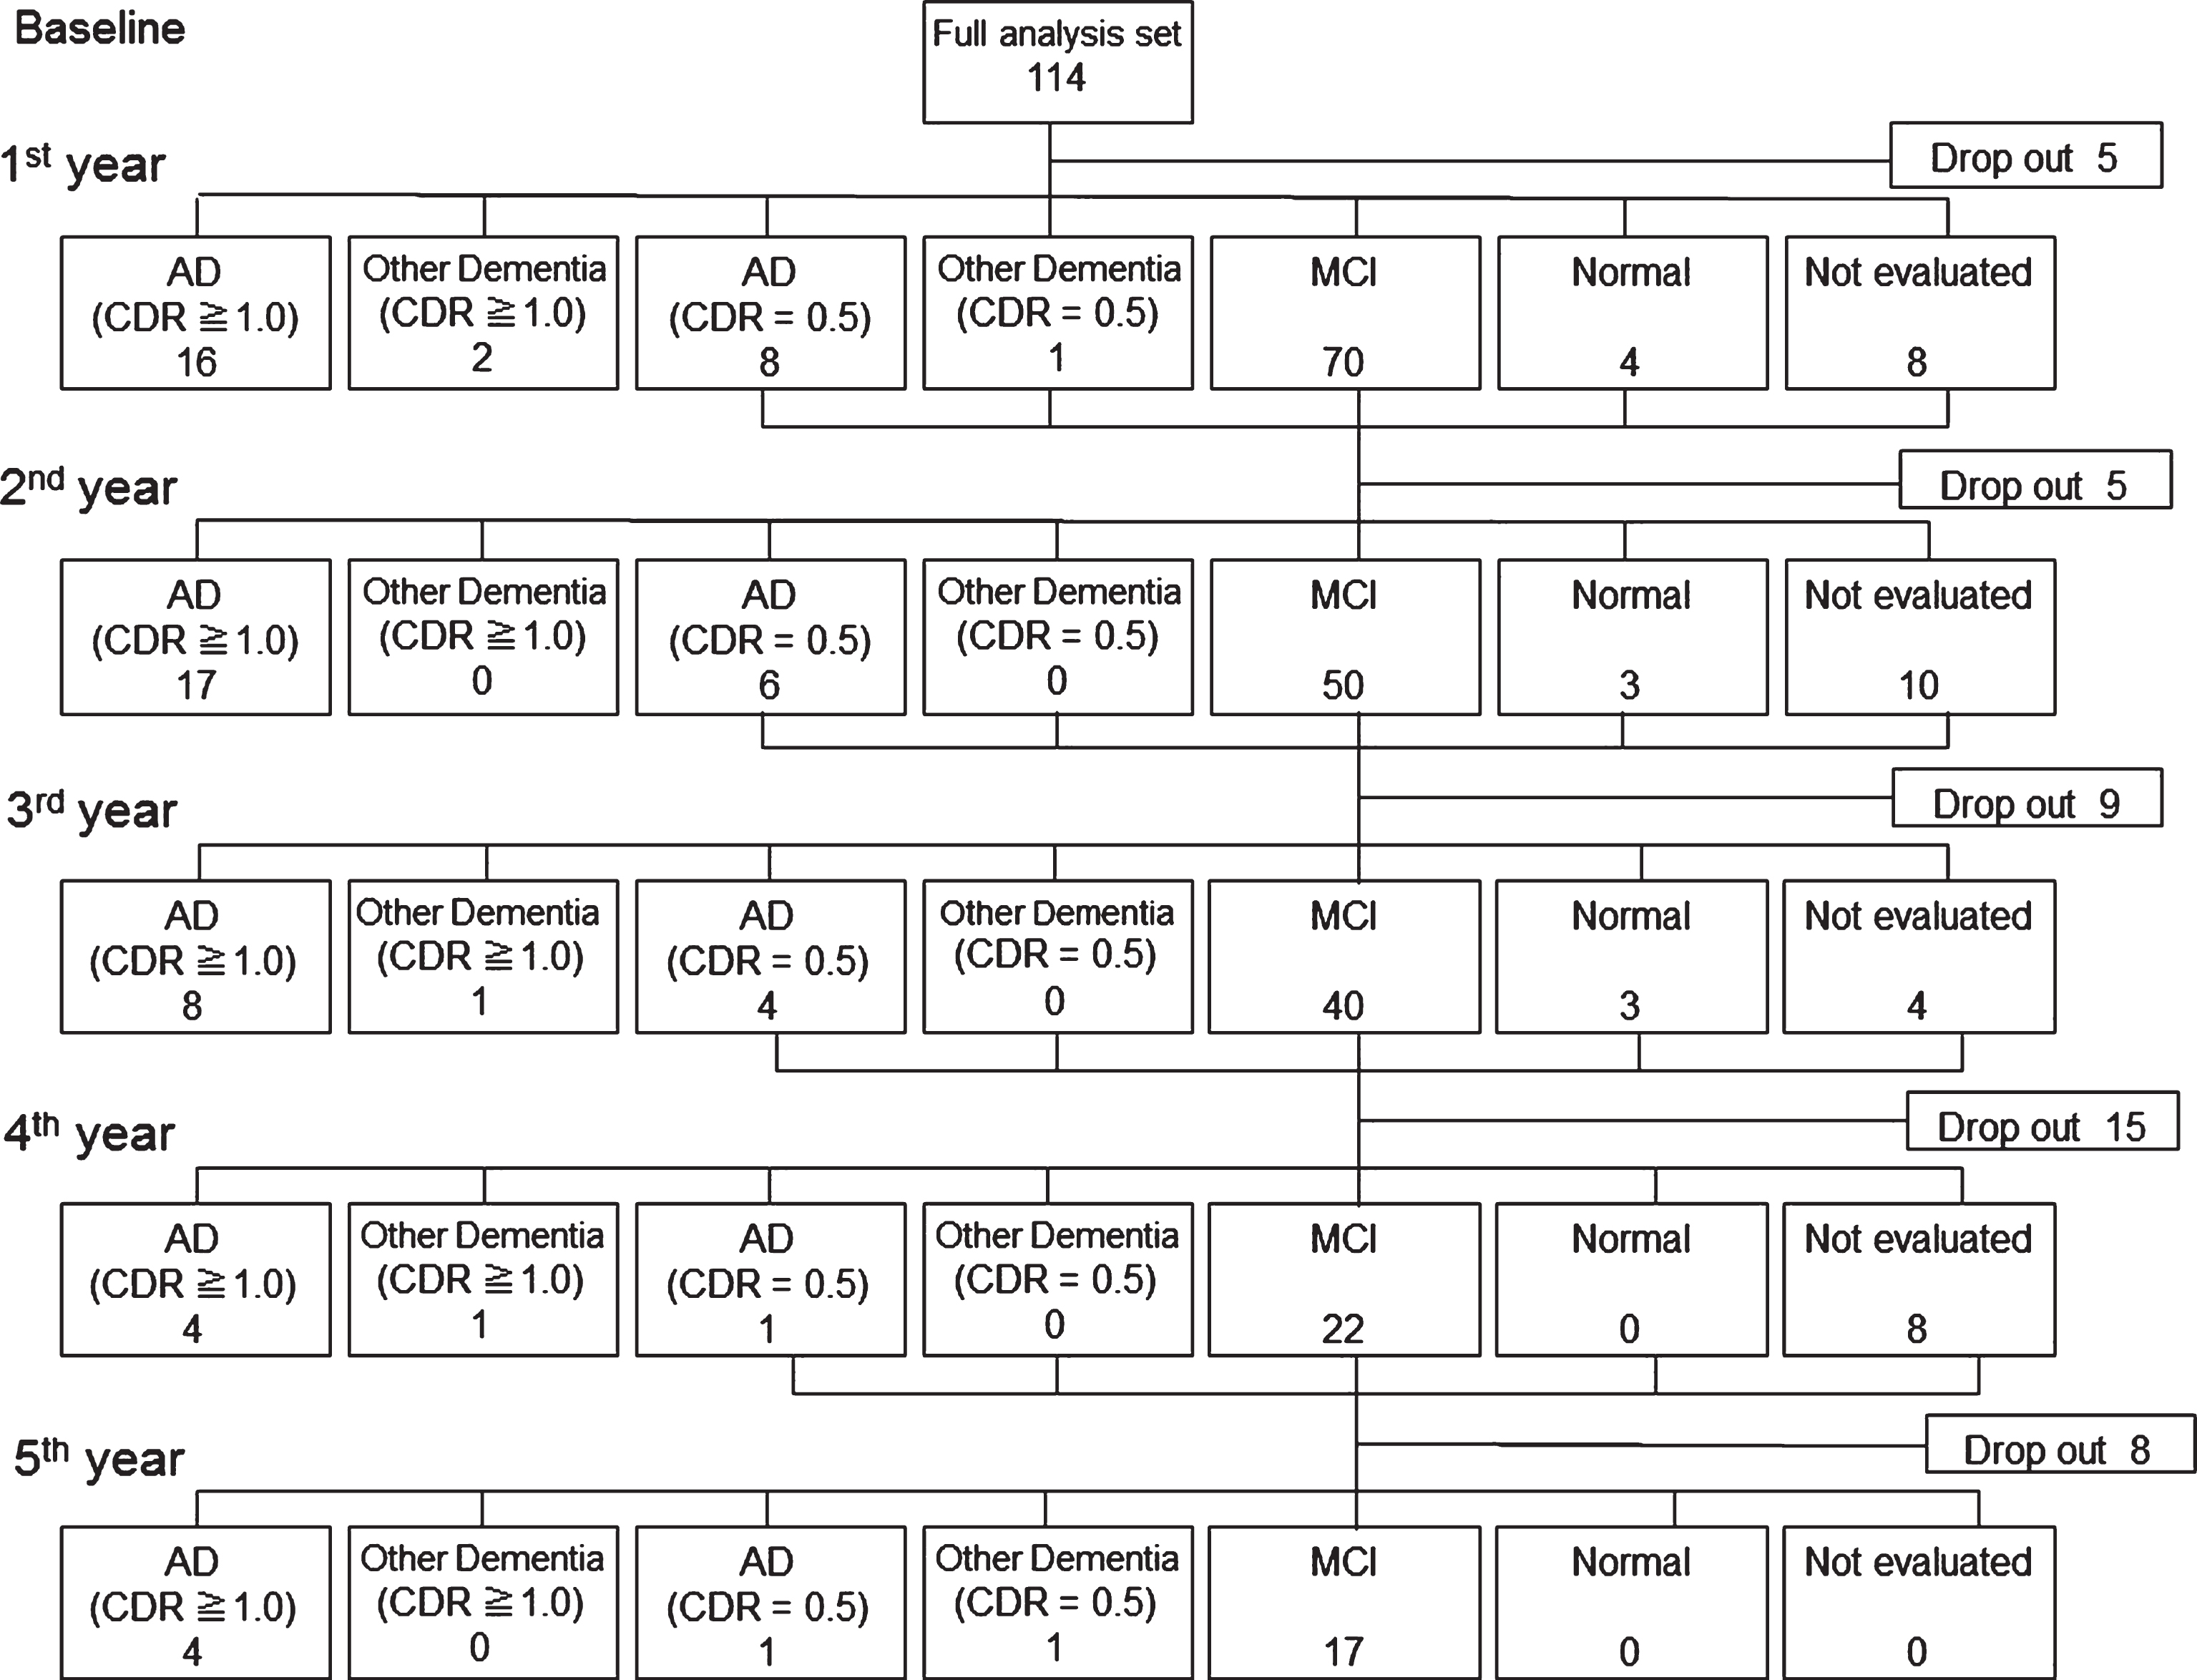
Table 1 shows the demographic and neuropsychological data from the initial visit of patients who progressed to AD (AD converters) and those who did not (nonconverters). At baseline, the two groups differed in WMS-R-LM, MMSE, ADAS-J cog, and GDS scores. There were no differences in age, educational level, or sex distribution between these two groups.
Table 1
Demographic and neuropsychological data at baseline
| AD converter | Non-converter | |
| (n = 49) | (n = 19) | |
| Mean (SD) | Mean (SD) | |
| Age | 71.6 (6.2) | 71.1 (6.6) |
| Education (y) | 11.9 (3.2) | 12.1 (3.3) |
| WMS-R-LM I** | 6.6 (3.3) | 10.5 (2.5) |
| WMS-R-LM II** | 1.7 (2.2) | 5.2 (3.0) |
| MMSE* | 25.6 (1.7) | 27.3 (2.2) |
| ADAS* | 10.5 (5.4) | 6.6 (3.3) |
| GDS* | 4.6 (2.3) | 2.9 (1.8) |
WMS-R-LM, Wechsler Memory Scale-Revised Logical Memory; MMSE, Mini-Mental State Examination; ADAS, Alzheimer’s Disease Assessment Scale; GDS, Geriatric Depression Scale. *p < 0.01, **p < 0.0001.
Interpretation of PET images
P1 and P1+ patterns were observed in 70.2% and 7.9%, respectively, of all amnestic patients with MCI at baseline. The remaining 21.9% patients presented other patterns, including the P2 in 4.4% cases. In this study, all P1+ patients showed a P1 pattern with occipital hypometabolism. Therefore, P1 and P1+ patterns were combined as an AD/ DLB pattern for the purpose of calculating diagnostic performance, as per a previous report [6].
The visual interpretation of PET images predicted conversion to AD during the 5-year follow-up with an overall diagnostic accuracy of 82%, a sensitivity of 94%, and a specificity of 53% for the 68 patients in this study. The diagnostic parameters for each follow-up interval are summarized in Table 2.
Table 2
Diagnostic performance at each annual visit for five years
| Variable | Follow-up | AUC (95% CI) | Cutoff | SEN | SPE | ACC | PPV | NPV |
| intervals (y) | ||||||||
| PET visual interpretation | 1 | – | – | 1 | 0.22 | 0.35 | 0.21 | 1 |
| 2 | – | – | 0.97 | 0.32 | 0.56 | 0.45 | 0.95 | |
| 3 | – | – | 0.98 | 0.41 | 0.68 | 0.6 | 0.95 | |
| 4 | – | – | 0.96 | 0.44 | 0.78 | 0.77 | 0.83 | |
| 5 | – | – | 0.94 | 0.53 | 0.82 | 0.84 | 0.77 | |
| PET score | 1 | 0.708 (0.569–0.846) | 1.03 | 0.69 | 0.75 | 0.74 | 0.34 | 0.93 |
| 2 | 0.809 (0.714–0.905) | 1.03 | 0.7 | 0.9 | 0.83 | 0.79 | 0.84 | |
| 3 | 0.747 (0.641–0.852) | 1.03 | 0.61 | 0.91 | 0.77 | 0.86 | 0.73 | |
| 4 | 0.795 (0.689–0.901) | 1.02 | 0.58 | 0.96 | 0.69 | 0.96 | 0.52 | |
| 5 | 0.712 (0.570–0.854) | 1.03 | 0.53 | 0.84 | 0.6 | 0.89 | 0.4 | |
| VSRAD z-score | 1 | 0.679 (0.533–0.825) | 1.47 | 0.75 | 0.57 | 0.6 | 0.26 | 0.92 |
| 2 | 0.684 (0.570–0.799) | 1.44 | 0.69 | 0.64 | 0.66 | 0.51 | 0.79 | |
| 3 | 0.658 (0.543–0.774) | 1.44 | 0.64 | 0.64 | 0.64 | 0.6 | 0.68 | |
| 4 | 0.714 (0.575–0.852) | 1.44 | 0.65 | 0.74 | 0.67 | 0.82 | 0.52 | |
| 5 | 0.735 (0.593–0.877) | 1.21 | 0.79 | 0.63 | 0.73 | 0.84 | 0.52 | |
| WMS-R LM I | 1 | 0.799 (0.656–0.941) | 6 | 0.81 | 0.81 | 0.81 | 0.57 | 0.93 |
| 2 | 0.782 (0.671–0.893) | 7 | 0.7 | 0.8 | 0.75 | 0.77 | 0.74 | |
| 3 | 0.800 (0.693–0.908) | 8 | 0.73 | 0.82 | 0.77 | 0.86 | 0.67 | |
| 4 | 0.809 (0.703–0.915) | 8 | 0.71 | 0.87 | 0.77 | 0.91 | 0.61 | |
| 5 | 0.839 (0.733–0.946) | 8 | 0.67 | 0.9 | 0.74 | 0.94 | 0.52 | |
| WMS-R LM II | 1 | 0.763 (0.643–0.882) | 1 | 0.81 | 0.62 | 0.66 | 0.39 | 0.91 |
| 2 | 0.722 (0.601–0.843) | 4 | 0.91 | 0.46 | 0.68 | 0.61 | 0.84 | |
| 3 | 0.732 (0.605–0.858) | 4 | 0.88 | 0.52 | 0.74 | 0.74 | 0.74 | |
| 4 | 0.746 (0.615–0.878) | 4 | 0.87 | 0.57 | 0.77 | 0.8 | 0.68 | |
| 5 | 0.806 (0.671–0.940) | 4 | 0.88 | 0.68 | 0.82 | 0.88 | 0.68 | |
| MMSE | 1 | 0.671 (0.536–0.805) | 27 | 0.94 | 0.35 | 0.52 | 0.31 | 0.95 |
| 2 | 0.663 (0.532–0.793) | 27 | 0.91 | 0.46 | 0.68 | 0.61 | 0.84 | |
| 3 | 0.674 (0.538–0.810) | 27 | 0.85 | 0.48 | 0.71 | 0.71 | 0.68 | |
| 4 | 0.677 (0.528–0.825) | 27 | 0.84 | 0.52 | 0.74 | 0.78 | 0.63 | |
| 5 | 0.722 (0.570–0.875) | 27 | 0.84 | 0.58 | 0.77 | 0.84 | 0.58 | |
| ADAS-J Cog | 1 | 0.770 (0.637–0.903) | 9.6 | 0.75 | 0.75 | 0.75 | 0.48 | 0.91 |
| 2 | 0.665 (0.535–0.794) | 8.8 | 0.58 | 0.71 | 0.65 | 0.66 | 0.64 | |
| 3 | 0.7 (0.572–0.827) | 8.8 | 0.56 | 0.78 | 0.65 | 0.79 | 0.54 | |
| 4 | 0.721 (0.596–0.846) | 7.1 | 0.71 | 0.61 | 0.68 | 0.78 | 0.52 | |
| 5 | 0.715 (0.580–0.851) | 7.1 | 0.69 | 0.63 | 0.68 | 0.83 | 0.44 | |
| GDS | 1 | 0.668 (0.535–0.801) | 3 | 0.81 | 0.48 | 0.56 | 0.33 | 0.89 |
| 2 | 0.729 (0.606–0.852) | 3 | 0.79 | 0.6 | 0.69 | 0.65 | 0.75 | |
| 3 | 0.748 (0.630–0.866) | 4 | 0.54 | 0.85 | 0.66 | 0.85 | 0.55 | |
| 4 | 0.684 (0.553–0.814) | 4 | 0.49 | 0.83 | 0.6 | 0.85 | 0.45 | |
| 5 | 0.715 (0.586–0.845) | 2 | 0.82 | 0.53 | 0.74 | 0.82 | 0.53 |
AUC, area under the curve; SEN, sensitivity; SPE, specificity; ACC, accuracy; PPV, positive predictive value; NPV, negative predictive value.
PET score
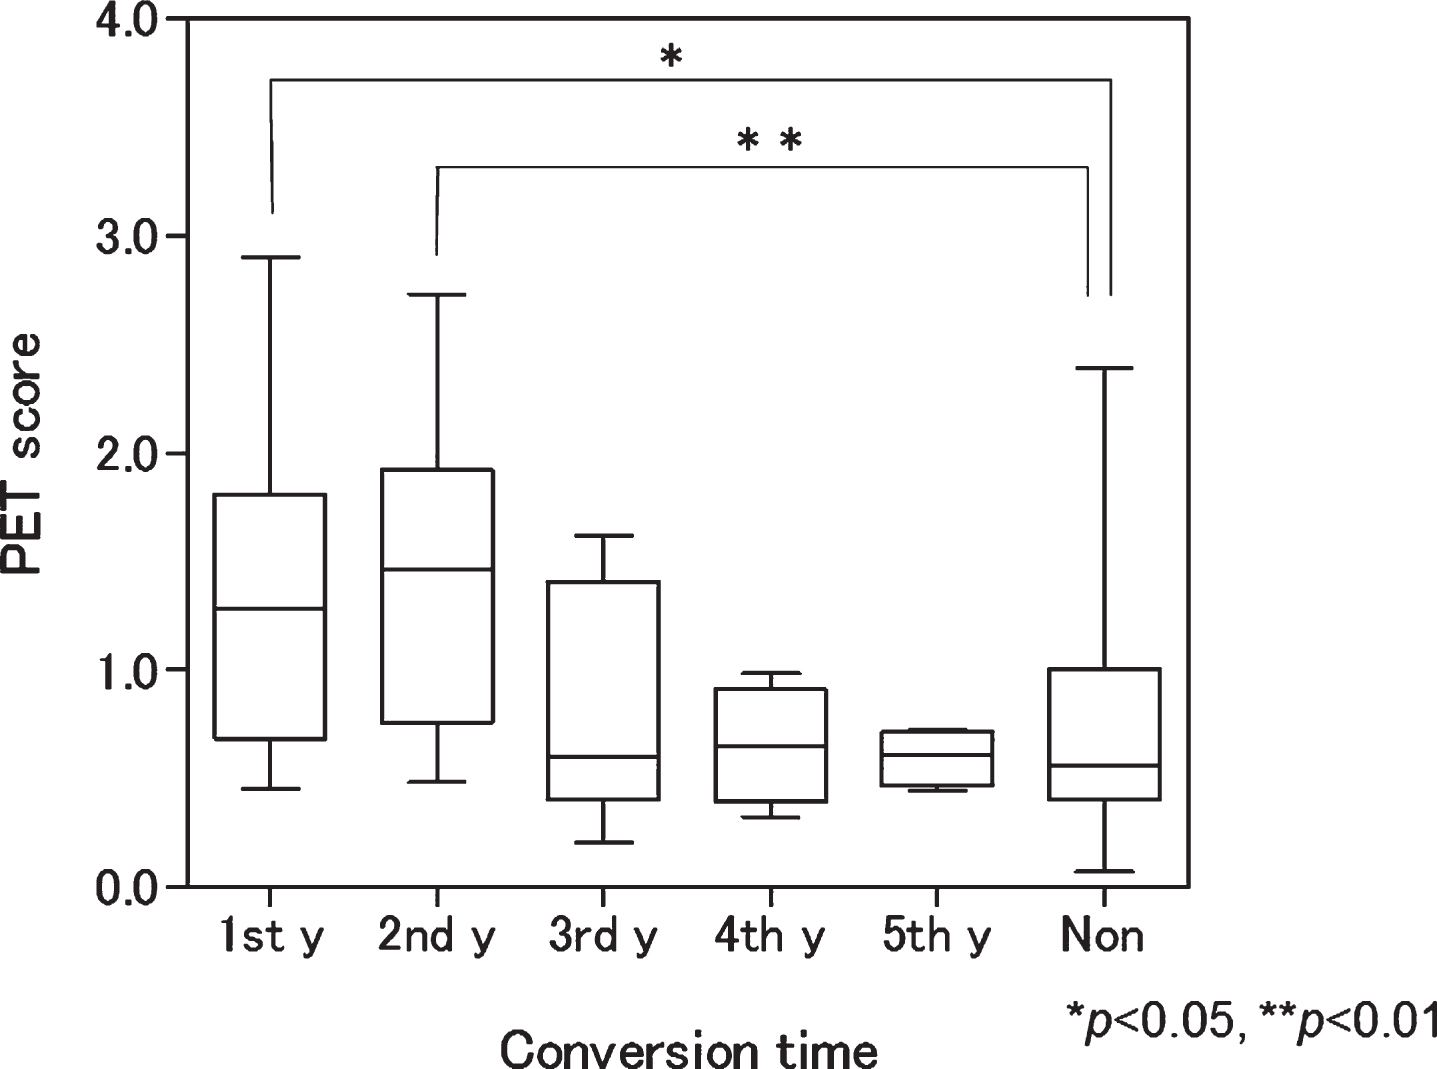
The mean PET score of the AD converters (1.16±0.67) was significantly higher than that of nonconverters (0.73±0.60) at baseline (p = 0.02). When mean PET scores were calculated according to conversion time, those who converted during the first and second years of the study had significantly higher PET scores than nonconverters. In contrast, those who converted in the third, fourth, and fifth years had no significant differences in mean PET score when compared with nonconverters (Fig. 2).
Fig.2
Box plot of baseline positron emission tomography (PET) scores according to conversion time. Patients with mild cognitive impairment progressing to Alzheimer’s disease in the first and second years had significantly higher scores than nonconverters (p < 0.05 and <0.01, respectively). 1st y, first year converter; 2nd y, second year converter; 3rd y, third year converter; 4th y, fourth year converter; 5th y, fifth year converter; Non, nonconverter.
The area under the curve of the receiver operating characteristic (ROC) analysis for the PET score was highest for the 2-year follow-up. The ROC-derived PET score thresholds obtained with the use of the Youden index [18] yielded an adjusted accuracy of 83%, with 70% sensitivity and 90% specificity at a threshold value of PET score = 1.03 at the second-year follow-up point. At the fifth-year observation, the accuracy was 60% with 53% sensitivity and 84% specificity. The diagnostic parameters for each follow-up interval are summarized in Table 2.
MRI
Within the MRI cohort, 6 patients were excluded from further analysis. Four patients at one particular institution were examined with a 3T MRI system, and 2 patients who converted did not undergo an initial MRI examination at their first visit.
For the AD converters and nonconverters, the bilateral mean z-scores in the target VOI for the medial temporal structures at baseline were 1.80±0.71 and 1.27±0.72, respectively (p = 0.01); the right side mean z-scores were 1.75±0.86 and 1.37±0.78, respectively (p = 0.10); and the left side mean z-scores were 1.80±0.86 and 1.03±0.75, respectively (p = 0.001). Therefore, the mean z-score in the target VOI of AD converters was significantly higher than that of nonconverters for the left medial temporal structures.
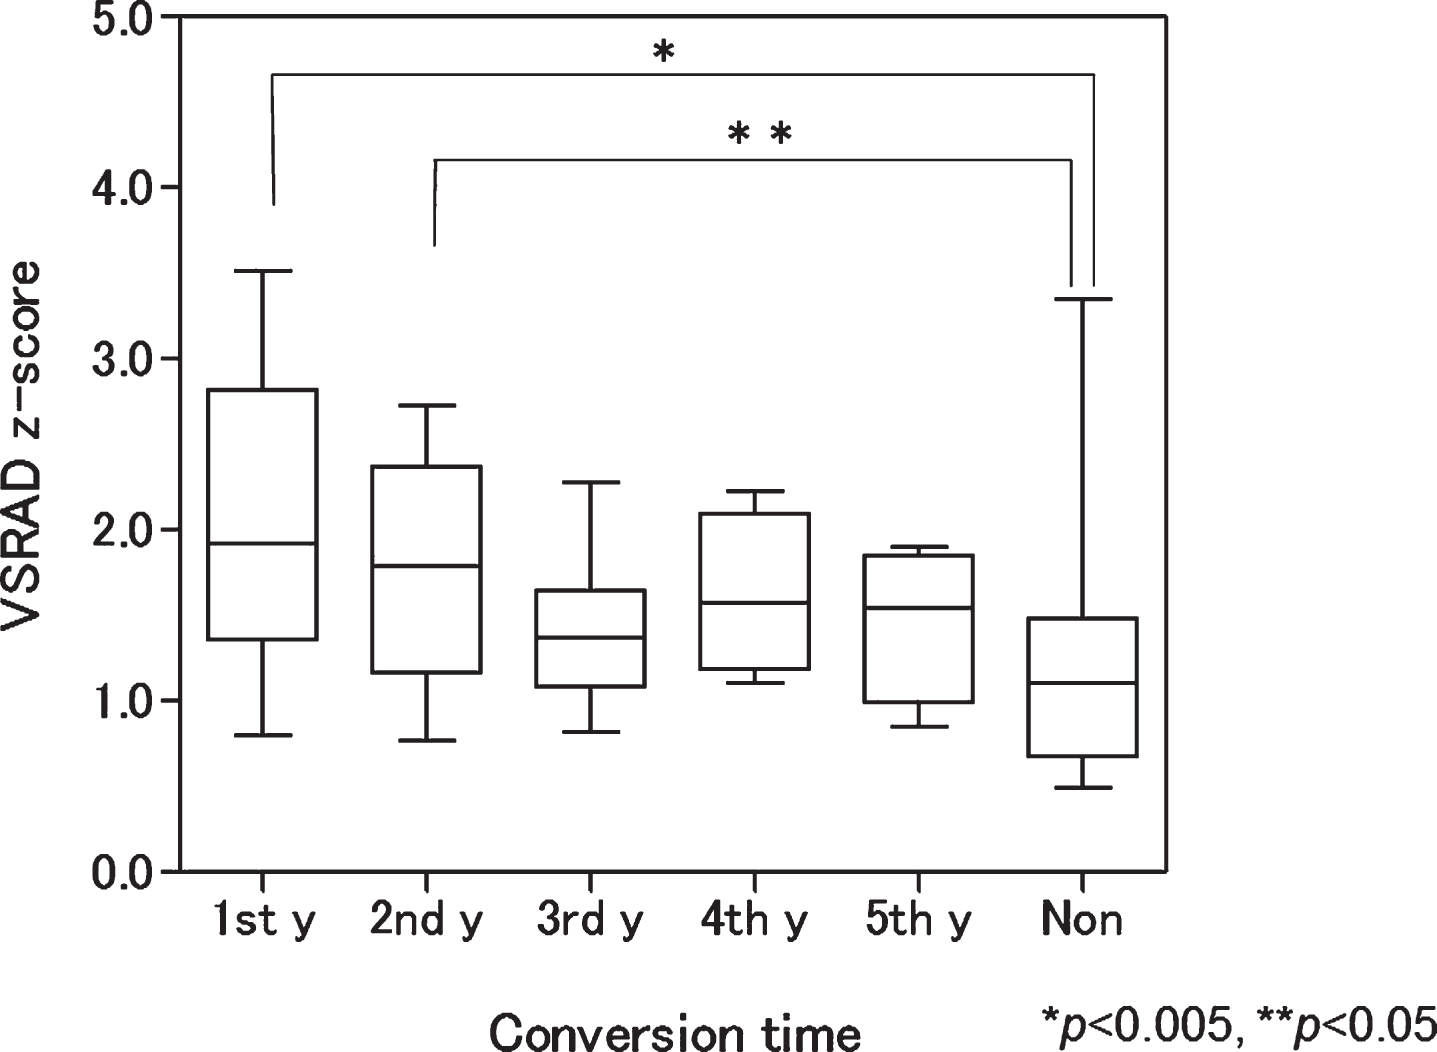
When the mean VSRAD z-scores were calculated according to conversion time, patients who converted in the first and second years had significantly higher z-scores than nonconverters (p = 0.004 and 0.016, respectively). In contrast, those who converted in the third, fourth, and fifth years had no differences in mean z-scores compared with nonconverters (Fig. 3).
Fig.3
Box plot of baseline voxel-based specific regional analysis system for Alzheimer’s disease (VSRAD) z-scores according to conversion time. Patients with mild cognitive impairment progressing to Alzheimer’s disease in the first and second years had significantly higher scores than nonconverters (p < 0.005 and <0.05, respectively). 1st y, first year converter; 2nd y, second year converter; 3rd y, third year converter; 4th y, fourth year converter; 5th y, fifth year converter; Non, nonconverter.
The area under the curve of the ROC analysis for the mean VSRAD z-scores was highest for the 5-year follow-up (Table 2). The ROC-derived thresholds using the Youden index for mean z-score yielded an adjusted accuracy of 73%, with 79% sensitivity and 63% specificity at a threshold value of z-score = 1.21 during the 5-year follow-up. The accuracy of VBM analysis presented little fluctuation through 5 years. When examining the left medial temporal structures only, the following results were obtained: accuracy; 76%, sensitivity; 77%, specificity; 68% (cut off; 1.14).
Neuropsychological tests
The diagnostic performance for neuropsychological batteries in each interval period are summarized in Table 2. Diagnosis sensitivity of WMS-R LM II and MMSE showed a high tendency, whereas the specificity of WMS-R LM I indicated a high tendency.
Logistic regression analysis
Multivariate logistic regression analysis identified educational level, WMS-R-LM II, ADAS-J cog, GDS, and PET visual interpretation as predictors distinguishing AD converters from nonconverters over 5 years (Table 3). When age, sex, educational level, WMS-R-LM I, WMS-R-LM II, MMSE, ADAS-J cog, GDS, PET score, PET visual interpretation, and VSRAD z-score were included in the stepwise procedure, AD conversion was significantly associated with educational level (p = 0.065; odds ratio, 1.34; 95% CI, 0.98–1.83), WMS-R-LM II (p = 0.003; odds ratio, 0.61; 95% CI, 0.44–0.85), ADAS-J cog (p = 0.104; odds ratio, 1.21; 95% CI, 0.96–1.52), GDS (p = 0.037; odds ratio, 1.65; 95% CI, 1.03–2.65), and PET visual interpretation (p = 0.026; odds ratio, 13.64; 95% CI, 1.36–136.52). The combination of PET visual interpretation, educational level, and these neuropsychological tests (WMS-R-LM II, ADAS-J cog, GDS) distinguished AD converters from non-converters with 87.9% accuracy, 89.8% sensitivity, and 82.4% specificity.
DISCUSSION
This multicenter study assessed the predictive value of 18F-FDG-PET and volumetric MRI for MCI to AD conversion during a 5-year follow up period. Forty-nine of 68 patients (72%) with MCI proceeded to AD, with an annual conversion rate of 14.4% (within previously reported ranges [1]).
In the PET visual assessment, 94% of AD converters had a P1 or P1+ pattern and only one converter (2.0%) showed a P2 pattern at baseline. This result indicates that the possibility of conversion to AD from MCI might be low in patients with no hypometabolism suggesting AD/DLB pattern. The specificity of visual assessment was low during the 5 years, due to high false positive rates. About half of nonconverters showed AD/DLB-like hypometabolism at baseline. However, the specificity and accuracy increased gradually during the 5 years, since 32.7% of patients converted after the third year.
Table 3
Results of multivariate logistic regression analyses for predictors of AD conversion
| Variable | Coefficient (B) | SE | Walt | df | p value | Odds ratios | 95% CI | |
| Education level | 0.294 | 0.159 | 3.41 | 1 | 0.065 | 1.342 | 0.982 | 1.833 |
| WMS-R-LM II | –0.493 | 0.166 | 8.83 | 1 | 0.003 | 0.611 | 0.441 | 0.846 |
| ADAS-J cog | 0.191 | 0.118 | 2.647 | 1 | 0.104 | 1.211 | 0.962 | 1.524 |
| GDS | 0.502 | 0.24 | 4.359 | 1 | 0.037 | 1.652 | 1.031 | 2.646 |
| PET visual interpretation | 2.613 | 1.175 | 4.945 | 1 | 0.026 | 13.643 | 1.363 | 136.518 |
| Constant | –6.473 | 2.765 | 5.48 | 1 | 0.019 | 0.002 | ||
df, degree of freedom; CI, confidence Interval; WMS-R-LM, Wechsler Memory Scale-Revised Logical Memory; ADAS-J cog, Alzheimer’s Disease Assessment Scale-cognitive component-Japanese version; GDS, Geriatric Depression Scale.
These results suggest it may be possible to predict AD conversion at the MCI stage by visual interpretation of AD/DLB-like hypometabolism, even if the patient is a slow converter. Although the specificity prediction of the conversion from MCI to AD using 18F-FDG-PET in previous reports is varied, our results are in agreement with studies that reported relatively low specificity [19, 20]. This trend is also similar to that seen in a previous multicenter study using brain single-photon emission computed tomography targeting amnestic patients with MCI [21]. However, several previous reports presented high specificity of 18F-FDG-PET [3–5, 22]. We hypothesize that these studies may have included a high proportion of rapid converters or patients with MCI who were close to progressing to AD, since average ages were lower than those in our study. The conversion rates were also higher than in our study despite using shorter observation periods. Therefore, these discrepancies in specificity may be dependent on differences in the characteristics of the registered MCI groups, follow-up periods, and/or PET image analysis methodology.
Eight false-positive cases in the third year were verified as AD converters. However, nine MCI patients who showed AD-like hypometabolism at baseline did not progress to AD, even after 5 years of follow-up. Although the interpretation of these false-positive cases is still unclear, we assume that these patients might be very slow converters who would convert in the next few years, since MCI patients may possibly take more than 5 years before converting to dementia [23]. Another possibility is that they had some abnormalities in neurodegenerative biomarkers similar to those in a group termed SNAP (suspected non-AD pathology) in individuals who are clinically normal for their age or MCI with normal levels of amyloid-β biomarkers [24]. It would be necessary to follow these patients for longer to determine the reason for these outliers.
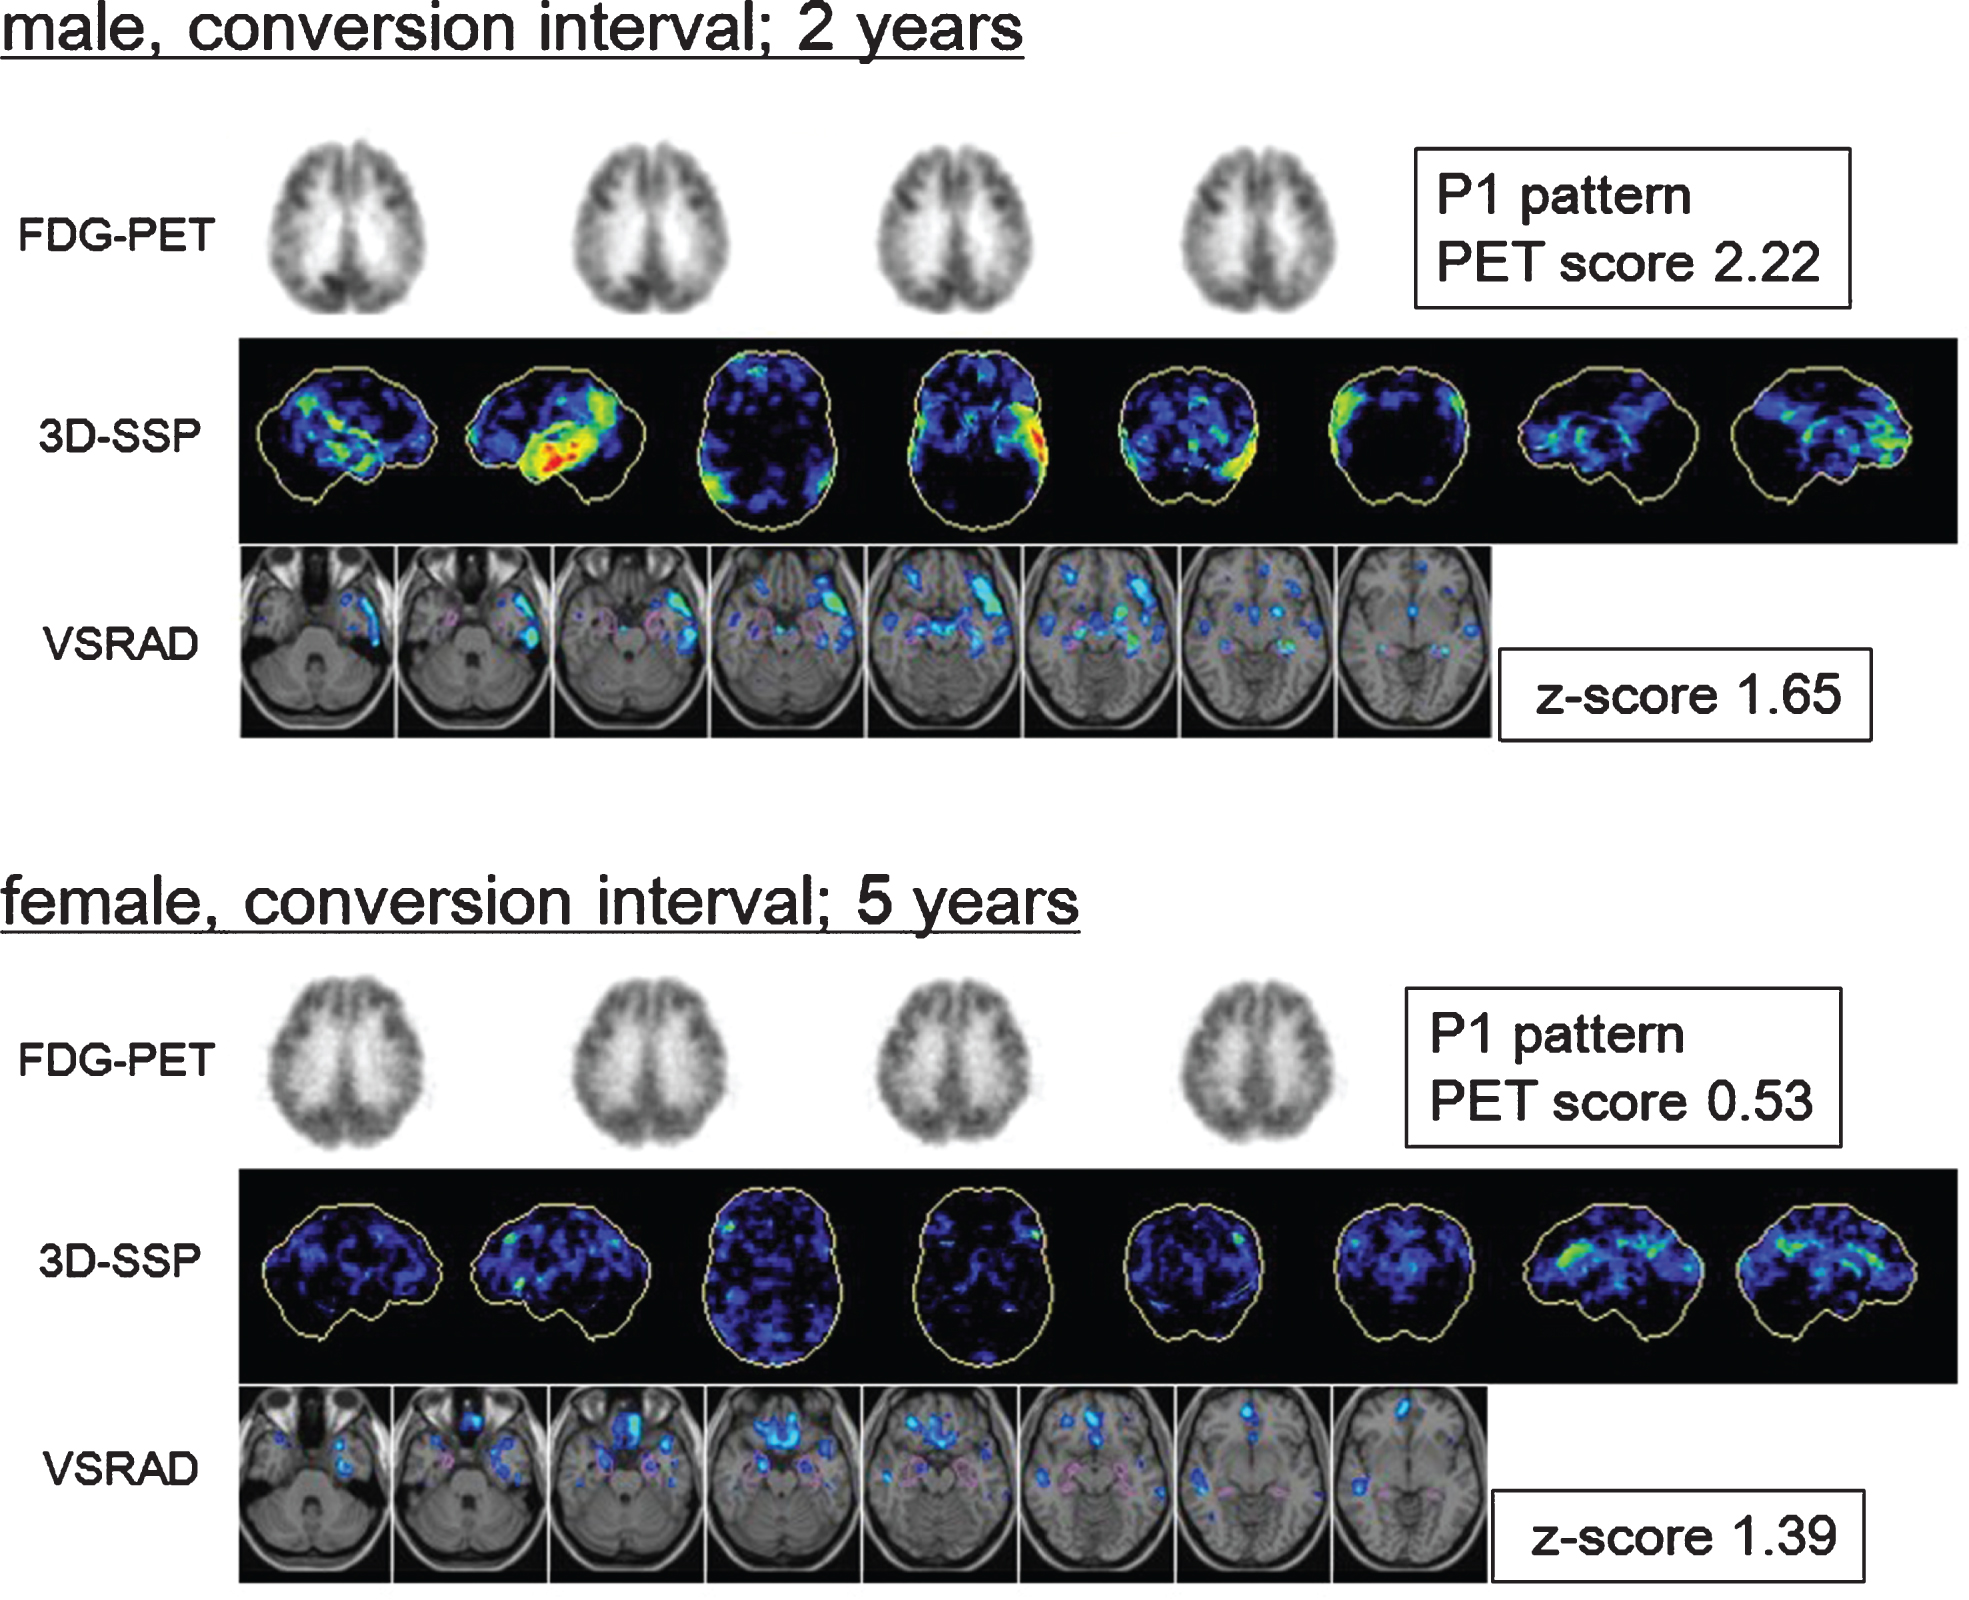
PET scores in patients who converted within2 years were significantly higher than those of nonconverters and had the highest diagnostic accuracy for identifying converters. This trend has not changed at the 3-year follow-up. PET scores in converters which only progressed to AD after the third year were almost equal to those of nonconverters. These results indicate that the PET score makes it possible to discriminate rapid converters among patients with MCI. Actually, patients that converted within 2 years exhibited higher PET scores and clearer AD-like hypometabolic findings on baseline images, while slow converters showed mild AD-like pattern, but the PET score rarely exceeded the threshold. In other words, even if the PET score indicated negative without exceeding threshold, the case could be judged with positive on visual assessment when it presents slight AD pattern. On the other hand, high PET score with exceeding threshold reflects the severity of the metabolic decrease in the brain areas that are typically affected by AD. That was a reason why the visual interpretation showed high sensitivity and the PET score showed high specificity (representative images of both a rapid and a slow converter are shown in Fig. 4). This trend is in accordance to the results of a recent multicenter study in Europe, in which the subjects were followed up for an average of 2.8 years [22]. Therefore, while it is insufficient to use only the PET score for the long-term prediction of AD conversion, its combination with the visual interpretation of PET images would improve diagnostic accuracy.
Fig.4
Fluorine-18-fluorodeoxyglucose positron emission tomography (18F-FDG-PET) transaxial images, 3-dimensional stereotactic surface projections (3D-SSP), and voxel-based specific regional analysis system for Alzheimer’s disease (VSRAD) images of patients with mild cognitive impairment (MCI) converted to Alzheimer’s disease (AD). Top: Baseline images of a male patient with MCI who converted during the second year. The 3D-SSP images show hypometabolism in the parietotemporal association cortex, posterior cingulate, and precuneus, mainly on the left side (visual assessment; P1 pattern, PET score = 2.22). The VSRAD images show atrophy in the bilateral temporal lobe including the volume of interest (VOI) placed on the medial temporal structures (VSRAD z-score = 1.65). Bottom: Baseline images of a patient with MCI who converted in the fifth year. The 3D-SSP images show slight hypometabolism in the parietotemporal association cortex, posterior cingulate, and precuneus (visual assessment; P1 pattern, PET score = 0.53). The VSRAD images show mild atrophy in the target VOI (VSRAD z-score = 1.39). The earlier converter exhibited clearer AD-like changes at baseline than slower converter did.
In ROC analysis, each diagnosis sensitivity of WMS-R LM II and MMSE was high tendency but was inferior to PET visual interpretation throughout the 5-year course, while the specificity of WMS-R LM I indicated was high but was inferior to PET score. The multivariate logistic regression analysis identified PET visual interpretation, educational level, WMS-R-LM II, ADAS-J cog, and GDS as significant predictors of conversion over 5 years. This combination distinguished AD converters from nonconverters with higher accuracy than using PET visual interpretation only. This result is different to the 3-year study in which the PET score was shown to be the most significant predictor [6]. Therefore, when considering longer observation periods, the combination of PET visual assessment and neuropsychological tests could be a valuable biomarker for detection of AD converters.
Although the VBM analysis focusing on the medial temporal region did not result in significant prediction by logistic regression analysis, the VSRAD z-score in patients who converted within 2 years was significantly higher than in nonconverters. This result is consistent with previous reports using VBM [25, 26]. In the present study, we found that the left medial temporal structures showed higher accuracy for conversion than the right side, an asymmetry also in accordance with a past meta-analysis [27].
Comparing 18F-FDG-PET and structural MRI, the ROC analysis revealed that 18F-FDG-PET had a higher predictive power than MRI over 4 years, and this result is in agreement with recent studies using data from The Alzheimer’s Disease Neuroimaging Initiative (ADNI) [20, 28]. However, this may not be true for a longer-term period of observation, since structural MRI showed a higher performance for prediction than semi quantitative analysis with 18F-FDG-PET in the 5-year period, especially when focusing on the left medial temporal lobe. Although the reason for this change over a longer observation period is uncertain, structural MRI showed a sustained accuracy through the 5-year course with little variation in its mean z-score compared to the PET score shown in Table 2. This suggests that structural MRI might have stable predictive value independent of whether the patient is a rapid or a slow converter.
The present study had the following limitations. Firstly, although the diagnosis of AD was carefully determined on the basis of clinical findings, it was not confirmed by amyloid-β biomarkers. Therefore, AD converters in this study might possibly include patients with normal levels of amyloid-β. Secondly, the mean age of the control subjects for the 3D-SSP analysis was lower than that of the patient group. Age-matched controls would be more appropriate for further analysis. Thirdly, although the visual interpretation was assessed using the reconstructed PET images and the 3D-SSP maps basically, we also referred to patients MRI images to exclude the partial volume effect. However, we expect that this method does not influence a pattern classification of PET images. Finally, although we analyzed the PET images and MRI data using the PET score and VSRAD z-score as a semi quantitative index to evaluate metabolic or structural changes, there are other analysis methods that could be applied.
Conclusions
18F-FDG-PET visual assessment was shown to be highly effective in predicting conversion to AD from MCI. In particular, the combination of PET visual interpretation and neuropsychological tests could be a valuable biomarker for conversion detection in patients under longer-term observation. The semi quantitative PET score estimation method could be suitable for detection of rapid converters, but not for slow converters among MCI patients. In addition, structural MRI focusing on the medial temporal area showed a stable predictive value throughout the 5-year study interval.
ACKNOWLEDGMENTS
This work was supported by a Health Labour Sciences Research Grant from the Ministry of Health, Labour, and Welfare of Japan (H17-Tyojyu-023) and the Research Funding for Longevity Sciences from National Center for Geriatrics and Gerontology, Japan (20-1). The authors thank those people who contributed to the patients’ care and to the collection of PET images and clinical reports.
Authors’ disclosures available online (http://j-alz.com/manuscript-disclosures/17-0395r1).
REFERENCES
[1] | Petersen RC ((2004) ) Mild cognitive impairment as a diagnostic entity. J Intern Med 256: , 183–194. |
[2] | Dubois B , Feldman HH , Jacova C , Dekosky ST , Barberger-Gateau P , Cummings J , Delacourte A , Galasko D , Gauthier S , Jicha G , Meguro K , O’Brien J , Pasquier F , Robert P , Rossor M , Salloway S , Stern Y , Visser PJ , Scheltens P ((2007) ) Research criteria for the diagnosis of Alzheimer’s disease: Revising the NINCDS-ADRDA criteria. Lancet Neurol 6: , 734–746. |
[3] | Mosconi L , Perani D , Sorbi S , Herholz K , Nacmias B , Holthoff V , Salmon E , Baron JC , De Cristofaro MT , Padovani A , Borroni B , Franceschi M , Bracco L , Pupi A ((2004) ) MCI conversion to dementia and the APOE genotype: A prediction study with FDG-PET. Neurology 63: , 2332–2340. |
[4] | Drzezga A , Grimmer T , Riemenschneider M , Lautenschlager N , Siebner H , Alexopoulus P , Minoshima S , Schwaiger M , Kurz A ((2005) ) Prediction of individual clinical outcome in MCI by means of genetic assessment and (18)F-FDG PET. J Nucl Med 46: , 1625–1632. |
[5] | Anchisi D , Borroni B , Franceschi M , Kerrouche N , Kalbe E , Beuthien-Beumann B , Cappa S , Lenz O , Ludecke S , Marcone A , Mielke R , Ortelli P , Padovani A , Pelati O , Pupi A , Scarpini E , Weisenbach S , Herholz K , Salmon E , Holthoff V , Sorbi S , Fazio F , Perani D ((2005) ) Heterogeneity of brain glucose metabolism in mild cognitive impairment and clinical progression to Alzheimer disease. Arch Neurol 62: , 1728–1733. |
[6] | Ito K , Fukuyama H , Senda M , Ishii K , Maeda K , Yamamoto Y , Ouchi Y , Ishii K , Okumura A , Fujiwara K , Kato T , Arahata Y , Washimi Y , Mitsuyama Y , Meguro K , Ikeda M SEAD-J Study Group ((2015) ) Prediction of outcomes in mild cognitive impairment by using 18F-FDG-PET: A multicenter study. J Alzheimers Dis 45: , 543–552. |
[7] | Minoshima S , Frey KA , Koeppe RA , Foster NL , Kuhl DE ((1995) ) A diagnostic approach in Alzheimer’s disease using three-dimensional stereotractic surface projections of fluorine-18-FDG PET. J Nucl Med 36: , 1238–1248. |
[8] | Silverman DH , Small GW , Chang CY , Lu CS , Kung De Aburto MA , Chen W , Czernin J , Rapoport SI , Pietrini P , Alexander GE , Schapiro MB , Jagust WJ , Hoffman JM , Welsh-Bohmer KA , Alavi A , Clark CM , Salmon E , de Leon MJ , Mielke R , Cummings JL , Kowell AP , Gambhir SS , Hoh CK , Phelps ME ((2001) ) Positron emission tomography in evaluation of dementia: Regional brain metabolism and long-term outcome. JAMA 286: , 2120–2127. |
[9] | Herholz K , Salmon E , Perani D , Baron JC , Holthoff V , Frölich L , Schönknecht P , Ito K , Mielke R , Kalbe E , Zündorf G , Delbeuck X , Pelati O , Anchisi D , Fazio F , Kerrouche N , Desgranges B , Eustache F , Beuthien-Baumann B , Menzel C , Schröder J , Kato T , Arahata Y , Henze M , Heiss WD ((2002) ) Discrimination between Alzheimer dementia and controls by automated analysis of multicenter FDG PET. Neuroimage 17: , 302–316. |
[10] | Haense C , Herholz K , Jagust WJ , Heiss WD ((2009) ) Performance of FDG PET for detection of Alzheimer’s disease in two independent multicentre samples (NEST-DD and ADNI). Dement Geriatr Cogn Disord 28: , 259–266. |
[11] | Herholz K , Westwood S , Haense C , Dunn G ((2011) ) Evaluation of a calibrated (18)F-FDG PET score as a biomarker for progression in Alzheimer disease and mild cognitive impairment. J Nucl Med 52: , 1218–1226. |
[12] | Hirata Y , Matsuda H , Nemoto K , Ohnishi T , Hirao K , Yamashita F , Asada T , Iwabuchi S , Samejima H ((2005) ) Voxel-based morphometry to discriminate early Alzheimer’s disease from controls. Neurosci Lett 382: , 269–274. |
[13] | Matsuda H ((2007) ) The role of neuroimaging in mild cognitive impairment. Neuropathology 27: , 570–577. |
[14] | Matsuda H , Mizumura S , Nemoto K , Yamashita F , Imabayashi E , Sato N , Asada T ((2012) ) Automatic voxel-based morphometry of structural MRI by SPM8 plus diffeomorphic anatomic registration through exponentiated lie algebra improves the diagnosis of probable Alzheimer disease. AJNR Am J Neuroradiol 33: , 1109–1114. |
[15] | Román GC , Tatemichi TK , Erkinjuntti T , Cummings JL , Masdeu JC , Garcia JH , Amaducci L , Orgogozo JM , Brun A , Hofman A , Moody DM , O’Brien MD , Yamaguchi T , Grafman J , Drayer BP , Bennett DA , Fisher M , Ogata J , Kokmen E , Bermejo F , Wolf PA , Gorelick PB , Bick KL , Pajeau AK , Bell MA , DeCarli C , Culebras A , Korczyn AD , Bogousslavsky J , Hartmann A , Scheinberg P ((1993) ) Vascular dementia: Diagnostic criteria for research studies. Report of the NINDS-AIRENS International Workshop. Neurology 43: , 250–260. |
[16] | McKeith IG , Galasko D , Kosaka K , Perry EK , Dickson DW , Hansen LA , Salmon DP , Lowe J , Mirra SS , Byrne EJ , Lennox G , Quinn NP , Edwardson JA , Ince PG , Bergeron C , Burns A , Miller BL , Lovestone S , Collerton D , Jansen EN , Ballard C , de Vos RA , Wilcock GK , Jellinger KA , Perry RH ((1996) ) Consensus guidelines for the clinical and pathologic diagnosis of dementia with Lewy bodies (DLB): Report of the Consortium on DLB International Workshop. Neurology 47: , 1113–1124. |
[17] | McKhann G , Albert MS , Grossman M , Miller B , Dickson D , Trojanowski JQ Work Group on Frontotemporal Dementia and Pick’s Disease ((2001) ) Clinical and pathological diagnosis of frontotemporal dementia: Report of the Work Group on Frontotemporal Dementia and Pick’s Disease. Ann Neurol 58: , 1803–1809. |
[18] | Youden WJ ((1950) ) Index for rating diagnostic tests. Cancer 3: , 32–35. |
[19] | Nobili F , Salmaso D , Morbelli S , Girtler N , Piccardo A , Brugnolo A , Dessi B , Larsson SA , Rodriguez G , Pagani M ((2008) ) Principal component analysis of FDG PET in amnestic MCI. Eur J Nucl Med Mol Imaging 35: , 2191–2202. |
[20] | Landau SM , Harvey D , Madison CM , Reiman EM , Foster NL , Aisen PS , Petersen RC , Shaw LM , Trojanowski JQ , Jack CR Jr , Weiner MW , Jagust WJ Alzheimer’s Disease Neuroimaging Initiative ((2010) ) Comparing predictors of conversion and decline in mild cognitive impairment. Neurology 75: , 230–238. |
[21] | Ito K , Mori E , Fukuyama H , Ishii K , Washimi Y , Asada T , Mori S , Meguro K , Kitamura S , Hanyu H , Nakano S , Matsuda H , Kuwabara Y , Hashikawa K , Momose T , Uchida Y , Hatazawa J , Minoshima S , Kosaka K , Yamada T , Yonekura Y J-COSMIC Study Group ((2013) ) Prediction of outcomes in MCI with (123)I-IMP-CBF SPECT: A multicenter prospective cohort study. Ann Nucl Med 27: , 898–906. |
[22] | Morbelli S , Brugnolo A , Bossert I , Buschiazzo A , Frisoni GB , Galluzzi S , van Berckel BN , Ossenkoppele R , Perneczky R , Drzezga A , Didic M , Guedj E , Sambuceti G , Bottoni G , Arnaldi D , Picco A , De Carli F , Pagani M , Nobili F ((2015) ) Visual versus i-quantitative analysis of 18F-FDG-PET in amnestic MCI: An European Alzheimer’s Disease Consortium (EADC) project. J Alzheimers Dis 44: , 815–826 sem. |
[23] | Bennett DA , Wilson RS , Schneider JA , Evans DA , Beckett LA , Aggarwal NT , Barnes LL , Fox JH , Bach J ((2002) ) Natural history of mild cognitive impairment in older perzons. Neurology 59: , 198–205. |
[24] | Jack CR Jr , Knopman DS , Chételat G , Dickson D , Fagan AM , Frisoni GB , Jagust W , Mormino EC , Petersen RC , Sperling RA , van der Flier WM , Villemagne VL , Visser PJ , Vos SJ ((2016) ) Suspected non-Alzheimer disease pathophysiology–concept and controversy. Nat Rev Neurol 12: , 117–124. |
[25] | Chételat G , Landeau B , Eustache F , Mézenge F , Viader F , de la Sayette V , Desgranges B , Baron JC ((2005) ) Using voxel-based morphometry to map the structural changes associated with rapid conversion in MCI: A longitudinal MRI study. Neuroimage 27: , 934–946. |
[26] | Karas G , Sluimer J , Goekoop R , van der Flier W , Rombouts SA , Vrenken H , Scheltens P , Fox N , Barkhof F ((2008) ) Amnestic mild cognitive impairment: Structural MR imaging findings predictive of conversion to Alzheimer disease. AJNR Am J Neuroradiol 29: , 944–949. |
[27] | Ferreira LK , Diniz BS , Forlenza OV , Busatto GF , Zanetti MV ((2011) ) Neurostructural predictors of Alzheimer’s disease: A meta-analysis of VBM studies. Neurobiol Aging 32: , 1733–1741. |
[28] | Shaffer JL , Petrella JR , Sheldon FC , Choudhury KR , Calhoun VD , Coleman RE , Doraiswamy PM Alzheimer’s Disease Neuroimaging Initiative ((2013) ) Predicting cognitive decline in subjects at risk for Alzheimer disease by using combined cerebrospinal fluid, MR imaging, and PET biomarkers. Radiology 266: , 583–591. |


