
Neurocognitive and Behavioral Indexes for Identifying the Amnestic Subtypes of Mild Cognitive Impairment
Abstract
Early identification of amnestic mild cognitive impairment (aMCI) subtypes is important for early diagnosis and prognosis of Alzheimer’s disease. Healthy, single-domain (sdaMCI) and multiple-domain aMCI (mdaMCI) participants performed an auditory-visual distraction-attention task. Event-related brain potentials (ERPs) were recorded while the participants performed the task to evaluate Go/NoGo N2 and P3 ERP components. The results showed the expected behavioral and cognitive decline in mdaMCI participants relative to controls (fewer hits, longer reaction times [RTs], slightly smaller Go-N2 and NoGo-N2 amplitudes), while sdaMCI participants showed some decline (slightly longer RTs, smaller Go- and NoGo-N2 amplitudes) along with some unexpected results (a late positive slow wave, PSW) and good levels of execution. In addition, some of these parameters proved to be useful markers. Thus, the number of hits was the best marker for diagnosing mdaMCI participants (distinguishing them from controls, from sdaMCI participants, and from both groups together), while the PSW amplitude was the best marker for diagnosing sdaMCI participants (distinguishing them from controls, and from control & mdaMCI participants).
INTRODUCTION
Dementia has become a major health and social problem in the last few decades [1]. This is particularly true of Alzheimer’s disease (AD), the most common form of dementia [2], leading to a growing interest in the preclinical and prodromal stages of the disease. Mild cognitive impairment (MCI) is a diagnostic entity representing those intermediate states between healthy aging and dementia. Early identification of biomarkers and other indicators of MCI is important, as it would allow intervention before brain damage becomes permanent [3, 4].
Several methods of obtaining biomarkers for AD and MCI have been proposed. Ideally, a marker should be able to detect the neuropathology and must be validated in neuropathologically confirmed cases; it also should be precise, reliable, non-invasive, simple to perform, and inexpensive [5]. The biomarkers proposed for identifying MCI [6] are obtained by relatively expensive (functional magnetic resonance) and/or invasive methods (positron emission tomography or cerebrospinal fluid measures), and they have not yet been standardized [7]. However, these methods do not include other techniques, such as electroencephalography (quantitative electroencephalography or event-related brain potentials [ERPs]), which has shown to be useful in the search for biomarkers of MCI and AD (e.g., [8–11]; for reviews see [12, 13]).
Two subtypes of MCI have been identified on the basis of whether memory is impaired or not: amnestic and non-amnestic MCI (aMCI and naMCI, respectively). The amnestic subtype is more likely than the non-amnestic subtype to progress to AD [14]. Examination of clinical cohorts suggests that about 10–15% of patients with aMCI develop AD each year, compared with 3% in the general older population [15]. In addition, the prognosis of people diagnosed with multi-domain aMCI (mdaMCI, in which memory is impaired along with other cognitive domain/s) is worse than that of those diagnosed with single-domain aMCI (sdaMCI, in which only memory is impaired), as the progression to dementia is much more common and occurs faster in such cases [16, 17].
Although memory decline seems to be the hallmark of aMCI, several studies show that other cognitive domains may be affected, such as those related to executive function (e.g., [18–20]). This has also been demonstrated for sdaMCI, even when the diagnostic tools only reveal memory impairments [21]. Executive functioning refers to those cognitive processes involving higher level organization and execution of complex thought and behavior [22], necessary to guide thoughts and actions in accord with internal intentions. These processes include stimulus evaluation, and response inhibition and execution [23, 24], all of which play an essential role in daily life activities.
The aforementioned processes have been investigated in ERP studies. The ERP correlates of the stimulus evaluation processes are the N2b (or Go-N2) and the P3b (or Go-P3) ERP components. The former is a negative component that typically appears at central electrodes in the 200–300 ms post-stimulus window and is thought to reflect the conscious evaluation of a stimulus [25–27]. By contrast, the P3b component is typically maximal at parietal electrodes in young adults with latencies of 300–700 ms after presentation of a target stimulus, and it has been classically interpreted as a correlate of target stimulus classification [28–30], although its functional significance is still under debate [31, 32].
The NoGo-N2 and -P3 ERP components are ERP indexes of prepotent response inhibition. NoGo-N2 is a negative component usually identified at frontocentral locations around the 200–400 ms interval after stimulus presentation [33–35] and is followed by the NoGo-P3 component at the same locations in the 300–500 ms interval [34, 36]. Classically, these components have been considered indices of response inhibition (e.g., [37–39]). However, this view has been challenged by others: the NoGo-N2 ERP component has been alternatively considered an index of response conflict [40–43]; the NoGo-P3 component has also been considered a response-monitoring process [44–46], and even as an orienting response similar to that indicated by P3a [47–49].
All of these ERP components have been studied to different extents in aMCI. The P3b amplitude does not usually differentiate between aMCI and control adults [10, 50–55] although some studies found significantly smaller P3b amplitudes in aMCI than in control participants [56]. However, in several studies, aMCI participants showed longer P3b latencies than healthy controls [26, 50, 53, 56–58], although many other studies did not find such differences [10, 51, 52, 54, 55, 59–61].
Contradictory results have also been obtained in relation to the N2b amplitude. Thus, while most studies did not find any differences between aMCI and control participants in relation to this component (e.g., [58, 62]), others found larger [53, 63] or lower [55] amplitudes in the former group. Nevertheless, (1) aMCI participants usually show longer N2b latencies than control participants [26, 53, 62–64]; although some studies failed to find such differences ([50, 55]; for a review, see [65]); (2) N2b latency seems to distinguish between single-domain and multi-domain aMCI [10]; and (3) the N2b latency may also be a good predictor of progression from MCI to AD [64].
The NoGo-N2 and NoGo-P3 components have also been studied in aMCI participants, although to a lesser extent. In a previous study comparing aMCI adults and healthy controls, we observed lower Go-N2 and NoGo-N2 amplitudes, along with poorer performance in the Go condition in the former group [55]. These results were interpreted as deficits in the processes indicated by these components in the aMCI adults. There were no significant group effects in relation to the Go- and NoGo-P3 components. In a recent study, two different Go/NoGo tasks were used to evaluate possible differences between aMCI participants and healthy controls [51]. The authors observed longer N2 latencies in the former group (both in the Go and NoGo conditions), along with poorer performance in the NoGo condition (more commission errors) and no behavioral differences in the Go condition [51]. This study did not reveal any differences between the groups in Go- or NoGo-P3 parameters. The authors interpreted these findings as indicating a possible decline in processes that are common to both Go and NoGo trials (such as the initial evaluation of the stimuli), which may affect response execution as the disease progresses. Finally, López Zunini et al. [66] also used a Go/NoGo task to compare aMCI participants and healthy controls, although these authors did not evaluate Go-N2 parameters or Go- and NoGo-P3 latencies. MCI participants obtained less accurate scores (both in Go and NoGo conditions), with no differences in RTs (expected due to the features of the paradigm), along with lower Go- and NoGo-P3 amplitudes. These results were interpreted as reflecting some deficits in aMCI participants associated with target detection and evaluation as well as with inhibitory control [66].
The differences between studies may be due to several factors, such as the large differences between the Go/NoGo tasks and stimuli, differences in the diagnostic methods and possible differences in the sample characteristics. Few studies have evaluated differences between aMCI subtypes in the components elicited in the Go condition (Go-N2 and –P3), and as far as we know no studies have assessed differences between aMCI subtypes for those ERP components observed in the NoGo condition (NoGo-N2 and –P3).
Several studies suggest that adults with mdaMCI are at a greater risk of progressing to AD than those with sdaMCI [67–70]. Hence, it is important to search for markers, not only of aMCI, but also of each subtype, in order to detect the conditions as early as possible. The present study aims to address this gap, by evaluating the possible differences in the Go- and NoGo-N2 and –P3 parameters (amplitudes and latencies) between healthy old participants, participants with sdaMCI, and participants with mdaMCI, in order to identify possible biomarkers for diagnosing sdaMCI and mdaMCI.
We expected to find poorer execution in the aMCI groups than in the control group, as well as lower Go- and NoGo-N2 amplitudes, in line with our previous findings [55]. We also expected to observe worse execution and lower N2 amplitudes in the mdaMCI than in the sdaMCI group, due to greater impairment in the former. In line with another previous study in which we evaluated performance of both subtypes of aMCI [71], we also expected to find strong differences in performance between groups, with the mdaMCI participants showing poorer execution than the control adults and the sdaMCI group obtaining intermediate scores. Although we did not expect to find other differences between aMCI and controls, longer N2 or P3 latencies and lower P3 amplitudes in the mdaMCI than in to the other two groups may be observed, as this may have been masked in our previous study. In addition, we expected that N2 and behavioral parameters may constitute, alone or in combination, good markers for diagnosing each aMCI subtype.
MATERIALS AND METHODS
Participants
Fifty-four volunteers were recruited from Primary Care Health Centres in Santiago de Compostela, Galicia (Spain). Participants were classified into three groups: 1) Control, comprising 20 adults, aged between 52 and 84 years, with normal cognitive functioning; 2) sdaMCI, comprising 22 adults aged between 51 and 86 years; and 3) mdaMCI, comprising 12 adults aged between 61 and 85 years old. The groups were matched according to age and level of education. The demographic and neuropsychological measures of the participants are summarized in Table 1, together with the differences between groups, calculated by the corresponding analysis.
Table 1
Mean values and standard deviations (SDs; in parentheses) of the demographic and neuropsychological measures
| Control | sdaMCI | mdaMCI | p≤* | Bonferroni’s† | |
| N = 20 | N = 22 | N = 12 | |||
| Age | 67.0 (9.8) | 68.7 (10.1) | 72.1 (6.9) | 0.344 | |
| Years of education | 9.8 (5.2) | 9.0 (4.2) | 9.2 (5.0) | 0.862 | |
| Gender (Female/Male) | 13/6 | 10/11 | 8/4 | ||
| MMSE | 28.0 (1.5) | 26.9 (2.0) | 23.4 (1.7) | 0.001 | Control > sdaMCI, mdaMCI |
| CVLT (short-delay free recall) | 9.5 (3.4) | 3.9 (1.9) | 3.1 (1.8) | 0.001 | Control > sdaMCI, mdaMCI |
| CVLT (short-delay cued recall) | 10.6 (3.4) | 5.4 (2.4) | 5.6 (2.0) | 0.001 | Control > sdaMCI, mdaMCI |
| CVLT (long-delay free recall) | 10.4 (3.6) | 4.8 (3.0) | 2.8 (2.8) | 0.001 | Control > sdaMCI, mdaMCI |
| CVLT (long-delay cued recall) | 10.9 (3.5) | 5.9 (2.8) | 5.5 (2.4) | 0.001 | Control > sdaMCI, mdaMCI |
| CAMCOGR (Orientation) | 9.5 (0.8) | 9.4 (0.8) | 8.5 (1.3) | 0.007 | Control, sdaMCI > mdaMCI |
| CAMCOGR (Language) | 25.0 (2.4) | 25.3 (2.6) | 22.6 (2.8) | 0.015 | Control, sdaMCI > mdaMC |
| CAMCOGR (Attention and Calculation) | 7.2 (1.5) | 7.2 (1.8) | 4.8 (2.4) | 0.001 | Control, sdaMCI > mdaMCI |
| CAMCOGR (Praxis) | 11.0 (1.3) | 10.5 (2.3) | 8.7 (2.8) | 0.014 | Control > mdaMCI |
| CAMCOGR (Perception) | 6.1 (1.6) | 6.2 (1.3) | 6.2 (1.7) | 0.964 | |
| CAMCOGR (Executive function) | 16.2 (5.9) | 15.6 (6.4) | 12.7 (4.6) | 0.111 |
*ANOVA (Group); †p < 0.05. MMSE, Mini-Mental State Examination; CVLT, California Verbal Learning Test; CAMCOGR, Cambridge Cognitive Examination.
The participants had no history of clinical stroke, traumatic brain injury, motor-sensory deficits, or alcohol or drug abuse/dependence, and were not diagnosed with any significant medical or psychiatric illnesses. To control for the effects of depression, adults with a score of more than 10 in depression screening (Geriatric Depression Scale) [72] were not included in the study. All participants had normal audition and normal or corrected-to-normal vision. All of them were right-handed, as assessed by the Edinburgh inventory [73]. All participants gave their written informed consent prior to participation in the study. The research project was approved by the Galician Clinical Research Ethics Committee (Xunta de Galicia, Spain). The study was performed in accordance with the ethical standards established in the 1964 Declaration of Helsinki [74].
Participants belonged to a larger sample referred to our research group by their general practitioners (GPs). In our laboratory, each participant underwent the following neuropsychological tests: 1) the Spanish version of the Mini-Mental State Examination (MMSE) [75]; 2) the Spanish version of the Californian Verbal Learning Test (CVLT) [76], which assesses short-delay free recall, short-delay recall with semantic cues, and long-delay free recall; 3) the Spanish version of the Cambridge Cognitive Examination (CAMCOG-R), which assesses deterioration in specific domains, such as language, attention-calculation, praxis, perception, and executive functioning [77], and 4) the Spanish version of Lawton-Brody Instrumental Activities of Daily Living (IADL) scale [78].
Subjects classified as having sdaMCI or mdaMCI should meet the general criteria for MCI outlined by Albert et al. [6] and the criteria for aMCI proposed by Petersen and colleagues [79]. All aMCI participants fulfilled the following criteria: 1) memory complaints corroborated by an informant; 2) performance of less than 1.5 SDs below age norms for the CVLT; 3) no significant impact on activities of daily living; and 4) no dementia. Regarding general cognitive functioning, the mdaMCI subjects scored less than 1.5 SDs below age- and education-related norms in the MMSE and at least two cognitive subscales of the Spanish version of the CAMCOG-R. Once the participants were classified according to their diagnosis, those who met the criteria for sdaMCI, mdaMCI, and healthy controls underwent the ERP session. For a more extensive description of the global samples, see [80].
Procedure
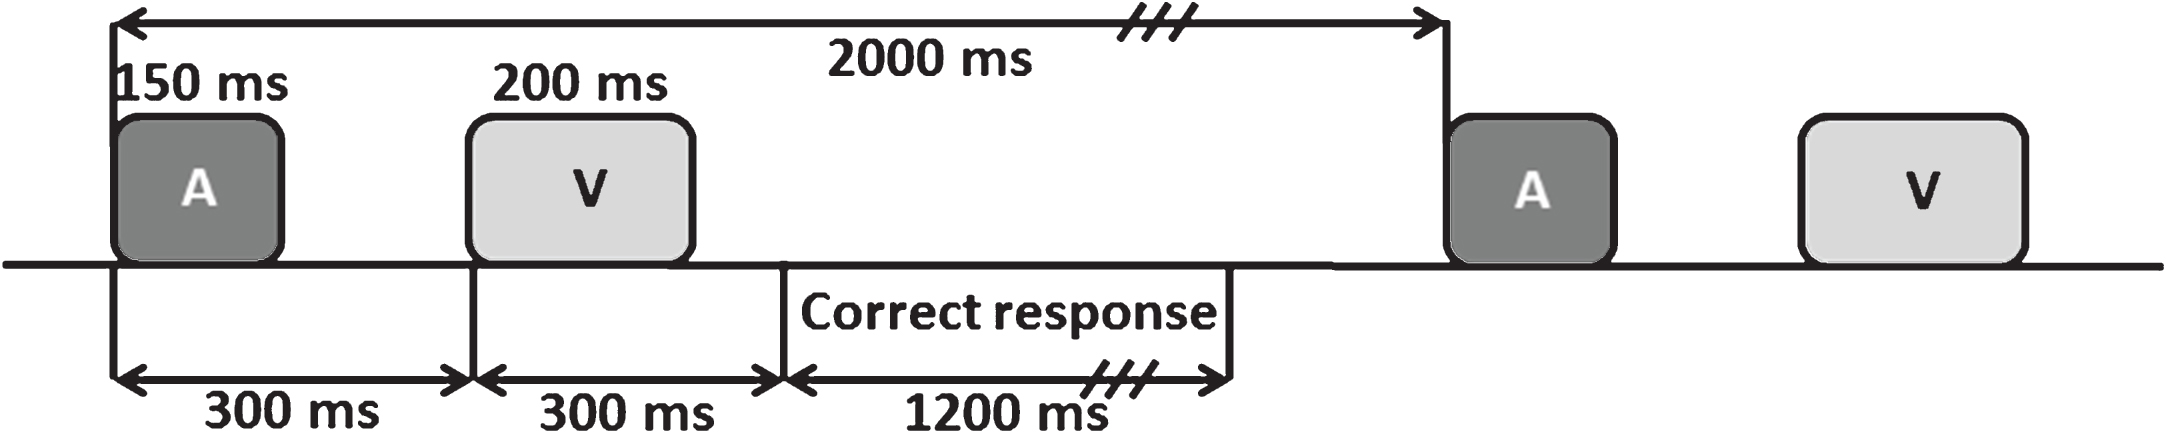
The auditory-visual distraction-attention task was adapted from Escera et al. [81]. Participants were presented with 500 pairs of auditory-visual (A-V) stimuli, divided into 2 blocks with a short rest between each block. Each pair of stimuli consisted of a visual stimulus (200 ms duration) preceded by an auditory stimulus (150 ms duration), separated by an interval of 300 ms (SOA), and with an interval of 2 s between each pair. Participants were asked to attend to the visual stimuli and to ignore the auditory stimuli. The task procedure is summarized in Fig. 1, and further explained in [71].
Fig.1
Scheme of the auditory-visual attention-distraction task. A: auditory stimuli; V: visual stimuli.
EEG recording
The methods concerning the EEG acquisition are described in previously published articles [55, 71].
The EEG was recorded via 49 electrodes placed in an elastic cap (Easycap, GmbH), according to the International 10-10 System. All electrodes were referenced to an electrode attached to the tip of the nose, and an electrode positioned at Fpz served as ground. The horizontal electrooculogram (EOG) was recorded via two electrodes placed at the outer canthi of both eyes, whereas the vertical EOG was recorded via two electrodes placed supra and infraorbitally to the right eye. The EEG was continuously digitized at a rate of 500 Hz (bandpass 0.01–100 Hz), and the electrode impedance was maintained below 10 kΩ.
Once the signal was stored, ocular artefacts were corrected using the Gratton, Coles & Donchin method [82]. With the aim of evaluating the Go- and NoGo-N2 and -P3 ERP components, the EEG was segmented by extraction of auditory stimulus-locked epochs of 1450 ms (150 ms pre-auditory stimulus). The epochs associated with the standard auditory-target visual pairs (Standard condition), deviant auditory –target visual pairs (Deviant condition), and novel auditory-target visual pairs (Novel condition) were evaluated. The signal was passed through a digital 0.1 to 30 Hz (24 dB/octave slope) bandpass filter, and all epochs were corrected to the mean voltage of the first 150 ms of the prestimulus recording period. Segments exceeding±100 μV were automatically rejected, and the epochs corresponding to the Standard, Deviant, and Novel conditions were averaged separately for the Go and NoGo trials. Thus, 6 different types of averages were obtained: Standard-Go, Deviant-Go, Novel-Go, Standard-NoGo, Deviant-NoGo, Novel-NoGo. A minimum of 38 artefact-free epochs were averaged for each condition.
Data analysis
Reaction times (RTs, between the onset of the visual stimulus and pressing the key) and the number of correct responses were evaluated in the Go condition (Go Hits). The Go-N2 (in the 250–430 ms interval after the visual stimulus, Go condition), Go-P3 (in the 350–700 ms interval after the visual stimulus, Go condition), NoGo-N2 (in the 200–360 ms interval after the visual stimulus, NoGo condition), and NoGo-P3 (in the 400–550 ms interval after the visual stimulus, NoGo condition) components were also evaluated. The peak amplitudes (in microvolts) and latencies (in milliseconds) of all the ERP components evaluated were assessed at Fz, Cz, and Pz electrodes, in the Standard, Deviant, and Novel conditions.
Another component was identified by visual inspection in the Go ERP traces. This component is a late positive slow wave (PSW) that overlaps with the Go-P3 in the sdaMCI group, and which was absent in most of the mdaMCI and control participants. Specifically, it was observed in 30% of the control participants, in 25% of the mdaMCI participants, and in 91% of the sdaMCI participants. As no clear peak in this component was observed, mean amplitudes were computed for the 700 to 1000 ms interval (post-visual stimulus) in three windows of 100 ms (W1, W2, and W3).
Statistical analysis
One-factor analysis of variance (ANOVA), with a between-subject factor Group (with three levels: Control, sdaMCI, and mdaMCI), was used to evaluate the effects of the sdaMCI and mdaMCI on the RTs and Go-Hits. Two-factor analysis of variance (ANOVA), with a between-subject factor Group and a within-subject factor Electrode Position (with three levels: Fz, Cz, and Pz) was used with the aim of evaluating the effects of the sdaMCI and mdaMCI on the Go-N2, NoGo-N2, Go-P3, NoGo-P3, and late PSW parameters. In order to simplify the results, a separate ANOVA was performed for each condition (Standard, Deviant, and Novel).
Whenever the ANOVAs revealed significant effects due to the Group factor or its interactions, post hoc comparisons of the mean values (adjusted to Bonferroni correction) were conducted. Differences were considered significant at p≤0.05. Greenhouse–Geisser correction of the degrees of freedom was applied in all cases in which the condition of sphericity was not met. In these cases, the original degrees of freedom are presented together with the corrected p and ɛ values.
Finally, receiver operating characteristics (ROC) curves were constructed for those ERP and behavioral parameters in which the Group factor exerted a main effect. When the significant effect involved only two of the three groups (with intermediate but non-significant values for the remaining group), the intermediate group was combined with the most similar group for further ROC analysis for exploratory purposes. Cohen’s d values were computed for each post hoc comparison involving group effects in the ANOVAs, with the aim of determining the difference in size of the effects between each pair of groups. All statistical analyses were performed with IBM SPSS Statistics package v.19 for Windows, except for Cohen’s d values, which were calculated with G*Power V.3.1.9.2 for Windows [83].
Only the results of the ROC curves that showed sensitivity and specificity values higher than 0.65 are reported here. Whenever the sensitivity and specificity values were higher than 0.70 for more than one parameter for the same diagnostic purpose, those parameters were combined. The procedure used was as follows: first, the two parameters with highest sensitivity and specificity values were combined; second (only if the first combination yielded larger sensitivity and specificity scores than each parameter alone), when the sensitivity and specificity scores did not reach 1.00, the next best parameter (in terms of sensitivity and specificity) was also included in the combination. This procedure was continued until one of two events occurred: (1) the combined sensitivity and specificity reached a score of 1.00, or (2) the sensitivity and specificity values did not improve since the last combination. In order to combine parameters, a binary logistic regression model was constructed, with these parameters considered the explanatory variables (covariates) and the group of interest as dependent variable. The predicted probabilities were saved as a new variable and ROC curves were computed. An area under the curve (AUC) of 1.0 corresponds to a perfect prediction, whereas a value of 0.5 indicates a useless model.
RESULTS
The values of RTs and correct responses (Go Hits) for each group (mdaMCI, sdaMCI, Control) in each condition (Standard, Deviant, Novel) are summarized in Table 2. The values of the evaluated parameters of each ERP component (Go-N2 and –P3, NoGo-N2 and –P3, and PSW in W1, W2, and W3) for all three groups in each condition are summarized in Table 3. The parameters of the ROC curve analysis that reached a value of 0.70 are summarized in Table 4.
Table 2
Mean values and standard deviations (in parentheses) of the reaction times and number of correct responses for the three groups (Control, sdaMCI, mdaMCI) in the three conditions (S, D, N)
| RT | Hits | |||||
| S | D | N | S | D | N | |
| Control | 599 (68.1) | 597 (66.7) | 632 (74.5) | 219.7 (7.4) | 48.7 (1.3) | 48.2 (1.8) |
| sdaMCI | 648 (79.3) | 662 (102.0) | 707 (114.3) | 212.5 (23.6) | 46.7 (5.5) | 46.2 (6.7) |
| mdaMCI | 683 (86.6) | 687 (90.0) | 732 (104.5) | 199.4 (21.6) | 43.4 (4.5) | 41.2 (6.3) |
RT, reaction times (expressed in milliseconds); Hits, number of correct responses; S, Standard; D, Deviant; N, Novel.
Table 3
Mean values and standard deviations (SDs; in parentheses) of the evaluated amplitudes and latencies for the three groups (Control, sdaMCI, mdaMCI) in the three conditions (S, D, N), at the Fz, Cz, and Pz locations
| Control | sdaMCI | mdaMCI | |||||||
| Fz | Cz | Pz | Fz | Cz | Pz | Fz | Cz | Pz | |
| Amp Go-N2 | |||||||||
| S | –5.5 (5.7) | –10.4 (8.4) | –8.2 (6.9) | –3.1 (3.5) | –5.5 (4.9) | –4.7 (4.7) | –3.2 (3.6) | –6.4 (4.2) | –5.1 (4.5) |
| D | –6.6 (6.5) | –12.3 (8.7) | –9.8 (7.5) | –3.2 (4.3) | –5.3 (6.1) | –5.2 (5.7) | –4.3 (3.4) | –8.3 (3.7) | –6.7 (5.2) |
| N | –5.4 (7.5) | –10.4 (10.6) | –8.4 (8.9) | –3.0 (4.1) | –4.7 (5.2) | –4.4 (5.1) | –4.3 (5.0) | –7.3 (5.0) | –5.8 (4.8) |
| Amp Go-P3 | |||||||||
| S | 5.9 (7.1) | 2.7 (8.6) | 5.1 (8.0) | 6.2 (4.4) | 5.5 (5.8) | 7.5 (4.9) | 6.8 (6.9) | 4.1 (7.1) | 6.0 (7.2) |
| D | 7.0 (8.5) | 3.8 (10.0) | 6.7 (9.7) | 8.5 (4.9) | 7.6 (6.5) | 8.6 (6.6) | 9.3 (6.6) | 6.6 (6.8) | 8.5 (7.4) |
| N | 8.0 (8.3) | 5.4 (10.5) | 8.0 (9.8) | 7.3 (4.8) | 6.9 (6.7) | 8.0 (6.5) | 9.5 (8.9) | 7.3 (8.5) | 7.7 (8.2) |
| Amp NoGo-N2 | |||||||||
| S | –4.6 (4.8) | –7.0 (7.0) | –5.4 (6.6) | –3.3 (2.4) | –3.8 (3.4) | –3.7 (4.3) | –3.2 (2.2) | –4.1 (2.8) | –1.8 (3.8) |
| D | –4.7 (6.5) | –7.5 (8.7) | –5.5 (8.3) | –4.6 (3.8) | –4.8 (3.7) | –4.2 (3.6) | –5.8 (4.2) | –6.7 (4.8) | –4.9 (4.7) |
| N | –5.7 (4.4) | –8.1 (8.4) | –6.1 (8.0) | –1.8 (3.8) | –2.1 (4.3) | –2.7 (3.4) | –0.4 (2.1) | 0.3 (4.8) | 1.3 (5.8) |
| Amp NoGo-P3 | |||||||||
| S | 9.1 (6.3) | 10.4 (6.3) | 7.9 (5.8) | 8.8 (5.1) | 10.7 (5.4) | 8.7 (4.6) | 12.3 (8.1) | 12.0 (8.6) | 10.6 (8.3) |
| D | 11.6 (7.2) | 12.7 (8.1) | 10.6 (8.5) | 11.2 (6.2) | 13.5 (6.9) | 11.3 (6.1) | 12.5 (8.1) | 13.4 (8.5) | 12.6 (9.1) |
| N | 9.0 (4.0) | 11.5 (4.9) | 9.2 (4.2) | 10.4 (6.0) | 12.3 (6.3) | 10.0 (5.4) | 14.3 (10.2) | 15.7 (11.6) | 14.2 (11.0) |
| Amp PSW W1 (700–800 ms) | |||||||||
| S | 0.4 (5.6) | –1.3 (6.6) | 0.2 (6.9) | 2.5 (3.1) | 3.3 (4.1) | 4.3 (4.0) | –0.5 (6.3) | –1.6 (6.7) | 0.2 (7.1) |
| D | 0.4 (6.0) | –1.6 (7.4) | 0.0 (7.4) | 3.3 (3.1) | 4.4 (4.2) | 4.7 (4.1) | –0.8 (7.2) | –2.8 (8.4) | –0.8 (9.0) |
| N | 1.2 (7.5) | –0.9 (9.4) | 0.7 (9.0) | 2.5 (4.1) | 3.5 (5.8) | 5.0 (5.6) | 0.5 (6.2) | –0.6 (6.6) | 1.3 (6.3) |
| Amp PSW W2 (800–900 ms) | |||||||||
| S | 0.0 (4.6) | –1.5 (5.3) | –1.0 (5.7) | 2.2 (2.9) | 2.9 (3.6) | 2.9 (4.1) | –0.9 (6.2) | –1.6 (6.0) | 0.0 (6.0) |
| D | –0.1 (5.2) | –1.8 (5.7) | –1.1 (5.7) | 2.8 (2.7) | 3.7 (3.7) | 3.3 (4.3) | –1.6 (7.7) | –3.4 (7.8) | –1.6 (8.1) |
| N | 0.8 (7.4) | –1.0 (8.5) | –0.6 (8.4) | 2.2 (4.0) | 3.4 (5.6) | 3.8 (6.0) | –0.1 (5.7) | –0.8 (5.1) | 0.7 (4.9) |
| Amp PSW W3 (900–1000 ms) | |||||||||
| S | –0.6 (4.5) | –1.4 (5.2) | –1.8 (5.7) | 1.4 (3.2) | 2.0 (3.8) | 1.9 (4.3) | –1.2 (5.6) | –1.3 (5.3) | –0.5 (4.7) |
| D | –0.3 (4.5) | –2.0 (5.4) | –2.0 (5.5) | 2.1 (2.9) | 2.9 (3.8) | 2.5 (4.2) | –1.5 (6.5) | –2.8 (6.8) | –1.6 (7.0) |
| N | –0.3 (6.4) | –1.4 (7.6) | –1.7 (7.6) | 1.8 (4.8) | 2.7 (5.4) | 2.5 (5.6) | 0.8 (5.0) | 0.8 (5.1) | 2.1 (4.8) |
| Lat Go-N2 | |||||||||
| S | 290 (45) | 307 (50) | 304 (47) | 316 (50) | 318 (58) | 320 (62) | 334 (25) | 347 (23) | 355 (32) |
| D | 299 (51) | 307 (57) | 307 (59) | 310 (51) | 318 (52) | 317 (53) | 317 (44) | 331 (39) | 340 (38) |
| N | 322 (85) | 338 (84) | 338 (92) | 319 (41) | 337 (42) | 334 (47) | 338 (44) | 357 (34) | 356 (34) |
| Lat Go-P3 | |||||||||
| S | 498 (80) | 530 (101) | 557 (86) | 423 (261) | 564 (111) | 597 (108) | 510 (43) | 508 (58) | 526 (60) |
| D | 488 (58) | 541 (88) | 554 (62) | 534 (89) | 546 (95) | 580 (90) | 527 (34) | 544 (32) | 551 (34) |
| N | 497 (64) | 493 (198) | 555 (92) | 527 (105) | 443 (231) | 562 (122) | 531 (67) | 542 (72) | 547 (74) |
| Lat NoGo-N2 | |||||||||
| S | 261 (45) | 264 (52) | 275 (53) | 284 (57) | 274 (57) | 286 (66) | 267 (52) | 275 (53) | 285 (60) |
| D | 264 (49) | 261 (53) | 268 (63) | 297 (50) | 296 (56) | 305 (53) | 269 (52) | 280 (56) | 281 (62) |
| N | 284 (49) | 275 (55) | 285 (57) | 300 (66) | 297 (50) | 301 (67) | 298 (50) | 312 (57) | 299 (56) |
| Lat NoGo-P3 | |||||||||
| S | 482 (62) | 484 (79) | 498 (93) | 519 (80) | 513 (81) | 533 (78) | 491 (57) | 471 (40) | 489 (64) |
| D | 488 (42) | 501 (73) | 512 (82) | 484 (64) | 502 (73) | 517 (78) | 474 (52) | 468 (43) | 472 (49) |
| N | 485 (65) | 486 (63) | 479 (77) | 497 (66) | 504 (64) | 527 (79) | 484 (39) | 482 (44) | 480 (47) |
S, Standard; D, Deviant; N, Novel; Amp, amplitude; Lat, latency; W1, first window; W2, second window; W3, third window. Amplitudes: expressed in microvolts, upper panel. Latencies: expressed in milliseconds, from the presentation of the visual stimulus, lower panel.
Table 4
Sensitivity and specificity values for the parameters that reached the 0.70 score for sensitivity and specificity for each type of ROC analysis
| AUC | Cut-off | Se | Sp | ||
| mdaMCI versus Control | Amp NoGo-N2, Novel, Fz | 0.848 | –2.5 | 0.86 | 0.81 |
| Amp NoGo-N2, Novel, Cz | 0.812 | –1.2 | 0.71 | 0.88 | |
| RT, Standard | 0.805 | 617.0 | 0.90 | 0.70 | |
| RT, Deviant | 0.805 | 634.7 | 0.70 | 0.75 | |
| RT, Novel | 0.790 | 670.8 | 0.70 | 0.75 | |
| Go Hits, Standard | 0.868 | 209.5 | 0.80 | 0.90 | |
| Go Hits, Deviant | 0.940 | 46.5 | 0.90 | 0.95 | |
| Go Hits, Novel | 0.875 | 46.5 | 0.90 | 0.85 | |
| mdaMCI versus Control &sdaMCI | Amp NoGo-N2, Novel, Cz | 0.723 | –0.9 | 0.71 | 0.80 |
| Go Hits, Standard | 0.806 | 209.5 | 0.80 | 0.86 | |
| Go Hits, Deviant | 0.871 | 46.5 | 0.90 | 0.89 | |
| Go Hits, Standard | 0.837 | 46.5 | 0.90 | 0.81 | |
| sdaMCI versus Control | Amp NoGo-N2, Novel, Cz | 0.753 | –4.34 | 0.72 | 0.75 |
| Amp PSW, W2, Standard, Pz | 0.730 | 1.1 | 0.73 | 0.70 | |
| Amp PSW, W2, Deviant, Fz | 0.759 | 1.3 | 0.77 | 0.75 | |
| Amp PSW, W2, Deviant, Cz | 0.809 | 1.0 | 0.77 | 0.80 | |
| Amp PSW, W2, Deviant, Pz | 0.750 | 0.7 | 0.77 | 0.70 | |
| Amp PSW, W3, Deviant, Cz | 0.793 | 0.6 | 0.73 | 0.75 | |
| sdaMCI versus Control &mdaMCI | Amp PSW, W2, Deviant, Fz | 0.776 | 1.4 | 0.77 | 0.78 |
| Amp PSW, W2, Deviant, Cz | 0.808 | 1.0 | 0.77 | 0.79 | |
| Amp PSW, W3, Deviant, Cz | 0.778 | 0.6 | 0.73 | 0.72 | |
| mdaMCI versus sdaMCI | Amp NoGo-N2, Novel, Cz | 0.643 | –0.9 | 0.72 | 0.71 |
| Amp PSW, W2, Deviant, Fz | 0.803 | 1.4 | 0.77 | 0.83 | |
| Amp PSW, W2, Deviant, Cz | 0.807 | –0.7 | 0.82 | 0.75 | |
| Go Hits, Standard | 0.750 | 209.5 | 0.80 | 0.82 | |
| Go Hits, Deviant | 0.809 | 46.5 | 0.90 | 0.82 | |
| Go Hits, Novel | 0.802 | 46.5 | 0.90 | 0.78 | |
| mdaMCI versus Control | Hits Go, Deviant &Hits Go Novel | 0.928 | 0.5 | 0.90 | 1.00 |
| sdaMCI versus Control &mdaMCI | Amp PSW, W2, Deviant, Fz & | 0.831 | 0.5 | 0.77 | 0.82 |
| Amp PSW, W2, Deviant Cz |
Upper panel: sensitivity and specificity values of the individual parameters for each type of diagnosis. Lower panel: sensitivity and specificity values of the combinations of parameters that surpassed the sensitivity and specificity values of the parameters on their own. The best parameter or combination for each type of diagnosis is highlighted in bold type. AUC, area under the curve; Se, sensitivity; Sp, specificity; Amp, amplitude; RT, reaction time.
Performance
RTs
The one-factor ANOVA (Group) of the RT revealed a significant effect of the factor in the Standard condition (F (2, 49) = 4.5; p = 0.02), which was significantly longer in the mdaMCI group than in the Control group. The sdaMCI participants yielded intermediate values, which were not significantly different from those yielded by either of the other groups (see Table 2). The Cohen’s d values for the post-hoc comparisons were as follows: (1) Control versus mdaMCI, d = 1.08; (2) mdaMCI versus sdaMCI, d = 0.42; and (3) Control versus sdaMCI, d = 0.67. For this parameter, two ROC curves reached the 0.65 minimum threshold for the sensitivity and specificity scores: (1) for discriminating mdaMCI participants from control participants, the sensitivity was 0.90 and the specificity 0.70; and (2) for discriminating mdaMCI and sdaMCI participants from control participants, the sensitivity score was 0.69 and the specificity score, 0.70.
In the Deviant condition, the ANOVA revealed a significant effect of the Group factor (F (2, 49) = 4.6; p = 0.01) on the RT, which was significantly longer in the mdaMCI than in the Control group. Again, the sdaMCI group showed intermediate values that were not significantly different from those obtained for the other two groups (see Table 2). The Cohen’s d values for the post-hoc comparisons were as follows: (1) Control versus mdaMCI, d = 1.15; (2) mdaMCI versus sdaMCI, d = 0.27; and (3) Control versus. sdaMCI, d = 0.76. For this parameter, two ROC curves were also obtained: (1) for discriminating mdaMCI participants from control participants, the sensitivity score was 0.70 and the specificity score 0.75; and (2) for discriminating mdaMCI and sdaMCI participants from control participants, the sensitivity score was 0.69 and the specificity score, 0.75.
Finally, in the Novel condition, the ANOVA also revealed a significant effect of the Group factor on the RT (F (2, 49) = 4.6; p = 0.01), which was significantly longer in the mdaMCI and sdaMCI groups than in the Control group (see Table 2). Cohen’s d values for the post-hoc comparisons were as follows: (1) Control versus mdaMCI, d = 1.15; (2) Control versus sdaMCI, d = 0.78; and (3) sdaMCI versus mdaMCI, d = 0.23. For the RT in the Novel condition, only one ROC curve was obtained: for discriminating mdaMCI participants from control participants, the sensitivity and specificity scores were 0.70.
Go Hits
Regarding the number of Go Hits in the Standard condition, the one-factor ANOVA (Group) revealed a significant effect of this factor (F (2, 49) = 4.0; p = 0.002), which was significantly larger in the Control and sdaMCI groups than in the mdaMCI group (see Table 2). Cohen’s d values for the post-hoc comparisons were as follows: (1) Control versus mdaMCI, d = 1.26; (2) sdaMCI versus mdaMCI, d = 0.58; and (3) sdaMCI versus Control, d = 0.41. For this parameter, three ROC curves reached the minimum threshold value of 0.65 in the sensitivity and specificity scores: (1) for discriminating mdaMCI participants from the Control and sdaMCI groups, the sensitivity was 0.80 and the specificity, 0.86; (2) for discriminating of mdaMCI from sdaMCI participants, the values were 0.80 and 0.82, respectively; and (3) for discriminating mdaMCI from control participants, sensitivity was 0.80 and specificity was 0.90.
The one factor ANOVA on the Go Hits in the Deviant condition revealed a significant effect of this factor (F (2, 49) = 5.4; p = 0.008), which was significantly larger in the Control than in the mdaMCI group (see Table 2). The sdaMCI group showed intermediate values that were not significantly different from the values obtained for the other groups. The Cohen’s d values for the post-hoc comparisons were as follows: (1) Control versus mdaMCI, d = 1.58; (2) sdaMCI versus mdaMCI, d = 0.65; and (3) sdaMCI versus Control, d = 0.49. For this parameter, three ROC curves also reached the minimum scores: (1) for discriminating mdaMCI participants from the Control and sdaMCI groups, the sensitivity was 0.90 and the specificity, 0.89; (2) for discriminating mdaMCI from sdaMCI participants, the values were 0.90 and 0.82, respectively; and (3) for discriminating mdaMCI from control participants, the sensitivity was 0.90 and specificity 0.95.
Finally, in the Novel condition, the ANOVA on the Go Hits revealed a significant effect of this factor (F (2, 49) = 5.8; p = 0.005), as the Control and sdaMCI groups obtained significantly more correct responses in the Go condition than the mdaMCI group (see Table 2). The Cohen’s d values for the post-hoc comparisons were as follows: (1) Control versus mdaMCI, d = 1.51; (2) sdaMCI versus mdaMCI, d = 0.76; and (3) sdaMCI versus Control, d = 0.39. For this parameter, three ROC curves also reached the minimum scores: (1) for discriminating mdaMCI participants from the Control and sdaMCI groups, the sensitivity was 0.90 and the specificity, 0.81; (2) for discriminating mdaMCI from sdaMCI participants, the values were 0.90 and 0.78, respectively; and (3) for discriminating mdaMCI from control participants, the sensitivity was 0.90 and specificity was 0.85.
ERPs
Go-N2
The two-factor ANOVA (Group×Electrode Position) on the Go-N2 amplitude in the Standard condition revealed a significant effect of the Electrode Position factor (F (2, 98) = 27.7; p≤0.0001), as the value of this parameter was significantly larger at Cz than at Pz and Fz, and at Pz than at Fz (see Fig. 2 and Table 3). In addition, the Go-N2 amplitude showed a marginally significant effect of the Group factor (F (2, 49) = 2.7; p = 0.07), as the amplitude was larger in the Control group than in the sdaMCI group. Given that there were no significant effects or interactions of the Group factor, no Cohen’s d values or ROC curves were obtained for this parameter.
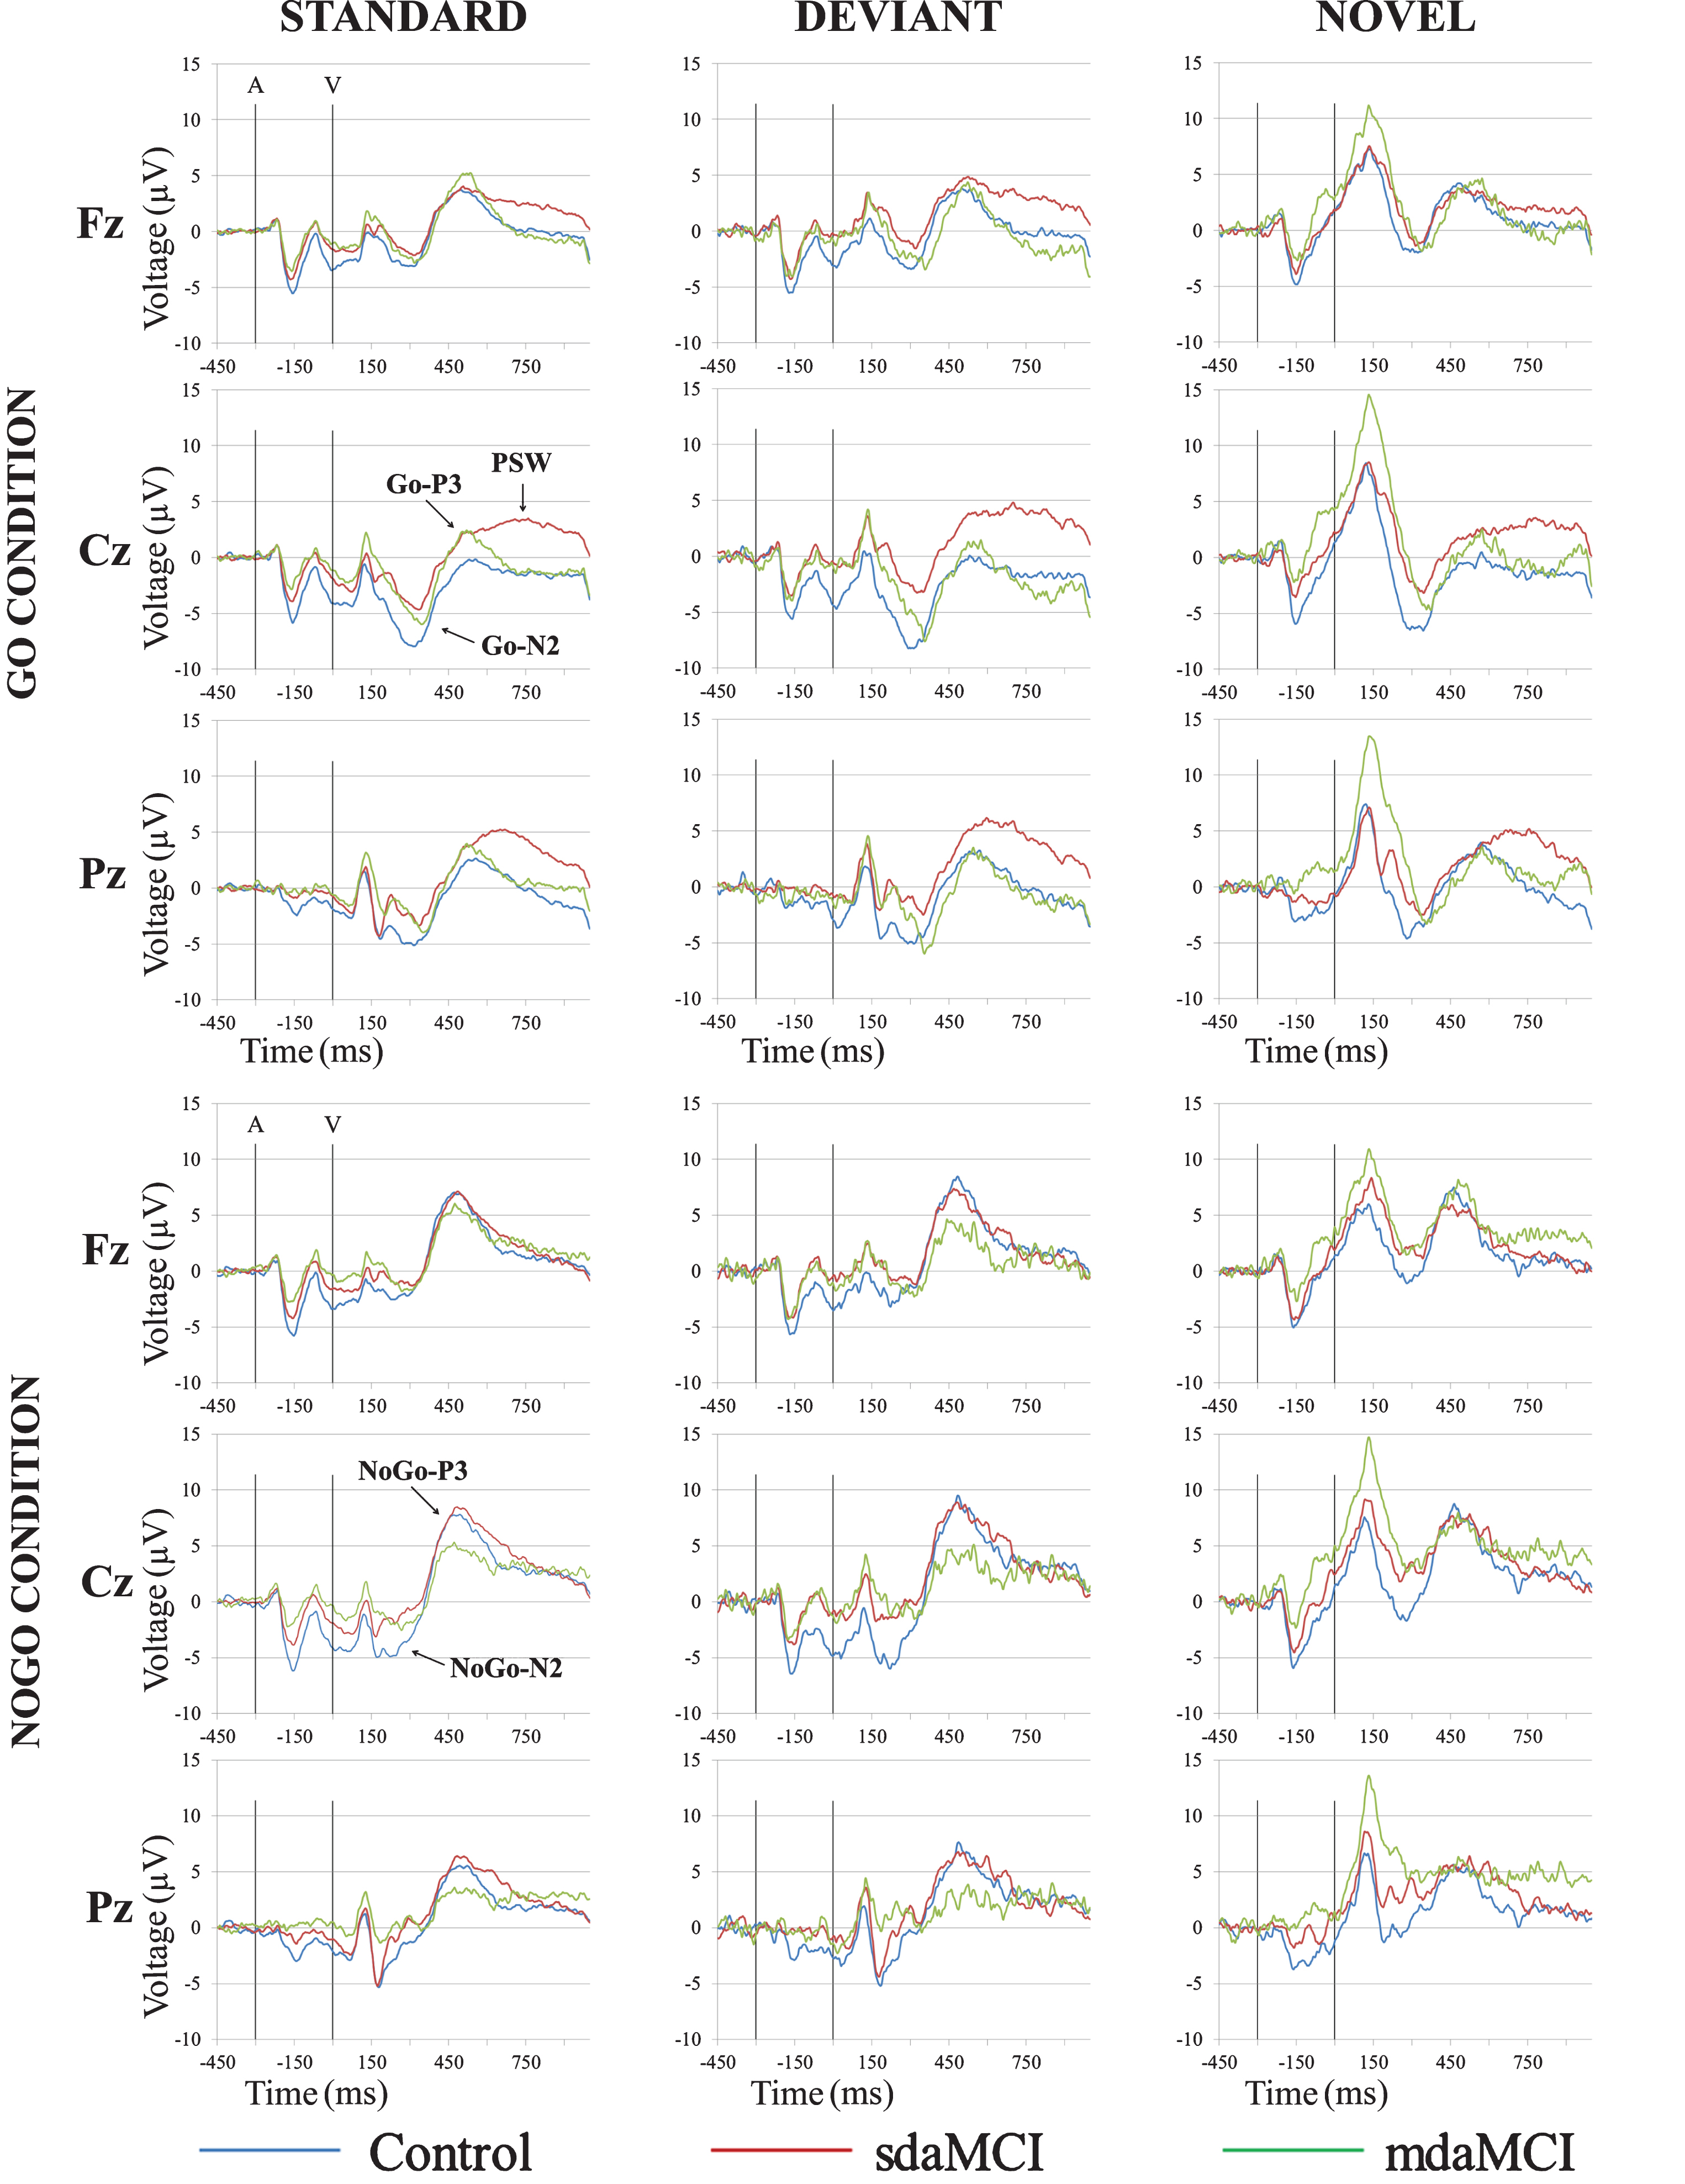
Fig.2
Grand-average event-related potential waveforms, for the Control (blue line), sdaMCI (red line), and mdaMCI (green line) groups, in the Standard-Go, Deviant-Go and Novel-Go conditions (upper panel), and Standard-NoGo, Deviant-NoGo and Novel-NoGo conditions (lower panel), at Fz, Cz, and Pz electrode sites.
The two-factor ANOVA on the Go-N2 amplitude in the Deviant condition revealed significant effects of the Electrode Position (F (2, 90) = 21.1; p≤0.0001; ɛ= 0.823) and Group (F (1, 45) = 11.6; p = 0.001) factors. The Go-N2 amplitude was significantly larger at Cz than at Pz and Fz, and it was also significantly larger at Pz than at Fz (see Fig. 2 and Table 3). The amplitude was also significantly larger in the Control than in the sdaMCI group. The Cohen’s d values for the post-hoc comparisons of the Group effect were as follows: (1) Control versus sdaMCI, d = 0.76; (2) Control versus mdaMCI, d = 0.51; and (3) sdaMCI versus mdaMCI, d = 0.39. Only one ROC curve reached the threshold score of 0.65 score in sensitivity and specificity: for discriminating between sdaMCI and control participants, both sensitivity and specificity values were 0.67.
In the Novel condition, the two-factor ANOVA on the Go-N2 amplitude revealed a significant effect of the Electrode Position factor (F (2, 92) = 17.2; p≤0.0001; ɛ= 0.874), as the amplitude was significantly larger at Cz than at Pz and Fz, and it was significantly larger at Pz than at Fz (see Fig. 2 and Table 3). No significant effects or interactions were observed for the Group factor.
Regarding the Go-N2 latency, the two-factor ANOVA (Group×Electrode Position) in the Standard condition revealed significant effects of the Electrode Position (F (2, 98) = 5.5; p = 0.005) and Group (F (1, 49) = 7.5; p = 0.009) factors. The Go-N2 latency was significantly longer at Fz than at Cz and Pz. In addition, it was significantly longer in the mdaMCI participants than in the controls (see Fig. 2 and Table 3). The Cohen’s d values for the post-hoc comparisons of the Group effect were as follows: (1) Control versus mdaMCI, d = 1.14; (2) sdaMCI versus mdaMCI, d = 0.61; and (3) Control versus sdaMCI, d = 0.33. None of the ROC curves reached the 0.65 cut-off in sensitivity and specificity.
The two-factor ANOVAs in the Deviant (F (2, 90) = 7.0; p = 0.001; ɛ= 0.880) and Novel (F (2, 92) = 7.5; p = 0.001; ɛ= 0.714) conditions revealed a significant effect of the Electrode Position factor, as the Go-N2 latency was significantly longer at Fz than at Cz and Pz (see Fig. 2 and Table 3).
NoGo-N2
The two-factor ANOVA (Group×Electrode Position) on the NoGo-N2 amplitude showed significant effects of the Electrode Position factor in the Standard (F (2, 90) = 5.0; p = 0.009; ɛ= 0.808) and in the Deviant (F (2, 80) = 6.2; p = 0.003; ɛ= 0.857) conditions, as the amplitude was significantly larger at Cz than at Fz and Pz (see Fig. 2 and Table 3). No significant effect or interaction was observed for the Group factor.
In the Novel condition, the two-factor ANOVA on the NoGo-N2 amplitude revealed a significant effect of the Group factor (F (1, 38) = 10.5; p = 0.002), as the amplitude was significantly larger in the Control than in the sdaMCI and mdaMCI groups (see Fig. 2 and Table 3). It was also larger in the sdaMCI than in the mdaMCI group (see Cohen’s d values below and Table 3), although the difference was not significant. The Cohen’s d values for the post-hoc comparisons of the Group effect were as follows: (1) Control versus mdaMCI, d = 1.22; (2) Control versus sdaMCI, d = 0.79; and (3) mdaMCI versus sdaMCI, d = 0.64. For this parameter, ten ROC curves reached the 0.65 cut-off scores in sensitivity and specificity for 5 types of discriminations: (1) for discriminating the sdaMCI and mdaMCI from the Control group, the sensitivity score was 0.69 and the specificity score was 0.72 at the Fz electrode position, and 0.72 and 0.75, respectively, at the Cz electrode position; (2) for discriminating the sdaMCI from the Control group, the scores of sensitivity and specificity were 0.67 and 0.69 at Fz, 0.72 and 0.75 and Cz, and 0.67 and 0.69 at Pz; (3) for discriminating the mdaMCI group from the Control group, the scores were 0.86 and 0.81 at Fz, and 0.71 and 0.88 at Cz; (4) for discriminating the sdaMCI from the mdaMCI group, the scores were 0.72 and 0.71 at Cz; and (5) for discriminating the mdaMCI group from the Control and sdaMCI groups, the sensitivity and specificity scores were 0.86 and 0.65 at Fz, and 0.71 and 0.80 at Cz.
Regarding the NoGo-N2 latency, the two-factor ANOVA (Group×Electrode Position) did not reveal any significant effects or interactions in any of the three conditions.
Go-P3
The two-factor ANOVAs (Group×Electrode Position) on the Go-P3 amplitude revealed a significant effect of the Electrode Position factor in the Standard (F (2, 96) = 11.9; p≤0.0001), Deviant (F (2, 82) = 7.6; p = 0.001; ɛ= 0.781) and Novel (F (2, 86) = 4.3; p = 0.016; ɛ= 0.860) conditions, in all three groups. This parameter was significantly larger at Fz and Pz that at the Cz electrode location (see Fig. 2).
The two-factor ANOVAs on the Go-P3 latency in the Standard (F (2, 96) = 4.9; p = 0.01; ɛ= 0.591) and Deviant (F (2, 82) = 13.6; p≤0.0001) conditions showed significant effects of the Electrode Position factor, as the latency was significantly longer at Pz than at Fz in the Standard condition, and significantly longer at Pz and Cz than at Fz in the Deviant condition. There were no other significant results regarding the Go-P3 latency.
NoGo-P3
The two-factor ANOVAs (Group×Electrode Position) on the NoGo-P3 amplitude revealed significant effects of the Electrode Position factor in the Standard F (2, 90) = 9.0; p≤0.0001; ɛ= 0.779, Deviant (F (2, 82) = 7.3; p = 0.001) and Novel (F (2, 72) = 10.4; p≤0.0001) condition. The NoGo-P3 amplitude was significantly larger at Cz than at Fz and Pz in all three conditions (see Fig. 2).
The two-factor ANOVAs on the NoGo-P3 latency for the Standard, Deviant, and Novel conditions did not reveal any significant effects or interactions.
Late PSW
W1 (700–800 ms post-visual stimulus): In the first window (W1; 700–800 ms post-visual stimulus), the ANOVA for the Standard condition revealed a significant effect of the Electrode Position (F (2, 102) = 5.9; p = 0.004; ɛ= 0.803) and Group (F (1, 51) = 3.3; p = 0.044) factors, and of the Electrode Position×Group (F (4, 102) = 2.4; p = 0.05) interaction. The mean PSW amplitude was significantly larger at Fz and Pz than at Cz in the Control group, significantly larger at Pz than at Fz in the sdaMCI group, and significantly larger at Pz than at Cz in the mdaMCI group. In addition, this parameter was significantly larger in the sdaMCI group than in the Control and mdaMCI groups at the Cz electrode (see Fig. 2). The Cohen’s d values for the post-hoc comparisons of the Group effect at Cz were as follows: (1) mdaMCI versus sdaMCI, d = 0.88; (2) Control versus sdaMCI, d = 0.84; and (3) Control versus mdaMCI, d = 0.04. For this parameter, three ROC curves reached the sensitivity and specificity scores of 0.65: (1) for discriminating between the sdaMCI and mdaMCI groups, the sensitivity score was 0.91, and the specificity score was 0.67; (2) for discriminating the sdaMCI from the Control group, the scores were 0.68 and 0.65; and (3) for discriminating the mdaMCI group from the Control and sdaMCI groups, the scores were 0.68 and 0.72, respectively (see Fig. 2).
In the Deviant condition, the two-factor ANOVA on the PSW amplitude in W1 revealed significant effects of the Electrode Position (F (2, 102) = 4.9; p = 0.009; ɛ= 0.836) and Group (F (2, 51) = 4.6; p = 0.015) factors, as well as of the Electrode Position×Group (F (4, 102) = 3.1; p = 0.018) interaction. In the Control and mdaMCI groups, this parameter was significantly larger at Fz and Pz than at Cz. In addition, it was significantly larger in the sdaMCI group than in the Control and mdaMCI groups at Cz (a similar, but non-significant trend was observed at Pz; see Fig. 2). The Cohen’s d values for the post-hoc comparisons of the Group effect at Cz were as follows: (1) mdaMCI versus sdaMCI, d = 1.07; (2) Control versus sdaMCI, d = 1.00; and (3) Control versus mdaMCI, d = 0.15. For this parameter, three ROC curves also reached the sensitivity and specificity scores of 0.65: (1) for discriminating between the sdaMCI and mdaMCI groups, the sensitivity score was 0.95, and the specificity score was 0.69; (2) for discriminating the sdaMCI from the Control group, the scores were 0.91 and 0.65; and (3) for discriminating the mdaMCI group from the Control and sdaMCI groups, the scores were 0.91 and 0.66, respectively.
Finally, in the Novel condition, the ANOVA on the PSW mean amplitude in W1 revealed significant effects of the Electrode Position (F (2, 96) = 6.7; p = 0.002; ɛ= 0.067) and Electrode Position×Group (F (4, 96) = 3.4; p = 0.013) interaction. The amplitude was significantly larger at Fz and Pz than at Cz in the Control group, significantly larger at Pz than at Cz and Fz in the sdaMCI group, and significantly larger at Pz than at Cz in the mdaMCI group (see Fig. 2).
W2 (800–900 ms post-visual stimulus): In the second window (W2; 800–900 ms post-visual stimulus) the two-factor ANOVA in the Standard condition revealed significant effects of the Group factor (F (2, 51) = 3.8; p = 0.029) and of the Electrode Position×Group interaction (F (4, 102) = 2.7; p = 0.035). The PSW mean amplitude in W2 in this condition was significantly larger at Fz than at Cz in the Control group, and it was significantly larger at Pz than at Cz in the mdaMCI group. This parameter was also significantly larger in the sdaMCI group than in the mdaMCI and Control groups at Cz, and significantly larger in the sdaMCI than in the Control group at Pz (see Fig. 2). The Cohen’s d values for the post-hoc comparisons of the Group effect at Cz were as follows: (1) mdaMCI versus sdaMCI, d = 0.91; (2) Control versus sdaMCI, d = 0.96; and (3) Control versus mdaMCI, d = 0.02. The Cohen’s d values for the post-hoc comparisons of the Group effect at Pz were as follows: (1) mdaMCI versus sdaMCI, d = 0.79; (2) Control versus sdaMCI, d = 0.57; and (3) Control versus mdaMCI, d = 0.17.
For this parameter at the Cz location, three ROC curves reached the 0.65 score threshold: (1) for discriminating the sdaMCI from the mdaMCI group, the sensitivity and specificity scores were 0.86 and 0.67, respectively; (2) for discriminating the sdaMCI from the Control group, the scores were 0.73 and 0.65; and (3) for discriminating the sdaMCI group from the Control and mdaMCI groups, the scores were 0.68 and 0.73. For this parameter at the Pz location, one ROC curve reached the 0.65 scores: for disciminating the sdaMCI group from the Control group, the sensitivity score was 0.73, and the sensitivity score was 0.70.
For the W2, in the Deviant condition, the two-factor ANOVA on the PSW amplitude revealed significant effects of the Group factor and of the Electrode Position×Group interaction. This parameter was significantly larger at Fz than at Cz in the Control group, and significantly larger at Fz and Pz than at Cz in the mdaMCI group. In addition, it was significantly larger in the sdaMCI than in the mdaMCI group at Fz, and significantly larger in the sdaMCI group than in the Control and mdaMCI groups at Cz and Pz (Fig. 2). The Cohen’s d values for the post-hoc comparisons of the Group effect at Fz were as follows: (1) mdaMCI versus sdaMCI, d = 0.77; (2) Control versus sdaMCI, d = 0.71; and (3) Control versus mdaMCI, d = 0.23. Cohen’s d values for the post-hoc comparisons of the Group effect at Cz were: (1) mdaMCI versus sdaMCI, d = 1.17; (2) Control versus sdaMCI, d = 1.15; and (3) Control versus mdaMCI, d = 0.23. The Cohen’s d values for the post-hoc comparisons of the Group effect at Pz were as follows: (1) sdaMCI versus Control, d = 0.86; (2) sdaMCI versus mdaMCI, d = 0.76; and (3) Control versus mdaMCI, d = 0.08.
For the PSW amplitude in W2 in the Deviant condition, three ROC curves reached the 0.65 minimum threshold of sensitivity and specificity scores at Fz: (1) for discriminating the sdaMCI group from the mdaMCI group, the sensitivity score was 0.77, and the specificity score was 0.83; (2) for discriminating the sdaMCI from the Control group, the scores were 0.77 and 0.75, respectively; and (3) for discriminating the sdaMCI group from the mdaMCI and Control groups, the scores were 0.77 and 0.78, respectively. At the Cz location, 3 ROC curves also reached the minimum scores: (1) for discriminating the sdaMCI from the Control group, the scores were 0.77 and 0.80; (2) for discriminating the sdaMCI from the mdaMCI group, the scores were 0.82 and 0.75; and (3) for discriminating the sdaMCI from the mdaMCI and Control groups, the scores were 0.77 and 0.79. Finally, one ROC curve reached the minimum scores at the Pz location: for discriminating the sdaMCI from the Control group, the scores were 0.77 and 0.70.
In the Novel condition, the two-factor ANOVA for this parameter showed a significant effect of the Electrode Position×Group interaction (F (4, 96) = 4.0; p = 0.004), as this parameter was significantly larger at Fz than at Cz in the Control group.
W3 (900–1000 ms post-visual stimulus): The two-factor ANOVAs (Group×Electrode Position) on the mean PSW amplitude in the third window (W3) did not reveal any significant effects or interactions in the Standard and Novel conditions. In the Deviant condition, the ANOVA on this parameter revealed significant effects of the Group factor (F (2, 51) = 4.9; p = 0.011) and the Electrode Position×Group interaction (F (4, 102) = 3.5; p = 0.01). The PSW amplitude was significantly larger at Fz than at Cz and Pz in the Control group. In addition, it was significantly larger in the sdaMCI than in the Control and mdaMCI groups at Cz, and significantly larger in the sdaMCI than in the Control group at Pz (Fig. 2). The Cohen’s d values for the post-hoc comparisons of the Group effect at Cz were as follows: (1) mdaMCI versus sdaMCI, d = 1.05; (2) Control versus sdaMCI, d = 1.05; and (3) Control versus mdaMCI, d = 0.14. The Cohen’s d values for the post-hoc comparisons of the Group effect at Pz were as follows: (1) sdaMCI versus Control, d = 0.92; (2) sdaMCI versus mdaMCI, d = 0.70; and (3) Control versus mdaMCI, d = 0.07.
For this parameter at Cz, in the Deviant condition, three ROC curves reached the 0.65 minimum scores: (1) for discriminating the sdaMCI group from the Control group, the sensitivity and specificity scores were 0.73 and 0.75, respectively; (2) for discriminating the sdaMCI from the mdaMCI group, the scores were 0.68 and 0.75, respectively; and (3) for discriminating the sdaMCI group from the Control and mdaMCI groups, the scores were 0.73 and 0.72. For the PSW amplitude at Pz, in the Deviant condition, two ROC curves reached the minimum scores: (1) for discriminating the sdaMCI group from the Control group, the scores were 0.68 and 0.70, respectively; and (2) for discriminating the sdaMCI group from the Control and mdaMCI groups, the scores were 0.68 and 0.66.
ROC curves by type of diagnosis –combinations of markers
From the parameters whose ROC curves were listed in the previous section, only those that reached the 0.70 value in sensitivity and specificity for one type of diagnosis were taken into account for combinations of parameters, in order to improve the diagnostic value of the parameters on their own (see Table 4).
Eight parameters (see in Table 4, upper panel) reached the 0.70 minimum scores of sensitivity and specificity for discriminating between mdaMCI and control participants. The combination of these parameters that showed the highest sensitivity and specificity scores was the combination of the Go Hits in the Deviant and in the Novel conditions (sensitivity = 0.90, specificity = 1.00; see Table 4, lower panel).
For discriminating between the mdaMCI group and the Control and sdaMCI groups together, four parameters reached the 0.70 minimum sensitivity and specificity scores (see in Table 4, upper panel). The combination of parameters did not exceed the sensitivity and specificity scores of the isolated parameters. Hence, the best parameter for this discrimination were the Go Hits in the Deviant condition (sensitivity = 0.90, specificity = 0.89).
Six parameters were able to distinguish the sdaMCI group from the Control group, reaching the 0.70 minimum scores (Table 4, upper panel). The combination of the mean amplitude of the PSW in window 2 in the Deviant condition at Fz with the same parameter at Cz improved the sensitivity and specificity scores of the individual parameters (sensitivity = 0.77, specificity = 0.82; Table 4, lower panel).
Six parameters were able to distinguish the mdaMCI from the sdaMCI group, reaching the minimum sensitivity and specificity scores (Table 4, upper panel). However, the combinations of the parameters did not reach the same levels of sensitivity and specificity as the parameters by themselves. Hence, the best parameter for this differentiation was the number of Go Hits in the Deviant condition (sensitivity = 0.90, specificity = 0.82).
Finally, only one parameter reached the minimum score of 0.70 for discriminating between the Control group and the sdaMCI and mdaMCI groups, the NoGo-N2 amplitude in the Novel condition at Cz (sensitivity = 0.72, specificity = 0.75; Table 4, upper panel). Hence, the combinations of parameters were not tested.
DISCUSSION
The mdaMCI participants obtained worse overall execution than the Control group, while the sdaMCI participants showed intermediate (but not significantly different) scores. Specifically, the mdaMCI adults showed longer RTs and fewer correct responses (Go Hits), than the control participants. These results are consistent with the findings of previous studies [8, 10, 58], although other authors did not find such differences (e.g., [84]). Hence, the behavioral data showed the expected gradation reflecting the severity of the aMCI impairment [16, 17], and it was better in the Control than in the mdaMCI group, in accordance with previous results [71].
Moreover, in the Go condition the behavioral parameters proved to be suitable markers of the aMCI states. The RTs were able to distinguish the mdaMCI from control participants, and from both control and sdaMCI participants, with acceptable sensitivity and specificity (e.g., sensitivity = 0.90, specificity = 0.70, in the Standard condition, see “RTs” section above). The number of correct responses also enabled the mdaMCI to be distinguished from the sdaMCI group, and the mdaMCI from the Control group with all the sensitivity and specificity scores exceeding the 0.80 cut-off value (Standard and Deviant conditions). Indeed, the Go Hits in the Deviant condition (see Table 4) was the best parameter for differentiating between the mdaMCI and the sdaMCI group (sensitivity = 0.90, specificity = 0.82) and between the mdaMCI group and the sdaMCI and Control groups together (sensitivity = 0.90, specificity = 0.89). In addition, the combined Go Hits in the Deviant and Novel conditions was the parameter that differentiated best between mdaMCI and control participants, with 0.90 and 1.00 as sensitivity and specificity scores, respectively.
In addition to poorer execution, the mdaMCI participants also showed longer Go-N2 latencies than the Control group, with the sdaMCI participants showing intermediate (although non-significant) values, more similar to those of the latter. It therefore seems that the mdaMCI participants need more time for the conscious evaluation of the target stimulus than the healthy controls. This is consistent with the findings reported by Cespón et al. [10] and with those of most of other studies (longer N2 latency in aMCI than in control adults) that did not differentiate between aMCI subtypes ([26, 53, 62–64]; for a review see [65]).
In our previous study we did not find any differences between aMCI and control participants in the Go-N2 latency; however, it is possible that the similarity between the sdaMCI scores and the control scores masked the differences between mdaMCI and controls [55], which were revealed when the two amnestic subgroups were considered separately.
Both the mdaMCI and sdaMCI participants showed lower NoGo-N2 amplitudes than the control participants, with no differences between aMCI subtypes. Again, this is consistent with our previous findings [55] and may reflect a deficit in response conflict monitoring and/or inhibition processes in both aMCI groups. Good sensitivity and specificity scores were obtained for the Novel condition for almost every type of diagnosis (see the “NoGo-N2” section above, and Table 4).
In addition to the intermediate execution scores between the Control and mdaMCI groups, and to the lower NoGo-N2 amplitudes than in the Control group (and similar to the mdaMCI group), the sdaMCI group also showed two unexpected and possibly related effects: (1) this group showed lower Go-N2 amplitudes than the Control group, with intermediate results for the mdaMCI participants; and (2) the sdaMCI participants showed a late positive slow wave (PSW) that did not appear in most of the mdaMCI and Control groups. This pattern seems to indicate that the sdaMCI participants have some deficit in the allocation of processing resources for the evaluation of the Go stimulus (Go-N2), while they perform some additional operations after categorization of the target stimulus. The slow waves have been interpreted as reflecting serial decisions that follow target detection [85, 86], or even as the neural correlate of more sustained and effortful attentional allocation and more elaborate processes [87, 88]. It is possible that sdaMCI participants can implement these additional operations as a compensatory mechanism that allows them to maintain acceptable execution levels.
As stated in the introduction, most studies involving the Go-N2 amplitude did not find any differences between groups (e.g., [58, 62]). However, with this same task, we had already observed lower amplitudes in the aMCI than in the Control group [55], indicating that the A-V task seems to be able to capture some differences that other tasks do not (e.g., [10, 58, 62, 64, 89]), including other Go/NoGo tasks [51]. This parameter showed acceptable sensitivity and specificity (both 0.67) for distinguishing the sdaMCI from the Control group.
In a recent study, we found that sdaMCI participants seem to take longer than the mdaMCI and control adults to select the appropriate response (longer sLRP peak latency in the former), while their performance was similar to the latter and better than for the mdaMCI group [71]. This effect linked with the lower Go-N2 amplitude observed in the sdaMCI group (than in the Control group) may indicate deficits in the initial conscious evaluation by these participants of the target stimulus that might be somehow compensated for by additional processing of the stimuli and slower selection of the correct response, allowing normal levels of execution in the task to be reached.
In accordance with the observation that the PSW was present in most of the sdaMCI adults, while absent in most of the mdaMCI and control adults, the mean amplitude of this component was found to be a potential biomarker for distinguishing sdaMCI participants from both control and mdaMCI participants (see Table 4).
Finally, neither the Go-P3 nor the NoGo-P3 parameters showed any significant effects or interactions of the group factor, as previously suggested [55].
In conclusion, the mdaMCI group showed behavioral and cognitive decline relative to the sdaMCI and control participants, reflected in longer reaction times and fewer correct responses. However, the sdaMCI participants showed a different neural pattern that may have allowed them to maintain levels of execution similar to the healthy controls, although with longer RTs. In fact, the sdaMCI participants seem to be in an intermediate state between healthy aging and mdaMCI, being able to implement some compensatory neural mechanisms (indexed by the PSW) while already showing declines with respect to the healthy participants but not yet equal to those showed by mdaMCI participants. These different neural patterns may be good tools to improve the diagnosis of the sdaMCI and mdaMCI syndromes.
In addition, several markers were identified for each aMCI subtype, with the number of correct responses being the best parameter for distinguishing the mdaMCI group from the other two groups (alone or together), and the mean PSW amplitude being the best parameter for distinguishing the sdaMCI participants from the control adults and from the control and mdaMCI together. These results show that behavioral and ERP parameters measured in the AV task may be potentially useful tools for diagnosing the amnestic subtypes of MCI.
It is worth noting that the sample used in this study should be enlarged in future works to ensure the robustness of the results and potential aMCI markers presented here. Besides, future studies should include groups of participants with other diseases that can be confounded with aMCI (for example, depression) to ensure that the markers proposed for the sdaMCI and mdaMCI syndromes can really be potentially useful in a clinical setting in the future.
ACKNOWLEDGMENTS
This study was financially supported by funds from the Spanish Government: Ministerio de Economía y Competitividad (PSI2014-55316-C3-3-R) and from the Galician Government: Consellería de Cultura, Educación e Ordenación Universitaria; axudas para a consolidación e Estruturación de unidades de investigación competitivas do Sistema universitario de Galicia (GPC2014/047).
Authors’ disclosures available online (http://j-alz.com/manuscript-disclosures/17-0369r1).
REFERENCES
[1] | Park DC , Reuter-Lorenz P ((2009) )The adaptive brain: Aging and neurocognitive scaffolding. Annu Rev Psychol 60: , 173–196. |
[2] | Andreasen N , Blennow K ((2005) ) CSF biomarkers for mild cognitive impairment and early Alzheimer’s disease. Clin Neurol Neurosurg 107: , 165–173. |
[3] | Dauwels J , Vialatte F , Cichocki A ((2010) ) Diagnosis of Alzheimer’s disease from EEG signals: Where are we standing? Curr Alzheimer Res 7: , 487–505. |
[4] | Bredesen DE ((2014) ) Reversal of cognitive decline: A novel therapeutic program. Aging (Albany NY) 6: , 707–717. |
[5] | ((1998) ) Consensus report of the Working Group on: “Molecular and Biochemical Markers of Alzheimer’s Disease”. The Ronald and Nancy Reagan Research Institute of the Alzheimer’s Association and the National Institute on Aging Working Group. Neurobiol Aging 19: , 109–116. Erratum in: Neurobiol Aging 19, 285, 1998. |
[6] | Albert MS , DeKosky ST , Dickson D , Dubois B , Feldman HH , Fox NC , Gamst A , Holtzman DM , Jagust WJ , Petersen RC , Snyder PJ , Carrillo MC , Thies B , Phelps CH ((2011) ) The diagnosis of mild cognitive impairment due to Alzheimer’s disease: Recommendations from the National Institute on Aging-Alzheimer’s Association workgroups on diagnostic guidelines for Alzheimer’s disease. Alzheimers Dement 7: , 270–279. |
[7] | Jack CR Jr , Albert MS , Knopman DS , McKhann GM , Sperling RA , Carrillo MC , Thies B , Phelps CH ((2011) ) Introduction to the recommendations from the National Institute on Aging-Alzheimer’s Association workgroup on diagnostic guidelines for Alzheimer’s disease. Alzheimers Dement 7: , 257–262. |
[8] | Cespón J , Galdo-Álvarez S , Díaz F ((2013) ) Electrophysiological correlates of amnestic mild cognitive impairment in a Simon task. PLoS One 8: , e81506. |
[9] | Cespón J , Galdo-Álvarez S , Díaz F ((2015) ) Inhibition deficit in the spatial tendency of the response in multiple-domain amnestic mild cognitive impairment. An event-related potential study. Front Aging Neurosci 7: , 68. |
[10] | Cespón J , Galdo-Álvarez S , Pereiro AX , Díaz F ((2015) ) Differences between mild cognitive impairment subtypes as indicated by event-related potential correlates of cognitive and motor processes in a Simon task. J Alzheimers Dis 43: , 631–647. |
[11] | Lindín M , Correa K , Zurrón M , Díaz F ((2013) ) Mismatch negativity (MMN) amplitude as a biomarker of sensory memory deficit in amnestic mild cognitive impairment. Front Aging Neurosci 5: , 79. |
[12] | Jackson CE , Snyder PJ ((2008) ) Electroencephalography and event-related potentials as biomarkers of mild cognitive impairment and mild Alzheimer’s disease. Alzheimers Dement 4: , 137–143. |
[13] | Vecchio F , Määttä S ((2011) ) The use of auditory event-related potentials in Alzheimer’s disease diagnosis. Int J Alzheimers Dis 2011: , 653173. |
[14] | Petersen RC , Roberts RO , Knopman DS , Boeve BF , Geda YE , Ivnik RJ , Smith GE , Jack CR Jr ((2009) ) Mild cognitive impairment: Ten years later. Arch Neurol 66: , 1447–1155. |
[15] | Farias S , Mungas D , Reed BR , Harvey D , DeCarli C ((2009) ) Progression of mild cognitive impairment to dementia in clinic- vs community-based cohorts. Arch Neurol 66: , 1151–1157. |
[16] | Petersen RC , Negash S ((2008) ) Mild cognitive impairment: An overview. CNS Spectr 13: , 45–53. |
[17] | Bozoki A , Giordani B , Heidebrink JL , Berent S , Foster NL ((2001) ) Mild cognitive impairments predict dementia in nondemented elderly patients with memory loss. Arch Neurol 58: , 411–416. |
[18] | Arnáiz E , Almkvist O , Ivnik RJ , Tangalos EG , Wahlund LO , Winblad B , Petersen RC ((2004) ) Mild cognitive impairment: A cross-national comparison. J Neurol Neurosurg Psychiatry 75: , 1275–1280. |
[19] | Johns EK , Phillips NA , Belleville S , Goupil D , Babins L , Kelner N , Ska B , Gilbert B , Massoud F , de Boysson C , Duncan HD , Chertkow H ((2012) ) The profile of executive functioning in amnestic mild cognitive impairment: Disproportionate deficits in inhibitory control. J Int Neuropsychol Soc 18: , 541–555. |
[20] | Zheng D , Dong X , Sun H , Xu Y , Ma Y , Wang X ((2012) ) The overall impairment of core executive function components in patients with amnestic mild cognitive impairment: A cross-sectional study. BMC Neurol 12: , 138. |
[21] | Brandt J , Aretouli E , Neijstrom E , Samek J , Manning K , Albert MS , Bandeen-Roche K ((2009) ) Selectivity of executive function deficits in mild cognitive impairment. Neuropsychology 23: , 607–618. |
[22] | Alvarez JA , Emory E ((2006) ) Executive function and the frontal lobes: A meta-analytic review. Neuropsychol Rev 16: , 17–42. |
[23] | Lucci G , Berchicci M , Spinelli D , Taddei F , Di Russo F ((2013) ) The effects of aging on conflict detection. PLoS One 8: , e56566. |
[24] | Botvinick MM , Braver TS , Barch DM , Carter CS , Cohen JD ((2001) ) Conflict monitoring and cognitive control. Psychol Rev 108: , 624–652. |
[25] | Amenedo E , Díaz F ((1998) ) Aging-related changes in processing of non-target and target stimuli during an auditory oddball task. Biol Psychol 48: , 235–267. |
[26] | Bennys K , Portet F , Touchon J , Rondouin G ((2007) ) Diagnostic value of event-related evoked potentials N200 and P300 subcomponents in early diagnosis of Alzheimer’s disease and mild cognitive impairment. J Clin Neurophysiol 24: , 405–412. |
[27] | Ritter W , Simson R , Vaughan HG Jr , Friedman D ((1979) ) A brain event related to the making of a sensory discrimination. Science 203: , 1358–1361. |
[28] | Coles MG , Rugg MD ((1996) ) Event-related brain potentials: An introduction. Psychophysiology 33: , 612–613. |
[29] | Donchin E , Coles MG ((1988) ) Is the P300 component a manifestation of context updating? Behav Brain Sci 11: , 357–427. |
[30] | Kutas M , Iragui V , Hillyard SA ((1994) ) Effects of aging on event-related brain potentials (ERPs) in a visual detection task. Electroencephalogr Clin Neurophysiol 92: , 126–139. |
[31] | Verleger R , Jaśkowski P , Wascher E ((2005) ) Evidence for an integrative role of P3b in linking reaction to perception. J Psychophysiol 19: , 165–181. |
[32] | Verleger R , Metzner MF , Ouyang G , Śmigasiewicz K , Zhou C ((2014) ) Testing the stimulus-to-response bridging function of the oddball-P3 by delayed response signals and residue iteration decomposition (RIDE). Neuroimage 100: , 271–280. |
[33] | Jodo E , Kayama Y ((1992) ) Relation of a negative ERP component to response inhibition in a Go/No-go task. Electroencephalogr Clin Neurophysiol 82: , 477–482. |
[34] | Falkenstein M , Hoormann J , Hohnsbein J ((2002) ) Inhibition-related ERP components: Variation with modality, age, and time-on-task. J Psychophysiol 16: , 167–175. |
[35] | Vallesi A , Stuss DT , McIntosh AR , Picton TW ((2009) ) Age-related differences in processing irrelevant information: Evidence from event-related potentials. Neuropsychologia 47: , 577–586. |
[36] | Pfefferbaum A , Ford JM ((1988) ) ERPs to stimuli requiring response production and inhibition: Effects of age, probability and visual noise. Electroencephalogr Clin Neurophysiol 71: , 55–63. |
[37] | Bokura H , Yamaguchi S , Kobayashi S ((2001) ) Electrophysiological correlates for response inhibition in a Go/NoGo task. Clin Neurophysiol 112: , 2224–2232. |
[38] | Jackson SR , Jackson GM , Roberts M ((1999) ) The selection and suppression of action: ERP correlates of executive control in humans. Neuroreport 10: , 861–865. |
[39] | Nakata H , Sakamoto K , Inui K , Hoshiyama M , Kakigi R ((2009) ) The characteristics of No-go potentials with intraepidermal stimulation. Neuroreport 20: , 1149–1154. |
[40] | Nieuwenhuis S , Yeung N , van den Wildenberg W , Ridderinkhof KR ((2003) ) Electrophysiological correlates of anterior cingulate function in a Go/No-go task: Effects of response conflict and trial type frequency. Cogn Affect Behav Neurosci 3: , 17–26. |
[41] | Donkers FC , van Boxtel GJ ((2004) ) The N2 in Go/No-go tasks reflects conflict monitoring not response inhibition. Brain Cogn 56: , 165–176. |
[42] | Smith JL , Smith EA , Provost AL , Heathcote A ((2010) ) Sequence effects support the conflict theory of N2 and P3 in the Go/NoGo task. Int J Psychophysiol 75: , 217–226. |
[43] | Randall WM , Smith JL ((2011) ) Conflict and inhibition in the cued-Go/NoGo task. Clin Neurophysiol 122: , 2400–2407. |
[44] | Beste C , Willemssen R , Saft C , Falkenstein M ((2010) ) Response inhibition subprocesses and dopaminergic pathways: Basal ganglia disease effects. Neuropsychologia 48: , 366–373. |
[45] | Schmiedt-Fehr C , Basar-Eroglu C ((2011) ) Event-related delta and theta brain oscillations reflect age-related changes in both a general and a specific neuronal inhibitory mechanism. Clin Neurophysiol 122: , 1156–1167. |
[46] | Gajewski PD , Falkenstein M ((2013) ) Effects of task complexity on ERP components in Go/Nogo tasks. Int J Psychophysiol 87: , 273–278. |
[47] | Folstein JR , Van Petten C ((2008) ) Influence of cognitive control and mismatch on the N2 component of the ERP: A review. Psychophysiology 45: , 152–170. |
[48] | Watson TD , Newton-Mora M , Pirkle J ((2016) ) Event-related potential correlates of processing alcohol-related pictures in young adult binge drinkers. Am J Drug Alcohol Abuse 42: , 77–87. |
[49] | Barry RJ , Rushby JA ((2006) ) An orienting reflex perspective on anteriorisation of the P3 of the event-related potential. Exp Brain Res 173: , 539–545. |
[50] | Lai CL , Lin RT , Liou LM , Liu CK ((2010) ) The role of event-related potentials in cognitive decline in Alzheimer’s disease. Clin Neurophysiol 121: , 194–199. |
[51] | Mudar RA , Chiang HS , Eroh J , Nguyen LT , Maguire MJ , Spence JS , Kung F , Kraut MA , Hart J ((2016) ) The effects of amnestic mild cognitive impairment on Go/NoGo semantic categorization task performance and event-related potentials. J Alzheimers Dis 50: , 577–590. |
[52] | Frodl T , Hampel H , Juckel G , Bürger K , Padberg F , Engel RR , Möller HJ , Hegerl U ((2002) ) Value of event-related P300 subcomponents in the clinical diagnosis of mild cognitive impairment and Alzheimer’s disease, Wiley Online Library. |
[53] | Papaliagkas V , Kimiskidis V , Tsolaki M , Anogianakis G ((2008) ) Usefulness of event-related potentials in the assessment of mild cognitive impairment. BMC Neurosci 9: , 107. |
[54] | Phillips NA , Chertkow H , Leblanc MM , Pim H , Murtha S ((2004) ) Functional and anatomical memory indices in patients with or at risk for Alzheimer’s disease. J Int Neuropsychol Soc 10: , 200–210. |
[55] | Cid-Fernández S , Lindín M , Díaz F ((2014) ) Effects of amnestic mild cognitive impairment on N2 and P3 Go/NoGo ERP components. J Alzheimers Dis 38: , 295–306. |
[56] | Li X , Shao X , Wang N , Wang T , Chen G , Zhou H ((2010) ) Correlation of auditory event-related potentials and magnetic resonance spectroscopy measures in mild cognitive impairment. Brain Res 1346: , 204–212. |
[57] | Golob EJ , Irimajiri R , Starr A ((2007) ) Auditory cortical activity in amnestic mild cognitive impairment: Relationship to subtype and conversion to dementia. Brain 130: , 740–752. |
[58] | Golob EJ , Johnson JK , Starr A ((2002) ) Auditory event-related potentials during target detection are abnormal in mild cognitive impairment. Clin Neurophysiol 113: , 151–161. |
[59] | Egerházi A , Glaub T , Balla P , Berecz R , Degrell I ((2008) ) [P300 in mild cognitive impairment and in dementia]. Psychiatr Hung 23: , 349–357. |
[60] | Gironell A , García-Sánchez C , Estévez-González A , Boltes A , Kulisevsky J ((2005) ) Usefulness of p300 in subjective memory complaints: A prospective study. J Clin Neurophysiol 22: , 279–284. |
[61] | Zappoli R , Versari A , Arnetoli G , Paganini M , Muscas GC , Arneodo MG , Gangemi PF , Bartelli M ((1991) ) Effect of physiological and pathological aging processes on topographic bit-mapped cognitive evoked potentials in presenile subjects. Acta Neurol (Napoli) 13: , 569–573. |
[62] | López Zunini RA , Knoefel F , Lord C , Dzuali F , Breau M , Sweet L , Goubran R , Taler V ((2016) ) Event-related potentials elicited during working memory are altered in mild cognitive impairment. Int J Psychophysiol 109: , 1–8. |
[63] | Papaliagkas VT , Kimiskidis VK , Tsolaki MN , Anogianakis G ((2011) ) Cognitive event-related potentials: Longitudinal changes in mild cognitive impairment. Clin Neurophysiol 122: , 1322–1326. |
[64] | Missonnier P , Deiber MP , Gold G , Herrmann FR , Millet P , Michon A , Fazio-Costa L , Ibañez V , Giannakopoulos P ((2007) ) Working memory load-related electroencephalographic parameters can differentiate progressive from stable mild cognitive impairment. Neuroscience 150: , 346–356. |
[65] | Howe AS ((2014) ) Meta-analysis of the endogenous N200 latency event-related potential subcomponent in patients with Alzheimer’s disease and mild cognitive impairment. Clin Neurophysiol 125: , 1145–1151. |
[66] | López Zunini RA , Knoefel F , Lord C , Breau M , Sweet L , Goubran R , Taler V ((2016) ) P300 amplitude alterations during inhibitory control in persons with mild cognitive impairment. Brain Res 1646: , 241–248. |
[67] | Ganguli M , Dodge HH , Shen C , DeKosky ST ((2004) ) Mild cognitive impairment, amnestic type: An epidemiologic study. Neurology 63: , 115–121. |
[68] | Lenzi D , Serra L , Perri R , Pantano P , Lenzi GL , Paulesu E , Caltagirone C , Bozzali M , Macaluso E ((2011) ) Single domain amnestic MCI: A multiple cognitive domains fMRI investigation. Neurobiol Aging 32: , 1542–1557. |
[69] | Bobes MA , García YF , Lopera F , Quiroz YT , Galán L , Vega M , Trujillo N , Valdes-Sosa M , Valdes-Sosa P ((2010) ) ERP generator anomalies in presymptomatic carriers of the Alzheimer’s disease E280A PS-1 mutation. Hum Brain Mapp 31: , 247–265. |
[70] | Vos SJ , van Rossum IA , Verhey F , Knol DL , Soininen H , Wahlund LO , Hampel H , Tsolaki M , Minthon L , Frisoni GB , Froelich L , Nobili F , van der Flier W , Blennow K , Wolz R , Scheltens P , Visser PJ ((2013) ) Prediction of Alzheimer disease in subjects with amnestic and nonamnestic MCI. Neurology 80: , 1124–1132. |
[71] | Cid-Fernández S , Lindín M , Díaz F ((2017) ) Stimulus-locked lateralized readiness potential and performance: Useful markers for differentiating between amnestic subtypes of mild cognitive impairment. J Prev Alzheimers Dis 4: , 21–28. |
[72] | Yesavage JA , Brink TL , Rose TL , Lum O , Huang V , Adey M , Leirer VO ((1983) ) Development and validation of a geriatric depression screening scale: A preliminary report. J Psychiatr Res 17: , 37–49. |
[73] | Oldfield RC ((1971) ) The assessment and analysis of handedness: The Edinburgh inventory. Neuropsychologia 9: , 97–113. |
[74] | Lynöe N , Sandlund M , Dahlqvist G , Jacobsson L ((1991) ) Informed consent: Study of quality of information given to participants in a clinical trial. BMJ 303: , 610–613. |
[75] | Lobo A , Saz P , Marcos G , Día JL , De La Cámara C , Ventura T , Morales Así F , Fernando Pascual L , Montañés JA , Aznar S ((1999) ) Revalidation and standardization of the cognition mini-exam (first Spanish version of the Mini-Mental Status Examination) in the general geriatric population. Med Clin (Barc) 112: , 767–774. |
[76] | Benedet Álvarez MJ , Alexandre MA ((1998) ) Test de dizaje verbal españa complutense, Madrid, TEA. |
[77] | Huppert FA , Jorm AF , Brayne C , Girling DM , Barkley C , Beardsall L , Paykel ES ((1996) ) Psychometric properties of the CAMCOG and its efficacy in the diagnosis of dementia. Neuropsychol Dev Cogn B Aging Neuropsychol Cogn 3: , 201–214. |
[78] | Vergara I , Bilbao A , Orive M , Garcia-Gutierrez S , Navarro G , Quintana JM ((2012) ) Validation of the Spanish version of the Lawton IADL Scale for its application in elderly people. Health Qual Life Outcomes 10: , 130. |
[79] | Petersen RC ((2004) ) Mild cognitive impairment as a diagnostic entity. J Intern Med 256: , 183–194. |
[80] | Juncos-Rabadán O , Facal D , Lojo-Seoane C , Pereiro AX ((2013) ) Does tip-of-the-tongue for proper names discriminate amnestic mild cognitive impairment? Int Psychogeriatr 25: , 627–634. |
[81] | Escera C , Alho K , Winkler I , Näätänen R ((1998) ) Neural mechanisms of involuntary attention to acoustic novelty and change. J Cogn Neurosci 10: , 590–604. |
[82] | Gratton G , Coles MG , Donchin E ((1983) ) A new method for off-line removal of ocular artifact. Electroencephalogr Clin Neurophysiol 55: , 468–484. |
[83] | Faul F , Erdfelder E , Buchner A , Lang AG ((2009) ) Statistical power analyses using G*Power 3.1: Tests for correlation and regression analyses. Behav Res Methods 41: , 1149–1160. |
[84] | Staffen W , Ladurner G , Höller Y , Bergmann J , Aichhorn M , Golaszewski S , Kronbichler M ((2012) ) Brain activation disturbance for target detection in patients with mild cognitive impairment: An fMRI study. Neurobiol Aging 33: , 1002.e1–1002.e16. |
[85] | Johnson RJ , Donchin E ((1985) ) Second thoughts: Multiple P3OOs elicited by a single stimulus. Psychophysiology 22: , 182–195. |
[86] | García-Larrea L , Cézanne-Bert G ((1998) ) P3, positive slow wave and working memory load: A study on the functional correlates of slow wave activity. Electroencephalogr Clin Neurophysiol 108: , 260–273. |
[87] | Fabiani M , Karis D , Donchin E ((1990) ) Effects of mnemonic strategy manipulation in a Von Restorff paradigm. Electroencephalogr Clin Neurophysiol 75: , 22–35. |
[88] | Madan CR , Chen YY , Singhal A ((2016) ) ERPs differentially reflect automatic and deliberate processing of the functional manipulability of objects. Front Hum Neurosci 10: , 360. |
[89] | Wang LY , Murphy RR , Hanscom B , Li G , Millard SP , Petrie EC , Galasko DR , Sikkema C , Raskind MA , Wilkinson CW , Peskind ER ((2013) ) Cerebrospinal fluid norepinephrine and cognition in subjects across the adult age span. Neurobiol Aging 34: , 2287–2292. |


