
Dementia Prevalence in a Rural Region of South Africa: A Cross-Sectional Community Study
Abstract
Background:
Dementia is a growing concern for low- and middle-income countries where longevity is increasing and service provision is poor. Global prevalence estimates vary from 2% to 8.5% for those aged 60 years and older. There have been few dementia studies in sub-Saharan Africa, and prevalence data are lacking for South Africa.
Objective:
To conduct a large dementia prevalence study in a low income rural population in South Africa.
Methods:
1,394 Xhosa-speaking community dwellers, aged ≥60 y (mean age±sd 71.3±8.3 y), in three clinic catchment areas, were screened at home. Trained community health workers administered the brief Community Screening Instrument for Dementia (CSID) to participants and informants to assess cognitive and functional capacity. Depressive symptoms were assessed with three questions from the EURO-D.
Results:
The prevalence estimate using published CSID sensitivity/specificity values was 0.8 (95% CI: 0.06–0.09). Using CSID cut-off scores the estimated prevalence was 0.12 (95% CI: 0.10–0.13), with 161 screen-positives. Both methods gave a rate of 0.11 (95% CI: 0.09–0.13) for those over 65 years (n = 1051). 68.6% of participants were female and 69.8% had less than 7 years of education. Dementia risk was associated with older age and symptoms of depression, but not with sex. The association with education was not significant when controlled for by age.
Conclusions:
Dementia prevalence estimates were higher than expected for this low-income rural community. There is a need for increased dementia awareness and feasible support interventions. We also need further studies of regional prevalences, dementia subtypes, and modifiable risk factors in South Africa.
INTRODUCTION
Alzheimer’s disease (AD) and other dementias are a growing public health concern globally. The World Alzheimer Report 2016 estimated that there are approximately 46.8 million people living with dementia worldwide [1]. A greater percentage (58%) of people with dementia are currently living in low- and middle- income countries (LAMIC) and this is expected to rise to 71% by 2050 [2]. This increase is driven by population growth and demographic aging. By contrast, there are new reports of a decline in the incidence of dementia in Europe, possibly due to better management of modifiable lifestyle risk factors [3]. In the US, the prevalence has dropped from 11.6% in 2000 to 8.8% in 2012, the drop being possibly related to increased levels of education [4].
The 10/66 Group reported a four-fold variation in the prevalence of dementia from 2.1% to 8.5% for those aged 60 years or older in 21 Global Burden of Disease regions across the world [5]. A recent meta-analysis confirmed these estimates, with most between 5% and 7% [6]. Rates were highest in Latin America (8.5%) and lowest in four Sub-Saharan African (SSA) regions (2–4%). The reasons for the low prevalences are unclear, but they may be due to the different methods and screening tools used in the studies, or to different biological or environmental risk factors. It may be that milder dementia is under-detected in LAMIC because of low awareness, high levels of support routinely provided to older people, and reluctance to report social and occupational failings to outsiders [7]. However, a more recent SSA study reported a prevalence of 6.4% [8]. A systematic analysis of 11 studies in SSA revealed a broad range of prevalence estimates from 0% to 10.1% [9]. Prevalence was generally higher in urban compared with rural areas.
In South Africa, there has been very limited research with prevalence data published from a few small study samples. A survey of 200 participants conducted in an older urban black community in the Bloemfontein area reported a 6% prevalence of dementia [10]. A small patient-based study of mixed race persons over the age of 65 years [11] reported 8.6% of patients with possible dementia. The recent World Alzheimer’s Report [1] estimated that there were 4.4 million people over the age of 60 years living in South Africa, with approximately 187,000 living with dementia. This number is predicted to rise to 250,000 by 2030, with a concurrent increase in the number of older people (60 years plus) to 7 million.
With increasing numbers of older people, there is a corresponding need to accurately determine not only the burden of dementia in the country but also the resources that are needed to support and care for the affected persons, their families, and carers. This study not only looked at prevalence in this area –the focus of this paper –but also piloted a program of community care and support for affected people and their families. The latter will be the subject of another paper.
Measurement instruments used in epidemiological dementia prevalence studies in SSA have commonly included the Community Screening Instrument for Dementia (CSID) [5], with and without additional measures such as the Five Words Test, animal fluency, 10 word delayed recall test [12], Stick Design Test, and Blessed Dementia Scale with clinical criteria. Other screening protocols included the 10 item semi-structured home interview (CHIF) [13], the MMSE, and the Tygerberg Cognitive Battery [14]. Screening with subsequent diagnosis has been performed as either a one- or two-phase process. The one-phase process requires clinicians to apply diagnostic criteria to all people screened, while the two-phase process only applies diagnostic criteria to those who screen positive in phase one. This 2-phase process is seen to be more affordable and efficient in countries where staff resources and finances are low [8]. The DSM-IV criteria have commonly been used to confirm dementia diagnoses in prevalence studies [15].
The 10/66 Dementia Research Group has reported and validated algorithms [16] for diagnosis using a screening protocol containing the CSID, validated for use in LAMIC worldwide. The CSID, with both a cognitive screen and informant interview to assess change in functional status from normal, is reported to be reliable for dementia detection and suitable for use by non-clinicians. However, the 10/66 screening process generally produces higher prevalence estimates than the clinically applied DSM-IV criteria, possibly due to the detection of early dementia and mild cognitive impairment [17]. A depression questionnaire, EURO-D was shown to be useful in discriminating depression from dementia [18].
We aimed to conduct a large screening study to estimate the prevalence of dementia in a low income rural population in South Africa.
METHODS
A cross-sectional, population survey on dementia prevalence for isiXhosa speaking people 60 years and over was conducted using a brief version of the CSID [19] with participants and their informants. The study was approved by the Faculty of Health Sciences Human Research Ethics Committee, University of Cape Town and the Department of Health, Eastern Cape. Informed consent was obtained from each participant and informant.
This study was conducted through collaboration between three organizations: 1) The University of Cape Town research group with research skills provided the survey tools, data collection training, and statistical expertise; 2) Dementia SA, a non-governmental organization (NGO) with expertise in dementia provided dementia awareness training and resources for the study; 3) The Donald Woods Foundation (DWF), a local NGO which runs a community healthcare program called Health In Every Hut, which is working to promote health in the catchment areas. DWF have expert knowledge about the area, with Community Health Outreach Workers (CHOWs) who assisted with conducting the study.
Setting
The setting for the study was a low socio-economic, rural region with a relatively stable older, Xhosa-speaking population in the Eastern Cape in South Africa. In the recent National Community Survey (2016) the Eastern Cape was shown to have the largest percentage of households considered to be ‘multidimensionally’ poor with the research area, Amatole District, amongst the lowest scoring districts in the province [20]. Eighty percent of the population in the Eastern Cape are Xhosa-speaking. The study area includes three clinic catchment areas with primary health clinics in each area and a government hospital. The area has approximately 9,000 households in the 19,500-strong isiXhosa-speaking community. The demographics have been well characterized by the DWF. DWF provided demographics for those aged ≥60 years and their exact GPS location, which facilitated recruitment for our study. Homes are spread apart on the hills along the roadsides or in the valleys. Public transport is minimal and small local stores sell staple products. People survive on subsistence farming of maize, supplemented with vegetables and occasional meat.
Study population
Participants included rural community dwelling isiXhosa speakers aged 60 years and over. They were required to invite a consenting study partner (friend or relative) who knew them well enough to answer questions about their activities of daily living. Participants did not need to be literate but were required to hear and see sufficiently well to answer questions and undertake cognitive tests.
Sampling and recruitment
A door-to-door method of recruitment, using generated lists of older peoples’ names and their homes’ GPS coordinates, was used. The total number of people ≥60 years was estimated at approximately 2,000 from the DWF database. Precision calculations indicated that an overall sample of 2,000 would allow the estimation of an expected dementia prevalence of 4.5% with a precision of±0.9%. Therefore, we aimed to include all 2,000 participants living in the area to identify at least 90 cases with dementia.
Training of administrators
Participants were screened in their homes by trained CHOWs living locally and employed by DWF. A one-day dementia-awareness training program was presented by a Xhosa-speaking social worker. It was important to explain dementia as an organic condition since beliefs surrounding dementia as being witchcraft and curses were common in the local culture. Thereafter training in delivery of the screening process and data entry into Epidata was provided with laptops issued to each CHOW. Practice in the workshop and then in the field was supervised by the CHOW team leaders, their supervisors, and the study PI. Further details have been described in [21].
Screening tools and data collection methods
We used the brief CSID [19], suitable for use by non-professionals in low resource settings. The brief CSID includes a 7-item cognitive test (providing a cogscore) for the participant and a 6-item activities of daily living informant interview (informant score). The items are extracted from the full CSID which has 33 cognitive items and 26 informant questions. Items were selected using item response theory and Mokken analysis, then tested for diagnostic accuracy against the full version [19].
The screening assessment included: demographics of age (confirmed by date of birth in identity document), sex, and education level; subjective memory complaint question, the brief CSID; 3 questions from the EURO-D for depression [18]. All screening tools had been previously translated and back-translated into isiXhosa, including the information and consent forms. The CSID informant score (maximum = 6, higher score being worse) was subtracted from the CSID cognitive score (maximum = 9, higher score better) to provide the total score. Total scores at a recommended cut-off of 4 and less indicated a dementia-positive screen [19]. We unfortunately did not have a clinician on site able to confirm dementia diagnosis with DSM-IV criteria, thus dementia diagnosis was based on the one-phase screening outcome of the combined participant and informant CSID assessment.
Prevalence calculation
The population at risk was defined as all those people living in the area at the beginning of the study aged ≥60 years. We used two different approaches to the calculation. First, a back-estimation approach based on established estimates of sensitivity (0.95) and specificity (0.90) for the brief CSID, using the gold standard of clinical diagnosis [19]. Our dementia screen positives were identified from their total CSID score being ≤4 and compared against the True positive and True negative numbers calculated from the published formula. (See the Supplementary Material for further details of calculation). This method was repeated for those 65 years and over.
In the second approach, screen positives and screen negatives were again defined as above from the total score cut-offs and compared against a new ‘gold standard’ (True +/True –) that included only screen positives with cogscores <7 and total scores ≤4, as recommended by Prince et al. [19]. The sensitivity and specificity values were then calculated from the data.
RESULTS
Demographics
From the study population screened (n = 1,394), there were 1,382 useable results. The participants included 948 (68.6%) females. The mean age±standard deviation of the total sample was 71.3±8.3 y. Little or no education was reported by 69.8% (level 1), 15.3% had some primary school, 9.4% completed primary school (7 years), 5.1% completed high school (12 years) and 0.4% (n = 6) had post-school education (level 5). Of the men, 37.4% had some formal education, while 26.8% of women had some education.
Screening was terminated before the full study population of 2,000 persons could be screened in the funded timeframe due to strikes in the region, potential participants not being home for visits and other unforeseen difficulties that affected working capacity. Of the 606/2,000 people not screened, 197 were male. There were 7 refusals or ineligible participants. There was no intentional selection bias for screening, as shown by topographical maps (Supplementary Figure 1).
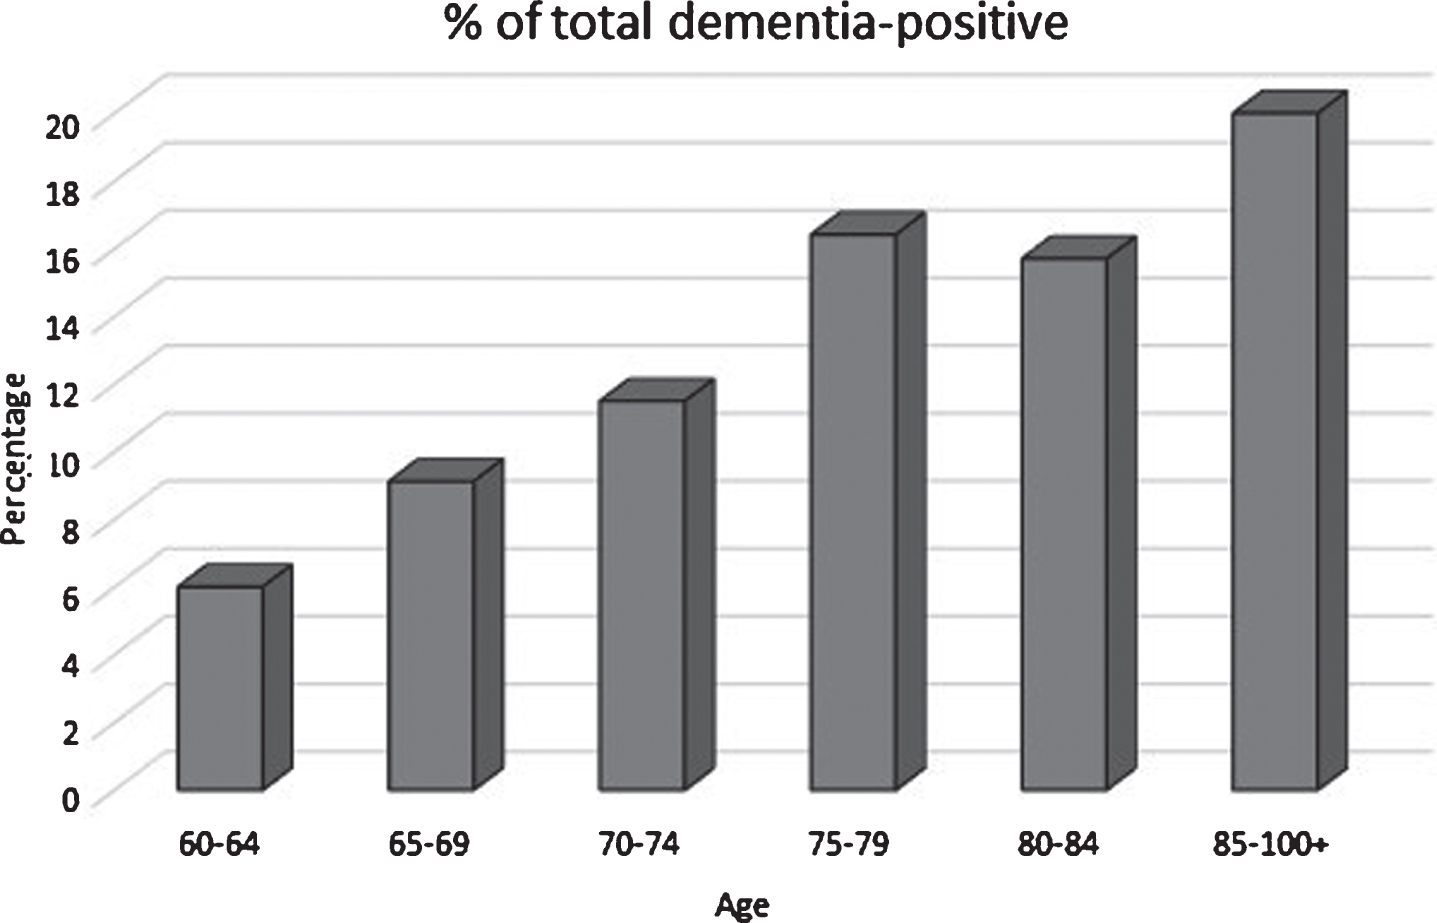
Fig.1
Dementia-positive percentage by age group in the study population.
The distribution of cogscores, informant and total scores was tabulated by education level (1–5) (Table 1). This revealed a significant effect of education on cogscore (p < 0.0001) and on total score (p = 0.0001), but not on the informant score (p = 0.08). There was no difference in cogscore between men and women (p = 0.55).
Table 1
Score distribution by education level; p-values obtained from Kruskal-Wallis tests
| Variable | Levels | n | Min | Q1 | Median | Mean | Q3 | Max | sd | IQR |
| Cogscore | 1 | 965 | 0 | 7.0 | 8.0 | 7.7 | 9.0 | 9 | 1.5 | 2.0 |
| 2 | 211 | 3 | 8.0 | 8.0 | 8.1 | 9.0 | 9 | 1.1 | 1.0 | |
| 3 | 130 | 1 | 8.0 | 9.0 | 8.1 | 9.0 | 9 | 1.4 | 1.0 | |
| 4 | 70 | 4 | 8.0 | 9.0 | 8.3 | 9.0 | 9 | 1.0 | 1.0 | |
| 5 | 6 | 6 | 8.2 | 9.0 | 8.3 | 9.0 | 9 | 1.2 | 0.8 | |
| p < 0.0001 | All | 1,382 | 0 | 7.0 | 8.0 | 7.8 | 9.0 | 9 | 1.4 | 2.0 |
| Inforscore | 1 | 964 | 0 | 0 | 1.0 | 1.3 | 2.0 | 6 | 1.5 | 2.0 |
| 2 | 211 | 0 | 0 | 1.0 | 1.0 | 1.0 | 6 | 1.3 | 1.0 | |
| 3 | 130 | 0 | 0 | 0.0 | 1.0 | 2.0 | 6 | 1.4 | 2.0 | |
| 4 | 69 | 0 | 0 | 0.0 | 0.9 | 1.0 | 5 | 1.3 | 1.0 | |
| 5 | 6 | 0 | 0 | 0.5 | 1.5 | 1.8 | 6 | 2.3 | 1.8 | |
| p < 0.08 | all | 1,380 | 0 | 0 | 1.0 | 1.2 | 2.0 | 6 | 1.5 | 2.0 |
| Totalscore | 1 | 965 | –6 | 5.0 | 7.0 | 6.5 | 8.0 | 9 | 2.6 | 3.0 |
| 2 | 211 | –2 | 6.0 | 8.0 | 7.1 | 9.0 | 9 | 2.0 | 3.0 | |
| 3 | 130 | –2 | 6.0 | 8.0 | 7.0 | 9.0 | 9 | 2.4 | 3.0 | |
| 4 | 70 | 0 | 6.0 | 8.0 | 7.4 | 9.0 | 9 | 1.9 | 3.0 | |
| 5 | 6 | 0 | 7.2 | 8.0 | 6.8 | 8.8 | 9 | 3.4 | 1.5 | |
| p < 0.0001 | all | 1,382 | –6 | 6.0 | 7.0 | 6.7 | 8.0 | 9 | 2.5 | 2.0 |
Q, quartile; sd, standard deviation; IQR, χ-adjusted mean. Level 1: Little or no education; 2: some primary school; 3: completed primary school; 4: completed high school; 5: post-school education.
Prevalence estimates
With sensitivity for dementia and specificity values set as described for the first approach, the dementia prevalence was 0.08 [0.06–0.09], or 8%, with a positive predictive value (PPV) of 0.44 and negative predictive value (NPV) of 1.00 (Table 2a). For the population ≥65 y (n = 1051) the prevalence was 0.11 [0.9–0.13] (Table 2b). The disadvantage of this method is that the actual participants classified as true cases versus non-cases cannot be identified for further analysis. The advantage is that the derived prevalence is based on the large dataset (n = 15,000) with clinical diagnosis (DSM-IV) from the Prince study [19] used to estimate the sensitivity/specificity values, thus giving them good reliability.
Table 2a
Two-way table (Combined score cut-off <5) using sensitivity to calculate prevalence
| True + | True – | Total | |
| Combined <5 | 100 | 129 | 229 |
| Combined >4 | 5 | 1,148 | 1,153 |
| Total | 105 | 1,227 | 1,382 |
| Estimates of prevalence based on sensitivity calculation | |||
| Measure | Estimate | 95% CI: | |
| Apparent prevalence | 0.17 | (0.15; 0.19) | |
| True prevalence | 0.08 | (0.06; 0.09) | |
| Sensitivity | 0.95 | (0.89; 0.98) | |
| Specificity | 0.90 | (0.88; 0.91) | |
| Positive predictive value | 0.44 | (0.37; 0.50) | |
| Negative predictive value | 1.00 | (0.99; 1.00) | |
| Positive likelihood ratio | 9.41 | (7.94; 11.14) | |
| Negative likelihood ratio | 0.06 | (0.02; 0.13) | |
Table 2b
Two-way table using sensitivity to calculate prevalence for those 65 years and over
| True + | True – | Total | |
| Combined <5 | 108 | 95 | 203 |
| Combined >4 | 6 | 842 | 848 |
| Total | 114 | 937 | 1,051 |
| Estimates of prevalence based on sensitivity calculation | |||
| Measure | Estimate | 95% CI: | |
| Apparent prevalence | 0.19 | (0.17; 0.22) | |
| True prevalence | 0.11 | (0.09; 0.13) | |
| Sensitivity | 0.95 | (0.89; 0.98) | |
| Specificity | 0.90 | (0.88; 0.92) | |
| Positive predictive value | 0.53 | (0.46; 0.60) | |
| Negative predictive value | 0.99 | (0.99; 1.00) | |
| Positive likelihood ratio | 9.41 | (7.73; 11.44) | |
| Negative likelihood ratio | 0.06 | (0.02; 0.12) | |
Using the second approach, the prevalence was 0.12 [0.10–0.13], with 1.00 sensitivity and 0.94 specificity; PPV 0.70 and NPV 1.00 (Table 3). For this method, with 229 participants scoring <5 on the total score, 161 were classified as dementia cases from the ‘dementia-pos new’ gold standard used. The second method has the advantage of identifying the individual participants (true cases versus non-cases). It also has a higher PPV than the previous method.
Table 3
Prevalence estimate using ‘D-pos new’
| Two-way table (Combined score cut-off <5 = dementia positive) | |||
| D-pos New + | D-pos New – | Total | |
| Combined <5 | 161 | 68 | 229 |
| Combined >4 | 0 | 1,153 | 1,153 |
| Total | 161 | 1,221 | 1,382 |
| Estimates of prevalence based on D-pos new calculation | |||
| Measure | Estimate | 95% CI; | |
| Apparent prevalence | 0.17 | (0.15; 0.19) | |
| True prevalence | 0.12 | (0.10; 0.13) | |
| Sensitivity | 1.00 | (0.97; 1.00) | |
| Specificity | 0.94 | (0.93; 0.96) | |
| Positive predictive value | 0.70 | (0.64; 0.76) | |
| Negative predictive value | 1.00 | (1.00; 1.00) | |
| Positive likelihood ratio | 17.96 | (14.25; 22.62) | |
| Negative likelihood ratio | 0.00 | (0.00; NaN) | |
Table 4 shows the age distribution by dementia classification. The dementia screen positive (n = 161) mean age was higher than that of the screen negatives at 74.4 y (SD 8.6) versus 70.9 y (8.2), (p < 0.0001).
Table 4
Age distribution by dementia classification
| Variable | Levels | n | Min | q1 | Median | Mean | q3 | Max | sd | IQR | Missing |
| Age | No | 1,221 | 60 | 64 | 70 | 70.9 | 76 | 104 | 8.2 | 12 | 0 |
| Yes | 161 | 60 | 67 | 75 | 74.4 | 80 | 99 | 8.6 | 13 | 0 | |
| P < 0.0001 | all | 1,382 | 60 | 65 | 70 | 71.3 | 76 | 104 | 8.3 | 11 | 0 |
Table 5 show results for demographic factors by dementia classification. This reveals a significant trend for increasing dementia prevalence with older age (p < 0.0005). There was an association of lower educational attainment with increased dementia prevalence (p < 0.01), but no effect of sex (Fisher’s exact test, p = 0.53). The effect of education level was lost when controlled for by age group in a logistic regression analysis (Supplementary Table 1).
Table 5
Table of nominal demographic variables by dementia classification
| Variable | Levels | nNo | % No | nYes | % Yes | nall | % all |
| AgeCat | 60–64 | 311 | 25.5 | 20 | 12.4 | 331 | 23.9 |
| 65–69 | 289 | 23.7 | 29 | 18.0 | 318 | 23.0 | |
| 70–74 | 208 | 17.0 | 27 | 16.8 | 235 | 17.0 | |
| 75–79 | 219 | 17.9 | 43 | 26.7 | 262 | 19.0 | |
| 80–84 | 102 | 8.3 | 19 | 11.8 | 121 | 8.8 | |
| 85+ | 92 | 7.5 | 23 | 14.3 | 115 | 8.3 | |
| p = 0.0005 | all | 1221 | 100 | 161 | 100 | 1382 | 100 |
| Sex | Female | 834 | 68.3 | 114 | 70.8 | 948 | 68.6 |
| Male | 387 | 31.7 | 47 | 29.2 | 434 | 31.4 | |
| p = 0.52 | all | 1221 | 100 | 161 | 100 | 1382 | 100 |
| Education | 1 | 834 | 68.3 | 131 | 81.4 | 965 | 69.8 |
| 2 | 194 | 15.9 | 17 | 10.6 | 211 | 15.3 | |
| 3 | 120 | 9.8 | 10 | 6.2 | 130 | 9.4 | |
| 4 | 68 | 5.6 | 2 | 1.2 | 70 | 5.1 | |
| 5 | 5 | 0.4 | 1 | 0.6 | 6 | 0.4 | |
| p = 0.01 | all | 1221 | 100 | 161 | 100 | 1382 | 100 |
The percentage of the total sample with dementia for those aged 60–64 was 6.0%, 65–69 : 9.1%, 70–74 : 11.5%, 75–79 : 16.4%, 80–84 : 15.9% and 85 and older: 20% (Fig. 1). For those screening dementia-positive, 81.1% had a subjective memory complaint, versus 46.0% screen-negatives (p < 0.0001). The informants’ subjective memory complaint (rating the participants) was 74.0% accurate for dementia-negative participants, but only 54.1% accurate for dementia-positive participants. Dementia-positive participants were twice as likely to report any of three symptoms of depression than dementia-negative participants (63.1% versus 36.1%). 17.1% of dementia-positive participants reported 3/3 symptoms of depression.
DISCUSSION
This is the first large dementia prevalence study reported in South Africa. It was conducted in a low income, rural Xhosa-speaking population where knowledge and awareness of dementia is poor. However, the collaboration between the three organizations was a great advantage to achieving the screening.
The prevalence estimates, determined with a simple brief screening tool, are considerably higher than the estimated 4% in the World Alzheimer Report, 2016 [1]. However, they are not too different from those of small studies in South Africa for persons 60 years and over, including rates of 8.3% in a small mixed ancestry patient sample in Cape Town [11], 6% of 250 Black African community participants in the Free State, [10] and 7.9% in a heterogeneous sample of 140 residents in five care homes in KwaZulu Natal [22]. The two prevalence estimates we report of 8% and 12% for those ≥60 years, and 11% for those ≥65 years need consideration. Although these rates may not be nationally representative, based on our lowest rate, the number of people 60-plus estimated to be living with dementia in South Africa would be 352,000, rather than the 187,000 reported by Alzheimer’s Disease International [1].
The discrepancy between the two different prevalence estimates is difficult to explain, especially as it falls away for those 65 years plus. It may relate to the higher number of participants in the 60–64 age range in our study compared with the data used for the Prince study [19]. However, our age distribution was similar to that of the WHO’s worldwide standard distribution [23]. While very good sensitivity and specificity values for cases and non-cases were achieved, the PPVs were lower. This means that in an unknown population, a proportion of dementia cases could go undetected with the brief CSID. However, with 100% NPV, the likelihood of cognitively normal people screening positive is very low. This indicates that a screening tool using a set cut-off, even including an informant score, is typically not sufficient for diagnosis.
In the first method, where PPV was lowest, it may be that the cut-off point needs adjusting to the local population according to age, education level, or another factor, such as depression score. In the second method, excluding those participants with cogscores above 6 from being classified as dementia-positive regardless of their informant score, left only 68 participants with a true negative classification compared with 121 true negatives derived from the sensitivity/specificity formula (first method).
The full CSID has been shown to be more sensitive to mild dementia than DSM-IV diagnosis [17]. This sensitivity could also occur with the brief version we used, thus increasing the prevalence with the second method. Although both prevalence calculations were based on data analysis from the same study with confirmed clinical diagnoses [19], we consider that the published sensitivity/specificity values appear more likely to give an accurate estimate than the two cut-off scores (second method). However, as the prevalences converged at 11% for those 65 years and over, there is a certain amount of confidence in the second method as well.
It could be argued that the informant report on a person’s functional state is a better estimate of dementia status than a cognitive test score, which is likely to be influenced by various factors at the time of assessment. This may be especially true when the cognitive test is too brief to assess all the cognitive domains affected by dementia. The study informants reported most problems for screen-positives with ‘ability to think and reason’ and ‘remembering what they did the day before’ and least for ‘difficulties with dressing’. Thus, the results are typical of what one expects with dementia. Possibly, many of our participants had only early dementia or mild cognitive impairment. Difficulties with dressing are more likely with moderate to severe dementia. Informant reports may also have been influenced by cultural expectations of older person’s functional abilities [22] or by the age of the informant. Perceptions of difficulty with activities of daily living may be reported as worse by younger informants, but as normal by older informants who may see these difficulties purely as age-related change. This would need further analysis.
The biggest risk factor for dementia is older age. However, lower life expectancy in South Africa might be expected to reduce the prevalence. The risk of dementia due to increased age is complex. It is subject to various contributing factors across the life-course that may differ between those living in high and low-income regions [22].
Another important risk factor may be the exceedingly low number of older people having received formal education. The cognitive reserve and more informed lifestyle choices resulting from education that includes literacy and numeracy are thought to be protective against cognitive decline. We found an initial trend for increasing education level to be negatively associated with dementia. However, when age group and education level were entered in a logistic regression, the association of dementia with education level was no longer evident. Thus, age was the over-riding factor. In general, older people in the study received less formal education than the younger participants. The brief CSID retains the culture-fair properties of the full CSID. It is not skewed with high educationally rated items. No reading, writing, or drawing is required. Items in our study with the lowest scores were typically the 3-word delayed recall and naming the day of the week.
Without the full clinical picture, some dementia positive screens may have been due to reasons other than cognitive impairment. We included an abbreviated depression scale, which should help to discriminate dementia from depression. However, depression may be either a risk factor for, or a consequence of, memory loss [24]. We found that the screen positives had higher self-reports of depressive symptoms than the screen negatives. The prevalence estimate may have been increased by the high numbers of screen positives reporting depression, thus some participants could have depressive pseudo-dementia It is also possible that depressive symptoms were confused with memory problems by some informants [18, 25]. This is an aspect we will explore further when we have more data.
This study was primarily aimed at determining the prevalence of dementia in a low-income rural isiXhosa-speaking community. Together with the additional component of the study aimed at piloting care and support for individuals with dementia and their families, our findings will hopefully raise enough concern to promote public health policies for improving access to services and interventions.
The question of the primary causes or types of dementia has not been addressed here but is the subject of further investigations. Other studies of causes of dementia in LMICs have reported a greater prevalence of vascular dementia than Alzheimer’s disease. This is thought to relate to risk factors such as untreated hypertension, diabetes, hypercholesterolemia, and stroke [26]. These factors may contribute to the dementia prevalence in our sample, but this needs further study Other risk factors for dementia that may be pertinent to investigate in this population would include the ApoE4 genotype, known to increase the risk of Alzheimer’s disease in North America and Europe, but with reported protective effects in Nigeria [27]. Poor nutrition in our study region and reliance on staple, unfortified food, such as maize, may contribute to low levels of vitamin B12, and consequently, high blood levels of homocysteine, which is associated with increased cognitive impairment and Alzheimer’s disease. HIV-positive status in older people also confers a risk for dementia [28]. The prevalence of HIV-associated dementia among those presenting at HIV clinics has been reported to range from 15–30% [29, 30]. It is not known what the contribution of HIV is to the overall prevalence of dementia, especially in older people [28]. Once the primary causes of the different types of dementia have been identified for this population, risk-focused initiatives should be implemented to lower the dementia risk in the future.
A limitation of our study was the lack of clinician resources to provide a DSM-IV diagnosis of dementia. However, the use of recommended sensitivity and specificity values and cut-off scores on the brief CSID helped to estimate the likely number of true positives. Another limitation of our study is that we used the brief CSID rather than the full validated CSID. The 6 informant questions in the brief version were mostly related to cognitive impairment rather than basic functional impairment. Thus, informant reports may have had limited utility for corroborating dementia classification. Screening tests need to be brief for large studies, and this was very advantageous in allowing us to screen a substantial population sample. Although we didn’t achieve the targeted sample size due to funding constraints, the prevalence calculations are still robust. Although the results are not generalizable to the whole South African population, they are probably representative of this large homogeneous, low income, rural community.
Conclusions
In this rural Xhosa-speaking study population, the prevalence estimate of 11% for those aged 65 and over indicates a higher than expected burden of dementia in South Africa. Older age and higher depression scores were associated with dementia, while being female was not. Given that the numbers of people living with dementia is likely to double over the next 15 years in LMIC [1], there is an urgent need to address poor awareness, inadequate services, and care provision for older people in lower socio-economic regions of South Africa. More clinicians, allied health professionals. community health workers, and carers need to be trained in dementia awareness, diagnostic screening, and feasible interventions, especially in rural areas. Potentially modifiable risk factors that contribute to cognitive impairment in this population need to be identified and addressed as this may help reduce the prevalence in the future. This study needs to be replicated in other regions of the country to obtain a more complete picture of the prevalence of dementia in South Africa and of regional prevalence differences that may exist.
ACKNOWLEDGMENTS
We wish to thank the following people and groups for their contributions to the completion of this study: Eastern Cape Department of Health for approval, all the community participants and their chiefs; from DWF: Dr. Matt McNally, Khanyisa Gorata, and the M&E team, the CHOWs, their team leaders and supervisors, Barbara Briceland (administration), Colin Pounds (management), and the DWF drivers. At From UCT: Associate Professor John Joska(old age psychiatrist), Professor Emeritus Margaret Hoffman (clinician in Public Health) for assistance with the study design; study coordinator Katharine James, PhD; from Dementia-SA: Director, Karen Borochowitz for contributing to the study concept, site set-up, and management; Phazisa Mbilini, social worker, for providing the dementia awareness training; and Martin Prince, Professor of Epidemiological Psychiatry at the Institute of Psychiatry (IoP) at King’s College London, co-Director of the Centre for Global Mental Health and coordinator of the 10/66 Dementia Research Group for advice on the study tools.
The funding for this study was provided from the National Lotto Development Foundation Trust through Dementia-SA and from the National Research Foundation, South African Research Chair Initiative (interim 2014) held by CA de Jager, study PI.
Celeste de Jager was supported part time from the funding for the study. There are no other conflicts of interest associated with the study.
Authors’ disclosures available online (http://j-alz.com/manuscript-disclosures/17-0325r2).
SUPPLEMENTARY MATERIAL
[1] The supplementary material is available in the electronic version of this article: http://dx.doi.org/10.3233/JAD-170325.
REFERENCES
[1] | Alzheimer’s Disease International (ADI) ((2016) ) World Alzheimer Report, 2016: Improving healthcare for people living with dementia. |
[2] | Ferri C , Prince M , Brayne C , Brodaty H , Fratiglioni L , Ganguli M , Hall K , Hasegawa K , Hendrie H , Huang Y , Jorm A , Mathers C , Menezes P , Rimmer E , Scazufca M , Alzheimer’s Disease International ((2005) ) Global prevalence of dementia: A Delphi consensus study. Lancet 366: , 2112–2117. |
[3] | Wu YT , Fratiglioni L , Matthews FE , Lobo A , Breteler MM , Skoog I , Brayne C ((2016) ) Dementia in western Europe: Epidemiological evidence and implications for policy making. Lancet Neurol 15: , 116–124. |
[4] | Langa KM , Larson EB , Crimmins EM , Faul JD , Levine DA , Kabeto MU , Weir DR ((2017) ) A comparison of the prevalence of dementia in the United States in 2000 and 2012. JAMA Intern Med 177: , 51–58. |
[5] | Prince M , Acosta D , Chiu H , Scazufca M , Varghese M , 10/66 Research Group ((2003) ) Dementia diagnosis in developing countries: A cross-cultural validation study. Lancet 361: , 909–917. |
[6] | Prince M , Bryce R , Albanese E , Wimo A , Ribeiro W , Ferri CP ((2013) ) The global prevalence of dementia: A systematic review and meta-analysis. Alzheimers Dementia 9: , 63–75. |
[7] | Chandra V , Ganguli M , Pandav R , Johnston J , Belle S , DeKosky ST ((1998) ) Prevalence of Alzheimer’s disease and other dementias in rural India. The Indo-US study. Neurology 51: , 1000–1008. |
[8] | Longdon AR , Paddick SM , Kisoli A , Dotchin C , Gray WK , Dewhurst F , Chaote P , Teodorczuk A , Dewhurst M , Jusabani AM , Walker R ((2013) ) The prevalence of dementia in rural Tanzania: A cross-sectional community-based study. Int J Geriatr Psychiatry 28: , 728–737. |
[9] | Mavrodaris A , Powell J , Thorogood M ((2013) ) Prevalences of dementia and cognitive impairment among older people in sub-Saharan Africa: A systematic review. Bull World Health Organ 91: , 773–783. |
[10] | Van der Poel R , Heyns P ((2012) ) Algorithmic case prediction inrelation to local clinician diagnosis in an indigenous SouthAfrican population. 27th International Conference ofAlzheimer’s Disease International (ADI). London, England. |
[11] | Ben-Arie O , Swartz L , Teggin A , Elk R ((1983) ) The coloured elderly in Cape Town–a psychosocial, psychiatric and medical community survey. Part II. Prevalence of psychiatric disorders. S Afr Med J 64: , 1056–1061. |
[12] | Gureje O , Ogunniyi A , Kola L ((2006) ) The profile and impact of probable dementia in a sub-Saharan African community: Results from the Ibadan Study of Aging. J Psychosom Res 61: , 327–333. |
[13] | Hendrie HC , Lane KA , Ogunniyi A , Baiyewu O , Gureje O , Evans R , Smith-Gamble V , Pettaway M , Unverzagt FW , Gao S , Hall KS ((2006) ) The development of a semi-structured home interview (CHIF) to directly assess function in cognitively impaired elderly people in two cultures. Int Psychogeriatr 18: , 653–666. |
[14] | Roos A , Calata D , Jonkers L , Maritz SJ , Kidd M , Daniels WM , Hugo FJ ((2010) ) Normative data for Tygerberg Cognitive Battery and Mini-Mental Status Examination in a South African population. Compr Psychiatry 51: , 207–216. |
[15] | American Psychiatric Association ((1994) ) Diagnostic and statistical manual of mental disorders, 4th ed. American Psychiatric Association, Washington, DC. |
[16] | Hall KS , Gao S , Emsley CL , Ogunniyi AO , Morgan O , Hendrie HC ((2000) ) Community screening interview for dementia (CSI ‘D’); performance in five disparate study sites. Int J Geriat Psychiatry 15: , 521–531. |
[17] | Paddick SM , Longdon AR , Kisoli A , Dotchin C , Gray WK , Dewhurst F , Chaote P , Kalaria R , Jusabani AM , Walker R ((2013) ) Dementia prevalence estimates in sub-Saharan Africa: Comparison of two diagnostic criteria. Glob Health Action 6: , 19646. |
[18] | Prince MJ , Reischies F , Beekman AT , Fuhrer R , Jonker C , Kivela SL , Lawlor BA , Lobo A , Magnusson H , Fichter M , van Oyen H , Roelands M , Skoog I , Turrina C , Copeland JR ((1999) ) Development of the EURO-D scale–a European, Union initiative to compare symptoms of depression in 14 European centres. Br J Psychiatry 174: , 330–338. |
[19] | Prince M , Acosta D , Ferri CP , Guerra M , Huang Y , Jacob KS , Libre Rodriguez JJ , Salas A , Sosa AL , Williams JD , Hall KS , 10/66 Dementia Group ((2011) ) A brief dementia screener suitable for use by non-specialists in resource poor settings-the cross-cultural derivation and validation of the brief Comunity Screening Instrument for Dementia. Int J Geriatr Psychiatry 26: , 899–907. |
[20] | Statistics South Africa ((2016) ) Community Survey 2016 Provinces at a glance. Pretoria, p. 31. |
[21] | de Jager CA , Pepper K ((2017) ) Building capacity for dementia screening and intervention in low income, rural communities: A collaborative initiative. Int J Afr Nurs Sci 7: , 43–49. |
[22] | Ramlall S , Chipps J , Pillay BJ , Bhigjee AL ((2013) ) Mild cognitive impairment and dementia in a heterogeneous elderly population: Prevalence and risk profile. Afr J Psychiatry (Johannesbg) 16: , doi: http://dx.doi.org/10.4314/ajpsy.v16i6.58. |
[23] | Ahmad O , Boschi-Pinto C , Lopez A , Murray CJL , Lozano R , Inoue M ((2001) ) Age standardization of rates: A new WHO standard. In GPE discussion paper Series: No. 31. World Health Organization, Geneva. |
[24] | Dean K , Oulhaj A , Zamboni G , deJager CA , Wilcock GK ((2014) ) The role of depression in predicting time to conversion to mild cognitive impairment. Am J Geriatr Psychiatry 22: , 727–734. |
[25] | Prince M , Ferri CP , Acosta D , Albanese E , Arizaga R , Dewey M et al. ((2007) ) The protocols for the 10/66 dementia research group population-based research programme. BMC Public Health 7: , 165. |
[26] | Singh M , Raj D , Raina S , Gandhi MK , Chander V ((2016) ) Usingmultistate observational studies to determine role of hypertensionand diabetes as risk factors for dementia. J Neurosci RuralPract 7: , S3–S6. |
[27] | Ogunniyi A , Baiyewu O , Gureje O , Hall K , Unverzagt F , Siu S ((2000) ) Epidemiology of dementia in Nigeria: Results from the Indianapolis-Ibadan study. Eur J Neurol 7: , 485–490. |
[28] | Fogel GB , Lamers SL , Levine AJ , Valdes-Sueiras M , McGrath MS , Shapshak P , Singer EJ ((2015) ) Factors related to HIV-associated neurocognitive impairment differ with age. J Neurovirol 21: , 56–65. |
[29] | Grant I ((2008) ) Neurocognitive disturbances in HIV. Int Rev Psychiatry 20: , 33–47. |
[30] | McArthur JC , Steiner J , Sacktor N , Nath A ((2010) ) Human immunodeficiency virus-associated neurocognitive disorders: Mind the gap. Ann Neurol 67: , 699–714. |


