
Chronic Verubecestat Treatment Suppresses Amyloid Accumulation in Advanced Aged Tg2576-AβPPswe Mice Without Inducing Microhemorrhage
Abstract
Verubecestat is a potent BACE1 enzyme inhibitor currently being investigated in Phase III trials for the treatment of mild-to-moderate and prodromal Alzheimer’s disease. Multiple anti-amyloid immunotherapies have been dose-limited by adverse amyloid related imaging abnormalities such as vasogenic edema (ARIA-E) and microhemorrhage (ARIA-H) observed in human trials and mice. Verubecestat was tested in a 12-week nonclinical study for the potential to exacerbate microhemorrhage (ARIA-H) profiles in 18-22-month-old post-plaque Tg2576-AβPPswe mice. Animals were treated with verubecestat or controls including the anti-Aβ antibody analog of bapineuzumab (3D6) as a positive control for ARIA induction. ARIA-H was measured using in-life longitudinal T2*-MRI and Prussian blue histochemistry at study end. Verubecestat reduced plasma and cerebrospinal fluid Aβ40 and Aβ42 by >90% and 62% to 68%, respectively. The ARIA-H profile of verubecestat-treated mice was not significantly different than controls. Anti-Aβ treatment significantly increased ARIA-H detected by Prussian blue staining; however, anti-Aβ antibody treatment did not impact plaque status. Verubecestat treatment significantly suppressed the accumulation of total levels of brain Aβ40 and Aβ42 and Thioflavin S positive plaque load. Stereological analysis of cortex and hippocampus plaque load similarly revealed significantly reduced area of Aβ immunoreactivity and reduced plaque number in verubecestat-treated animals compared to controls. The absence of elevated ARIA events in verubecestat-treated mice was associated with a significant reduction in the level of accumulated CNS amyloid pathology and brain Aβ peptides; effects consistent with the desired therapeutic mechanism of verubecestat in AD patients. These data will be compared with longitudinal MRI profiles from ongoing clinical trials.
INTRODUCTION
Verubecestat is a potent inhibitor of BACE1-mediated cleavage of the amyloid-β protein precursor (AβPP) that is capable of chronically reducing steady state levels of cerebrospinal fluid (CSF) Aβ peptides by >75% in Alzheimer’s disease (AD) patients [1]. The amyloid hypothesis of AD identifies the central nervous system (CNS) accumulation of Aβ peptides into oligomers and plaques as central to the cause of AD [2, 3] and predicts therapeutic benefit from reducing brain Aβ load in AD patients and the potential to delay onset or prevent AD [3, 4]. BACE1 and its close analog, BACE2 [1], cleave a variety of single transmembrane proteins with evolving biological consequences [5]; however, BACE1 and BACE2 knockout mouse [6] and chronic inhibitor treatment studies to date [1] suggest that chronic BACE inhibition has a low probability to result in the breadth and severity of mechanism based side effects, as observed in preclinical studies and multiple clinical trials of γ-secretase inhibitors [7]. Verubecestat can be chronically administered to AD patients at exposures that achieve substantially greater Aβ lowering (>75%) than that achieved with any prior clinically tested amyloid-directed molecule [1, 7]. As a consequence, chronic verubecestat treatment is anticipated to cause a dramatic shift in the CNS Aβ equilibrium moving from pro-aggregation to favoring clearance of toxic Aβ species thus reducing overall brain amyloid load.
Chronic treatment of AD patients with anti-Aβ immunotherapies such as bapineuzimab [8, 9], gantenerumab [10], or aducanamab [11], that are mechanistically distinct from verubecestat that reduces Aβ synthesis, is associated with increased Amyloid Related Imaging Abnormalities (ARIA) such as vasogenic edema (ARIA-E) or cerebral microhemorrhage (ARIA-H) [12]. Clinical studies of bapineuzimab identified as many as 30% of treated patients to exhibit dose-limiting symptoms of ARIAs which presented as confusion, headache, and issues with gait [11, 13]. The relevant therapeutic mechanism of action(s) of anti-Aβ immunotherapies is not clear; however, the prevailing hypotheses proposes that antibodies bind to native amyloid deposits or aggregates and mobilize their clearance from the parenchyma and vasculature. Depending on the antibody isoform, clearance promoting activity may involve activation of resident innate immune cells; a phenomenon demonstrated for bapineuzimab in vitro and in vivo studies in transgenic AβPP mice [13, 14]. The binding of Aβ-directed immunotherapies to native amyloid deposits coupled to activation of microglia [13] may be key contributors to the destabilization of the amyloid-laden microvessels characteristic of AD brains and resulting in increased vessel permeability (ARIA-E) or rupture leading to ARIA-H [14]. Though early reports of ARIA were associated only with Aβ immunotherapy, later studies identified ARIA in AD patients treated with the γ-secretase inhibitor, avegacestat [15], thus suggesting ARIA-risk may occur with amyloid synthesis inhibitors. On the other hand, the increased use of longitudinal MRI to monitor for ARIA in AD clinical trials revealed many cases of asymptomatic ARIA-H [12], indicating that asymptomatic microhemorrhage may be a more common and symptomatically benign occurrence than previously appreciated. Given that the degree of sustained CNS Aβ lowering targeted in ongoing Phase III clinical trials of verubecestat (NCT01739348; NCT01953601) has heretofore not been tested in humans, AD patient ARIA profiles over the 18-24-month duration of clinical treatment is unknown. To gain a better understand of the profile of ARIA events as a function of treatment mechanism, duration, and baseline ARIA, the FDA required regular MRI monitoring for ARIA in clinical trials longer than 3 months for all amyloid-directed therapies [12]. In addition, the FDA also requested that, prior to initiating clinical studies of greater than 3 months, all new investigational amyloid-directed agents, such as verubecestat [1], should be evaluated in a suitable preclinical animal model for their impact on ARIA-H.
A major challenge to preclinical evaluation of the impact of verubecestat treatment on ARIA is that there are no validated preclinical models that predict ARIA-E or ARIA-H in humans. A consistent observation in prior transgenic AβPP animal studies of various anti-Aβ immunotherapies is that the combination of advanced age and evidence for parenchymal and vascular amyloid deposits correlated with the presence of Prussian blue reactive deposits of ferric iron that result from microhemorrhage [16–20 and references therein]. Pfeifer et al. [16] described the first systematic evaluation of ARIA-H in mice following repeated passive immunization of ∼21-month-old Tg-AβPP23 mice with an amino-terminally directed anti-Aβ antibody. Weekly antibody injections for 5 months significantly reduced plaque load, total brain Aβ42, and vascular Aβ but also significantly increased ARIA-H severity and frequency as detected by Prussian blue histochemistry [16]. The sites of Prussian blue reactivity visually correlated with sites of cerebral amyloid angiopathy (CAA), which is consistent with the hypothesis that CAA is a component of ARIA-H [16]. Tg2576-AβPPswedish mice display amyloid plaques and vascular amyloid deposits comprised mostly of Aβ40, the dominant Aβ isoform found in CAA deposits common to AD patients. In parallel to the accumulation of CAA, aged Tg2576 mice also display increased ARIA-H [17] as detected by increased Prussian blue staining and T2*-MRI measures [20]. Wilcock et al. [17] reported that chronic 3-month treatment of aged Tg2576 mice with antibodies specific for the C-terminus of Aβ40 reduced parenchymal plaque load, increased vascular amyloid reactivity, and reversed cognitive behavioral deficits but also increased the incidence of ARIA-H as qualitatively detected by Prussian blue. Anti-Aβ antibodies that demonstrate specificity for oligomeric forms of Aβ are also capable of increasing the incidence of Prussian blue detected ARIA-H in aged Tg2576 mice [19]. Treatment of post-plaque PD-AβPP mice for up to 36 weeks with the antibody 3D6, the murine analog of bapineuzimab, resulted in increased ARIA-H that was temporally and spatially correlated with removal of vascular amyloid deposits [14, 18]. Luo et al. [20] employed T2*-MRI to mimic the clinical trial setting as a means to noninvasively detect ARIA-H events in mice throughout the 12-18-week dosing period and compared this to monitoring ARIA-H by Prussian blue histochemistry at study termination. Indeed, T2*-MRI-detected ARIA-H events were positively correlated with ARIA-H detected by Prussian blue histochemistry following weekly anti-Aβ treatment [20].
Working from the anti-Aβ immunotherapy literature described above and our own internal pilot studies, we delivered verubecestat, in-diet, to 18-22-month-old post-plaque Tg2576 mice [21] for 12 weeks and quantified ARIA-H using longitudinal T2*-MRI and quantitative Prussian blue histochemistry. The dose of verubecestat achieved exposures that mimicked both the degree and 24-h duration of CSF Aβ lowering targeted in ongoing Phase III clinical studies (∼75%). A group receiving weekly doses of the murine bapineuzumab analog, 3D6, served as a positive control for induction of ARIA-H. In addition to ARIA-H, the impact of verubecestat on parenchymal versus vascular amyloid deposits was measured using quantitative histology using a multi-fluorophore labeling scheme. Among all treatment groups, verubecestat-treated displayed the lowest level of ARIA-H while producing an unambiguous ∼70% reduction of CSF Aβ and sAβPPβ. Importantly, verubecestat treatment halted further plaque accumulation over the 12-week treatment period.
MATERIALS AND METHODS
Animal handling and dosing of verubecestat or antibodies
All procedures for animal handling were approved by our internal IACUC review board. Animals were kept on a 12 h light/dark cycle and were singly housed during the study. Verubecestat dose level was selected based on a prior Tg2576 mouse in-diet dosing study that identified a dose of 110 mg/kg/day delivered in diet to achieve a 70% reduction of brain Aβ40. Diet intake was regularly monitored (Supplementary Figure 1A) and adjusted to maintain the target dose. The 3D6 antibody dose level based on previously completed studies that identified a weekly 20 mg/kg dose delivered as a bolus subcutaneously as capable of increasing microhemorrhage events in aged Tg2576 mice relative to control treated animals following 12 weeks of treatment. The isotype control antibody dose level was chosen to match the 3D6 antibody.
Measurement of verubecestat levels in plasma and brain
Verubecestat levels were determined from plasma samples harvested at baseline and from all animals surviving at the end of the study. Brain levels were measured from the same frozen brain samples used for measurement of Aβ, sAβPPβswe or sAβPPα levels that were harvested following 12 weeks of treatment. Analysis was performed according to validated liquid chromatography separation coupled with mass spectrometry detection methods established under good laboratory practices within the drug metabolism and pharmacokinetic department at MRL, Rahway, NJ, USA.
Measurement of Aβ1 - 40, Aβ1 - 42, sAβPPβswe and sAβPPα levels in plasma, CSF, and brain
Mesoscale Discovery Multi-Array Human (6E10) Aβ40 Ultra-Sensitive Kit or Multi-Array Human (6E10) Aβ42 Ultra-Sensitive Kit were used to measure Aβ levels from the various tissue matrices. The specific methods used for plasma, CSF, and brain are described below. Soluble sAβPPβswe and sAβPPα were measured using a custom Mesoscale discovery duplex sAβPPβswe and sAβPPα assay as described below. Measurement of plasma Aβ levels in samples from 3D6 or isotype control-treated mice required disruption of antibody: Aβ peptide complexes. Plasma was first mixed with 5M guanidine-HCl/50 mMTris pH 8.0 at a 1:5 ratio (plasma to guanidine) and incubated for 4 h at room temperature followed by storage at 4°C overnight. Guanidine-denatured plasma samples were then analyzed in duplicate at a 1:20 dilution along with synthetic human Aβ1 - 40 or Aβ1 - 42 peptide standards. This dilution of guanidine denatured plasma eliminated guanidine interference in the immunoassays. Mesoscale immunoassays were performed according to the manufacturer’s recommended protocol and were read on a Mesoscale Discovery Sector Imager 6000 (Mesoscale Discovery).
Due to limited quantities of CSF obtained from aged mice, 1 μl of visually clear CSF was analyzed from each animal for each target analyte at a 1:25 dilution (n = 5 for baseline; n = 8 for vehicle control diet and n = 11 for verubecestat-treated mice). Synthetic human Aβ1 - 40 or Aβ1 - 42 peptide standards were analyzed in parallel. Mesoscale assays were performed according to the manufacturer’s recommended protocol and were read on a Discovery Sector Imager 6000 (Mesoscale Discovery).
Total brain Aβ40 and Aβ42 levels were determined by Guanidine-HCl extraction of sucrose/Tris tissue homogenates. Homogenates were prepared from a brain slice cut on the sagittal plane from one half of each frozen brain sample. This sample contained all brain major regions including cortex and hippocampus and was homogenized in 500 μl of sucrose buffer. A portion of sucrose homogenate was extracted in guanidine buffer (3.3 M final) and insoluble material was removed by centrifugation at 100,000x g for 45 min. Samples were assayed at a dilution of either 1:5000 (Aβ40) or 1:125 (Aβ42) along with synthetic human Aβ1 - 40 or Aβ1 - 42 peptide standards. Mesoscale assays were performed according to the manufacturer’s recommended protocol and were read on a Discovery Sector Imager 6000 (Mesoscale Discovery).
Brain guanidine extracts used for Aβ measurements were also analyzed for sAβPPβswe and sAβPPα levels at a 1:100 dilution along with recombinant human sAβPPβswe or sAβPPα standards on a custom formatted Mesoscale duplex assay plate (Mesoscale Diagnostics). Mesoscale assays were performed according to the manufacturer’s recommended protocol and were read on a Mesoscale Discovery Sector imager 6000. For all analytes, electro-chemiluminescence (ECL) data were processed in GraphPad Prism version 5.0 and analyte levels were interpolated from non-linear regression analysis of the standard curves defined by synthetic or recombinant human standards for Aβ1 - 40, Aβ1 - 42, sAβPPβswe, or sAβPPα. All values described herein are corrected for sample dilution and brain levels of Aβ, sAβPPβswe, and sAβPPα were normalized by total protein concentration.
Prussian blue histochemistry
Twenty micron sagittal sections from each brain were mounted on to Vectabond (Vector Laboratories) coated slides (6–8 sections per slide, 2 slides per animal). Slides were washed in deionized water and then placed for 20 min in a working solution of Prussian blue (equal parts 5% potassium ferrocyanide and 5% hydrochloric acid). Slides were again washed in deionized water and then counterstained for 5 min using Nuclear Fast Red. A final series of deionized water washes were performed before dehydration and coverslipping of the slides with Permount (Fisher Chemical). Slides were scanned on an Aperio XT (Leica Biosystems, Germany) digital line scanner at 20x magnification.
Immunofluorescence detection of Aβ40, Aβ42, collagen-IV and Thioflavin S
The remaining half of the frozen brains used for biochemical analysis were cryosectioned at 10 μm thickness (FD Neurotechnologies; Columbia, MD), mounted 3 sections/slide and stored under vacuum at –80°C. Sections were post fixed in 4% paraformaldehyde in PBS at room temperature (RT) for 20 min, rinsed in RT PBS and then incubated for 2 min in 80% formic acid to reveal Aβ antigens. Formic acid pretreatment did not affect anti-collagen-IV antibody detection. Sections were blocked for 2 h at RT in 5% goat serum/0.25% Triton-X100 in PBS. Sections were incubated with biotinylated-mouse-anti-Aβ40 antibody (bi-G210) or biotinylated-mouse-anti-Aβ42 antibody (bi-G2-11) (10 μg/ml final each) and rabbit anti-collagen IV (1:500) (Thermo Scientific) overnight at 4°C followed by washes with PBS. Primary antibodies were detected with avidin-Alexa488 and anti-rabbit-IgG-Alexa594 secondary antibody (Molecular Probes, 1:1000). Brain slices were imaged using an Aperio FL with a 20x objective. One slide containing three slices at 100 μm tissue intervals was scanned for each animal. The number of animals evaluated for each group were n = 7 (baseline), n = 11 (rhxm3D6), n = 12 (isotype control antibody), n = 16 (verubecestat), and n = 11 (vehicle control diet). Images were obtained with line scanning exposure times of b = 0.032, g = 0.04, r = 0.5 (bi-G210/collagen IV) and b = 0.032, g = 0.1, r = 0.5 (bi-G211/collagen IV). The whole brain slice region was manually outlined using ImageScope v11 and Spectrum v11 (Aperio Technologies). The analysis of the outlined region provided total analyzed area (whole brain area), total collagen IV positive area (vessel area), total Aβ40 or Aβ42 area (non-vessel and vessel Aβ), and Aβ area co-localized with collagen IV (vessel Aβ) using a custom Object Co-localization FL algorithm generated by Indica Labs, Corrales, NM.
Dense core amyloid plaque area was defined by Thioflavin S staining of 10 μm brain sections. All staining procedures were conducted at room temperature. Briefly, frozen sections were fixed in 4% paraformaldehyde (Electron Microscopy Sciences) diluted in phosphate buffered saline for 20 min. Following successive 2 min rinses in PBS and water, slides were immersed for 5 min in 1% Thioflavin S (Sigma) diluted in water. Excess unbound Thioflavin S was removed by one 5-min rinse in 70% ethanol followed by three 2-min rinses in water. Excess water was removed and coverslips applied using Fluoromount G supplemented with DAPI. Whole slides were scanned on the Aperio FL using the DAPI and FITC excitation and emission filter sets. Thioflavin S positive area was defined per total section using the AreaQuant positive pixel count algorithm using ImageScope v11 and Spectrum v11 (Aperio Technologies) and the percent area Thioflavin S positivity was calculated by normalizing Thioflavin S area to the total brain slice area.
Pathology assessment of Prussian blue-stained sections
At necropsy, a subset of animals was transcardially perfused with isotonic buffered 4% paraformaldehyde. Brains were then removed, cut into two hemispheres and post-fixed in isotonic buffered 4% paraformaldehyde. One hemisphere of each brain was cryoprotected in 30% sucrose, frozen, sectioned sagittally at a thickness of 20 μm, and mounted on glass slides. The same mounted sections that were stained with Prussian blue and evaluated for area of Prussian blue deposition were also microscopically evaluated by veterinary pathologists blinded to treatment group assignment.
T2*-MRI acquisition and analysis
MRI measurements were performed on a 7-T, 30 cm bore Bruker Biospec 70/30 USR system equipped with an actively shielded 12 cm inner diameter gradient coil with a maximum gradient strength of 40 gauss/cm. An actively-decoupled 72 mm diameter volume coil was used as the RF transmitter, and an actively decoupled quadrature surface coil positioned on the top of the brain was used as the radiofrequency (RF) receiver. Magnetic field homogeneity was optimized by automatic global shimming. The animals were secured in a mouse restrainer (Bruker instruments) 2% isoflurane anesthesia delivered in oxygen-enriched medical air (nitrogen: oxygen = 7:3) through a nosecone. Body temperature was measured by a rectal probe and maintained at 37±0.5°C by means of a temperature-controlled air heater. Respiration was monitored by a pressure sensor connected to a balloon taped to the mouse’s chest (SA Instruments, Inc., Stony Brook, NY USA). Tri-pilot images of the three directions (sagittal, coronal, and axial) were first acquired using two-dimensional fast low angle shot (FLASH) sequence. Based on the sagittal image, twenty T2*-weighed coronal images were acquired by three-dimensional (3D) FLASH sequence covering approximately from interaural 6 to 0 mm, with field of view (FOV) of 1.28×1.28 mm and matrix of 128×128×20, resulting in the spatial resolution of 100×100×300 μm3. The parameters of the sequence are: TR = 50 ms, TE = 20 ms, number of average is 10. A single reader blinded to the animal cohort allocation quantified MH incidence as a signal attenuation with a minimum in-plane cluster of 2 pixels (1pixel size: 100×100 μm2). To ensure that the same site is not counted multiple times, its presence is carefully controlled over several consecutive slices from the 3D dataset [22].
Statistical analysis
For MH as detected by MRI, the difference in the number of MH after 12 weeks of treatment and baseline was the response analyzed. Differences between treatment groups and their respective controls were tested pairwise. Due to the discreteness of the response these tests were based on the Mann-Whitney test statistic. Asymptotic values are reported, but were checked via permutation. p-values are given both with and without stratification by age. A linear by linear association test was used to show that age was associated with the response. An analysis of covariance model was also used to estimate treatment groups means adjusted for age, and test for treatment group differences. For MH as detected by Prussian Blue stain, an analysis of covariance model was used to estimate treatment group means adjusted for age and to test for treatment group differences. Since graphically 24-month values (object number and object area) were similar to 23-month values, age was used in this model as a factor (i.e., a category) rather than a numeric variable.
For Aβ measured by immunoassay or by quantitative morphometry pairwise t-test comparisons of controls versus their respective treatment or baseline group were performed with significance defined as a p value≤0.05. Quantitative morphometry results were also analyzed using a linear model that adjusted for age in a manner similar to that used for MH endpoints. All variables for this analysis were analyzed on a log2 scale.
RESULTS
Study design and verubecestat levels in plasma and brain
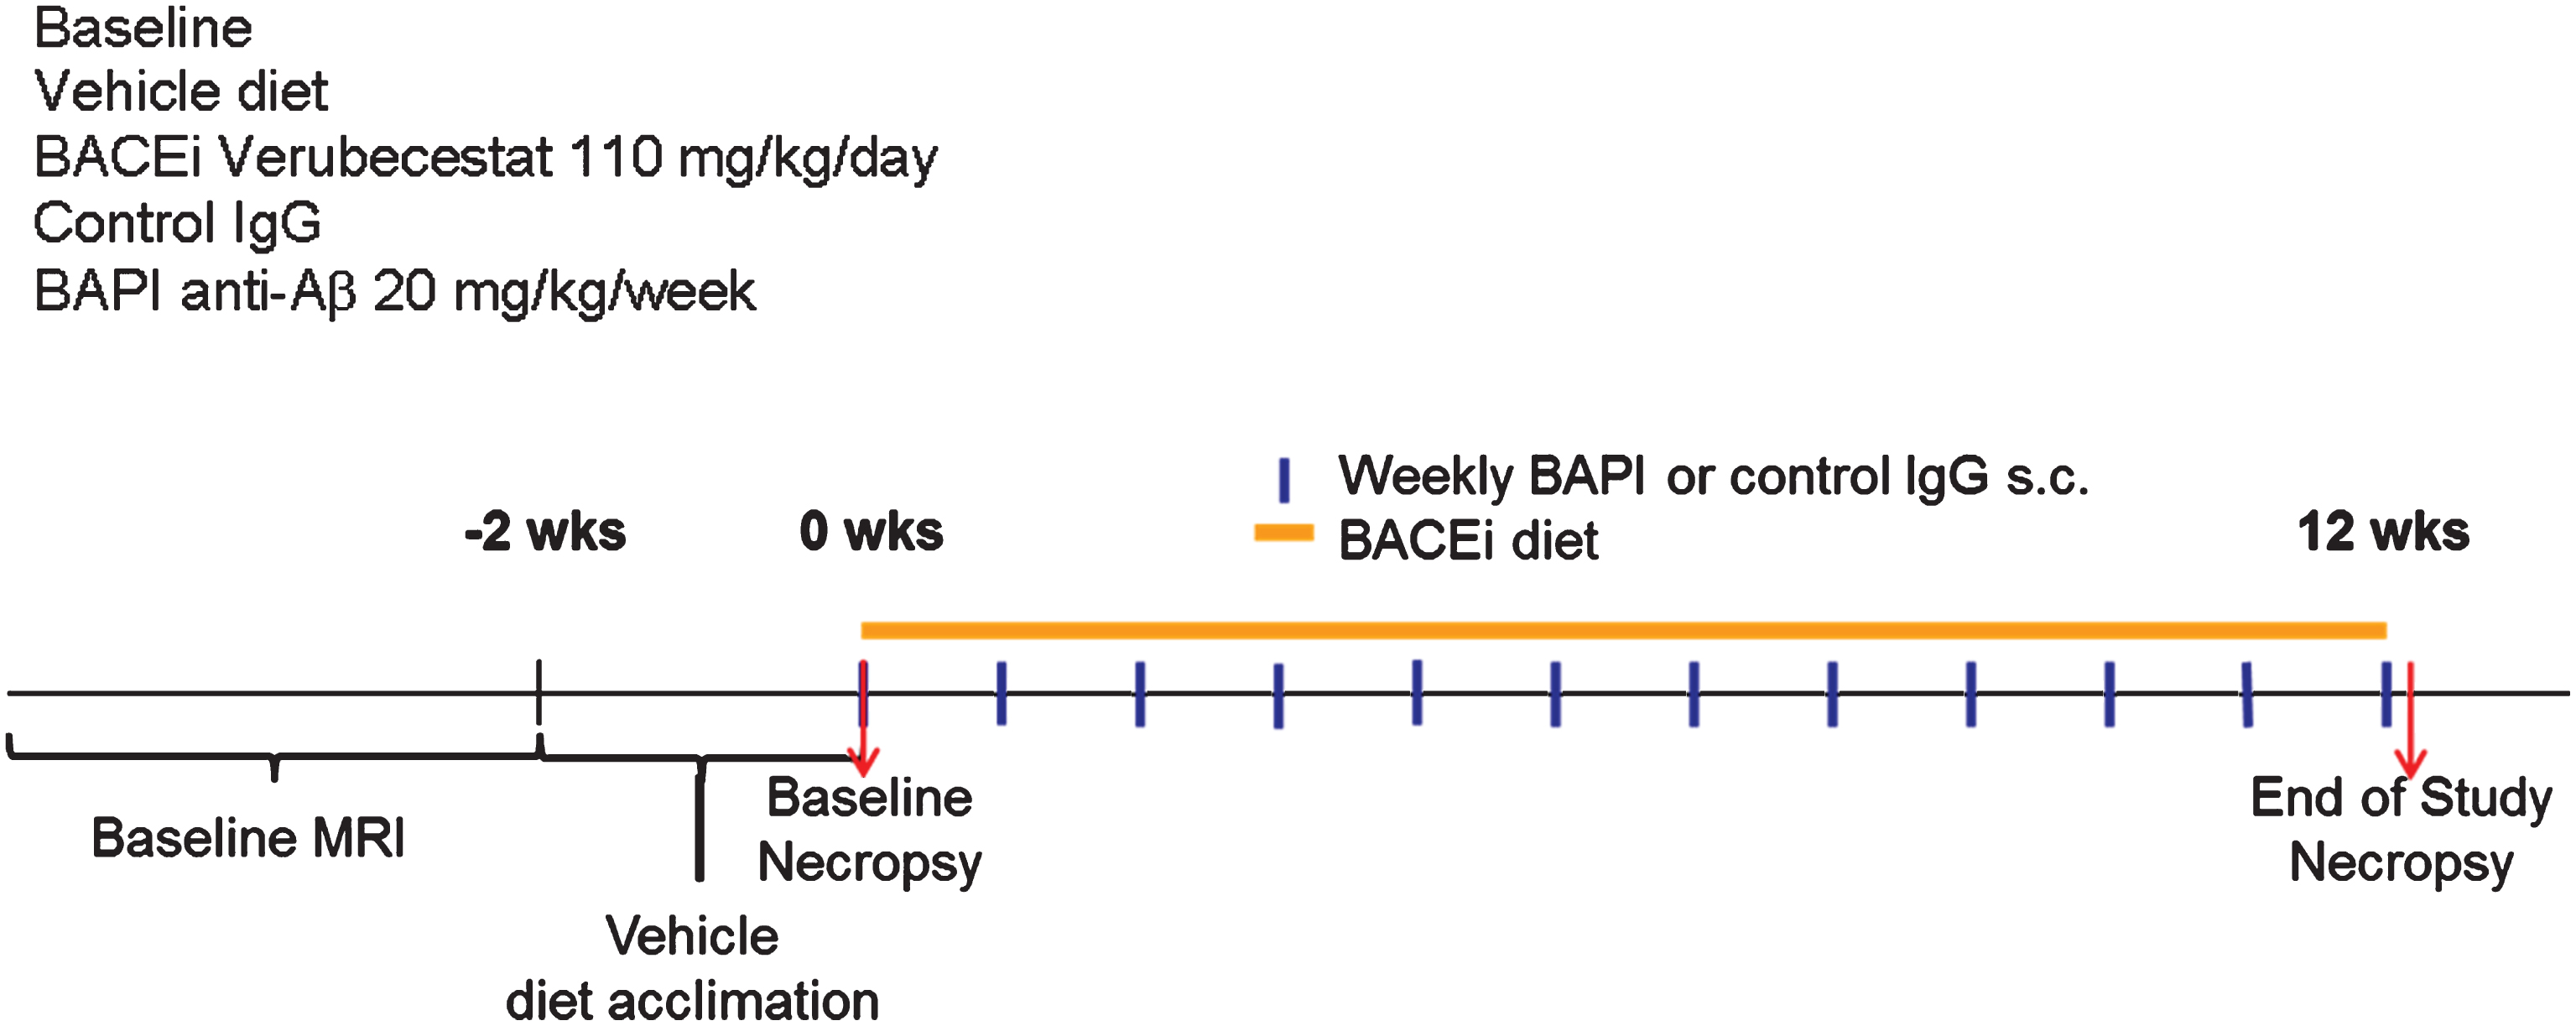
The design for the 12-week verubecestat microhemorrhage study in aged post-plaque Tg2576 mice is shown in Fig. 1. A chimeric rat×mouse surrogate of the bapineuzimab antibody, also known as 3D6, had been shown previously to induce ARIA-H in aged Tg2576 mice and was included as a positive control. ARIA-H status was monitored longitudinally within each animal by T2*-MRI and by Prussian blue histochemistry for a separate baseline group and for all animals at study termination. Study animals were balanced across the baseline group and the four treatment groups according to body weight and baseline T2*-MRI-identified ARIA-H events (Supplementary Figure 1A, B). T2*-MRI imaging on all prospective study animals revealed that the majority (160/169) possessed 0, 1, or 2 hypo intensities classified as ARIA-H (see methods for criteria) (Supplementary Figure 1B). Baseline group animals were euthanized the day prior to starting treatments in the other groups. For the four treatment groups, two groups (n = 36-37/group) were dosed continuously with either vehicle diet or diet formulated to deliver 110 mg/kg/day of verubecestat and two additional groups were dosed weekly via subcutaneous injection of 20 mg/kg each of the 3D6 antibody or an isotype control antibody. This dosing regimen of 3D6 was previously shown in our pilot studies and by others [16] to induce MH events above vehicle treated animals in aged Tg2576 mice. Body weight and food consumption (Supplementary Figure 1C) were monitored weekly for the animals receiving in-diet treatment and was used to calculate the actual delivered dose of verubecestat (Supplementary Figure 1D). Animals in both of the in-diet treatment groups consumed a similar amount of food for the duration of the study (Supplementary Figure 1C). The formulation of the verubecestat-containing diet was adjusted after 5 weeks on study in order to better achieve the targeted 110 mg/kg/day dose (Supplementary Figure 1D). Survival of Tg2576 mice was similar across the study for all dose groups with a percent survival of 73%, 84%, 75%, and 72% for the vehicle diet, verubecestat-containing diet, isotype-matched control antibody, and 3D6 dose groups, respectively (Supplementary Figure 2). Verubecestat plasma and brain levels and extrapolated AUC4 - 24h exposures are listed in Supplementary Table 1. The plasma AUC4 - 24h was estimated from the plasma concentration of verubecestat obtained at necropsy which reflected ∼4 h into the “lights on” phase of the light cycle when feeding naturally subsides and verubecestat plasma levels begin to drop from a maximum. Therefore, the estimated plasma AUC4 - 24h of 181 μMh (Supplementary Table 1) and the corresponding exposure multiple (EM) of 22x and Cmax multiple of 15.6x (Supplementary Table 1) reflect an underestimate. Multiples were calculated relative to the maximum plasma exposure achieved in a Phase I study of verubecestat in mild to moderate AD patients [1]. CSF was not analyzed for verubecestat levels due to insufficient material which was prioritized for Aβ analysis. The estimated verubecestat brain AUC4 - 24h was 46.3 μMh (see Supplementary Table 1). The high systemic exposures required in Tg2576 mice and corresponding high exposure multiples relative to the human exposures required to achieve similar CSF Aβ lowering could be due to the presence of over-expressed AβPP, the presence of the Swedish mutation, a difference in mouse and human b/p or other unknown factors in combination. The high plasma and brain exposures achieved here tested for possible chemical structure-related effects of verubecestat on ARIA-H status.
Fig.1
Study design and endpoints to study the effect of verubecestat treatment on microhemorrhage in aged Tg2576 mice. Study groups included baseline control animals (n = 23), mice treated with vehicle diet (n = 37) or diet formulated to deliver 110 mg/kg/day verubecestat (n = 37) for 12 weeks. In two separate groups of mice, the 3D6 (bapineuzumab) antibody treatment was included as a positive control (n = 36) and was compared to an IgG2a isotype control antibody (n = 36). Baseline ARIA-H events were determined for each animal by T2*-MRI in addition to body weight and age. All animals were acclimated to vehicle diet for ∼1 week prior to study start. Subcutaneous delivery of bapineuzumab or control antibody was performed weekly as indicated by the blue vertical lines. Verubecestat formulated or control diet was provided continuously throughout the 12-week treatment period (orange solid line).
Pharmacodynamic effects of verubecestat on plasma and CNS Aβ and sAβPPβswe and sAβPPα
Plasma and CSF Aβ40, Aβ42, and brain soluble-AβPPβswe (sAβPPβswe) levels were measured as pharmacodynamic biomarkers of BACE1 inhibition. Plasma Aβ levels were determined for all baseline animals and treated animals that survived to the end of the study, while CSF and brain measurements were performed only in a subset of animals (verubecestat and vehicle diet groups) that was dedicated for biochemical analysis. This latter subset of animals was evaluated for ARIA-H by MRI but not by Prussian blue staining since the latter requires perfusion fixation. Plasma Aβ40 and Aβ42 levels were ∼2.5 fold higher in vehicle diet-treated mice relative to baseline animals (Supplementary Figure 3A). In contrast to baseline and vehicle diet-treated mice, plasma Aβ40 and Aβ42 levels in verubecestat-treated mice were near or below the level of detection in the assay (reflecting >90% inhibition) after 12 weeks of treatment (Supplementary Figure 3A and Table 1). The 3D6-treated mice displayed a 3980% and a 1716% increase in total plasma Aβ40 and Aβ42 levels respectively compared to mice treated with the control isotype antibody following 12 weeks of dosing (Supplementary Table 3B and Table 1). This substantial increase in total plasma Aβ is likely the consequence of antibody binding to and stabilizing plasma Aβ peptides and thus preventing their clearance from blood and reflects successful in vivo “target engagement”.
Table 1
Summary of verubecestat and 3D6 effects on plasma and CNS Aβ and sAβPPβswe and sAβPPα biomarkers following 12 weeks of treatment
| Verubecestat (110 mg/kg/d) | ||||
| Percent Change vs. Vechicle diet | ||||
| Aβ1-40 | Aβ1-42 | sAβPPβswe | sAβPPα | |
| Plasma | –98 | –90 | nd | nd |
| CSF | –62 | –68 | nd | nd |
| Cortex Total | –24 | –16 | –67 | +213 |
| 3D6 (20 mg/kg/week, sc) | ||||
| Aβ1-40 | Aβ1-42 | |||
| Plasma | +3980 | +1716 | ||
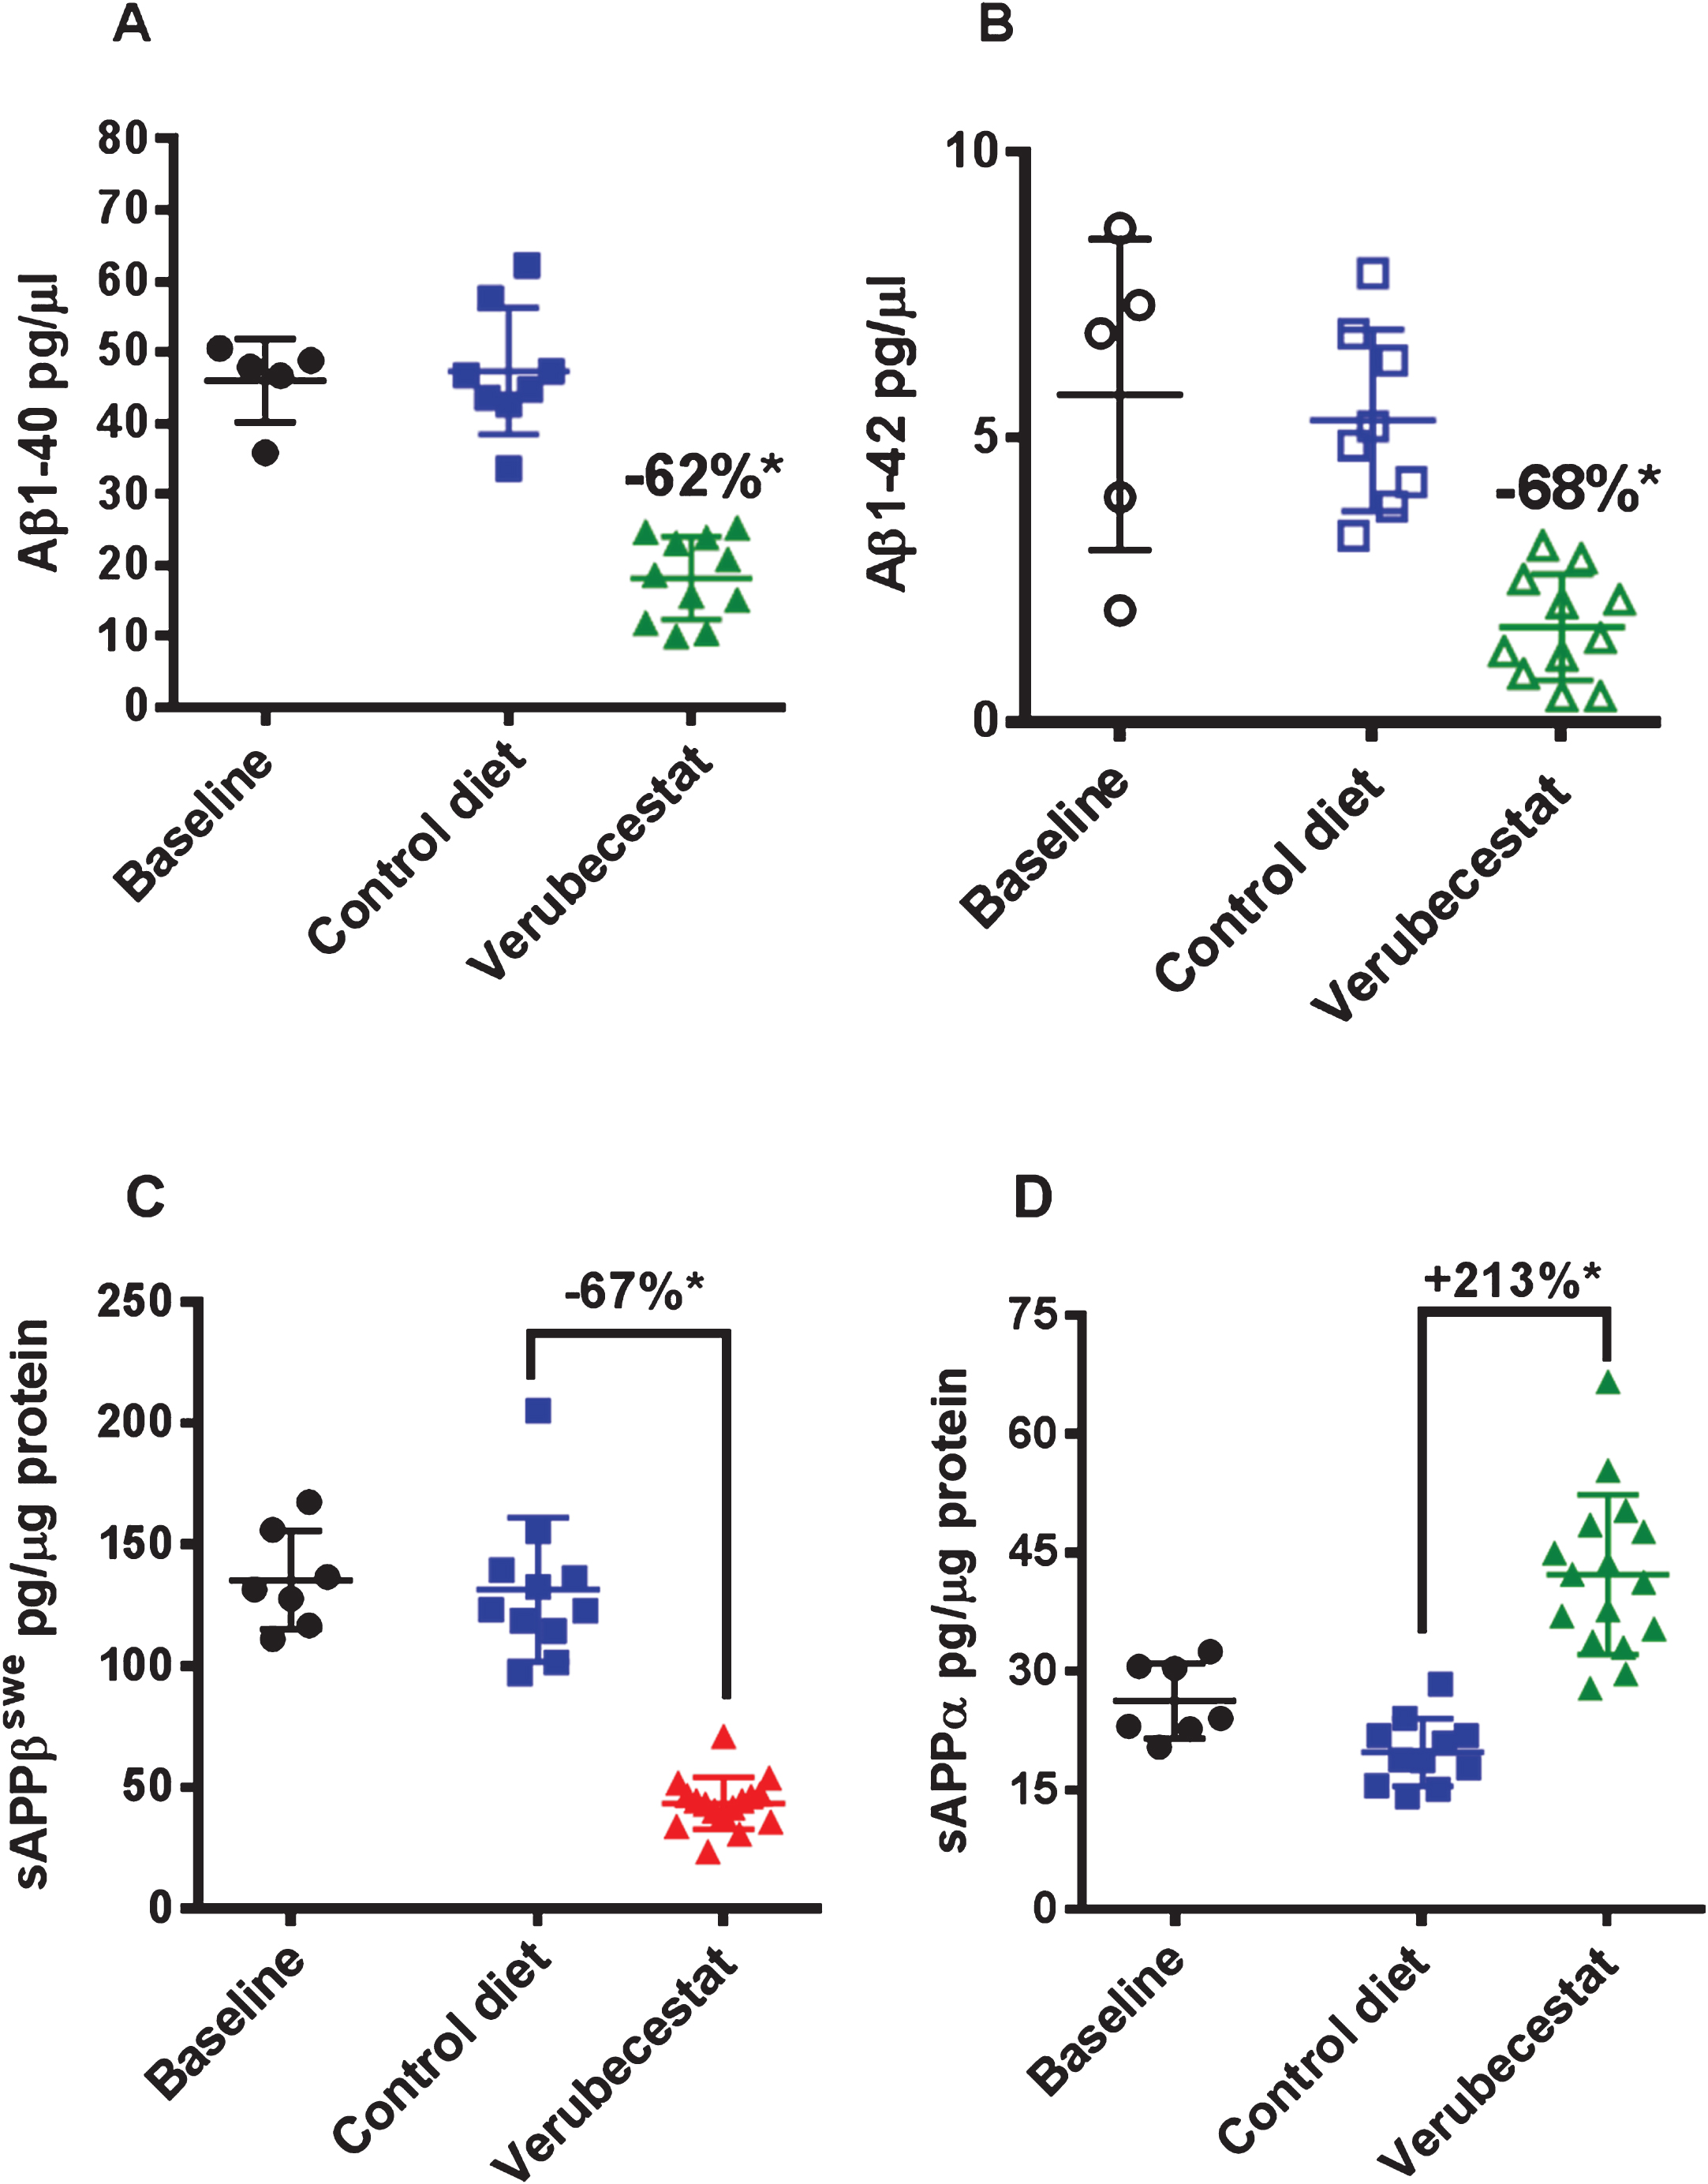
Reduction of CSF Aβ40 and Aβ42 levels in response to verubecestat treatment in normal healthy volunteers and AD patients is an effective pharmacodynamic biomarker for the inhibition of BACE1 processing of AβPP in the CNS [1]. Verubecestat significantly reduced CSF Aβ40 (–62% versus vehicle diet-treated mice; p = 0.0001, t-test) and CSF Aβ42 (–68% versus vehicle diet-treated mice; p≤0.0004, t-test) after 12 weeks of in-diet dosing (Fig. 2A,B and Table 1). This degree of CSF Aβ reduction is in close agreement with the ∼70% reduction observed in young pre-plaque Tg2576 mice used in preliminary dose finding studies (data not shown) and is at or above the 50% and 75% CSF Aβ40 lowering targets targeted in ongoing Phase III clinical trials of verubecestat in mild-moderate AD patients and prodromal AD [1]. Insufficient CSF was available to also measure sAβPPβswe and sAβPPα levels; however, these biomarkers were measured in brain extracts. Soluble-AβPPβswe is the N-terminal product of BACE1-mediated cleavage of the AβPPswe protein and is a direct biomarker of BACE1 target engagement. Additionally, since the sAβPPβswe fragment does not accumulate into amyloid plaques, it remains a sensitive and dynamic readout of brain BACE1 inhibition. In multiple prior studies in various transgenic and non-transgenic animal models, we have observed good agreement for effects of BACE inhibitors on both CSF and brain sAβPPβswe following chronic in-diet or oral gavage dosing. After 12 weeks of in-diet dosing, verubecestat significantly reduced brain sAβPPβswe levels by 67% (p = 0.0001, t-test) relative to vehicle-diet treated control animals after 12 weeks of dosing (Fig. 2C and Table 1). An opposite 213% increase (p = 0.0007, t-test) in the levels of sAβPPα was observed in verubecestat-treated animals relative to vehicle-diet treated control mice (Fig. 2D). This increase in CNS sAβPPα levels typically accompanies BACE1 inhibition and is thought to result from increased availability of full length AβPP for α-secretase processing [23]. Taken together, the exposure and pharmacodynamics effects of verubecestat following 12 weeks of in-diet dosing confirm that the targeted levels of BACE1 inhibition and high EMs were achieved.
Fig.2
CSF Aβ1 - 40 (A) and Aβ1 - 42 (B) and brain sAβPPβswe (C) and sAβPPα (D) levels in aged Tg2576 mice at baseline and following 12-weeks treatment with control vehicle diet or verubecestat diet at 110 mg/kg/day. *p < 0.0001 versus vehicle diet-treated mice; two-tailed t-test. Data are plotted as mean±sd.
Verubecestat effects on brain Aβ peptide levels and Thioflavin S reactive Aβ deposits
In Tg2576 mice, Aβ peptides aggregate into oligomers and fibrils that accumulate over months to years into amyloid plaques in the parenchyma and cerebral vessels. Immunohistochemical evaluation of the advanced age Tg2576 mice used in this study revealed substantial amounts of pre-existing parenchymal and vessel-associated insoluble amyloid were present at the start of the study. The insoluble Aβ peptide levels at this advanced age far exceed the amount of newly synthesized soluble brain Aβ. Guanidine-HCl solubilization of brain homogenates can be used to disrupt amyloid aggregates in plaques and vessels and thus allow quantification of the “total brain Aβ” pool (soluble and insoluble Aβ). Control diet-treated animals displayed a 34% increase in total brain Aβ40 relative to baseline mice, though this increase just missed significance (Fig. 3A, p = 0.056, t-test). Verubecestat treatment for 12 weeks suppressed the accumulation of Aβ40 peptide relative to control diet-treated mice (–24% versus control diet, p = 0.009, t–test). The resulting total brain Aβ40 levels were not significantly different from the baseline control group (Fig. 3A) and suggest verubecestat halted further Aβ accumulation. Despite being more amyloidogenic than Aβ40, brain Aβ42 peptides did not significantly increase over the 12 weeks of treatment (1.06-fold increase relative to baseline; p = 0.1595, t-test). Nevertheless, verubecestat-treated animals displayed significantly less accumulated Aβ42 relative to the group treated with vehicle diet (–16% versus control diet; p = 0.0012, t-test) (Fig. 3B).
Fig.3
Verubecestat effects on total guanidine soluble brain Aβ1 - 40 (A) and Aβ1 - 42 (B) and verubecestat and 3D6 effects on the area occupied by dense core amyloid deposits (Thioflavin S positive) as a percent of total brain slice area (C). Comparisons were performed using a two-tailed t-test (*p < 0.05). Data are plotted as mean±sd.
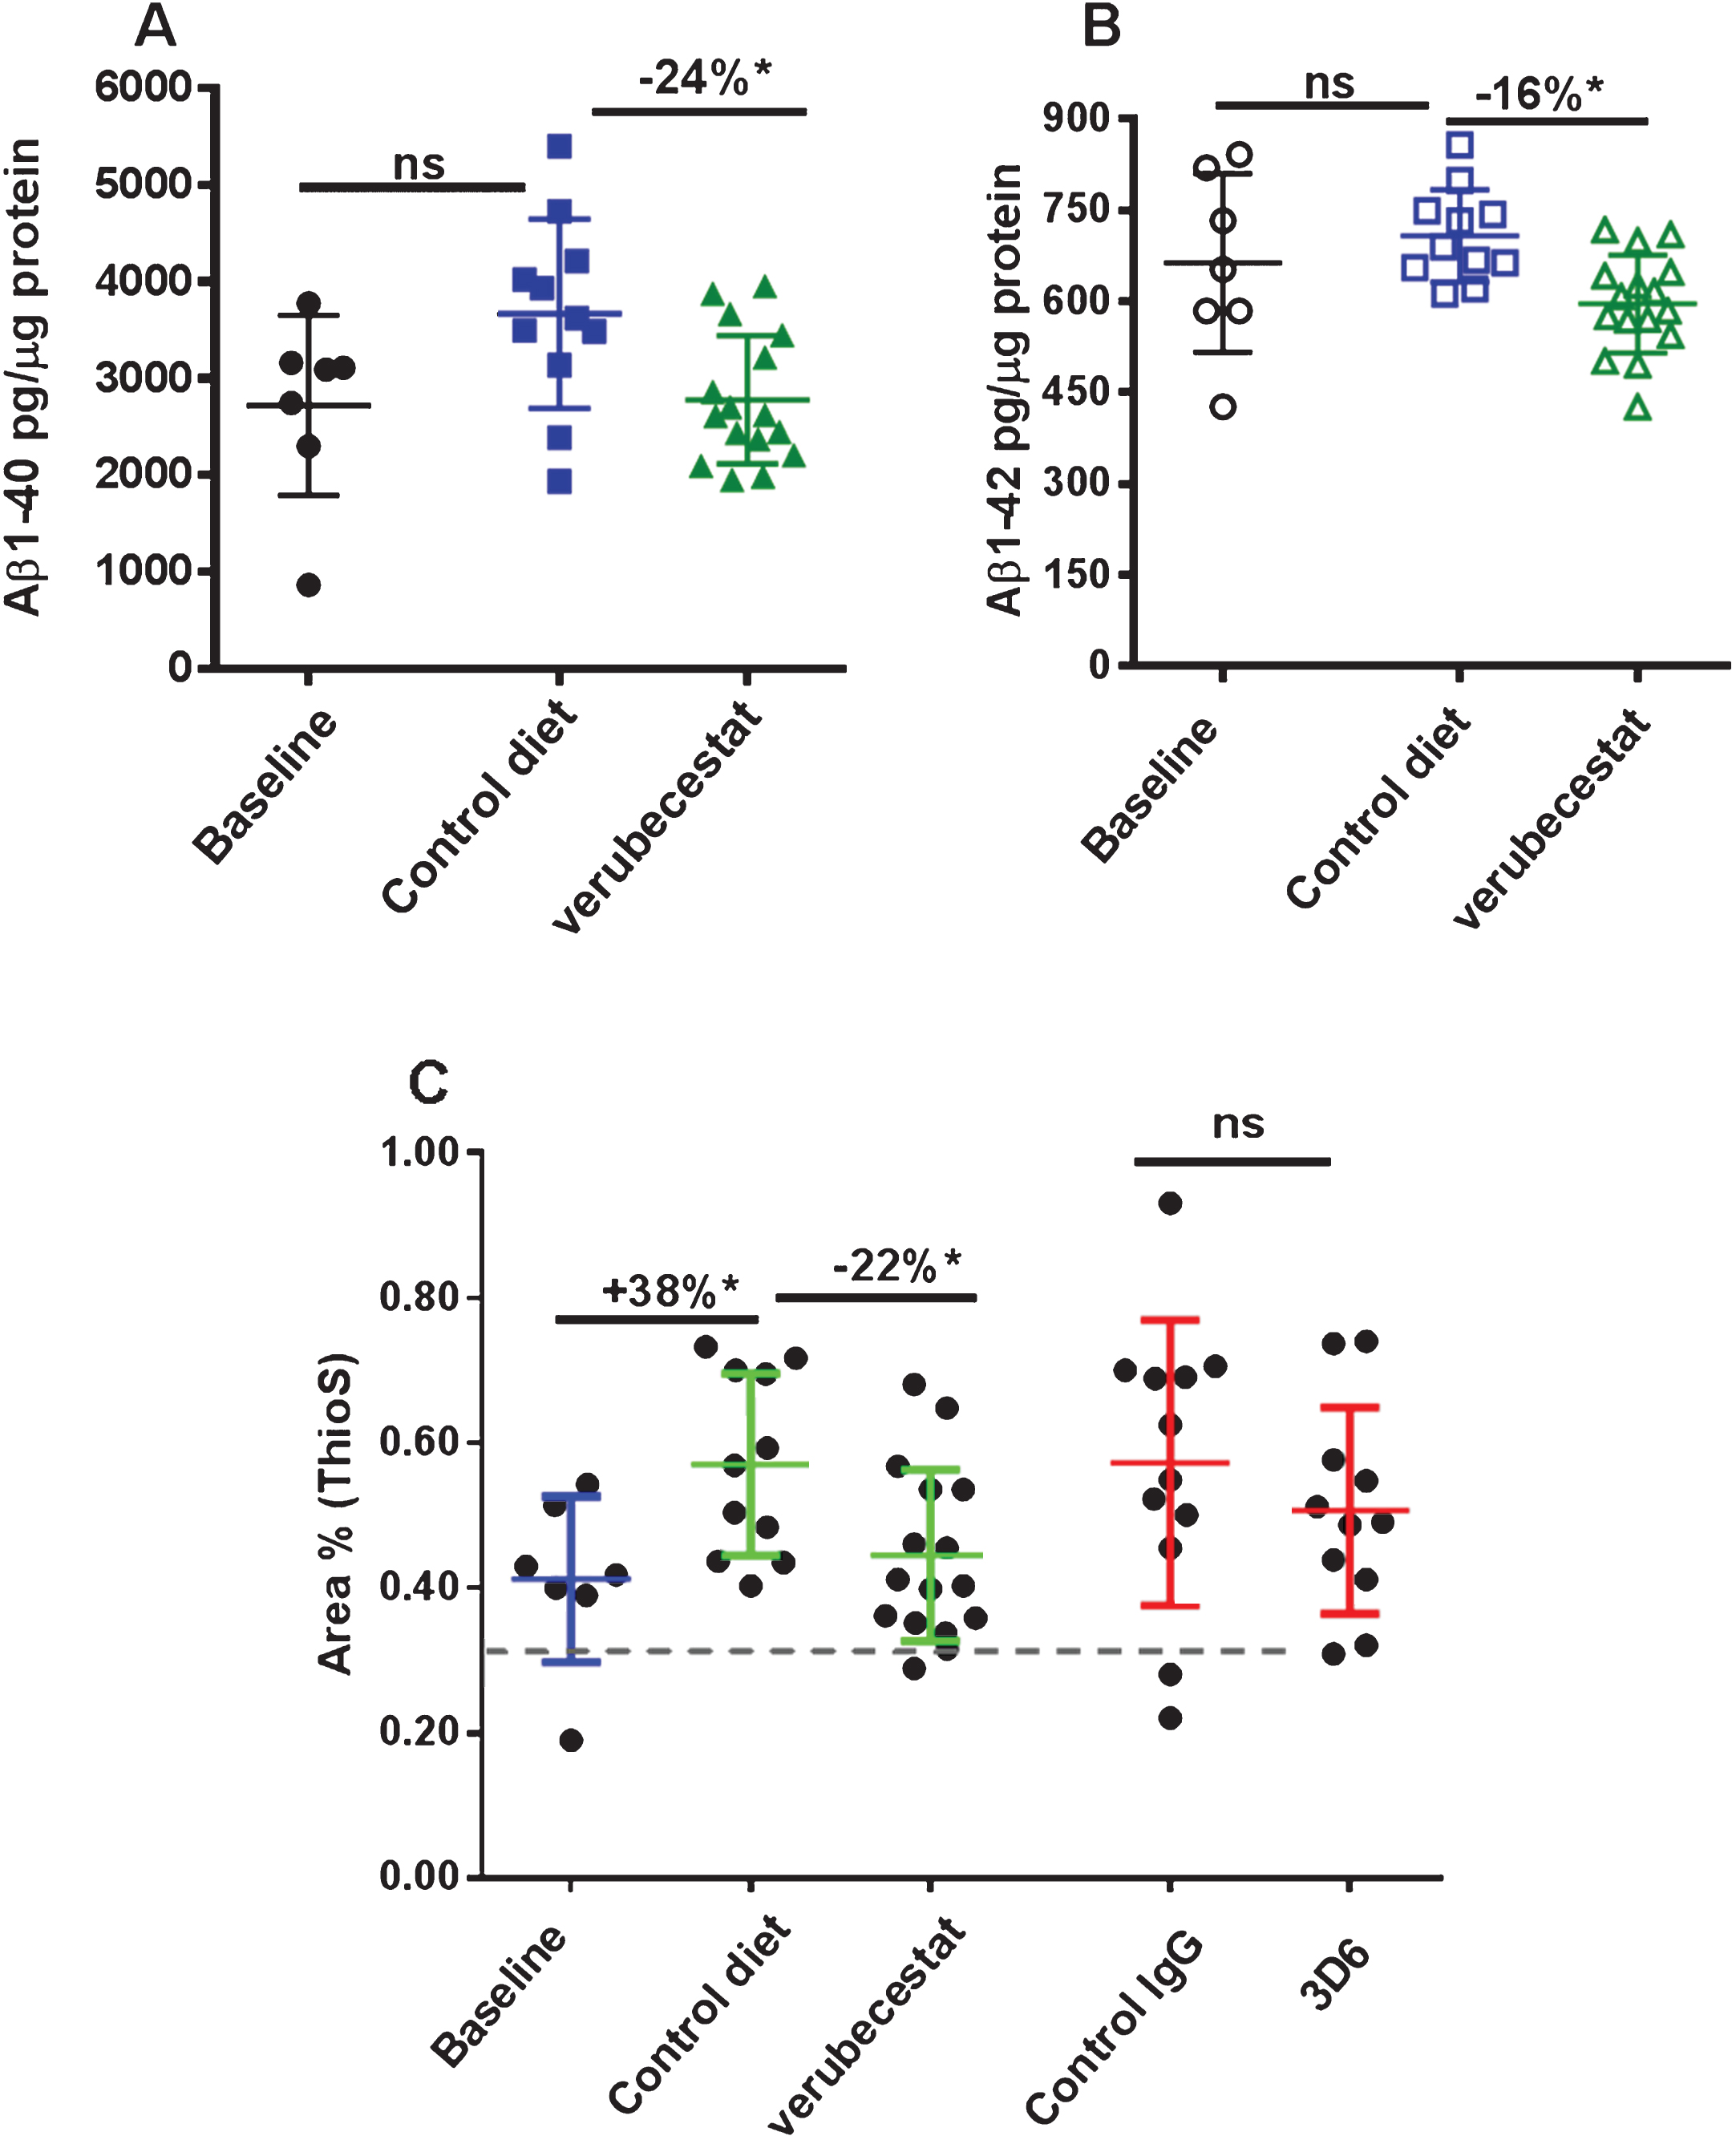
Thioflavin S preferentially binds to the fibrillar amyloid structures characteristic of the dense core plaques in AD brains and was used to determine the area occupied by mature fibrillar amyloid deposits at baseline and in each treatment group. Quantitative morphometry to measure the percent area of Thioflavin S positive deposits was applied whole brain sections from baseline and treatment groups (n = 7–16 animals/group; Fig. 3C). Consistent with the biochemical changes observed for guanidine-extracted Aβ, a significant increase in Thioflavin S positive fractional area was observed in vehicle-diet treated animals versus baseline (+38%, p < 0.001, t-test). Accumulation of Thioflavin S deposits was significantly reduced in verubecestat-treated mice compared to vehicle controls (–22%, p < 0.05, t-test; Fig. 3C). The area covered by Thioflavin S deposits was not different between verubecestat-treated mice and the baseline group (Fig. 3C). Mice treated with control antibody displayed a similar mean increase over baseline as vehicle-diet treated animals which was more variable and did not reach significance (+39% versus baseline, p = 0.06, t-test; Fig. 3C). Mice treated with the 3D6 antibody did not show a significant change in Thioflavin S positive area compared to control antibody-treated mice (–12%, p = 0.36, t-test; Fig. 3C).
Longitudinal analysis of microhemorrhage by T2*-MRI
Microhemorrhage incidence by T2*-MRI was identified using signal attenuation with a minimum in-plane cluster of 2 pixels (pixel size: 100×100 μm2). Figure 4 shows T2* images of four consecutive coronal slices from one mouse during baseline (Fig. 4A) and following the 12-weeks treatment with 3D6 (Fig. 4B). As shown in the images, multiple microhemorrhages developed during the 12-weeks treatment in this mouse. Baseline ARIA-H numbers were not significantly different across groups (p > 0.5; Kruskal-Wallis; Supplementary Figure 1B and Table 2). T2*-MRI analysis of all surviving animals was performed at the end of the study and were on average increased relative to baseline in all treatment groups (Table 2). However, a few animals were identified in all treatment groups with apparently one or two less ARIA-H events at the study end than noted at baseline suggesting that MRI-detected ARIA-H events, as defined by T2*-MRI, can resolve over a 12-week period. Alternatively, this apparent resolution of ARIA-H events at the 12-week scan may be due to misidentification at baseline which could have been caused by the presence of vessel flow voids that can mimic the T2* signal hypointensities characteristic of ARIA-H [24]. Since a linear by linear association test identified a significant association of increased ARIA-H with age (p = 0.027), treatment groups were compared with and without stratification on age (compare Fig. 4 and Supplementary Figure 4, and Table 2 and Supplementary Table 2). Pairwise comparisons of treatment groups did not identify a significant difference in the distribution of baseline subtracted ARIA-H events between vehicle control diet (mean = 2.89 ARIA-H events) and verubecestat-treated mice (mean = 1.45 ARIA-H events, p = 0.146 versus controls and p = 0.159 when stratified by age) or between control IgG (mean = 3.07 ARIA-H events) and 3D6-treated animals (mean = 3.81 ARIA-H events, p = 0.566 versus controls and p = 0.474 when stratified by age) (Fig. 4 and Table 2, non-age-stratified results).
Fig.4
Longitudinal study of microhemorrhage identified by T2*-MRI. A) T2* images of 4 consecutive coronal slices from one mouse in the 3D6 treatment group at baseline. No microhemorrhages are observed. B) T2* images of the 4 coronal slices from the same mouse following 12 weeks of treatment with 3D6. Yellow arrows indicate the microhemorrhages visible in the T2* images. C) Baseline subtracted microhemorrhage events detected by T2*-MRI. All animals are plotted as a function of treatment. Each figure shows a boxplot for the indicated group with a line drawn at the median and the individual values overlaid. Sample sizes are given on the top axis.
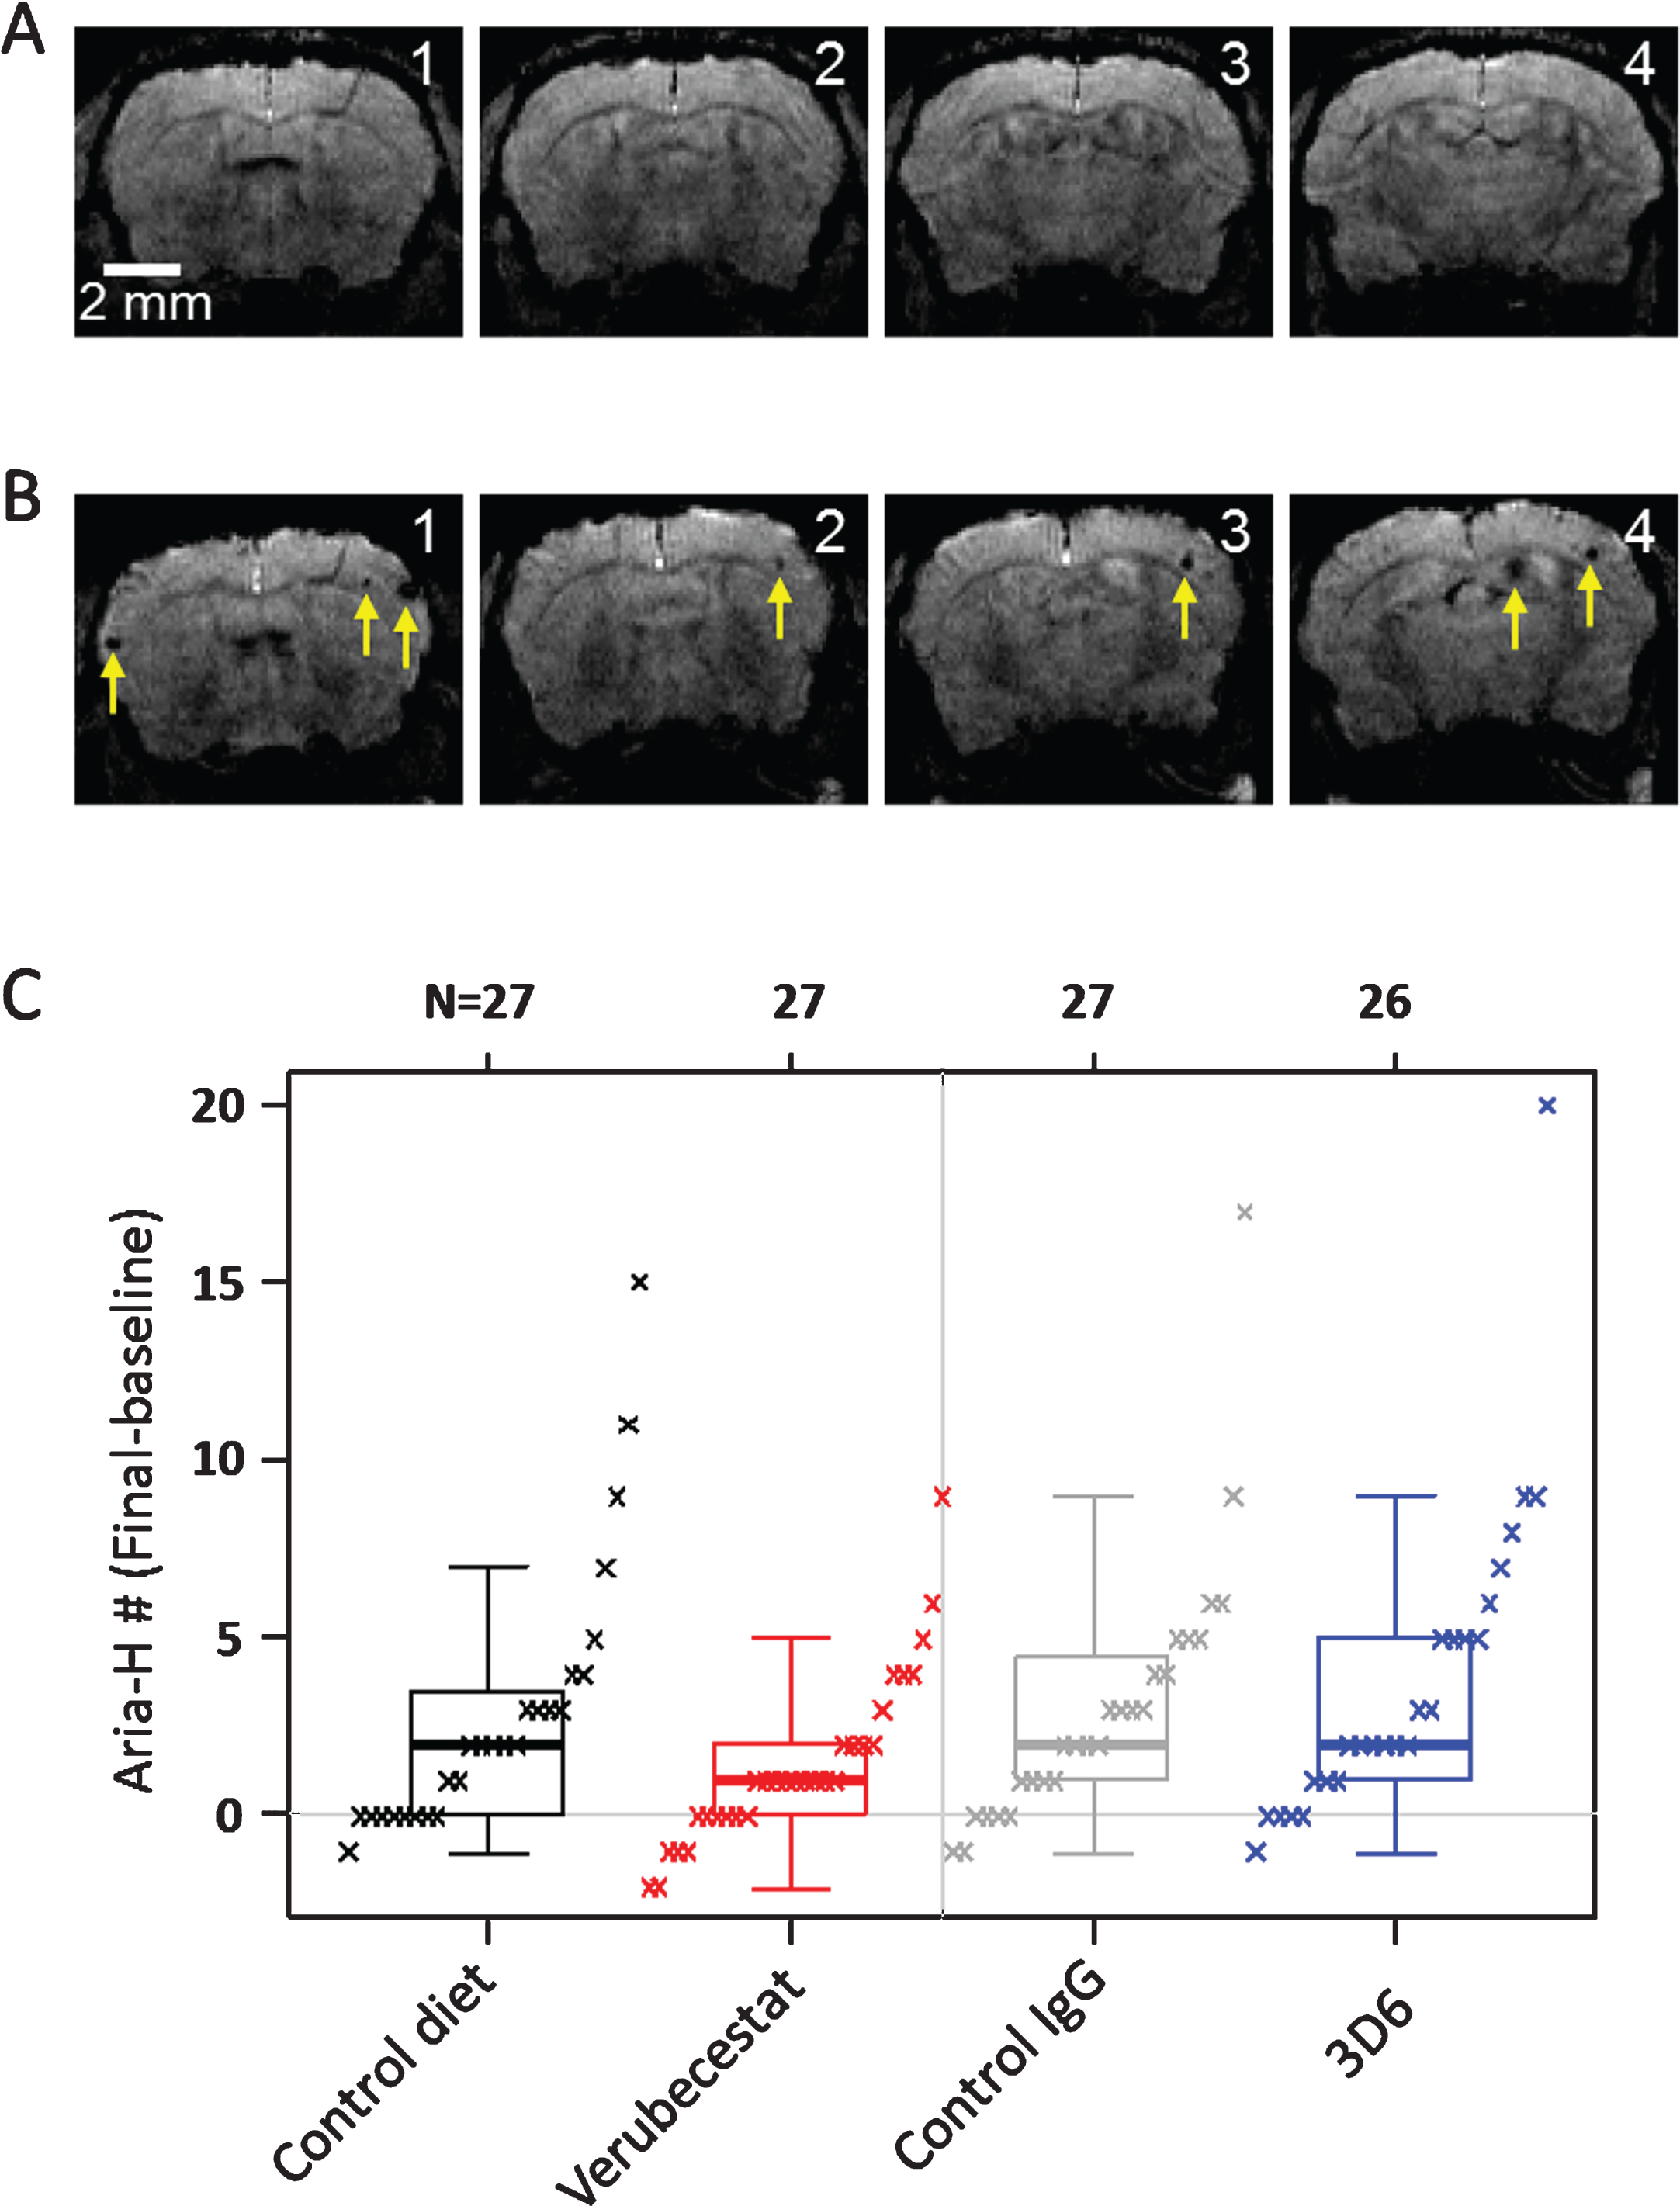
Table 2
Summary of T2*-MRI analysis of mice at baseline and following 12 weeks of treatment with control vehicle diet, verubecestat at 110 mg/kg/day, isotype control IgG antibody or the anti-Aβ 3D6 antibody each at 20 mg/kg/week, sc
| Endpoint | Statistic | Control Diet | Verubecestat | Control IgG | 3D6 |
| Baseline MH | Mean | 0.48 | 0.87 | 0.48 | 0.54 |
| SD | 0.80 | 1.38 | 0.75 | 0.99 | |
| Min | 0 | 0 | 0 | 0 | |
| Max | 3 | 5 | 2 | 4 | |
| Final MH | Mean | 3.37 | 2.32 | 3.56 | 4.35 |
| SD | 3.86 | 2.59 | 4.03 | 4.29 | |
| Min | 0 | 0 | 0 | 0 | |
| Max | 15 | 9 | 19 | 20 | |
| MH # (Final-Baswline) | Mean | 2.89 | 1.45 | 3.07 | 3.81 |
| SD | 3.76 | 2.38 | 3.68 | 4.38 | |
| Min | –1 | –2 | –1 | –1 | |
| Max | 15 | 9 | 17 | 20 | |
| N | 27 | 31 | 27 | 26 |
Observationally there were on average fewer ARIA-H events with verubecestat treatment and more ARIA-H events with 3D6 treatment versus their respective controls (Fig. 4. and Table 2). A correction for the impact of age on ARIA-H across the treatment groups based on a linear model (given in Supplementary Figure 4 and Supplementary Table 2) also resulted in no significant differences in the mean ARIA-H between treatment groups. A similar association of increased ARIA-H by age was identified for Prussian blue detection and an age adjusted model was applied to the results (described below).
Prussian blue histochemical detection of microhemorrhage
Following the final MRI analysis after 12 weeks of treatment, animals were euthanized, and after blood and CSF were collected, one entire hemisphere from treated mice (n = 15/group) was cryosectioned sagittally at 20 μm thickness. Every twelfth section was slide-mounted and subjected to Prussian blue histochemistry (n = 12–16 sections/animal). Prussian blue positivity was quantified as the percent area occupied by Prussian blue stain and the total number of Prussian blue positive events for a given tissue region of interest. The endpoints were determined via image analysis using an algorithm that was designed to specifically identify and quantify discreet areas of Prussian blue positivity based on color, optical density, and size. An example of the algorithm based detection of Prussian blue staining is shown in Fig. 5A. Microhemorrhage was significantly increased after 12-weeks treatment with 20 mg/kg 3D6 compared to mice treated with the isotype control antibody. Both the number of Prussian blue positive events (Fig. 5B and Table 3) and the fractional area occupied by Prussian blue deposits (Fig. 5C and Table 3) were greater in the 3D6-treated animals compared to controls. In the verubecestat-treated animals, ARIA-H was not increased compared to vehicle diet-treated animals irrespective of whether ARIA-H was assessed by fractional area occupied by Prussian blue deposits or by the number of Prussian blue positive events (Fig. 5C and Table 3).
Fig.5
Prussian blue detected microhemorrhage following 12 weeks of treatment. A) Example of Prussian blue positive MH (left) and the corresponding image analysis mask (right) that defines positive pixels. B) Summary of Prussian blue positive object number across treatment groups. C) Summary of fractional Prussian blue object area across treatment groups. B and C show a boxplot for the indicated group with a line drawn at the median and the individual values overlaid. Sample sizes are given on the top axis.
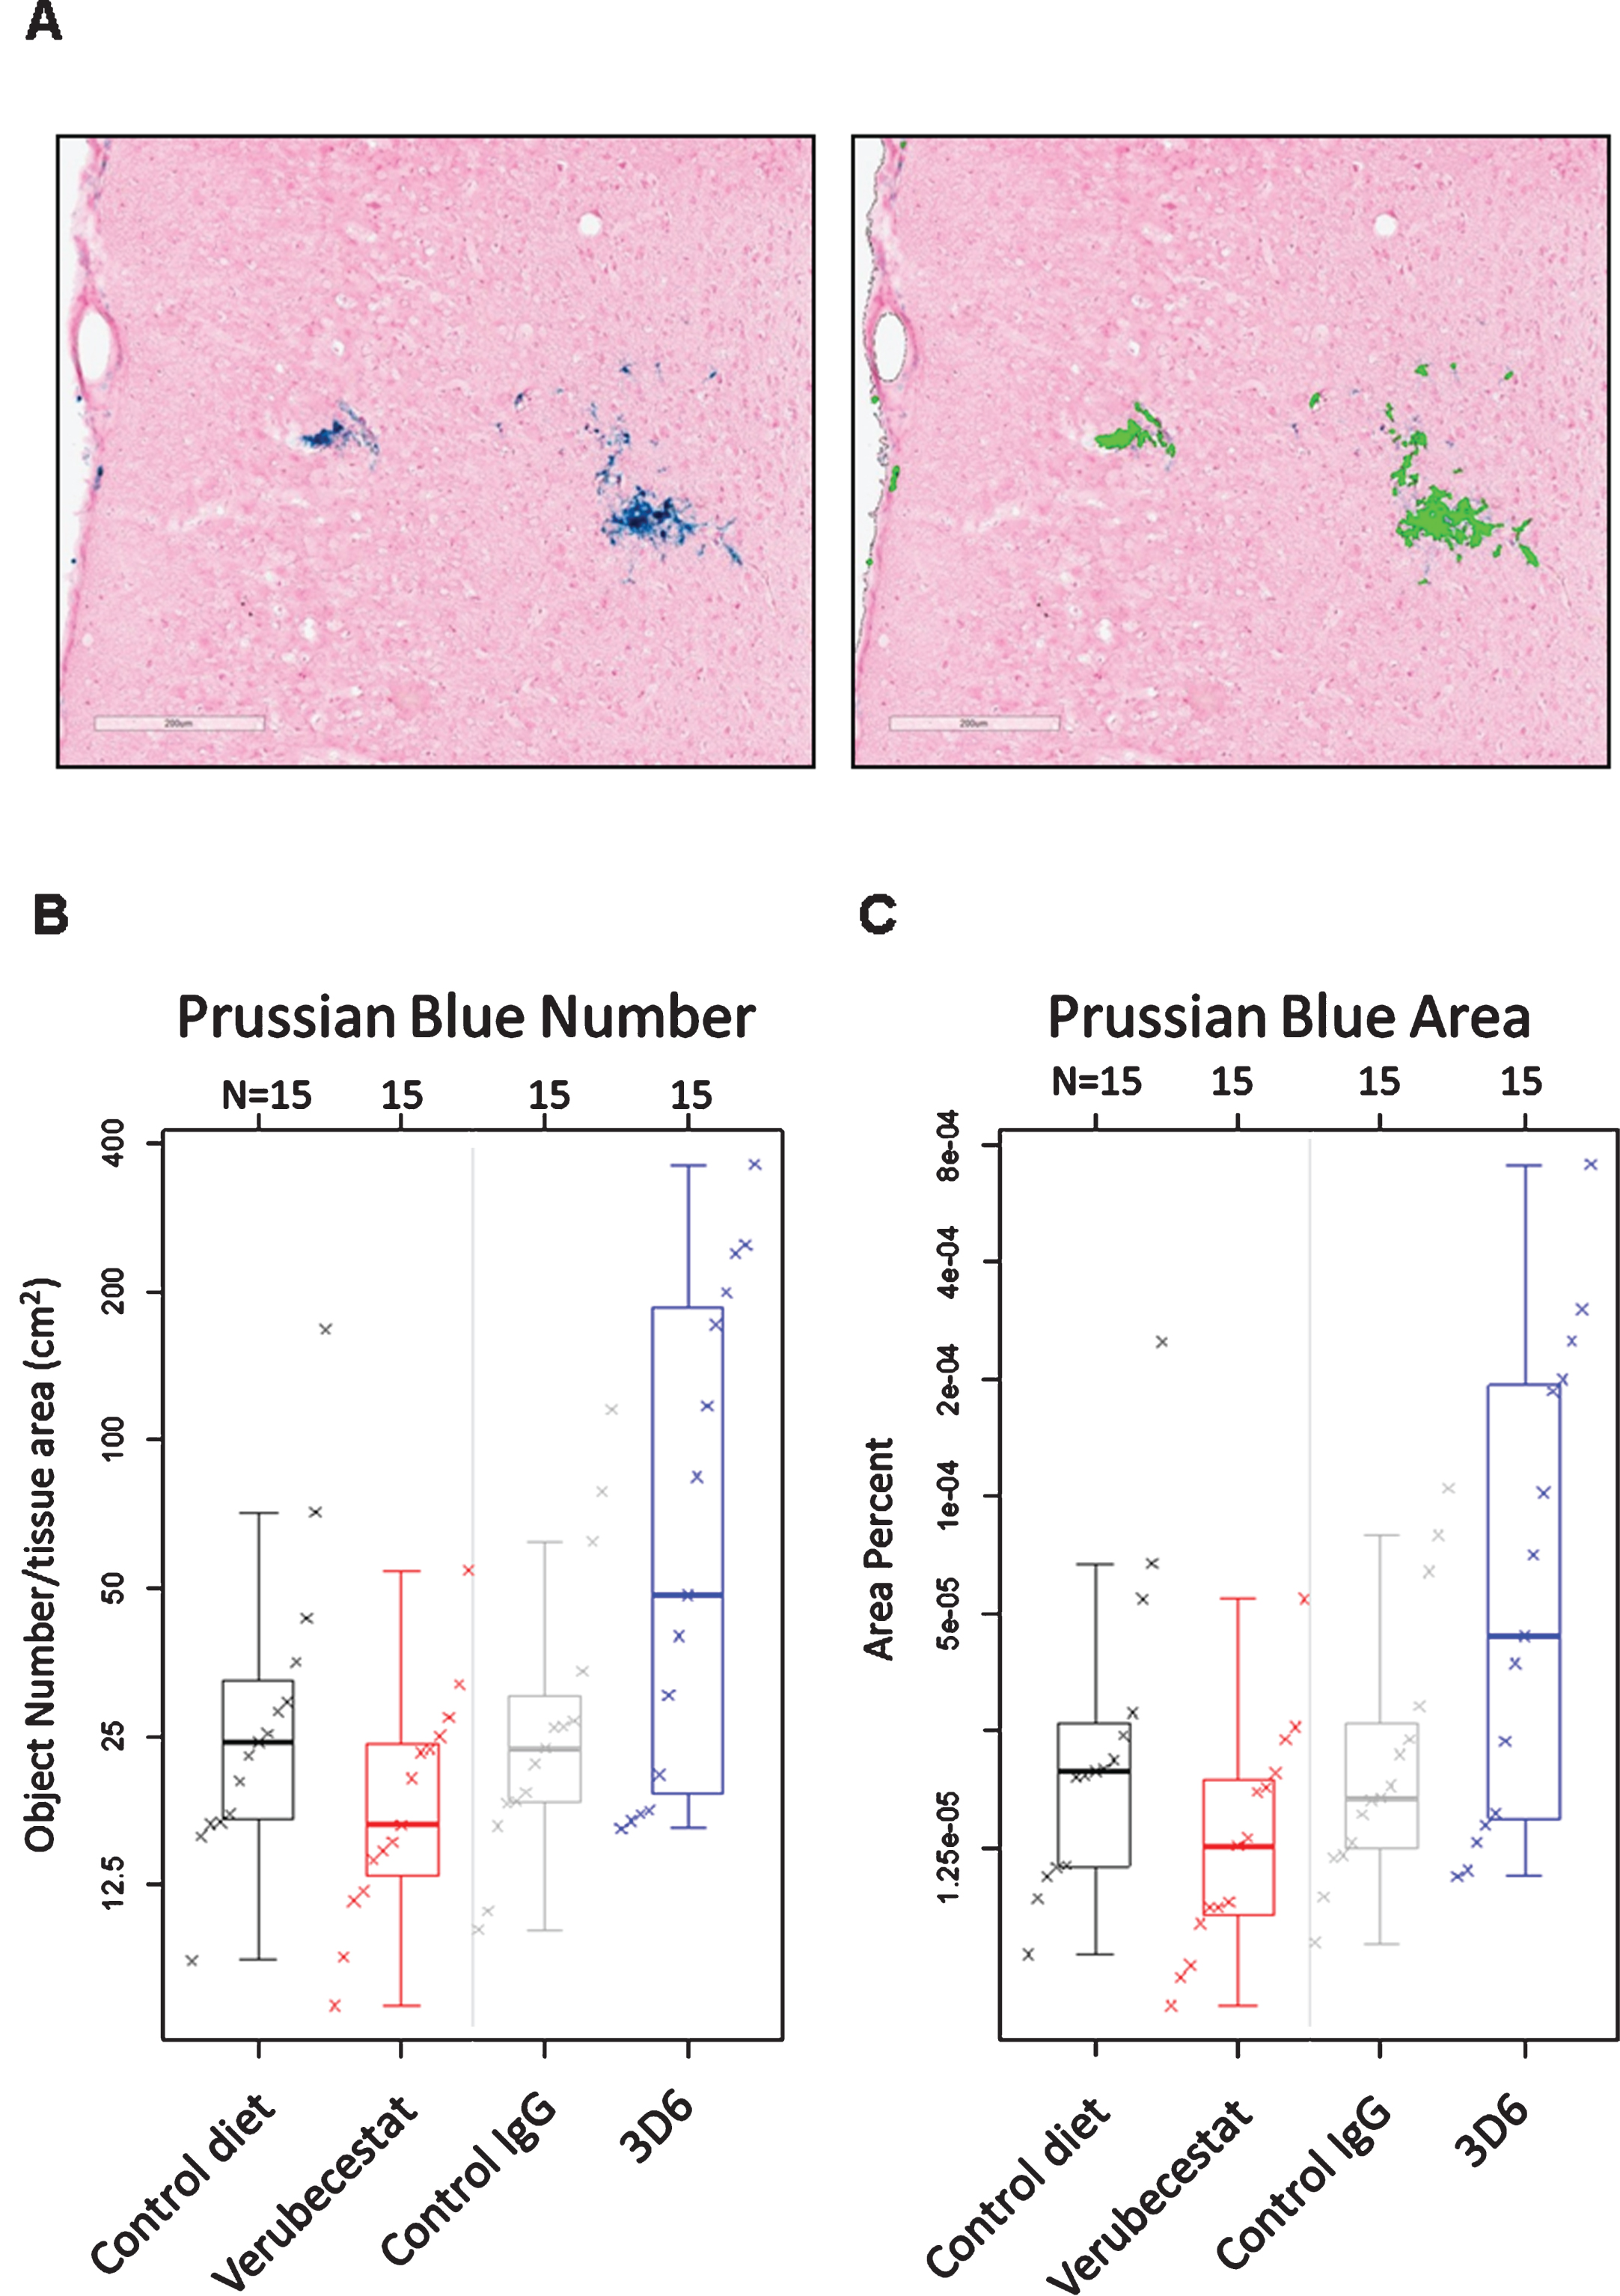
Table 3
Estimates of population means and treatment differences for Prussian blue Object Number and Prussian blue Object Area using an estimated mean age of 23 months. 3D6-treated animals were significantly different from the isotype control antibody-treated group for both object number and area. Neither parameter differed between animals treated with verubecestat and animals treated with control diet. Lower and upper confidence interval (Lower CI and Upper CI) values give a 95% confidence interval for the mean.
| Prussian Blue Object Number | Prussian Blue Object Area | |||||||
| Estimates for 23 month old | Estimates for 23 month old | |||||||
| Group | Estimate | Lower CI | Upper CI | Estimate | Lower CI | Upper CI | ||
| Control diet | 35.4 | 22.6 | 55.4 | 2.97E-05 | 1.69E-05 | 5.21E-05 | ||
| Verubecestat | 24.6 | 15.7 | 38.5 | 1.78E-05 | 1.01E-05 | 3.13E-05 | ||
| Control IgG | 31.8 | 20.8 | 48.5 | 2.57E-05 | 1.51E-05 | 4.38E-05 | ||
| 3D6 | 77.9 | 49.7 | 122.0 | 7.20E-05 | 4.10E-05 | 1.26E-04 | ||
| Estimates of Percent Difference | Estimates of Percent Difference | |||||||
| Group | Estimate | Lower CI | Upper CI | p-value | Estimate | Lower CI | Upper CI | p-value |
| Verubecestat vs. Control diet | –30.7 | –59.7 | 19.2 | 0.181 | –40.1 | –69.7 | 18.3 | 0.137 |
| 3D6 vs. Control IgG | 145.3 | 42.4 | 322.5 | 0.002 | 179.8 | 41.4 | 453.4 | 0.004 |
Similar to the increase observed in MRI ARIA-H events, an increase in Prussian blue positive area and object number was observed as a function of age in all groups independent of treatment. Therefore, a similar adjustment for age was performed and this narrowed the mean differences between control and treatment groups relative to the unadjusted results (compare Supplementary Table 3 and Table 3). A pairwise comparison of the age-adjusted results for mice treated with vehicle diet versus mice treated with the verubecestat-diet found no difference in either Prussian blue object area (estimated difference = –40.1%, p = 0.137) or object number (estimated difference = –30.7%, p = 0.181) (Table 3). There was a trend for fewer numbers of objects and smaller fractional area of Prussian blue with verubecestat treatment, similar to the results observed by T2*-MRI. Rank correlation was 0.43 between ARIA-H assessed by T2*-MRI and assessed by Prussian blue for both number of objects and fractional area. For Prussian blue assessment, fractional area was highly correlated with number of objects, with rank correlation of 0.94. In contrast to the T2*MRI assessment, mice treated with 3D6 displayed significantly greater age adjusted object numbers (estimated difference = 145.3%, p = 0.002) and object area (estimated difference = 179.8%, p = 0.004) of Prussian blue detected ARIA-H compared to isotype control antibody treated mice (Table 3). As a complement to the quantitative morphometry evaluation, the same sections were qualitatively evaluated for ARIA-H by light microscopy by a board certified veterinary pathologist and peer review pathologist experienced in making toxicological pathology assessments. Both pathologists were blinded to treatment group assignment. In summary, eleven mice of the sixty studied were identified as having Prussian blue staining around small blood vessels that was qualitatively greater than the background observed in the remaining mice, which was considered indicative of ARIA-H. Animals treated with 3D6 displayed the highest incidence ARIA-H (Supplementary Table 4).
Histological quantification of treatment effects on Aβ plaque load
Stereological analysis of total amyloid deposits as detected by the 26D6 anti-Aβ antibody that binds to amino acids 1–12 of human Aβ was performed in sections from the same animals that were analyzed by Prussian blue. Plaques were visually scored as either dense or diffuse and results are reported separately for cortex and hippocampus. Dense or diffuse Aβ-reactive deposits both increased in cortex and hippocampus over the 12-week study period in the vehicle diet and control antibody-treated groups relative to thebaseline animals (Fig. 6A-D). In the cortex of verubecestat-treated mice, the fractional area of both dense and diffuse plaques was significantly reduced compared to the vehicle diet group (–39% and –25%, respectively, p < 0.05, t-test; Fig. 6A, B). A similar reduction in both dense and diffuse plaque area was observed in the hippocampus region of verubecestat-treated mice relative to vehicle diet-treated animals (–37%, and –35%, respectively, p < 0.05, t-test; Fig. 6C, D). Cortical and hippocampal Aβ-reactive deposits were not impacted by 3D6 treatment (Fig. 6A-D). The finding that 3D6-treated mice show little difference in plaque load versus theisotype control antibody mice is consistent with results shown in Figs. 7 and 8.
Fig.6
Stereological quantification of dense and diffuse amyloid deposits in cortex and hippocampus. Figures show the fractional volume of cortex (A and B) or hippocampus (C and D) occupied by anti-Aβ-26D6-immunoreactive deposits visually identified as dense or diffuse. BL, baseline; C-diet, control (vehicle) diet; C-IgG, isotype control antibody-treated mice, *p < 0.05, pairwise two-tailed t-tests. Data are mean±sd.
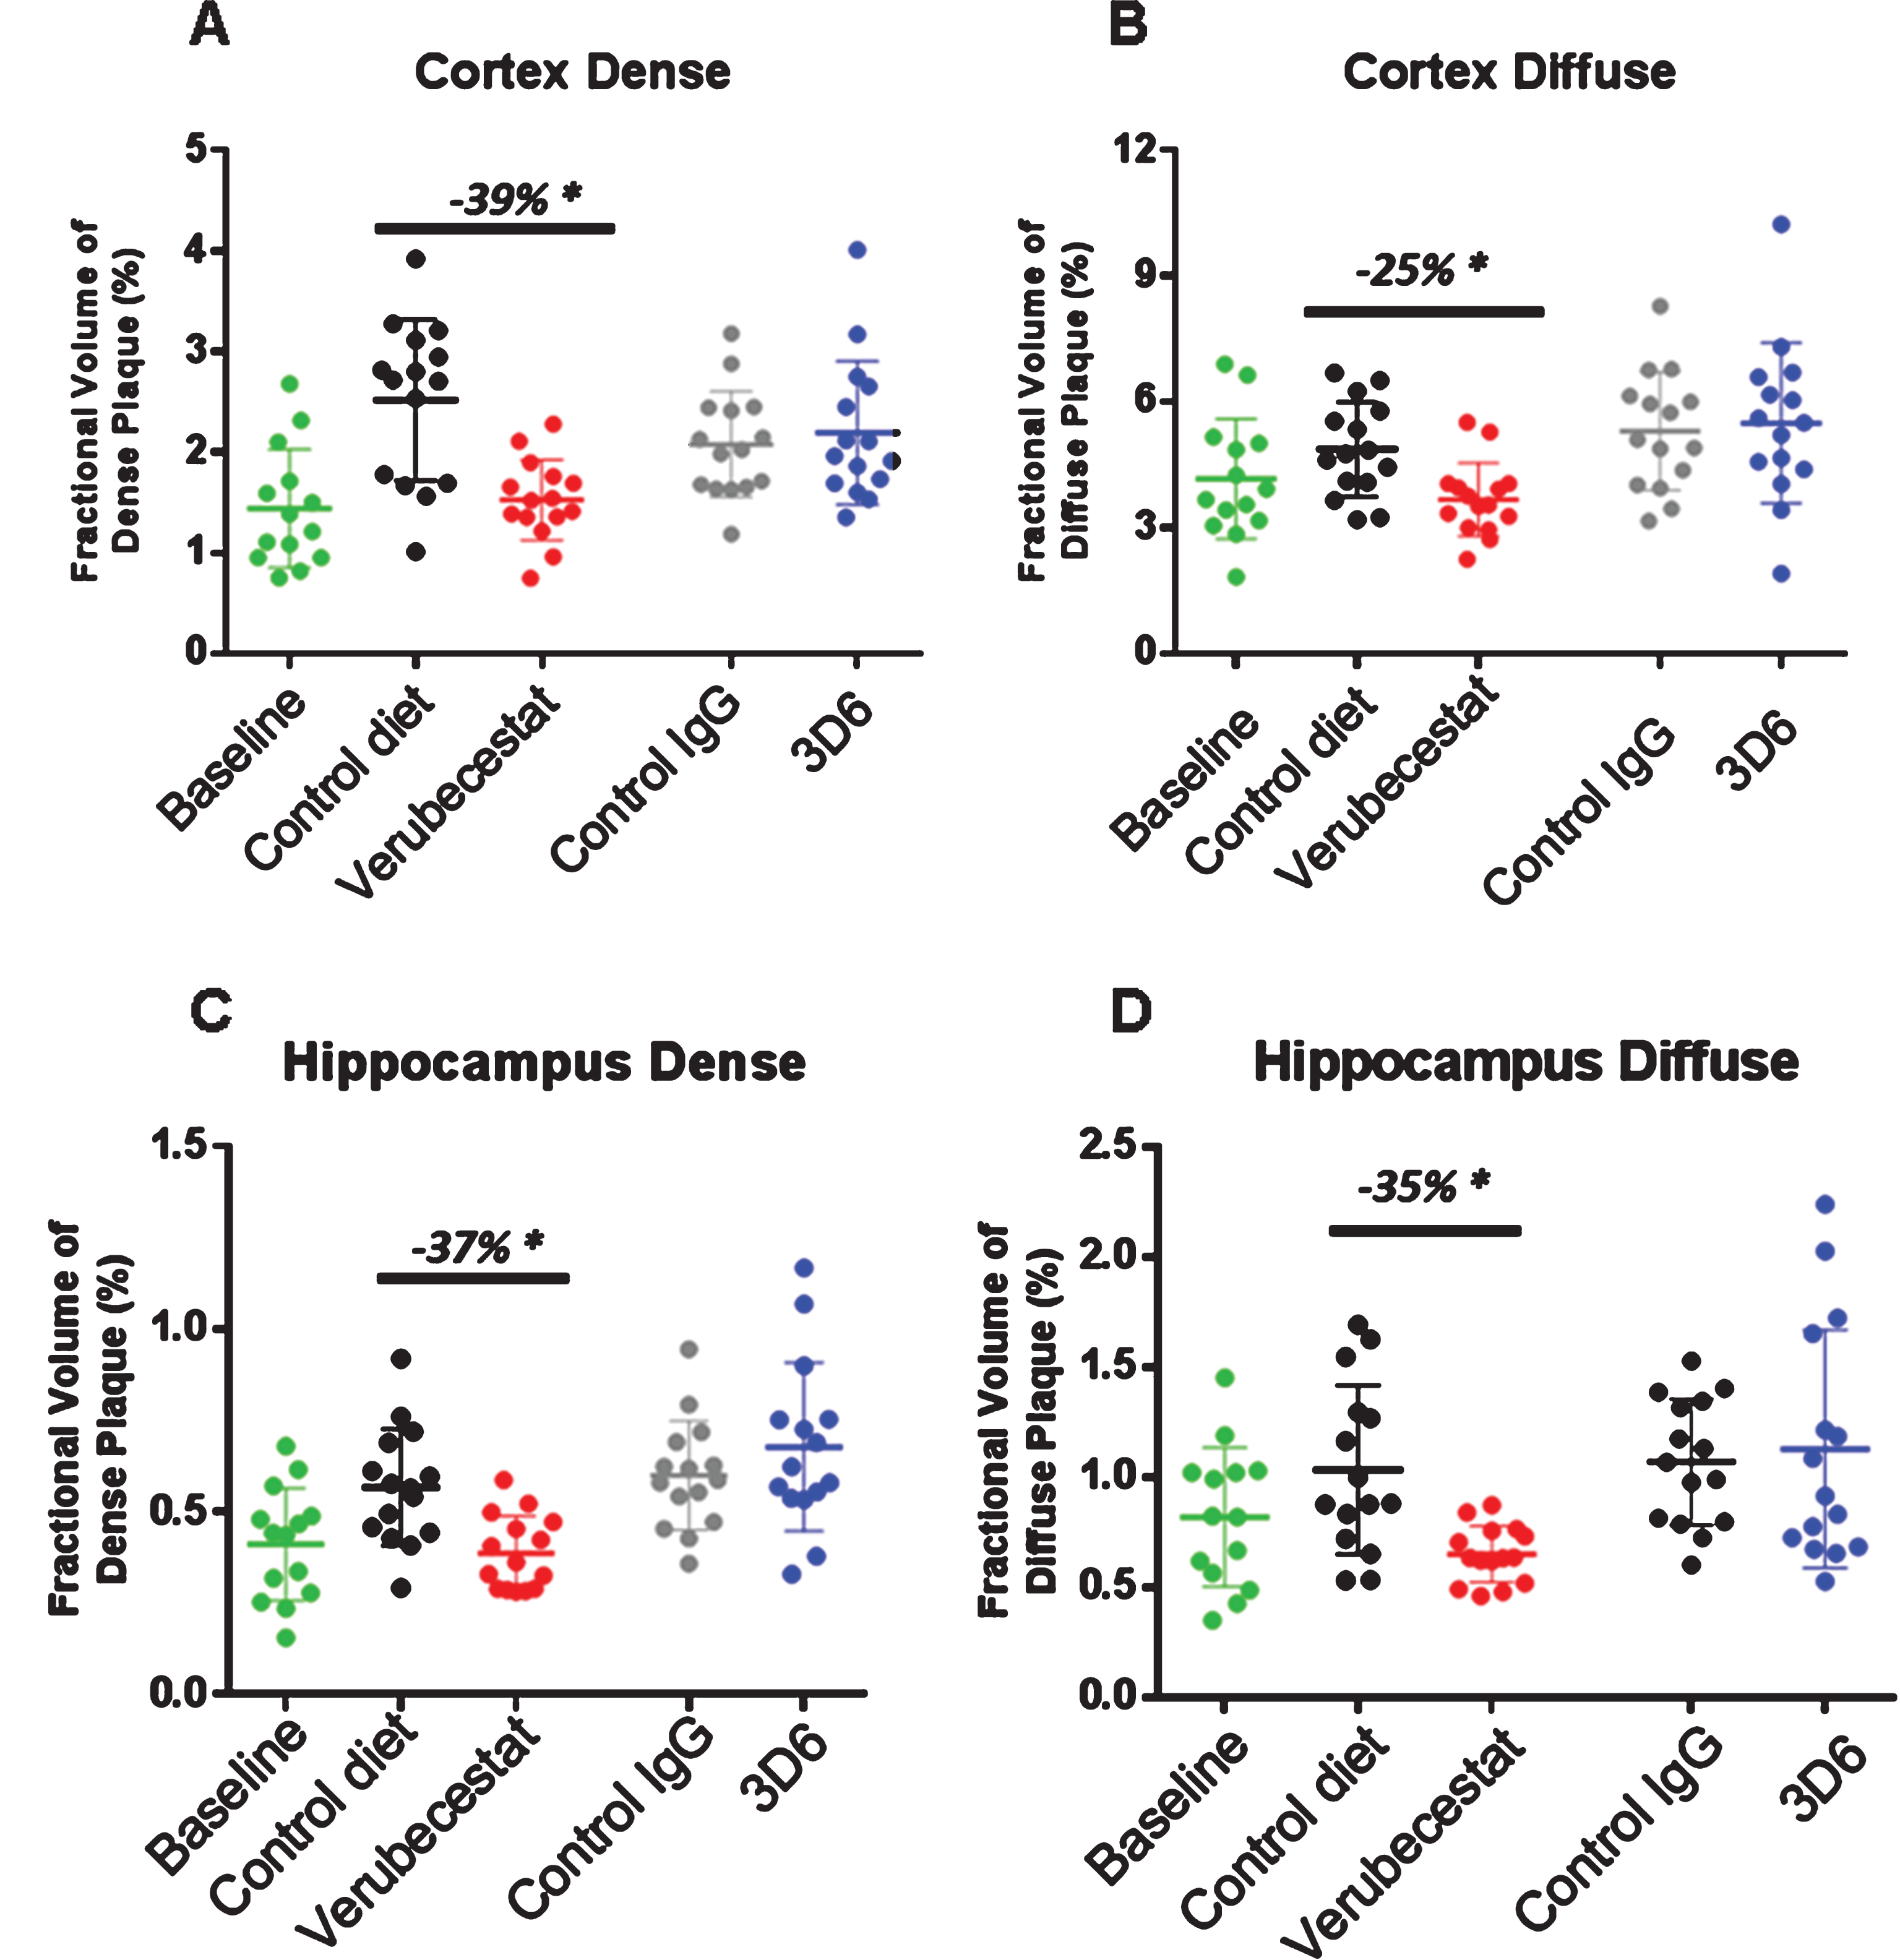
Fig.7
Analysis of total, non-vessel and vessel-associated anti-Aβ40 reactive deposits. A) Representative images of baseline (left), control (vehicle) diet-treated (middle), and verubecestat-treated mouse stained with the C-terminal specific anti-Aβ40 antibody, G2-10 (green) and with an anti-collagen IV antibody to label all blood vessels (red). Scale bar = 500 microns. Magnified insets are to allow for closer inspection of staining profiles. B) Fractional area of total Aβ40-immunoreactive deposits. C) Fractional area of non-vessel Aβ40 deposits determined by subtraction of the area of Aβ40 co-localized with collagen IV positive pixels from the total Aβ40 area and normalized to the total area of the region analyzed. D) The fraction of the Aβ40 deposits associated with vessels as defined by co-localization with collagen IV positive pixels. *p < 0.05, two-tailed t-tests (pairwise). Data are mean±sd.
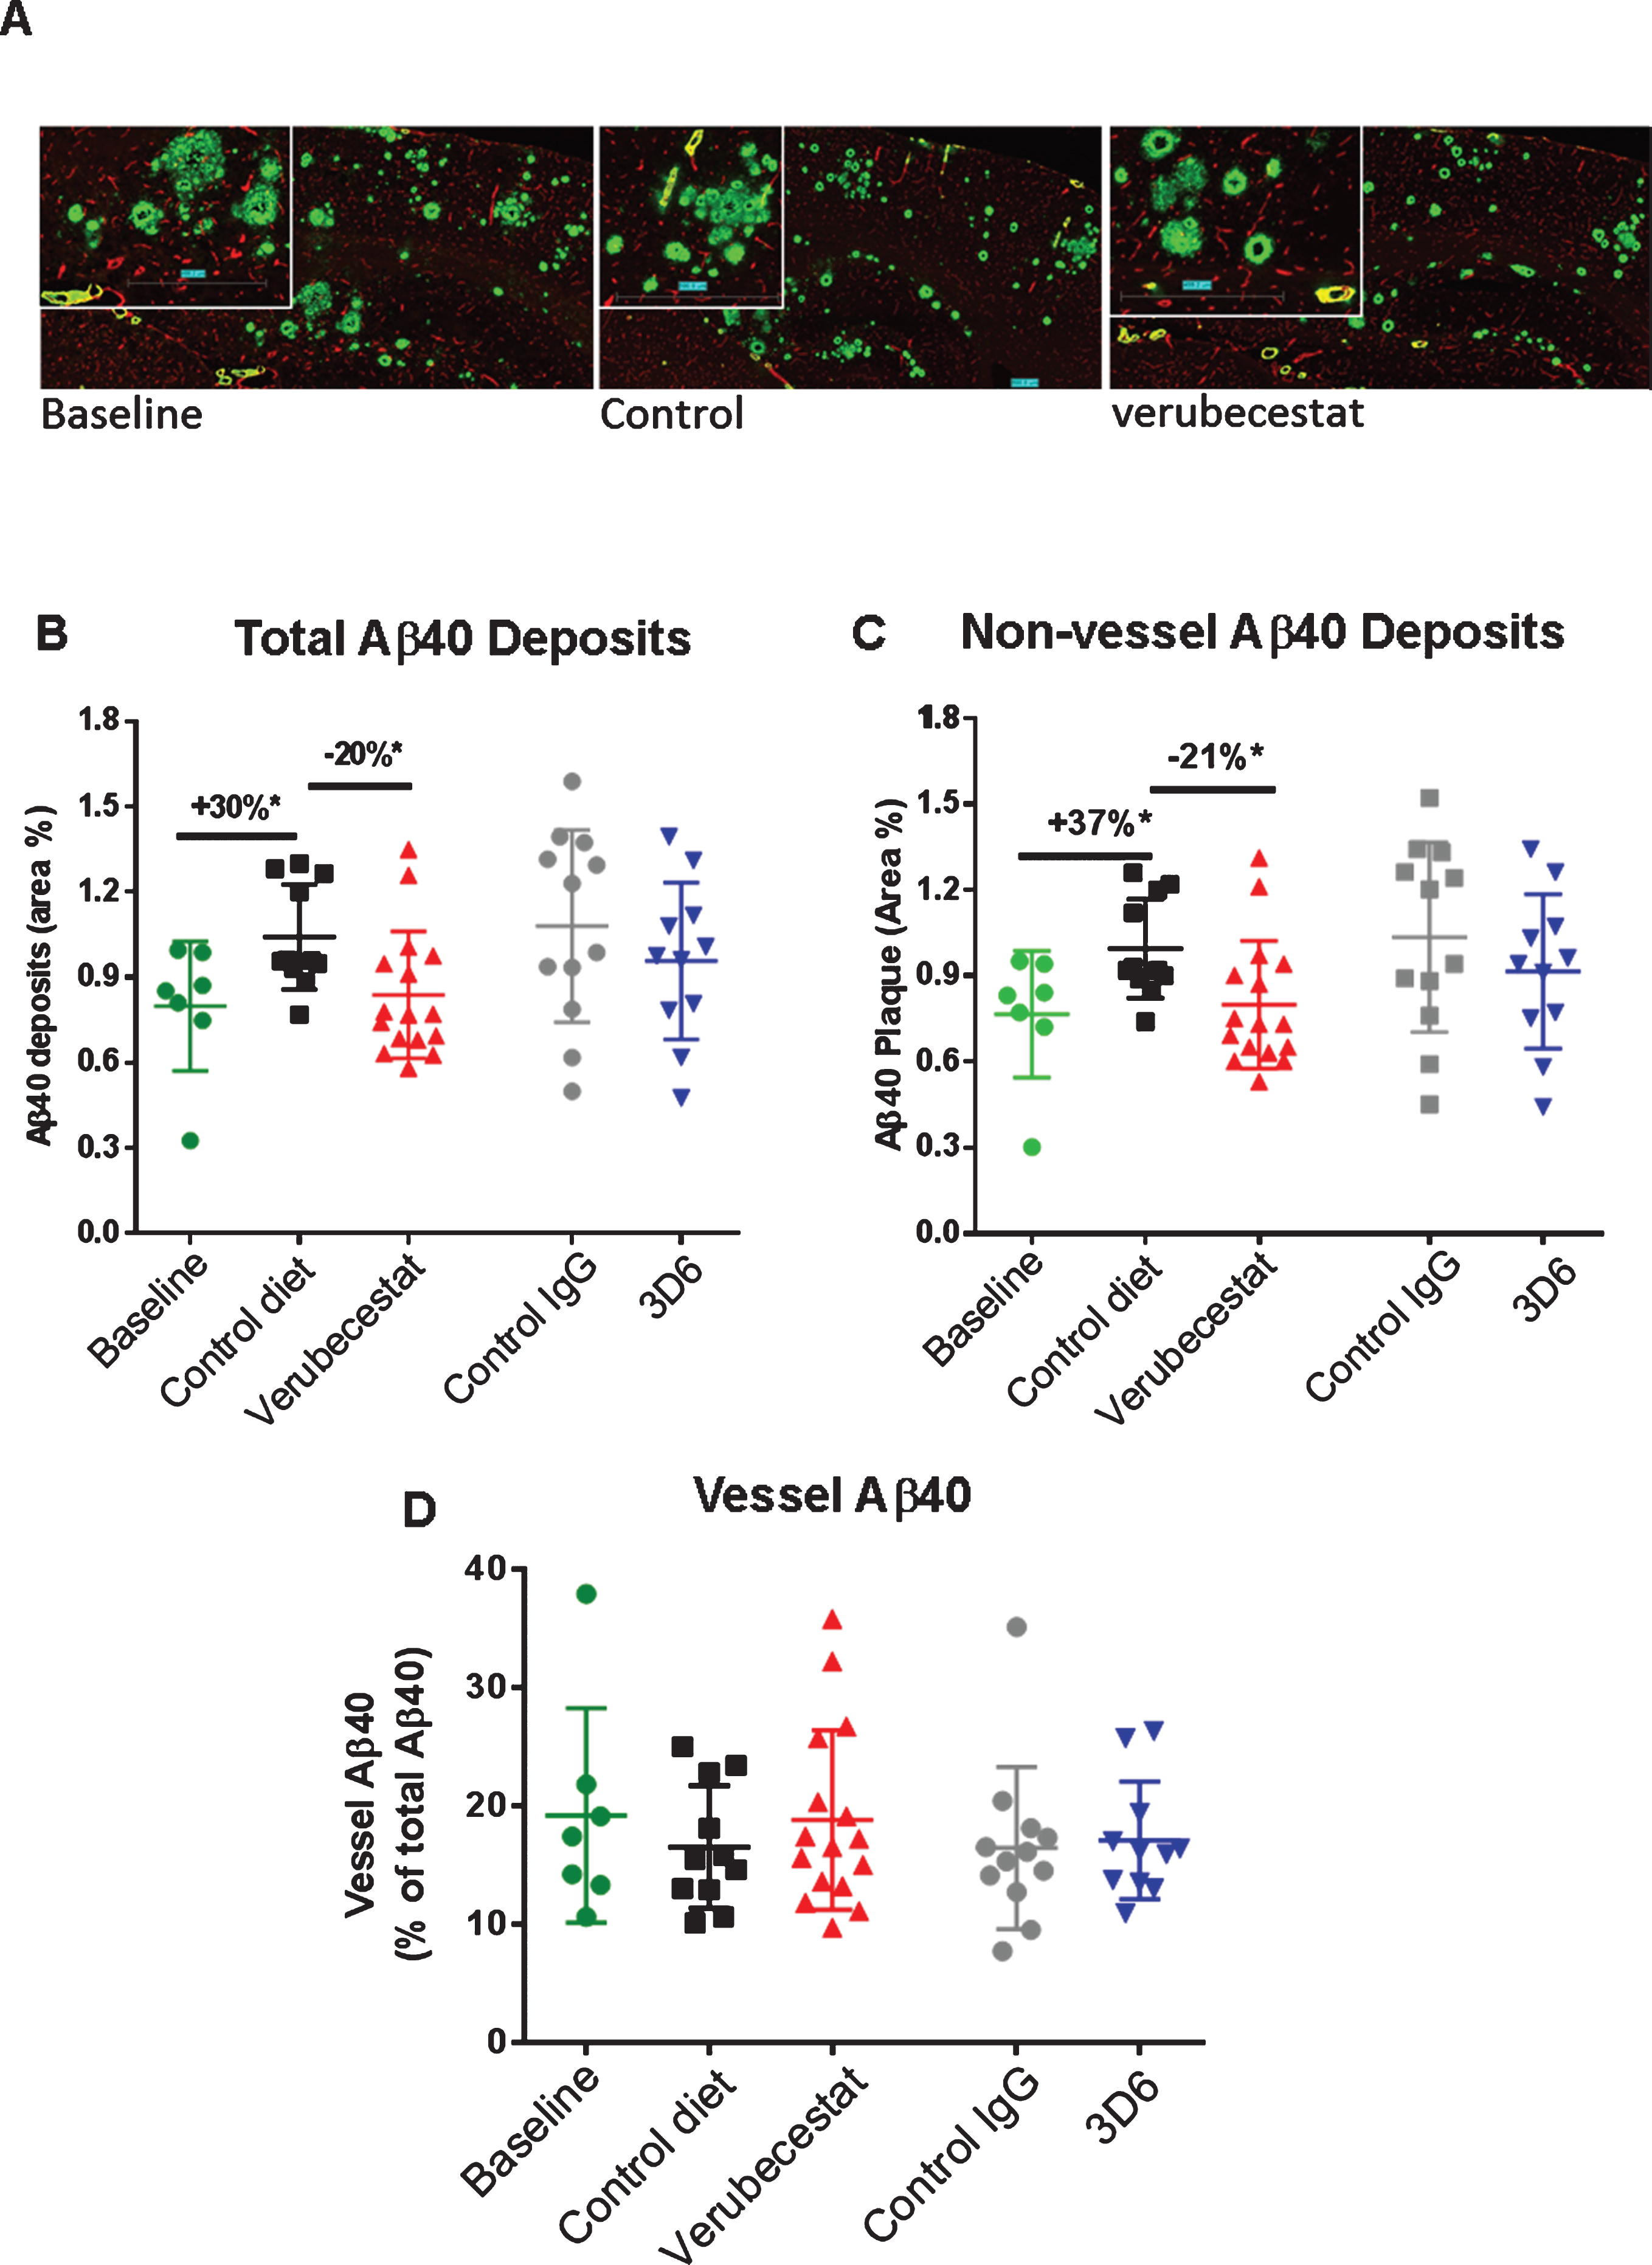
Fig.8
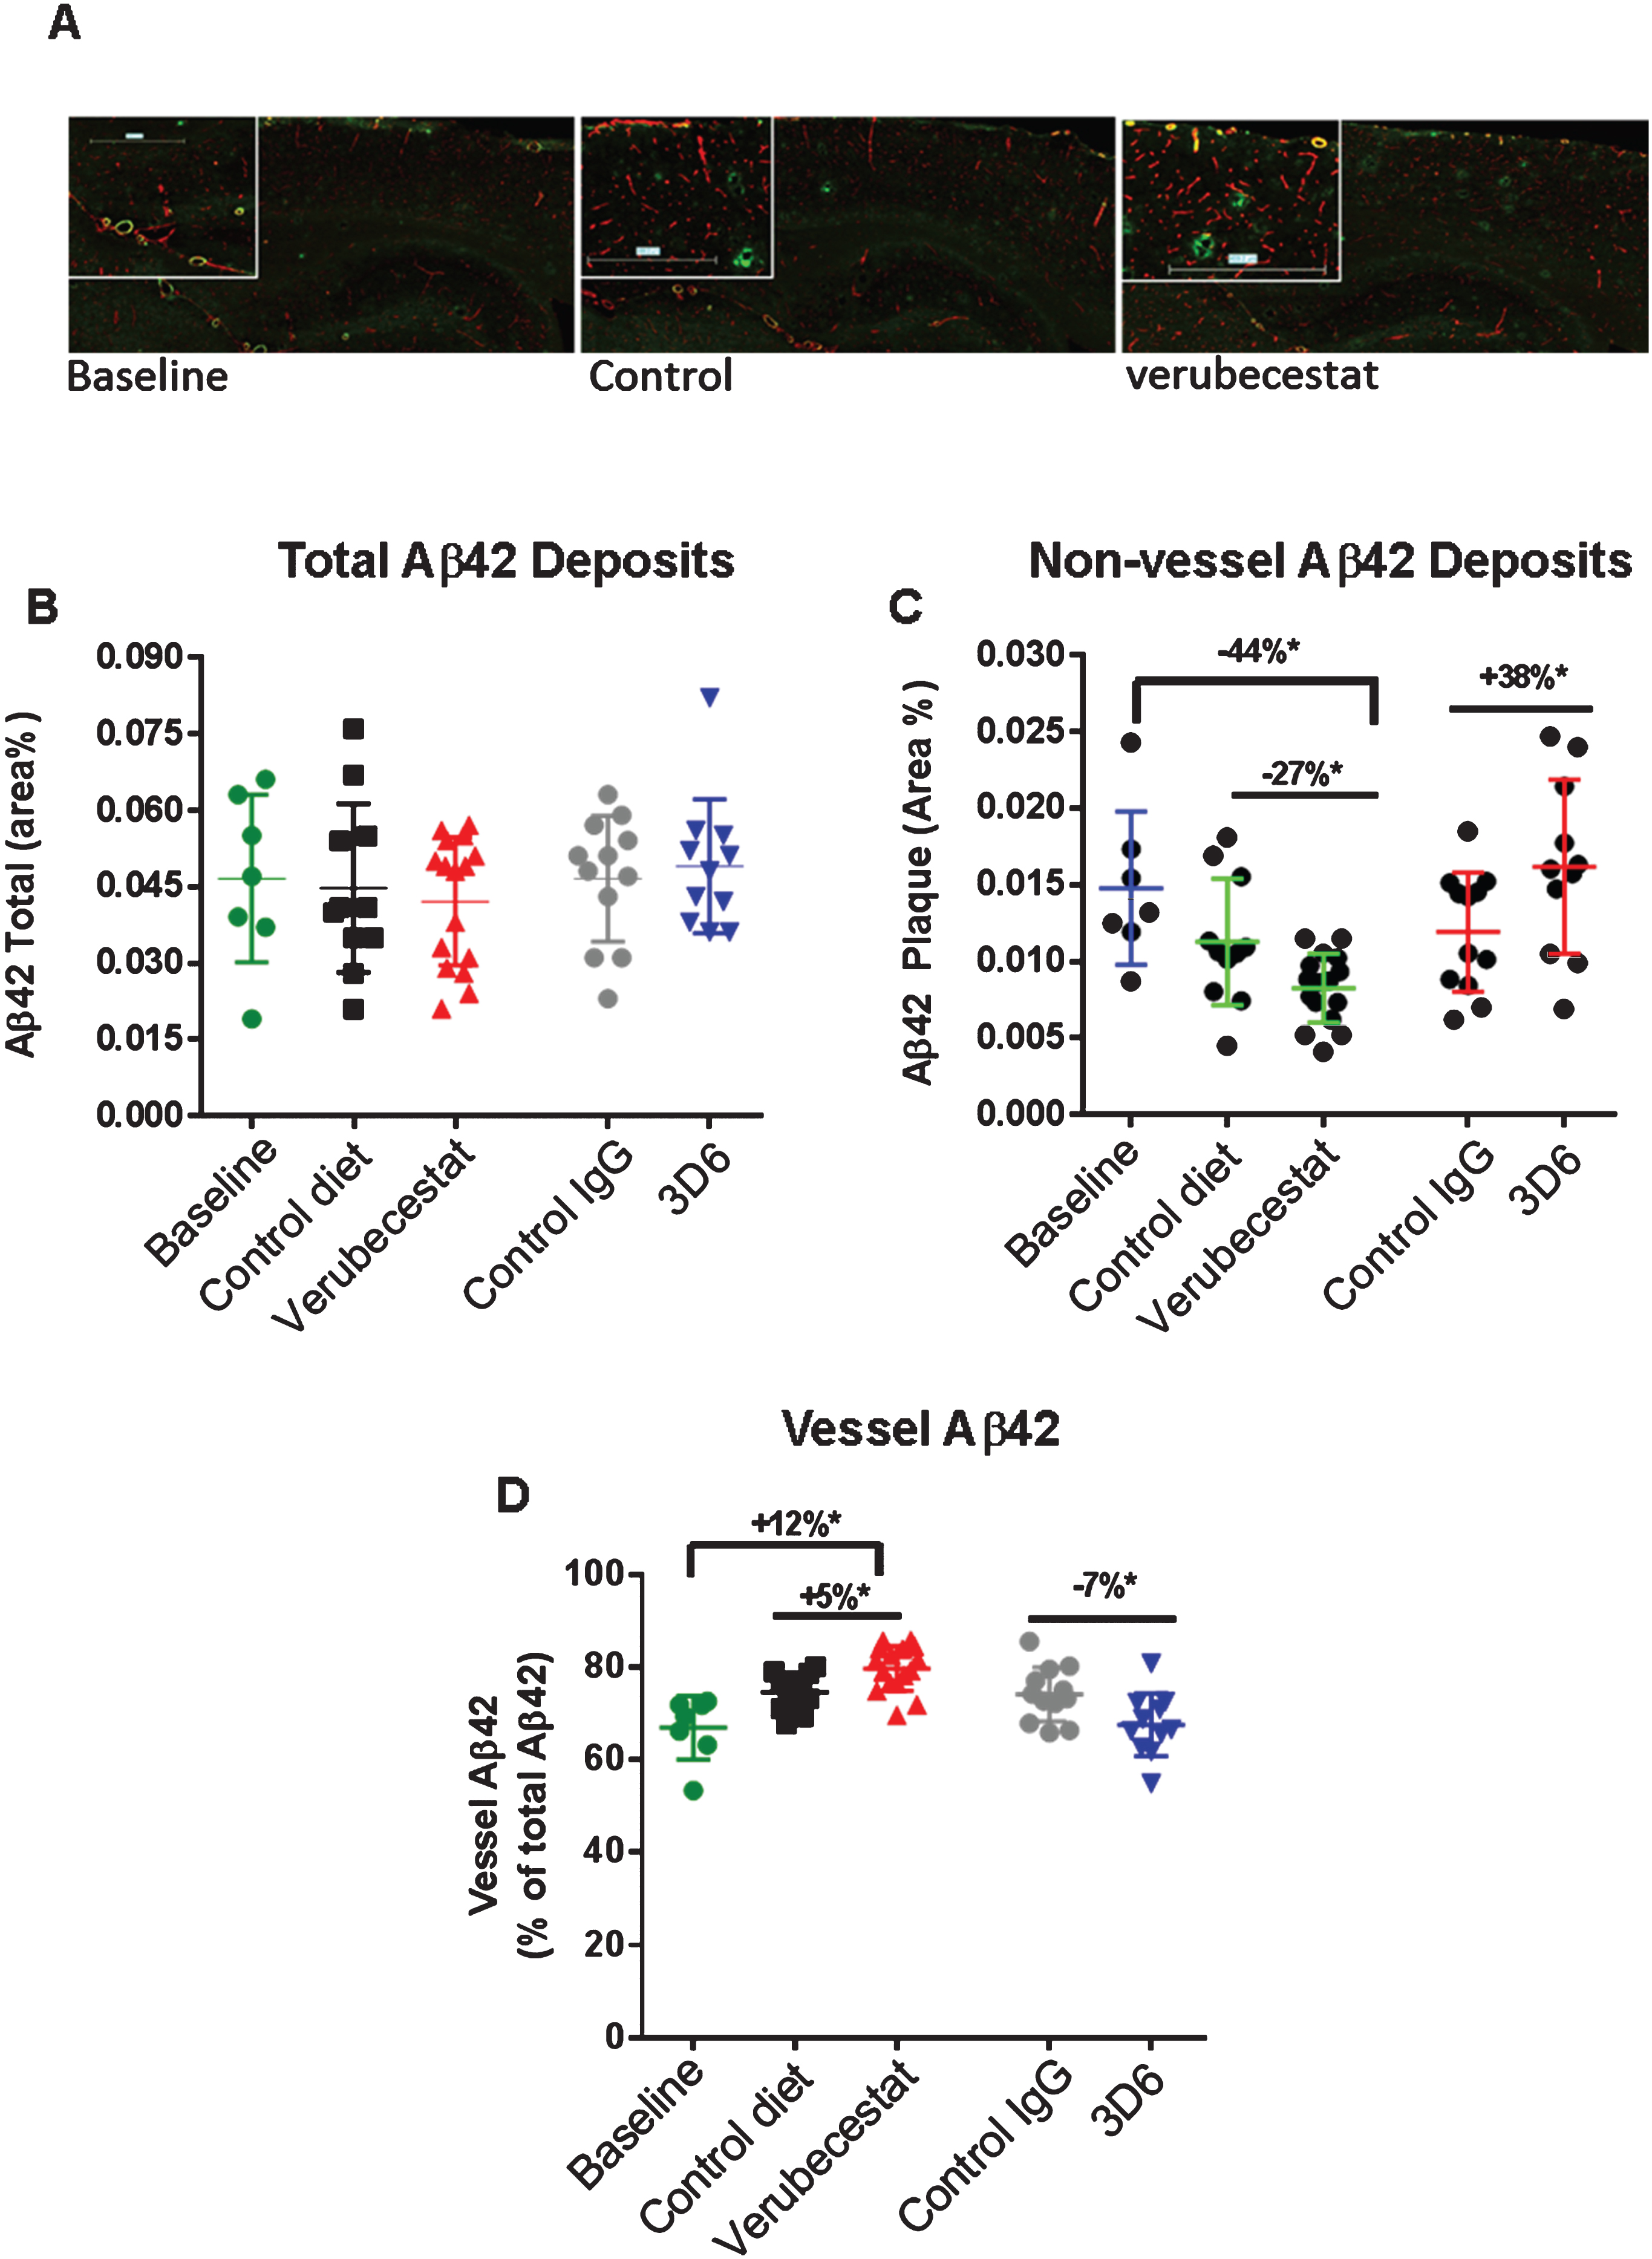
Analysis of total, non-vessel and vessel-associated Aβ42 deposits. A) Representative images from a baseline (left), control (vehicle) diet-treated (middle), and verubecestat-treated mouse stained with the C-terminal specific anti-Aβ42 antibody, G2-11 (green) and with an anti-collagen IV antibody to label all blood vessels (red). Scale bar = 500 microns. Magnified insets are to allow for closer inspection of staining profiles. B) Fractional area of total Aβ42-immunoreactive deposits. C) Fractional area of non-vessel Aβ42-immunoreactive deposits determined by subtraction of the area of Aβ42 staining co-localized with collagen IV positive pixels (defined as vessel-associated Aβ42) from the total area of Aβ42-reactivity. D) Fraction of the total Aβ42 deposits associated with vessels. Aβ42 reactive areas were normalized to the area of the total region analyzed. *p < 0.05 (two-tailed t-tests, pairwise). Data are means±sd.
In an effort to explore the sensitivity to treatment of parenchymal versus cerebrovascular amyloid deposits, we combined dual labeling of sections using Aβ C-terminal epitope specific monoclonal antibodies and an anti-collagen IV antibody [25, 26] that defined brain capillary vessels (Figs. 7A, 8A). Using an image analysis co-localization algorithm, both the total Aβ immunoreactivity (all non-vessel and vessel associated Aβ) and the Aβ reactivity that spatially overlapped only with collagen IV-labeled vessels (vessel Aβ) were measured. The subtraction of vessel-associated Aβ area from total Aβ area defined the non-vessel or parenchymal plaque Aβ pool. Area was normalized to either the whole brain slice area or collagen IV-stained area and these were similar among treatment groups. Vehicle diet- and control antibody-treated animals displayed the anticipated increase in total Aβ40 immunoreactivity after 12 weeks relative to the baseline group (Fig. 7B, +30%, p < 0.05 for vehicle diet versus baseline, t-test). Verubecestat-treated mice displayed significantly reduced total brain Aβ40 positive area compared to vehicle diet-treated mice (–20%, p < 0.02, t-test) that was indistinguishable from baseline animals (Fig. 7B). Verubecestat treatment impacted only the non-vessel associated pool of Aβ40 (cf. Fig. 7B-D). Approximately 20% of the total Aβ40 positive area detected was associated with vessels and levels did not differ across groups (Fig. 7D). Treatment with 3D6 did not significantly alter the levels of Aβ40 deposits whether quantified as total or after separation into non-vessel and vessel-associated pools (c.f. Fig. 7B-D).
A similar analysis was conducted for Aβ42 immunoreactive deposits. The total area occupied by Aβ42 deposits was much less than for Aβ40 in the baseline group (cf. Figs. 7A, 8A) and a much greater fraction of Aβ42 deposits was associated with vessels (>80%, c.f. Figs. 7D, 8D). Total Aβ42 area was not significantly different between the verubecestat or 3D6 treatment groups and their respective controls (Fig. 8B). When separated into non-vessel and vessel pools, non-vessel Aβ42 deposits were reduced in the verubecestat-treated groups relative to the baseline cohort (–44% versus baseline; p < 0.0003, t-test; Fig. 8C). The observed decrease in non-vessel Aβ42 deposits was accompanied by a reciprocal increase in vessel associated Aβ42 in vehicle diet-treated and verubecestat-treated groups relative to baseline (Fig. 8D), though the magnitude of this change was small. The 3D6 treated group showed no change in total Aβ42 deposits versus isotype control-treated mice (Fig. 8B) and a significant increase in non-vessel associated Aβ42 (+38%; p < 0.05, t-test) and a small decrease in vessel Aβ42 deposits (–7%, p < 0.05, t-test; c.f. Fig. 8C, D). The cause of the small shift in Aβ42 localization is not known but could be related to a change in the availability of the Aβ42 C-terminal epitope to bind antibody. Also, the pathophysiological relevance of the low absolute level of Aβ42 deposition makes it difficult to assign pathophysiological relevance to observations on Aβ42 deposition.
A significant association of age was observed for both Thioflavin S profiles and for the non-vessel associated Aβ40 deposits (Supplementary Table 5). As a result, we explored the treatment effects following application of a model that controlled for age effects as was performed for ARIA-H results. The results of this analysis are summarized in Supplementary Table 5 and identified similar treatment effects for verubecestat versus vehicle diet-treated animals across the same endpoints as described above. Overall, there is no obvious relationship between effects on parenchymal versus vessel-associated Aβ40 and Aβ42 immunoreactive deposits and the incidence of ARIA-H. Longer duration of treatment with verubecestat could elicit a greater impact on existing amyloid load and therefore alter ARIA-H status. The anti-Aβ antibody, 3D6, which has previously been reported to recognize native plaques and reduce plaque load under similar study conditions as used here did not reduce amyloid burden in this study despite causing the anticipated increase in ARIA-H.
DISCUSSION
We examined the impact of the investigational β-secretase inhibitor, verubecestat, on ARIA-H status in an advanced aged transgenic mouse model of amyloidosis. Completion of this study was an FDA prerequisite for initiation of the Phase III study of verubecestat in mild-moderate AD (NCT01739348) and the ongoing study in prodromal AD patients (NCT01953601). The results were anticipated to inform on two primary questions: 1) Is verubecestat-mediated reduction of CNS Aβ synthesis associated with worse ARIA-H profiles in aged post-plaque AD mice?; and 2) Does exposure of aged Tg2576 mice to levels of verubecestat that are substantially higher than the targeted exposures in human AD patients result in an increased ARIA-H response? The latter question addresses the potential for an unanticipated non-mechanism-based effect of the verubecestat molecule on ARIA-H in an ARIA-permissive background. Based on prior studies, verubecestat delivered in-diet produced a stable level of CNS Aβ lowering over 24 h that is comparable to clinical CSF Aβ lowering targets. At the time this study was initiated, several investigative passive anti-Aβ immunotherapies already were shown to be associated with increased ARIA-E and ARIA-H in AD patients [12]. In the case of N-terminally directed anti-Aβ antibody, bapineuzimab, it was unclear whether the ARIA findings in humans were solely adverse or a direct consequence of the pharmacological activity of the antibody to bind to and mobilize clearance of amyloid plaque [9, 14]. However, the dose-related increase in the incidence and severity of symptomatic ARIA events in AD patients receiving bapineuzimab was sufficiently severe to force dose capping at 0.5 mg/kg, a dose well below the originally targeted top dose of 5 mg/kg [8, 9]. Currently there are no preclinical animal models that predict the likelihood that a novel disease modifying agent will elicit increased ARIA in patients. Working backwards from the clinical experience, bapineuzimab was shown to elevate ARIA-H in aged (>18 m) post-plaque Tg2576 mice following 3-6-months treatment [14, 17, 22, 27–31]. Like in humans, the ARIA-H-inducing effects of bapineuzimab in mice were dose-related and were associated with the antibody’s ability to bind to native vascular amyloid deposits [14]. The cumulative data from multiple studies of immunotherapies in aged TgAβPP mice demonstrate that ARIA-H can be observed and modulated following Aβ targeted interventions and provided face-validity for the verubecestat study design described here. In addition to the published observations, there was the practical consideration of having access to a relatively large group of aged Tg2576 (>18-month-old) mice in-house to support the study. The 12-week long study in 18-22-month-old Tg2576 mice examined ARIA-H by T2*-MRI and quantitative assessment of Prussian blue histochemical staining and in the same subjects measured the impact of verubecestat treatment on plaque load and amyloid distribution between the brain parenchyma and vasculature. Because of the wider than desired range of ages of the mice, a multivariate linear regression analysis was performed that identified an impact of age on ARIA profiles that was controlled for across analyses.
Verubecestat was well tolerated and there were no significant differences in survival across the dose groups. As observed in prior chronic studies, patchy fur hypopigmentation was evident in verubecestat-treated animals that progressed during the 12 weeks of treatment (data not shown). Hypopigmentation caused by BACE inhibition and observed in Bace2 and Bace1/Bace2 knockout mice has been described [32, 33]. Consistent with the BACE1 inhibitor mechanism of action, plasma Aβ was reduced to near background levels and was coupled with 62–68% reduction of CSF Aβ, the primary clinical biomarker of CNS BACE1 enzyme activity [1]. Verubecestat reduced brain sAβPPβswe levels by 67% which confirms robust CNS target engagement. Changes in cortical sAβPPβswe levels directly reflect BACE1 activity since sAβPPβ is a direct product of BACE1 cleavage of AβPP and does not participate in plaque formation. The clinical translational relevance of the study design is rooted in the in-diet delivery approach that resulted in sustained exposures and pharmacodynamic effects on CNS Aβ that mimic once daily dosing of verubecestat at 12–40 mg in AD patients [1]. Importantly, the CSF amyloid lowering of ∼70% suppressed further accrual of cortical and hippocampal amyloid deposition in the mice resulting in aged animals with plaque profiles indistinguishable from baseline. Longer duration studies could reveal evidence of plaque regression but this will be most effectively determined by longitudinal amyloid PET imaging in human AD patients.
ARIA-H events leave behind long-lived hemoglobin-derived iron deposits that can be detected by T2*-MRI and Prussian blue histochemical staining. The spatial resolution for MRI detection of ARIA-H events was limited to a 100×100 μ2 area and thus identified larger, less frequent events. Overall, the number of new MRI-detected ARIA-H events was small between all groups and neither chronic verubecestat nor 3D6 treatment resulted in significantly elevated ARIA-H events compared to their respective control groups. Verubecestat-treated mice displayed the lowest level of new ARIA-H events across all groups (1.45 events) relative to 3D6-treated mice which displayed the highest number of new ARIA-H events (3.81 events). In contrast, the Prussian blue detection method was able to define much smaller ARIA-H deposits and revealed clear evidence for significant between group differences in ARIA-H. The 3D6-treated mice displayed a+145%, p < 0.002, 95% CI[42, 322] increase in Prussian blue area relative to control antibody treated mice while there was no significant difference in Prussian blue area in verubecestat-treated mice relative to control animals (–30.7%, p = 0.181, 95% CI [–59.2,–19.2]). Similar changes were observed for comparisons of numbers of Prussian blue positive objects. ARIA-H profiles in verubecestat-treated mice were no different from controls suggesting neither BACE1 inhibition nor high systemic exposures of verubecestat, required for Aβ reduction in Tg2576 mice relative to non-transgenic rodents [1], increase ARIA-H in mice and predict a low liability for ARIA-H with verubecestat treatment in AD patients. Major limitations of this study include the short duration of treatment and the inability to monitor for ARIA-E, a marker of increased cerebrovascular permeability. Though detectable by MRI imaging, ARIA-E is difficult to capture in mice since as in humans it occurs transiently and often without symptoms.
Verubecestat treatment is intended to achieve therapeutic benefit in AD patients by slowing or halting the accrual of toxic amyloid plaques and Aβ oligomers [3, 7]. ARIA events may be mechanistically related to the physical removal of amyloid deposits from within or around brain blood vessels by anti-amyloid antibodies or by shifts in the equilibrium from insoluble aggregates to soluble Aβ that could occur with BACE1 inhibition [23, 34]. Indeed, doses of bapineuzimab that induced ARIA are associated with plaque clearance [9, 14]. Therefore, to explore the relationship between ARIA-H profiles as a function of treatment on the status of amyloid pathology, we measured multiple biochemical and histological endpoints related to amyloid accumulation. Verubecestat-treated mice displayed modest 24% or 16% reduction of guanidine-soluble brain Aβ40 and Aβ42 peptide respectively relative to vehicle-treated animals. The level of total brain Aβ in verubecestat-treated mice was indistinguishable from the baseline group suggesting that verubecestat halted accrual of insoluble brain Aβ. Consistent with total Aβ biochemical measures, multiple histological measures demonstrated that Aβ deposits were lower in in brain sections of verubecestat-treated animals. The area occupied by Thioflavin S staining and the numbers of diffuse and dense Aβ plaques in the cortex and hippocampus were all significantly reduced by verubecestat. Since changes in vascular amyloid deposits may be most closely tied to ARIA profiles, we also examined the potential for treatments to have a differential impact on parenchymal versus vascular Aβ deposits by performing multiplex staining for Aβ40 or Aβ42 with a blood vessel specific marker. Non-vessel associated Aβ40 and Aβ42 levels were reduced by verubecestat treatment while vessel-associated Aβ42 immunoreactivity appeared minimally increased. Unexpectedly there was a significant decrease in Aβ42 deposits in vehicle diet treated mice relative to the baseline group. The source of this decrease is not known. The small increase in vascular Aβ42 was not associated with an increase in ARIA-H which is consistent with a recent report comparing parenchymal and vascular Aβ distributions in human AβPP knock-in mice expressing AβPPSwedish/London mutation with or without the CAA causing Dutch mutation (Aβ:E22Q) [35]. Longer treatment periods would be required to determine if verubecestat treatment could elicit suppression of brain Aβ levels well below the baseline cohort that would be consistent with amyloid clearance.
Mice treated with the bapineuzimab analog, 3D6, for 12 weeks showed the expected increase in plasma Aβ levels indicative of target engagement and a significant elevation in ARIA-H as measured by Prussian blue staining or qualitative review of Prussian blue profiles by a board-certified toxicologist. The increase in ARIA-H occurred despite minimal effects of 3D6 on brain Aβ load. This contrasts with published findings showing significant 3D6 mediated clearance of existing plaques [14]. A longer treatment period may have elicited a greater impact of 3D6 on brain Aβ load but nonetheless the 3D6 treated animals demonstrated elevated ARIA-H which supports that this approach was sensitive enough to detect elevation of ARIA-H.
Subsequent to the early negative clinical experience with anti-Aβ induced ARIA, all human AD trials of amyloid directed agents of 3-month duration or longer were required to conduct MRI-based monitoring for ARIA events at baseline and at regular 3-month intervals. At the time of completion of the study described here, regular monitoring for ARIA was required in all amyloid-targeted chronic treatment trials; however, this requirement has since been lifted based on the cumulative experience of ARIA across multiple clinical development programs and the completion of studies like the one described here. ARIA still remains a challenge for some experimental anti-amyloid agents. For example, the increased ARIA profiles observed for bapineuzimab were also observed for aducanumab, an anti-Aβ antibody discovered through screening of endogenous human IgGs capable of binding to plaques [36]. In a chronic Phase Ib study in AD patients, aducanumab treatment resulted in reduced amyloid PET signal over time but was also associated with a similar dose dependent increase in ARIA-E [36]. Consistent with the lack of effect of verubecestat on ARIA-H in aged Tg2576 mice, despite suppression of brain amyloid accumulation, ARIA has not emerged as a limiting factor in the ongoing Phase III clinical trials of verubecestat. The recently terminated Phase III trial of verubecestat in mild-to-moderate AD patients should yield valuable information on the impact of reducing CNS Aβ by≥75% on plaque load, safety endpoints and MRI-related endpoints including ARIA-H and ARIA-E over the >18 months of treatment. Importantly, the ongoing Phase III trial of verubecestat in prodromal AD patients will explore the impact of chronic inhibition of CNS Aβ synthesis on cognition and function at much earlier stages of AD.
ACKNOWLEDGMENTS
We gratefully acknowledge the dedication of the verubecestat discovery and clinical development teams and for their input on the preclinical ARIA study design. We thank Lindsey Stahl, Sherry Lu, Dahai Xue, and Jacob Marcus for their expert technical assistance. We thank Dr. Gebre Mesfin for peer review of pathology. We acknowledge Ryan Anstatt for compound analytical support and Adam Smith for contributions to image analysis algorithm development. We thank colleagues for critical review of the manuscript.
Authors’ disclosures available online (http://j-alz.com/manuscript-disclosures/17-0056r1).
SUPPLEMENTARY MATERIAL
[1] The supplementary material is available in the electronic version of this article: http://dx.doi.org/10.3233/JAD-170056.
REFERENCES
[1] | Kennedy ME , Stamford AW , Chen X , Cox K , Cumming JN , Dockendorf M , Egan M , Ereshefsky L , Hodgson RA , Hyde LA , Jhee S , Kleijn H , Kuvelkar R , Li W , Mattson B , Mei H , Palcza J , Scott JD , Tanen M , Troyer M , Tseng J , Parker EM , Stone J , Forman M ((2016) ) Discovery of Verubecestat (MK-8931), a BACE1 inhibitor that dramatically reduces CNS Aβ levels in Alzheimer’s disease patients. Sci Transl Med 8: , 363ra150. |
[2] | Hardy J , Selkoe DJ ((2002) ) The amyloid hypothesis of Alzheimer’s disease: Progress and problems on the road to therapeutics. Science 297: , 353–356. |
[3] | Selkoe DJ , Hardy J ((2016) ) The amyloid hypothesis of Alzheimer’s disease at 25 years. EMBO Mol Med 8: , 595–608. |
[4] | Bateman RJ , Aisen PS , De Strooper B , Fox NC , Lemere CA , Ringman JM , Salloway S , Sperling RA , Windisch M , Xiong C ((2011) ) Autosomal-dominant Alzheimer’s disease: A review and proposal for the prevention of Alzheimer’s disease. Alzheimers Res Ther 3: , 1. |
[5] | Barao S , Moechars D , Lichtenthaler SF , De Strooper B ((2016) ) BACE1 Physiological functions may limit its use as therapeutic target for Alzheimer’s disease. Trends Neurosci 39: , 158–169. |
[6] | Vassar R , Kuhn PH , Haass C , Kennedy ME , Rajendran L , Wong PC , Lichtenthaler SF ((2014) ) Function, therapeutic potential and cell biology of BACE proteases: Current status and future prospects. J Neurochem 130: , 4–28. |
[7] | Karran E , Hardy J ((2014) ) A critique of the drug discovery and phase 3 clinical programs targeting the amyloid hypothesis for Alzheimer disease. Ann Neurol 76: , 185–205. |
[8] | Salloway S , Sperling R , Gilman S , Fox NC , Blennow K , Raskind M , Sabbagh M , Honig LS , Doody R , van Dyck CH , Mulnard R , Barakos J , Gregg KM , Liu E , Lieberburg I , Schenk D , Black R , Grundman M , Bapineuzumab 201 Clinical Trial, Investigators ((2009) ) A phase 2 multiple ascending dose trial of bapineuzumab in mild to moderate Alzheimer disease. Neurology 73: , 2061–2070. |
[9] | Arrighi HM , Barakos J , Barkhof F , Tampieri D , Jack C Jr , Melançon D , Morris K , Ketter N , Liu E , Brashear HR ((2016) ) Amyloid-related imaging abnormalities-haemosiderin (ARIA-H) in patients with Alzheimer’s disease treated with bapineuzumab: A historical, prospective secondary analysis. J Neurol Neurosurg Psychiatry 87: , 106–112. |
[10] | Piazza F , Winblad B ((2016) ) Amyloid-Related Imaging Abnormalities (ARIA) in immunotherapy trials for Alzheimer’s disease: Need for prognostic biomarkers? J Alzheimers Dis 52: , 417–420. |
[11] | Briggs R , Kennelly SP , O’Neill D ((2016) ) Drug treatments in Alzheimer’s disease. Clin Med (Lond) 16: , 247–253. |
[12] | Sperling RA , Jack CR Jr , Black SE , Frosch MP , Greenberg SM , Hyman BT , Scheltens P , Carrillo MC , Thies W , Bednar MM , Black RS , Brashear HR , Grundman M , Siemers ER , Feldman HH , Schindler RJ ((2011) ) Amyloid-related imaging abnormalities in amyloid-modifying therapeutic trials: Recommendations from the Alzheimer’s Association Research Roundtable Workgroup. Alzheimers Dement 7: , 367–385. |
[13] | Bard F , Cannon C , Barbour R , Burke RL , Games D , Grajeda H , Guido T , Hu K , Huang J , Johnson-Wood K , Khan K , Kholodenko D , Lee M , Lieberburg I , Motter R , Nguyen M , Soriano F , Vasquez N , Weiss K , Welch B , Seubert P , Schenk D , Yednock T ((2000) ) Peripherally administered antibodies against amyloid beta-peptide enter the central nervous system and reduce pathology in a mouse model of Alzheimer disease. Nat Med 6: , 916–919. |
[14] | Zago W , Schroeter S , Guido T , Khan K , Seubert P , Yednock T , Schenk D , Gregg KM , Games D , Bard F , Kinney GG ((2013) ) Vascular alterations in PDAPP mice after anti-Abeta immunotherapy: Implications for amyloid-related imaging abnormalities. Alzheimers Dement 9: , S105–S115. |
[15] | Coric V , van Dyck CH , Salloway S , Andreasen N , Brody M , Richter RW , Soininen H , Thein S , Shiovitz T , Pilcher G , Colby S , Rollin L , Dockens R , Pachai C , Portelius E , Andreasson U , Blennow K , Soares H , Albright C , Feldman HH , Berman RM ((2012) ) Safety and tolerability of the gamma-secretase inhibitor avagacestat in a phase 2 study of mild to moderate Alzheimer disease. Arch Neurol 69: , 1430–1440. |
[16] | Pfeifer M , Boncristiano S , Bondolfi L , Stalder A , Deller T , Staufenbiel M , Mathews PM , Jucker M ((2002) ) Cerebral hemorrhage after passive anti-Abeta immunotherapy. Science 298: , 1379. |
[17] | Wilcock D , Rojiani A , Rosenthal A , Subbarao S , Freeman M , Gordon M , Morgan D ((2004) ) Passive immunotherapy against Abeta in aged APP-transgenic mice reverses cognitive deficits and depletes parenchymal amyloid deposits in spite of increased vascular amyloid and microhemorrhage. J Neuroinflammation 1: , 24. |
[18] | Racke MM , Boone LI , Hepburn DL , Parsadainian M , Bryan MT , Ness DK , Piroozi KS , Jordan WH , Brown DD , Hoffman WP , Holtzman DM , Bales KR , Gitter BD , May PC , Paul SM , DeMattos RB ((2005) ) Exacerbation of cerebral amyloid angiopathy-associated microhemorrhage in amyloid precursor protein transgenic mice by immunotherapy is dependent on antibody recognition of deposited forms of amyloid beta. J Neurosci 25: , 629–636. |
[19] | Adolfsson O , Pihlgren M , Toni N , Varisco Y , Buccarello AL , Antoniello K , Lohmann S , Piorkowska K , Gafner V , Atwal JK , Maloney J , Chen M , Gogineni A , Weimer RM , Mortensen DL , Friesenhahn M , Ho C , Paul R , Pfeifer A , Muhs A , Watts RJ ((2012) ) An effector-reduced anti-beta-amyloid (Abeta) antibody with unique Abeta binding properties promotes neuroprotection and glial engulfment of Abeta. J Neurosci 32: , 9677–9689. |
[20] | Luo F , Rustay NR , Seifert T , Roesner B , Hradil V , Hillen H , Ebert U , Severin JM , Cox BF , Llano DA , Day M , Fox GB ((2010) ) Magnetic resonance imaging detection and time course of cerebral microhemorrhages during passive immunotherapy in living amyloid precursor protein transgenic mice. J Pharmacol Exp Ther 335: , 580–588. |
[21] | Hsiao K , Chapman P , Nilsen S , Eckman C , Harigaya Y , Younkin S , Yang F , Cole G ((1996) ) Correlative memory deficits, Abeta elevation, and amyloid plaques in transgenic mice. Science 274: , 99–102. |
[22] | Beckmann N , Gérard C , Abramowski D , Cannet C , Staufenbiel M ((2011) ) Noninvasive magnetic resonance imaging detection of cerebral amyloid angiopathy-related microvascular alterations using superparamagnetic iron oxide particles in APP transgenic mouse models of Alzheimer’s disease: Application to passive Abeta immunotherapy. J Neurosci 31: , 1023–1031. |
[23] | Dobrowolska JA , Michener MS , Wu G , Patterson BW , Chott R , Ovod V , Pyatkivskyy Y , Wildsmith KR , Kasten T , Mathers P , Dancho M , Lennox C , Smith BE , Gilberto D , McLoughlin D , Holder DJ , Stamford AW , Yarasheski KE , Kennedy ME , Savage MJ , Bateman RJ ((2014) ) CNS amyloid-β, soluble APP-α and -β kinetics during BACE inhibition. J Neurosci 34: , 8336–8346. |
[24] | Greenberg SM , Vernooij MW , Cordonnier C , Viswanathan A , Al-Shahi Salman R , Warach S , Launer LJ , Van Buchem MA , Breteler MM , Microbleed Study, Group ((2009) ) Cerebral microbleeds: A guide to detection and interpretation. Lancet Neurol 8: , 165–174. |
[25] | Madsen K , Holmskov U ((1995) ) Capillary density measurements in skeletal muscle using immunohistochemical staining with anti-collagen type IV antibodies. Eur J Appl Physiol Occup Physiol 71: , 472–474. |
[26] | Cebasek V , Kubínová L , Ribarič S , Erzen I ((2004) ) A novel staining method for quantification and 3D visualisation of capillaries and muscle fibres. Eur J Histochem 48: , 151–158. |
[27] | Schroeter S , Khan K , Barbour R , Doan M , Chen M , Guido T , Gill D , Basi G , Schenk D , Seubert P , Games D ((2008) ) Immunotherapy reduces vascular amyloid beta in PDAPP mice. J Neurosci 28: , 6787–6793. |
[28] | Wilcock DM , Rojiani A , Rosenthal A , Levkowitz G , Subbarao S , Alamed J , Wilson D , Wilson N , Freeman MJ , Gordon MN , Morgan D ((2004) ) Passive amyloid immunotherapy clears amyloid and transiently activates microglia in a transgenic mouse model of amyloid deposition. J Neurosci 24: , 6144–6151. |
[29] | Wilcock DM , Munireddy SK , Rosenthal A , Ugen KE , Gordon MN , Morgan D ((2004) ) Microglial activation facilitates Abeta plaque removal following intracranial anti-Abeta antibody administration. Neurobiol Dis 15: , 11–20. |
[30] | Wilcock DM , Alamed J , Gottschall PE , Grimm J , Rosenthal A , Pons J , Ronan V , Symmonds K , Gordon MN , Morgan D ((2006) ) Deglycosylated anti-amyloid-beta antibodies eliminate cognitive deficits and reduce parenchymal amyloid with minimal vascular consequences in aged amyloid precursor protein transgenic mice. J Neurosci 26: , 5340–5346. |
[31] | Carty NC , Wilcock DM , Rosenthal A , Grimm J , Pons J , Ronan V , Gottschall PE , Gordon MN , Morgan D ((2006) ) Intracranial administration of deglycosylatedC-terminalspecific anti-Abeta antibody efficiently clears amyloid plaques without activating microglia in amyloid-depositing transgenic mice. J Neuroinflammation 3: , 11. |
[32] | Rochin L , Hurbain I , Serneels L , Fort C , Watt B , Leblanc P , Marks MS , De Strooper B , Raposo G , van Niel G ((2013) ) BACE2 processes PMEL to form the melanosome amyloid matrix in pigment cells. Proc Natl Acad Sci U S A 110: , 10658–10663. |
[33] | Shimshek DR , Jacobson LH , Kolly C , Zamurovic N , Balavenkatraman KK , Morawiec L , Kreutzer R , Schelle J , Jucker M , Bertschi B , Theil D , Heier A , Bigot K , Beltz K , Machauer R , Brzak I , Perrot L , Neumann U ((2016) ) Pharmacological BACE1 and BACE2 inhibition induces hair depigmentation by inhibiting PMEL17 processing in mice. Sci Rep 6: , 21917. |
[34] | van Maanen EM , van Steeg TJ , Michener MS , Savage MJ , Kennedy ME , Kleijn HJ , Stone JA , Danhof M ((2016) ) Systems pharmacology analysis of the amyloid cascade after β-secretase inhibition enables the identification of an Aβ42 oligomer pool. J Pharmacol Exp Ther 357: , 205–216. |
[35] | Li H , Guo Q , Inoue T , Polito VA , Tabuchi K , Hammer RE , Pautler RG , Taffet GE , Zheng H ((2014) ) Vascular and parenchymal amyloid pathology in an Alzheimer disease knock-in mouse model: Interplay with cerebral blood flow. Mol Neurodegener 9: , 1326–1329. |
[36] | Sevigny J , Chiao P , Bussière T , Weinreb PH , Williams L , Maier M , Dunstan R , Salloway S , Chen T , Ling Y , O’Gorman J , Qian F , Arastu M , Li M , Chollate S , Brennan MS , Quintero-Monzon O , Scannevin RH , Arnold HM , Engber T , Rhodes K , Ferrero J , Hang Y , Mikulskis A , Grimm J , Hock C , Nitsch RM , Sandrock A ((2016) ) The antibody aducanumab reduces Aβ plaques in Alzheimer’s disease. Nature 537: , 50–56. |


