
Comparing Approaches to Optimize Cut-off Scores for Short Cognitive Screening Instruments in Mild Cognitive Impairment and Dementia
Abstract
Background: Although required to improve the usability of cognitive screening instruments (CSIs), the use of cut-off scores is controversial yet poorly researched.
Objective: To explore cut-off scores for two short CSIs: the Standardized Mini-Mental State Examination (SMMSE) and Quick Mild Cognitive Impairment (Qmci) screen, describing adjustments in scores for diagnosis (MCI or dementia), age (≤, >75 years), and education (<, ≥12 years), comparing two methods: the maximal accuracy approach, derived from receiver operating characteristic curves, and Youden’s Index.
Methods: Pooled analysis of assessments from patients attending memory clinics in Canada between 1999–2010 : 766 with mild cognitive impairment (MCI) and 1,746 with dementia, and 875 normal controls.
Results: The Qmci was more accurate than the SMMSE in differentiating controls from MCI or cognitive impairment (MCI and dementia). Employing the maximal accuracy approach, the optimal SMMSE cut-off for cognitive impairment was <28/30 (AUC 0.86, sensitivity 74%, specificity 88%) versus <63/100 for the Qmci (AUC 0.93, sensitivity 85%, specificity 85%). Using Youden’s Index, the optimal SMMSE cut-off remained <28/30 but fell slightly to <62/100 for the Qmci (sensitivity 83%, specificity 87%). The optimal cut-off for MCI was <29/30 for the SMMSE and <67/100 for the Qmci, irrespective of technique. The maximal accuracy approach generally produced higher Qmci cut-offs than Youden’s Index, both requiring adjustment for age and education. There were no clinically meaningful differences in SMMSE cut-off scores by age and education or method employed.
Conclusion: Caution should be exercised selecting cut-offs as these differ by age, education, and method of derivation, with the extent of adjustment varying between CSIs.
INTRODUCTION
While screening for cognitive impairment is advocated by some [1–3], there remains limited evidence supporting routine cognitive screening in clinical practice [4, 5]. This is in part because most cognitive screening instruments (CSI) lack sufficient sensitivity and specificity to differentiate normal cognition from mild cognitive impairment (MCI) and dementia [2, 4, 6], but also because of the effects of age and education on scoring variability [7, 8]. Misclassifying may be harmful, as treatments indicated at one stage may not beneficial at another [9–11].
The utility of screening instruments is defined by two conditional probabilities, sensitivity and specificity, that rule in (sensitivity) or rule out (specificity) disease [12]. In general, sensitivity and specificity are inversely related and vary with the threshold [13]. Ideally, screening tests should strike a balance between both, so they can confirm or exclude a disease, although sensitivity is particularly important for short screens to reduce the rate of false negatives. Cut-off scores, transition points along the spectrum of cognitive impairment, may be useful in busy clinical practice although their utility is limited by context and uncertainty regarding the optimal method of establishing test cut points [14]. Two of the most widely used methods are the maximal accuracy [15] and Youden’s Index [16] approaches. The latter often provides higher cut-offs and greater sensitivity, and has been suggested as the optimal method for developing cut-offs for short CSIs [15]. Although age and educational cut-offs, based upon population-based norms, are available for some CSIs including the Mini-Mental State Examination (MMSE) [7] and the Montreal Cognitive Assessment (MoCA) [17, 18], few studies have published usable cut-off scores for patients presenting with symptomatic memoryloss [19].
The objectives of this study are to (1) examine and compare the effects of using different methods of defining cut-off scores on two short CSIs, the widely used MMSE (Standardized MMSE), and a short screen for MCI and early dementia called the Quick Mild Cognitive Impairment (Qmci) screen [20]; (2) to investigate the extent that these cut-off scores require adjustment for age and education; and (3) develop cut-off scores for the Qmci screen.
MATERIALS AND METHODS
Participants and data collation
Data from three sources: the Geriatric Assessment Tool (GAT) [21] and original Qmci validation databases [20], and the DARAD (Doxycycline And Rifampicin for Alzheimer’s Disease) [22] clinical trial database were analyzed. Participant characteristics and recruitment from all three studies have been published previously [20–22] and are presented in Fig. 1 and Table 1 below. In summary, the GAT database was collected in outpatient geriatric clinics in two university hospitals in Ontario, Canada between 1999 and 2010. The GAT is a geriatric outpatient database including patients aged 41–104 years [21]. The Qmci validation database includes patients referred for assessment of cognition, aged ≥55 years, recruited from four outpatient memory clinics in Ontario, Canada [20]. The DARAD was a multi-center, blinded randomized controlled trial conducted between 2006 and 2010, comparing the effect of rifampicin and doxycycline to placebo on the progression of Alzheimer’s disease (AD) [22]. The DARAD database includes patients aged ≥50 years with mild to moderate AD recruited from 14 Canadian geriatric outpatient clinics.
All data were collected under the supervision of the same principle investigator (WM) in a manner consistent with the Helsinki Declaration of 1975 and were approved by the local research ethics committee at the time. No additional approval was required for this secondary analysis. Each participant underwent similar comprehensive work-up including laboratory investigations, neuropsychological assessment, and neuroimaging where appropriate [20–22]. Dementia was diagnosed using the Diagnostic and Statistical Manual of Mental Disorders (4th-edition) [23]. MCI was diagnosed using Petersen’s Criteria [24] in patients presenting with subjective and objective memory loss without loss of function. Those with active depression, screened using the Geriatric Depression Scale [25], were excluded. All participants were English literate. Persons attending clinic with patients, mainly caregivers (Qmci database, n = 630), and patients without memory loss attending geriatric clinics (GAT database, n = 245), recruited by convenience sampling, were available as normal controls. No controls were available from the DARAD database.
Participants were included in this analysis if paired SMMSE and Qmci scores were available. To ensure a consistent cross sectional approach and to reduce heterogeneity between the different samples, only patients with AD, vascular dementia (VaD), or mixed AD-VaD were included. This is consistent with the original validation of the Qmci screen [20] and recruitment for the DARAD trial [22]. Patients with missing demographic data (age or education) were also excluded. In total, 4,565 subjects were available. Of these, 3,387 were included. The majority (n = 1,081) were excluded from the GAT database: 46 with Lewy body dementia, 15 with Parkinson’s disease dementia, 33 with frontotemporal dementia, 70 with other dementia subtypes (post-traumatic, anesthetic, alcohol, or other mixed non AD-VaD), and 571 with depression (195 with isolated depression, 94 with concomitant MCI, and the remainder with active co-morbid depression and established dementia). For 346 subjects, the diagnosis was unclear. A further 97 were excluded from the Qmci and DARAD data sets due to missing data. Selection for this analysis is presented as a flow chart in Fig. 1.
Measures
The SMMSE and Qmci were available in all three databases. The SMMSE is a standardizedversion of the MMSE, scored out of 30 points, which improved inter-rater reliability by the inclusion of explicit administration and scoring guidelines [26, 27]. The Qmci screen is a short (median time 4.24 minutes) [28], valid, and reliable CSI with six subtests, covering five cognitive domains: orientation, working memory, sematic memory (verbal fluency for animals), visuospatial/executive function (clock drawing) and two tests of episodic memory (delayed recall and logical memory, the immediate verbal recall of a short story) [28]. Originallyvalidated in English, it has now been validated in Dutch [29] and Turkish [30]. It is scored from 0 (indicating severe cognitive impairment) to 100 points (normal cognition). It has comparable accuracy to the MoCA [31, 32] and similar responsiveness to the standardized Alzheimer‘s Disease AssessmentScale-cognitive section, Clinical Dementia Rating scale, and Lawton-Brody Activities of Daily Living scale in clinical trials [33]. Alternative, validated forms of the Qmci subtests were used to minimise learning effects [34].
Analysis
Pooled data were grouped according to age (≤75 or >75 years) and education (<12 or ≥12 years), to create four subgroups. An age cut-off of 75 years provided the best balance in numbers between the four subgroups and represents the accepted age cut-off for cognitive impairment using the MMSE [35], above which it is suggested that scores must be adjusted to account for age. The cut-off for education was 12 years, the average length of formal schooling in North America [36].
Optimal cut-off scores were estimated using two methods: Youden’s Index [16] and maximal accuracy calculated from receiver operating characteristic (ROC) curves. The cut-point derived by Youden’s Index optimizes a tests ability to differentiate when equal weight is given to sensitivity and specificity. It is defined mathematically as: J = Sensitivity + Specificity –1 [16]. Diagnostic accuracy was calculated from the area under the curve (AUC) of ROC curves with scores >0.8 regarded as good and >0.9 as excellent. Sensitivity, specificity, positive predictive value (PPV), and negative predictive value (NPV) were calculated for candidate cut-off points. The maximal accuracy method is based on maximizing the overall classification accuracy (OCA) such that OCA = true positives + true negatives. Likelihood ratios for the probability of having cognitive impairment (MCI and dementia) were also determined. A Positive Likelihood Ratio (PLR) of between 2–5 suggests a small chance, 5–10 moderate, and >10 a large chance of having cognitive impairment. A Negative Likelihood Ratio (NLR) of 0.2–0.5 suggests a small chance, 0.1–0.2 moderate, and <0.1 a large chance of not having the condition. The Mann–Whitney U test compared non-parametric data and student’s t-tests compared parametric data. The Kruskal-Wallis H test was used for comparisons between three or more non-normally distributed groups. ROC curves were compared using the Hanley method [37]. Binary logistic regression was used to adjust ROC curve analysis for the effects of age and education.
RESULTS
Characteristics
In all, 3,387-paired assessments from 2,074 individuals were included. The median age of all participants at assessment was 75 years, interquartile range (IQR) ±13.5. The median years in education were 12 (±5) and 46.9% were male. The median age of those with dementia was 78 (±8) years, older than normal controls 70 (±14) (p < 0.001) and those with MCI, 76 (±10) (p < 0.001). The median number of years in education was 12 (±5) for those with dementia compared with 13 (±4) (p < 0.001) for controls and 12 (±4) (p = 0.46) for MCI. The characteristics of those included in each database and comparisons between databases are presented in Table 1. The characteristics of participants according to their age and educational level are presented in Supplementary Table 1. In summary, the median SMMSE score for controls was 29/30 (±2) points, compared to 28/30 (±3) for MCI and 23/30 (±8) for dementia. SMMSE scores were significantly different between these three diagnostic groups, χ2 (2)= 1,262 (p < 0.001). The median Qmci scores were 74/100 (±15) points for controls, 57/100 (±20) for MCI, and 37/100 (±26) for dementia. Qmci scores were also significantly different in the three groups, χ2 (2)= 1,379 (p < 0.001). Median age, gender, education, SMMSE, and Qmci screen scores, though similar, were significantly different between the three databases; participants in the dementia trial database (DARAD) were, as would be expected by the results above, older, had spent less time in formal education and had lower median SMMSE and Qmci scores.
Effects of age and education on median cognitive screen scores
Median SMMSE scores were significantly higher for normal controls than for patients with MCI, irrespective of age or education, though clinically the results appeared similar, particularly for older participants (>75) with less time in education (<12) both with a median SMMSE score of 28/30, reflecting the known ceiling effects of the instrument.Differences between median Qmci scores for controls and those with MCI were all statistically significantly different, irrespective of age and education but the differences were more clinically meaningful (minimum difference >10 points), for example the median Qmci screen score for younger patients (≤75) with more education (≥12) was 78/100 and 59/100 for normal controls and MCI respectively, a median 19-point difference. Median SMMSE and Qmci screen scores for patients with established dementia were the lowest for younger patients with less education. These results are presented in Supplementary Table 1.
Cut-off scores using the maximal accuracy method
Both instruments had good to excellent accuracy in differentiating patients with cognitive impairment (MCI or dementia) from controls. Scores for both instruments were highest for younger (≤75), more educated (>12) participants. The Qmci was, however, significantly more accurate than the SMMSE in identifying cognitive impairment, with an AUC score of >0.90, irrespective of participant age or education (p < 0.001). Its superior accuracy was particularly evident in younger (≤75) and more educated (>12) patients (AUC of 0.84 for the SMMSE versus 0.92 for the Qmci, p < 0.001). As expected the Qmci was also statistically significantly more accurate than the SMMSE in detecting MCI, irrespective of age or education, while there was no difference for differentiating dementia from MCI. The optimal SMMSE cut-off for cognitive impairment, using the maximal accuracy approach was <28/30 (AUC 0.86), which produced a sensitivity of 74% and specificity of 88%. The optimal Qmci cut-off was <63/100 (AUC 0.93), which produced a sensitivity of 85% and specificity of 85%. Comparisons between AUC scores and the cut-off scores generated using the maximal accuracy method, for both instruments and according to their age and education, are presented in Table 2. The sensitivity and specificity obtained at different cut-off points including that found using the maximal accuracy approach are presented in Supplementary Table 2.
Cut-off scores using Youden’s Index
Using Youden’s Index, the optimal cut-off score for the SMMSE for cognitive impairment (MCI or dementia) was <28/30. This provided a sensitivity of 74% and a specificity 88%. The optimal cut-off for the Qmci was <62/100, producing a sensitivity of 83% and specificity of 87% for cognitive impairment. Examining age and education specific cut-offs again showed that scores for both instruments were highest for younger (≤75), more educated (>12) subjects. The Qmci was more sensitive (83%) and specific (73%) for MCI than the SMMSE (59% and 72%, respectively). Cut-offs for the Qmci screen calculated using Youden’s Index are presented in Fig. 2. Detailed tables comparing the sensitivity and specificity of both CSIs, for a range of cut-off scores, calculated from Youden’s Index are provided in Supplementary Table 3.
Overall, SMMSE cut-offs were similar whether using Youden’s Index or the maximal accuracy approach, while Qmci cut-offs varied depending upon the method used and by the age and education defined subgroups. These comparisons are presented in Table 3.
Likelihood ratios
Likelihood ratios were calculated for several cut-off scores, for both instruments, for the total population and by age and education. The optimal SMMSE cut-off for cognitive impairment (<28/30), calculated using Youden’s Index, provided a moderate chance of cognitive impairment (PLR 5.97) and a small chance of normal cognition (NLR 0.29). The cut-off using the maximal accuracy method was the same. Likelihood ratios also confirmed the choice of cut-off scores for each subgroup according to age and education. For example, using Youden’s Index or the maximal accuracy approach, the cut-off for older participants (>75) with less education (<12) (i.e.,<27/30) had a moderate chance of cognitive impairment (PLR 5.25) and a small chance of being classified as normal (NLR 0.29).
At the optimal Qmci cut-off for cognitive impairment, calculated using Youden’s Index (<62/100), participants also had a moderate chance of having cognitive impairment (PLR 6.22) and a small chance of having normal cognition (NLR 0.20). At <63/100 points, the cut-off calculated by the maximal accuracy approach, there was also a moderate chance of having CI (PLR 5.65) but a moderate chance of being normal (NLR 0.18). Complete results for likelihood ratios according to diagnostic classification (normal cognition, MCI or dementia) and age (≤75 or >75 years) and education (<12 or≥12 years) are presented in the Supplementary Table 4.
DISCUSSION
This paper presents cut-off scores for two short CSIs, the SMMSE and Qmci screen, adjusted for age and education, based upon a large population of participants including patients with symptomatic memory loss, in three pooled databases, using two derivation methods. While data on cut-off scores have been partially presented for the MoCA [19], to our knowledge, this is the first study to investigate in depth the differential effects of age and education on cut-off scores, comparing two short CSIs in participants with symptomatic cognitive impairment, one designed specifically to screen for MCI (Qmci). It is also one of only a few studies to investigate the effects of different methods of calculating cut-offs [15], despite the regularity that they are used in clinical practice.
The results show small, albeit significant, differences in median SMMSE, and large and significant differences in median Qmci scores, which clearly separate normal controls, MCI, and dementia. This study found that cut-off scores are influenced by several factors including their derivation method as well as age, education and diagnostic classification, and that these effects also vary between instruments. Comparing cut-off scores calculated with Youden’s Index and the maximal accuracy method showed that theoverall scores for the SMMSE and Qmci were similar irrespective of diagnostic classification. For example, the optimal cut-offs for cognitive impairment (i.e., either MCI or dementia) were <28/30 for the SMMSE and <62/100 for the Qmci using Youden’s Index compared with <28/30 and <63/100, respectively, using the maximal accuracy approach, more or less unchanged. Likelihood ratios, however, suggested that the cut-off scores created using Youden’s Index were better able, albeit marginally, to classify patients with confidence.
The study also showed that age and education affect the cut-off scores for all diagnostic categories with differences evident between scores depending on the cut-off method used. This was more obvious for the Qmci. For example, the optimal SMMSE cut-off score for detecting cognitive impairment was <28/30 for young participants (≤75) with more education (≥12) using Youden’s Index and <29/30 using maximal accuracy, versus <60/100 and <67/100 respectively for the Qmci screen. This suggests that it requires greater correction for age and education than the SMMSE, which appeared to be less influenced by age and education than the Qmci screen.
The effects of age and education on patients presenting with symptomatic memory complaints are complex. The median scores of the total sample were lowest for older patients with less education and highest for younger patients with the most education. Median scores for patients with established dementia were, however, lowest for younger patients with less education, possibly reflecting more severe pathology in young patients, without the protective effects of education. The influence of education on cognition remains unclear [38] with some but not all studies suggesting that lower levels of education are associated with an elevated risk for dementia [38]. Recent longitudinal data suggests education may delay onset but does not affect the rate of decline in those with established dementia [39]. Likewise, education does not clearly affect decline in cognitive scores for persons without dementia [40].
Comparing the diagnostic accuracy of both CSIs showed again that the Qmci was significantly more accurate in differentiating MCI from normal cognition [20, 31, 32], while both instruments had similar accuracy for distinguishing dementia. This reflects that the MMSE and its standardized version are poorly sensitive to early cognitive changes, particularly in patients with MCI [42]. Likewise, irrespective of age, education, or method of derivation, all but one of the SMMSE cut-offs (differentiating MCI from dementia in young patients with lower levels of education) were above the often-used cut-off of <24/30 [27]. The cut-off for older patients with high levels of education found in this study (<26/30) is, however, similar to that found in corresponding samples in North America [43]. For patients with MCI, the cut-off ranged between <29/30 and <30/30 suggesting that any failure to fully complete the test should prompt more detailed assessment.
Thus, the SMMSE, while less accurate, requires less adjustment for age, education, and derivation method than the more accurate Qmci screen, which is an advantage. However, it could be argued that the narrow range of SMMSE cut-off scores, clustered together, limits their utility in clinical practice, confirming the ceiling effects characteristic of this instrument [7, 20, 41]. The argument is therefore that clinicians should have a suite of short CSIs available (i.e., be trained to score) and make their selection of which to use based on the diagnostic pre-test probability, with MCI specific screens used where MCI is suspected. Given that MoCA cut-offs for symptomatic cognitive impairment also require adjustment for age and education [19], suggests that there may be a trade-off between diagnostic accuracy and a requirement to adjust cognitive screen scores for all these factors. Being aware of this is particularly important in order to avoid misclassification in busy clinical practice.
Strengths and weaknesses
Strengths of this study include the inclusion of a large sample of patients presenting with memory loss in a clinic setting, allowing analysis of subgroups according to age and education. Another strength is that cut-offs were confirmed as being clinically meaningful using likelihood ratios. The study includes patients with different dementia subtypes all of whom underwent a comprehensive assessment using standardized diagnostic criteria across multiple sites. This paper has a number of limitations. This study included pooled data from three sources, a clinical trial and two outpatient databases, potentially resulting in spectrum bias. Baseline characteristics were significantly different between the three data sets, although the same principle investigator, using similar approaches, supervised participant assessment. The findings are drawn from a single country, potentially reducing the generalizability of results. However, Canada is ethnically diverse with similar demographics to many other industrialized nations and data were drawn from multiple clinics spread over a large geographic area. The age and educational level cut-offs chosen could also limit the external validity of these results. Although 12 years is the average number of years of education for older adults in North America, this figure is lower in other countries. Another potential limitation is that the efficiency of the maximal accuracy method, used to develop cut-offs, varies with disease prevalence.
In summary, this study provides usable cut-off scores for the SMMSE and Qmci and illustrates the effects of age and education on cut-off scores for patients presenting with symptomatic memory loss. The results suggest that the type of test selected also determines the extent to which adjustments in age and education are required. The SMMSE is less accurate than the Qmci but may also be less affected by age and education. The results also suggest that cut-offs are influenced by the method of derivation, which varies by age, education, and between instruments. Based upon this analysis, the authors recommend the use of cut-offs derived by Youden’s Index (presented in Fig. 1): an overall SMMSE cut-off score of <28/30 for cognitive impairment (MCI and dementia) and a Qmci cut-off of <62/100. However, although cut-offs are useful in clinical practice, age and education impact upon these and while providing a valuable guide, they should not replace clinical judgment [44]. Further study is required to confirm these findings in different cultural groups and with different cognitive tests.
ACKNOWLEDGMENTS
The authors acknowledge funding for this research from The Atlantic Philanthropies and the Canadian Institute of Health Research (CIHR). Registration of the DARAD trial is available at www.controlled-trials.com –ISRCTN15039674.
Authors’ disclosures available online (http://j-alz.com/manuscript-disclosures/16-1204r1).
Appendices
The supplementary material is available in the electronic version of this article: http://dx.doi.org/10.3233/JAD-161204.
REFERENCES
[1] | Boustani M , Peterson B , Hanson L , Harris R , Lohr K ((2003) ) Screening for dementia in primary care: A summary of the evidence for the U.S. Preventive Services Task Force. Ann Intern Med 138: , 927–937. |
[2] | Cordell CB , Borson S , Boustani M , Chodosh , Reuben D , Verghese J , Thies W , Fried LB , the Medicare Detection of Cognitive Impairment Workgroup ((2012) ) Alzheimer’s Association recommendations for operationalizing the detection of cognitive impairment during the Medicare Annual Wellness Visit in a primary care setting. Alzheimers Dement 9: , 141–150. |
[3] | Clionsky M , Clionsky E ((2014) ) Dementia screening: Saying no to the uspstf and yes to brief cognitive evaluation. J Alzheimers Dis Parkinsonism 4: , e132. |
[4] | Boustani M , Callahan CM , Unverzagt FW , Austrom MG , Perkins AJ , Fultz BA , Hui SL , Hendrie HC ((2005) ) Implementing a screening and diagnosis program for dementia in primary care. J Gen Int Med 20: , 572–577. |
[5] | Lin JS , O’Connor E , Rossom RC , Leslie A , Perdue LA , Eckstrom E ((2013) ) Screening for Cognitive impairment in older adults: A systematic review for the U.S. Preventive Services Task Force. Ann Intern Med 159: , 601–612. |
[6] | Winblad B , Palmer K , Kivipelto M , Jelic V , Fratiglioni L , Wahlund L-O , Nordberg A , Backman L , Albert M , Almkvist O , Arai H , Basun H , Blennow K , De Leon M , Decarli C , Erkinjuntti T , Giacobini E , Graff C , Hardy J , Jack C , Jorm A , Ritchie K , Van Duijn C , Visser P , Petersen RC ((2004) ) Mild cognitive impairment –beyond controversies, towards a consensus: Report of the International Working Group on Mild Cognitive Impairment. J Intern Med 256: , 240–246. |
[7] | Crum RM , Anthony JC , Bassett SS , Folstein MF ((1993) ) Population- based norms for the Mini-Mental State Examination by age and educational level. JAMA 269: , 2386–2391. |
[8] | Freitas S , Simões MR , Alves L , Santana I ((2012) ) Montreal Cognitive Assessment: Influence of sociodemographic and health variables. Arch Clin Neuropsych 27: , 165–175. |
[9] | Petersen RC , Morris JC ((2005) ) Mild cognitive impairment as a clinical entity and treatment target. Arch Neurol 62: , 1160–1163. |
[10] | Tricco AC , Soobiah C , Berliner S , Ho JM , Ng CH , Ashoor HM , Chen MH , Hemmelgarn B , Straus SE ((2013) ) Efficacy and safety of cognitive enhancers for patients with mild cognitive impairment: A systematic review and meta-analysis. CMAJ 185: , 1393–1401. |
[11] | Cooper C , Li R , Lyketsos C , Livingston G ((2013) ) Treatment for mild cognitive impairment: Systematic review. Brit J Psych 203: , 255–264. |
[12] | Griner MF , Mayewski RJ , Mushlin AI , Greenland J ((1981) ) Selection and interpretation of diagnostic tests and procedures. Ann Intern Med 94: , 553–600. |
[13] | Smits N ((2010) ) A note on Youden’s J and its cost ratio. BMC Med Res Methodol 10: , 89. |
[14] | Larner AJ ((2015) ) Introduction. In Diagnostic Test Accuracy Studies in Dementia, Larner AJ , ed. Springer International Publishing Switzerland, pp. 1–17. |
[15] | Larner AJ ((2015) ) Optimising the cutoffs of cognitive screening instruments in pragmatic diagnostic accuracy studies: Maximising accuracy or the Youden index? Dement Geriatr Cogn Disord 39: , 167–175. |
[16] | Youden WJ ((1950) ) Index for rating diagnostic tests. Cancer 3: , 32–35. |
[17] | Rossetti HC , Lacritz LH , Cullum CM , Weiner MF ((2011) ) Normative data for the Montreal Cognitive Assessment (MoCA) in a population-based sample. Neurology 77: , 1272–1275. |
[18] | Kenny RA , Coen RF , Frewen J , Donoghue OA , Cronin H , Savva GM ((2013) ) Normative values of cognitive and physical function in older adults: Findings from The Irish Longitudinal Study on Ageing. J Am Geriatr Soc 61: , S279–S290. |
[19] | Tan J , Li N , Gao J , Wang L , Zhao Y , Yu B , Du W , Zhang W , Cui L , Wang Q , Li J , Yang J , Yuk J , Xia X , Zhou P ((2015) ) Optimal cutoff scores for dementia and mild cognitive impairment of the Montreal Cognitive Assessment among elderly and oldest-old Chinese population. J Alzheimers Dis 43: , 1403–1412. |
[20] | O’Caoimh R , Gao Y , McGlade C , Healy L , Gallagher P , Timmons S , Molloy DW ((2012) ) Comparison of the Quick Mild Cognitive Impairment (Qmci) screen and the SMMSE in screening for mild cognitive impairment. Age Ageing 41: , 624–629. |
[21] | Gao Y , O’Caoimh R , Healy L , Kerins D , Guyatt G , Eustace J , Sammon D , Molloy DW ((2013) ) Effects of centrally acting angiotensin converting enzyme inhibitors on the rate of cognitive decline in dementia. BMJ Open 3: , e002881. |
[22] | Molloy DW , Standish TI , Zhou Q , Guyatt G , The DARAD Study Group ((2013) ) A multicenter, blinded, randomized, factorial controlled trial of doxycycline and rifampin for treatment of Alzheimer’s disease: The DARAD trial. Int J Geriatr Psychiatry 28: , 463–470. |
[23] | American Psychiatric Association ((1994) ) Diagnostic and Statistical Manual of Mental Disorders, 4th edition, American Psychiatric Association, Washington, DC. |
[24] | Petersen RC , Smith GE , Waring SC , Ivnik RJ , Tangalos EG , Kokmen E ((1999) ) Mild cognitive impairment: Clinical characterization an outcome. Arch Neurol 56: , 303–308. |
[25] | Yesavage J , Brink T , Rose T , Lum O , Huang V , Adey M , Leirer VO ((1983) ) Development and validation of a geriatric depression screening scale. J Psychiatr Res 17: , 37–49. |
[26] | Molloy DW , Alemayehu E , Roberts R ((1991) ) Reliability of a standardized Mini-Mental State Examination compared with the traditional Mini-Mental State Examination. Am J Psychiatry 148: , 102–105. |
[27] | Molloy DW , Standish TIM ((1997) ) A guide to the Standardized Mini-Mental State Examination. Int Psychogeriatrics 9: , 87–94. |
[28] | O’Caoimh R , Gao Y , Gallagher P , Eustace J , McGlade C , Molloy DW ((2013) ) Which part of the Quick mild cognitive impairment screen (Qmci) discriminates between normal cognition, mild cognitive impairment and dementia? Age Ageing 42: , 324–330. |
[29] | Bunt S , O’Caoimh R , Krijnen WP , Molloy DW , Goodijk GP , van der Schans CP , Hobbelen JSM ((2015) ) Validation of the dutch version of the quick mild cognitive impairment screen (Qmci-D). BMC Geriatr 15: , 115. |
[30] | Yavuz BB , Hacer DV , O’Caoimh R , Kizilarslanoglu MC , Kilic MK , Molloy DW , Dogrul RT , Karabulut E , Sağir A , Yesil Y , Kuyumcu ME , Halil M , Cankurtaran M ((2016) ) Validation of the turkish version of the quick mild cognitive impairment screen (Qmci-TR). Eur Geriatr Med 7: , 69–70. |
[31] | O’Caoimh R , Timmons S , Molloy DW ((2016) ) Screening for mild cognitive impairment: Comparison of “MCI Specific” screening instruments. J Alzheimers Dis 51: , 619–629. |
[32] | Clarnette R , O’Caoimh R , Antony D , Svendrovski A , Molloy DW ((2016) ) Comparison of the Quick Mild Cognitive Impairment (Qmci) screen to the Montreal Cognitive Assessment (MoCA) in an Australian geriatric clinic. Int J Geriatr Psychiatry, doi: 10.1002/gps.4505 [Epub ahead of print]. |
[33] | O’Caoimh R , Svendrovski A , Johnston B , Gao Y , McGlade C , Timmons S , Eustace J , Guyatt G , Molloy DW ((2014) ) The quick mild cognitive impairment screen correlated with the standardized Alzheimer’s disease assessment scale-cognitive section in clinical trials. J Clin Epidemiol 67: , 87–92. |
[34] | Cunje A , Molloy DW , Standish TI , Lewis DL ((2007) ) Alternative forms of logical memory and verbal fluency tasks for repeated testing in early cognitive changes. Int Psychogeriatr 19: , 65–75. |
[35] | Ylikoski R , Erkinjuntti T , Sulkava R , Juva K , Tilvis R , Valvanne J ((1992) ) Correction for age, education and other demographic variables in the use of the Mini Mental State Examination in Finland. Acta Neurol Scand 85: , 391–396. |
[36] | United Nations Development Programme, Mean years of schooling (of adults) (years), Human Development Records. 2015, http://hdr.undp.org/en/content/mean-years-schooling-adults-years, Accessed on November 20, 2016. |
[37] | Hanley JA , McNeil BJ ((1983) ) A method of comparing the areas under receiver operating characteristic curves derived from the same cases. Radiology 148: , 839–843. |
[38] | Schoenhofen Sharp E , Gatz M ((2011) ) The relationship between education and dementia: An updated systematic review. Alzheimer Dis Assoc Disord 25: , 289–304. |
[39] | Strand BH , Langballe EM , Rosness TA , Bergem AL , Engedal K , Nafstad P , Tell GS , Ormstad H , Tambs K , Bjertness E , GENIDEM-group ((2014) ) Age, education and dementia related deaths. The Norwegian Counties Study and The Cohort of Norway. J Neurol Sci 345: , 75–82. |
[40] | Yamada M , Landes RD , Mimori Y , Nagano Y , Sasaki H ((2015) ) Trajectories of cognitive function in dementia-free subjects: Radiation Effects Research Foundation Adult Health Study. J Neurol Sci 351: , 115–119. |
[41] | Molloy DW , Standish TIM , Lewis DL ((2005) ) Screening for mild cognitive impairment: Comparing the SMMSE and the ABCS. Can J Psychiatr 50: , 52–58. |
[42] | Arevalo-Rodriguez I , Smailagic N , Roquéi Figuls M , Ciapponi A , Sanchez-Perez E , Giannakou A , Pedraza OL , Bonfill Cosp X , Cullum S ((2015) ) Mini-Mental State Examination (MMSE) for the detection of Alzheimer’s disease and other dementias in people with mild cognitive impairment (MCI). Cochrane Data Sys Rev 3: , CD010783. |
[43] | O’Bryant SE , Humphreys JD , Smith GE , Ivnik RJ , Graff-Radford NR , Petersen RC , Lucas JA ((2008) ) Detecting dementia with the Mini-Mental State Examination in highly educated individuals. Arch Neurol 65: , 963–967. |
[44] | Cullen B , O’Neill B , Evans JJ , Coen RF , Lawlor BA ((2007) ) A review of screening tests for cognitive impairment. J Neurol Neurosurg Psychiatry 78: , 790–799. |
Figures and Tables
Fig.1
Flow chart presenting the selection of participants from three data sets: The Geriatric Assessment Tool (GAT), Quick Mild Cognitive Impairment (Qmci) screen, and Doxycycline and Rifampicin for Alzheimer’s Disease (DARAD) trial databases including the number of normal controls, patients with mild cognitive impairment (MCI) and dementia.
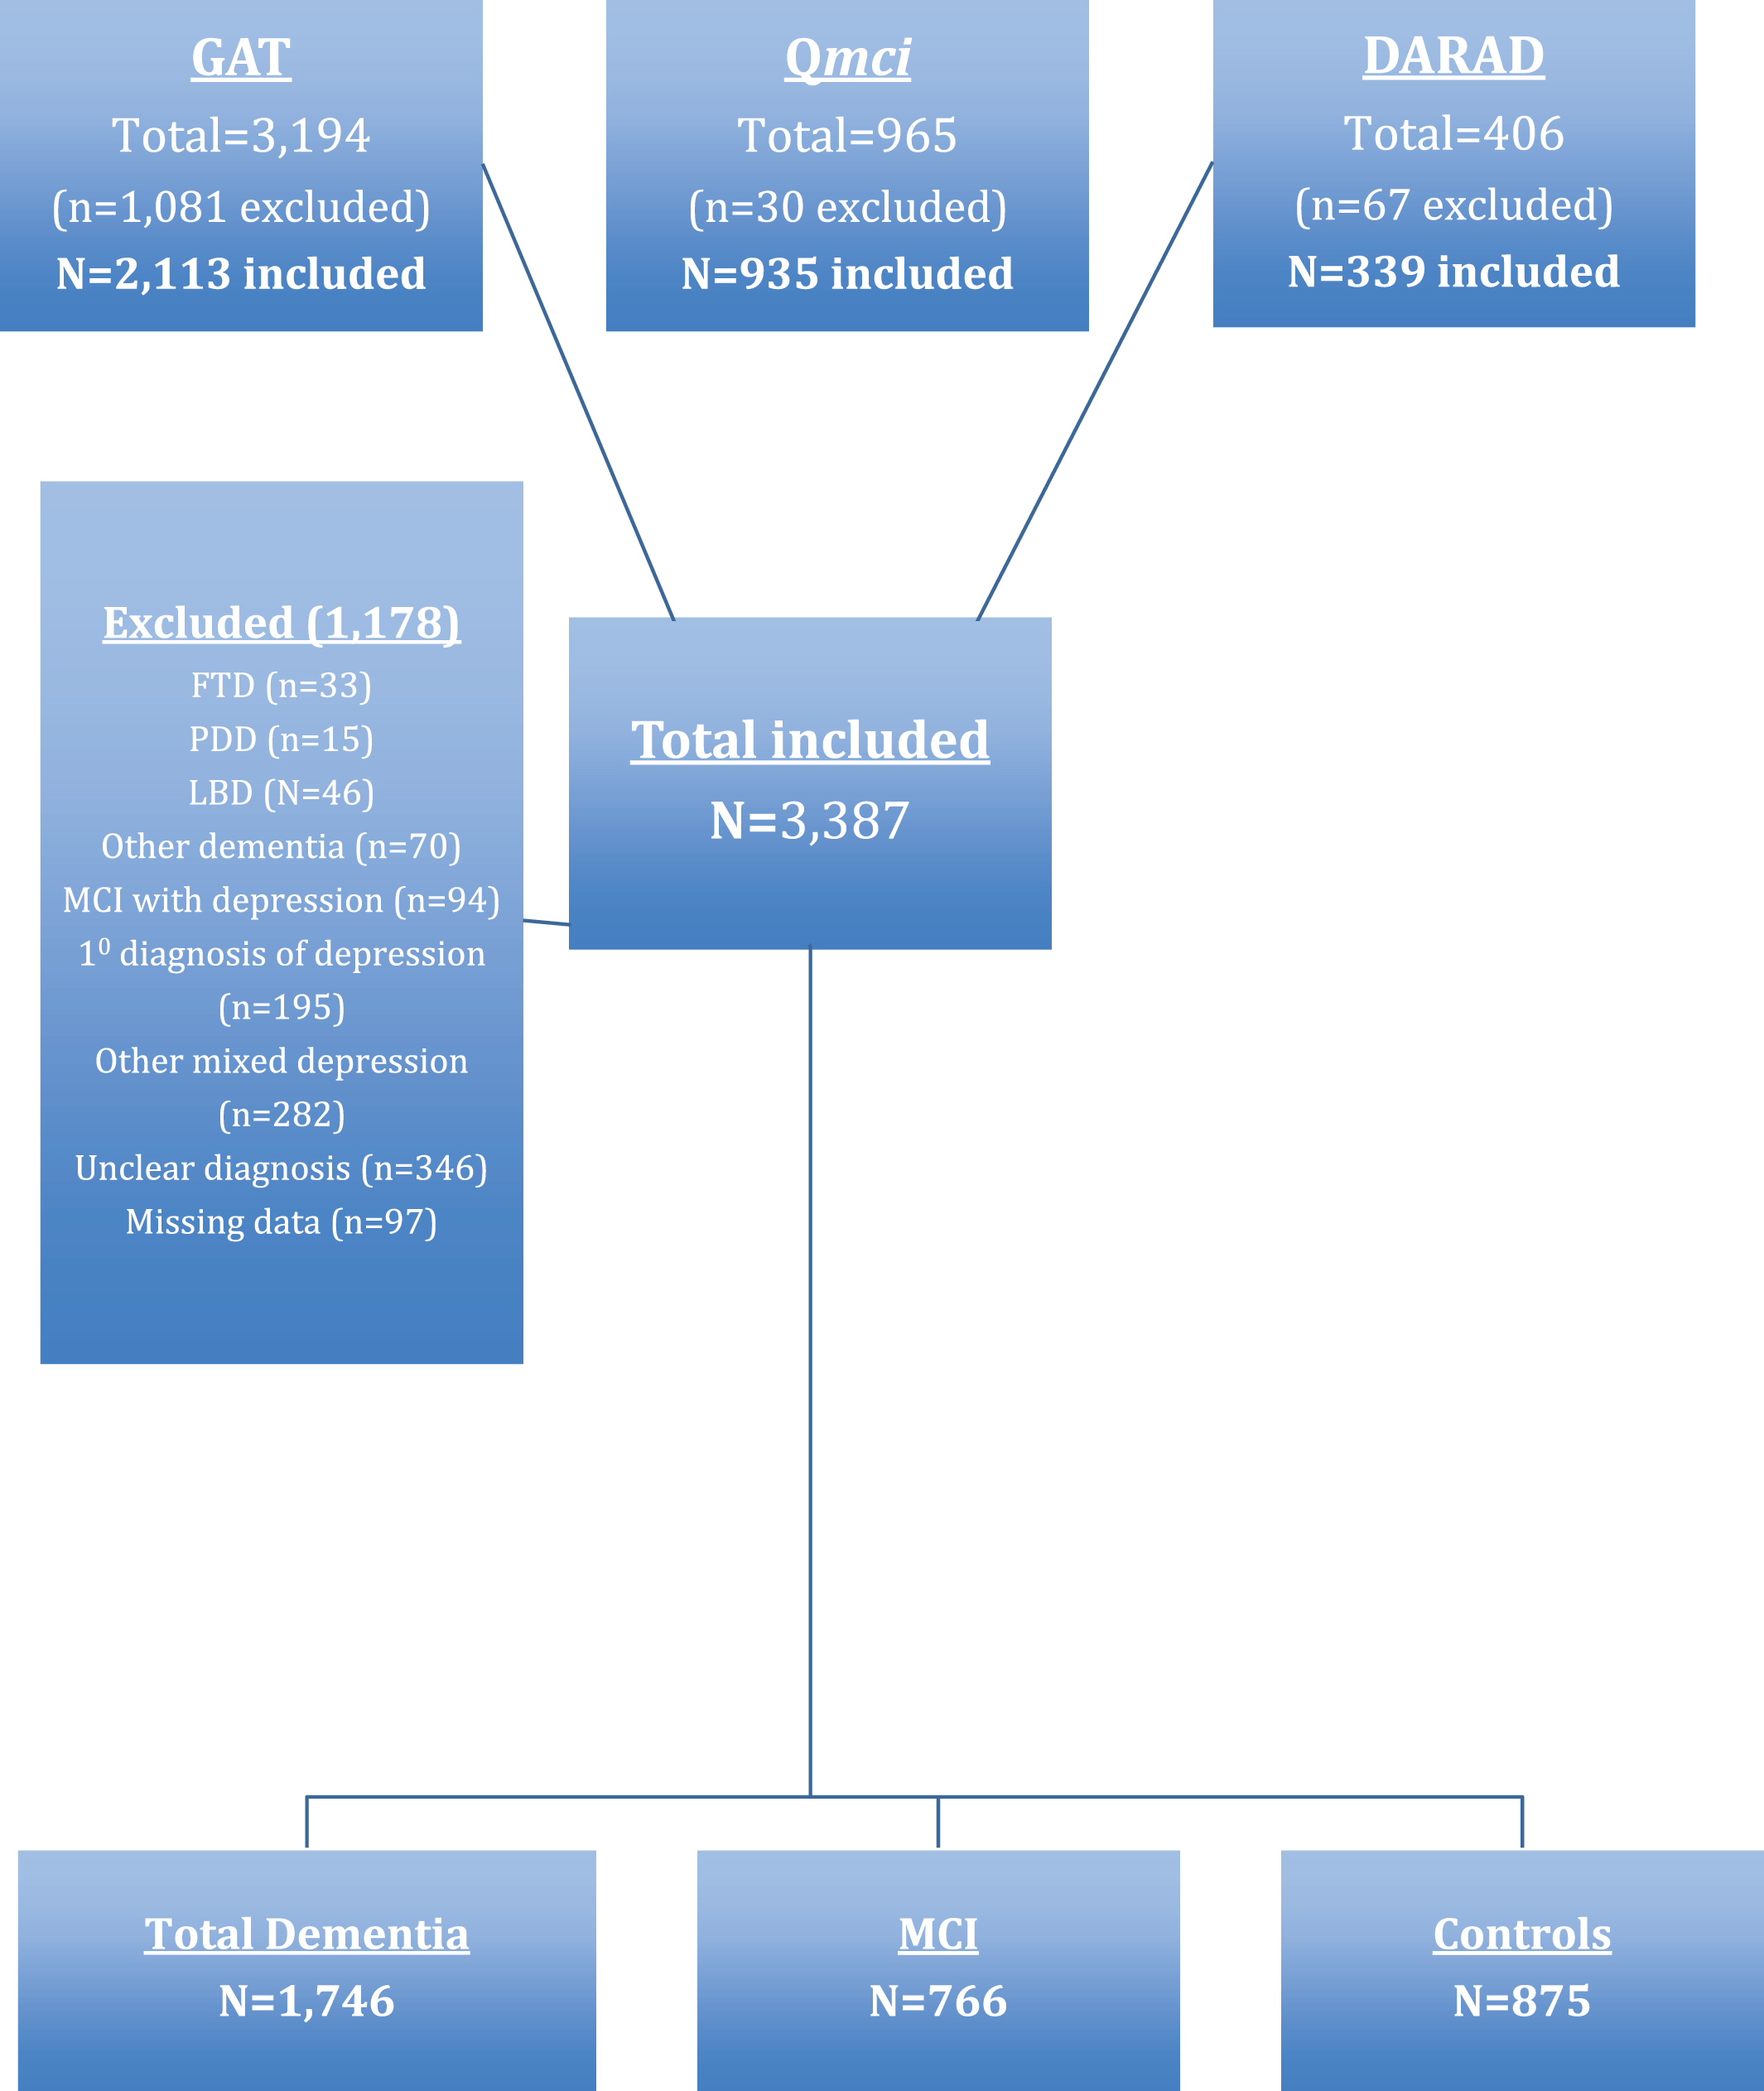
Fig.2
Age and educational cut-off scores separating normal controls (NC) from (A) cognitive impairment (mild cognitive impairment and dementia) and (B) mild cognitive impairment from NC for the Quick Mild Cognitive Impairment (Qmci) screen calculated using Youden’s Index.
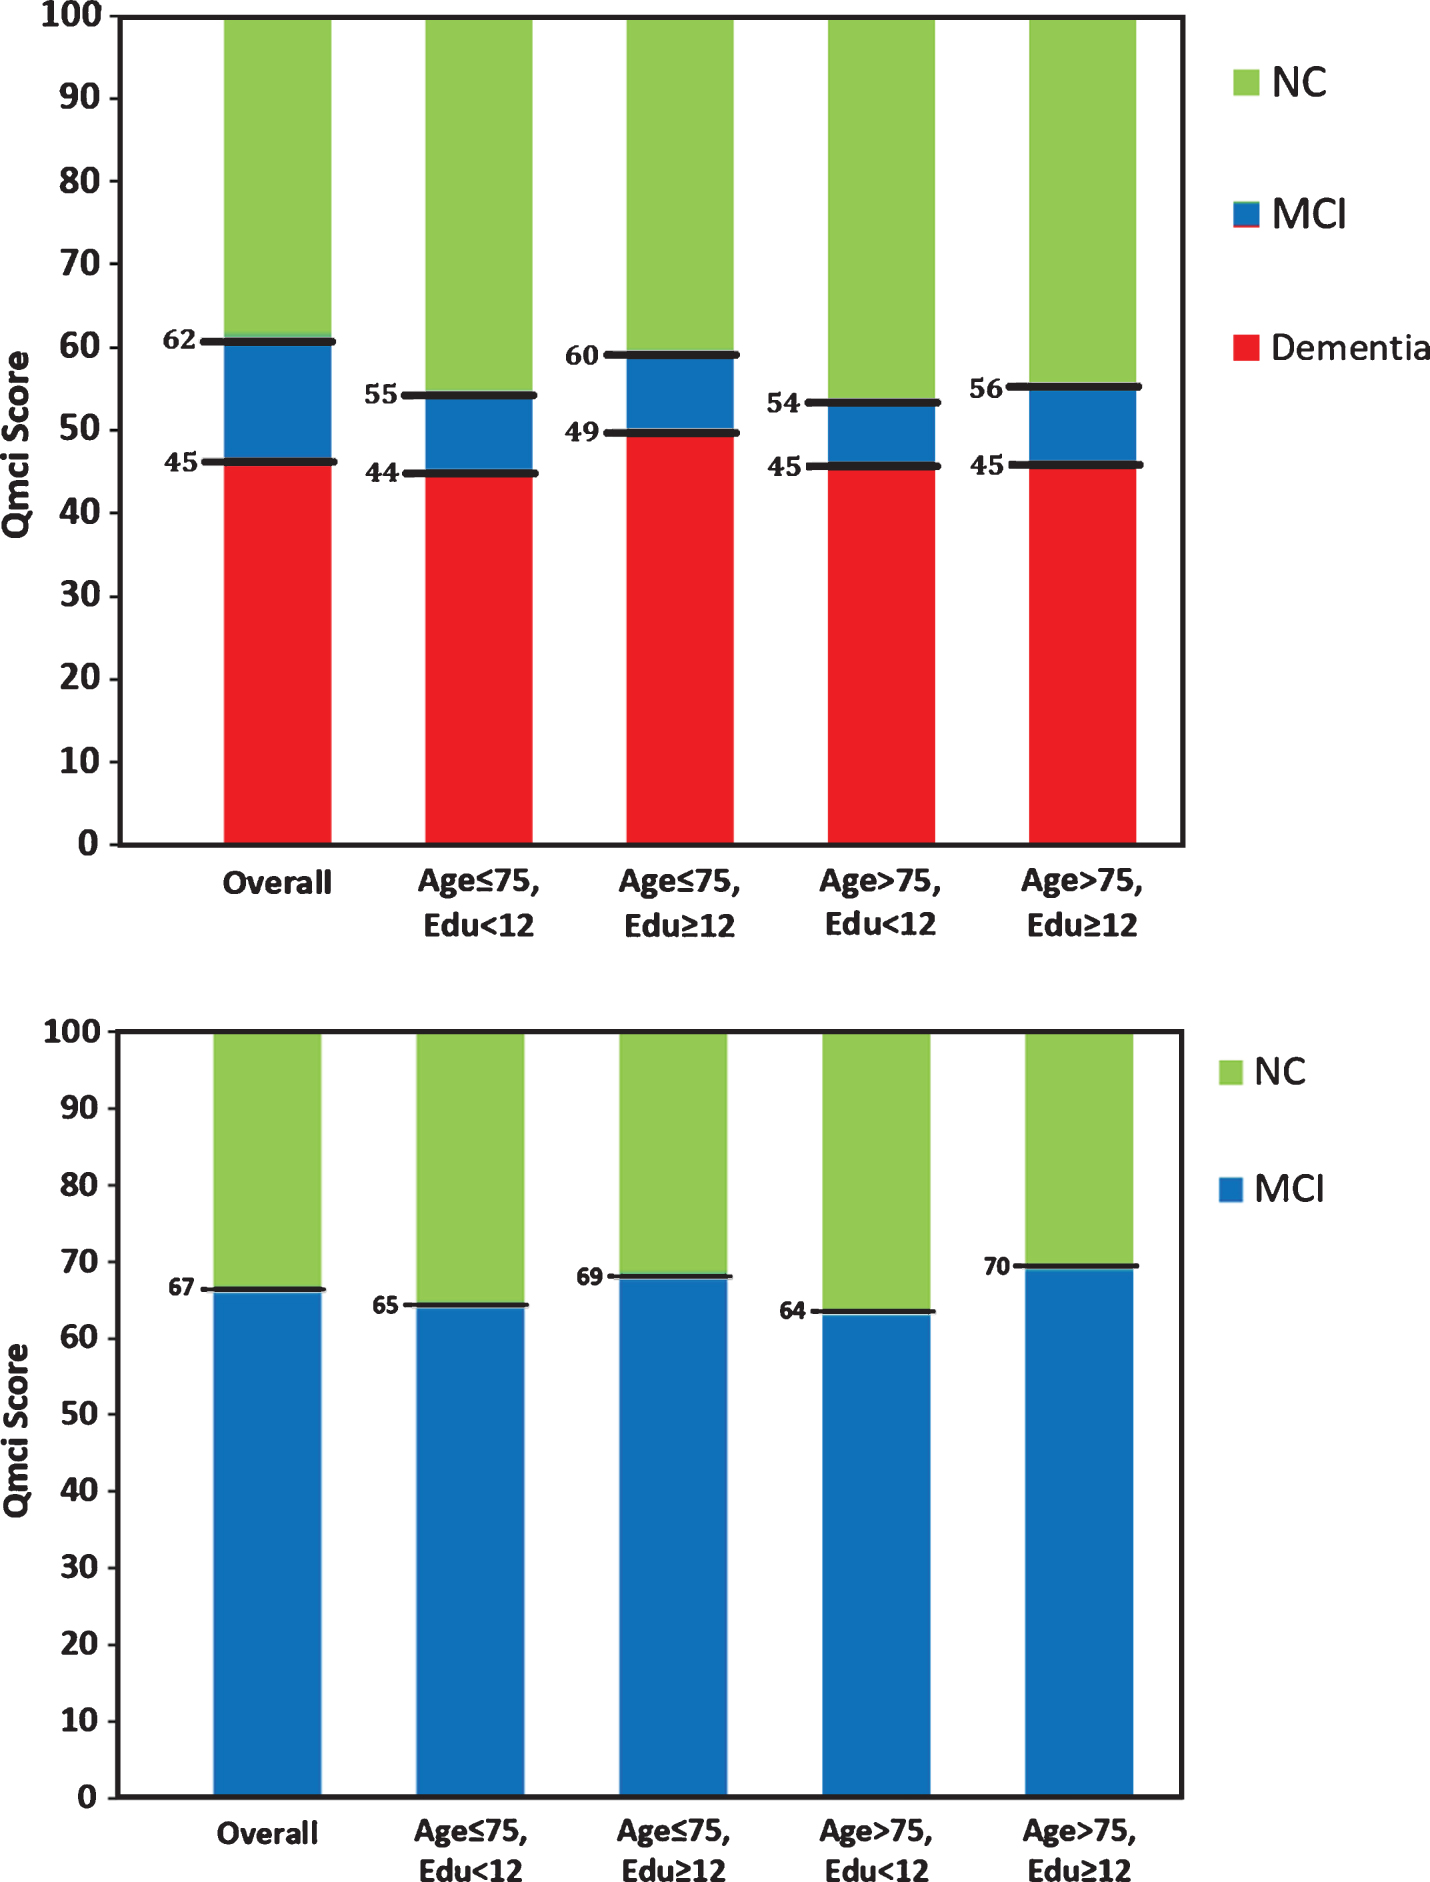
Table 1
Comparison of baseline characteristics of those included from the Quick Mild Cognitive Impairment (Qmci) screen validation, Doxycycline and Rifampacin for Alzheimer’s Disease (DARAD) study, and Geriatric Assessment Tool (GAT) databases, divided according to their Standardized Mini-Mental State Examination (SMMSE) and Qmci screen scores, including normal controls (NC), and those with mild cognitive impairment (MCI), and dementia
| Database | Diagnosis | Assessments | Age Median ± IQR | Gender | Education | SMMSE | Qmci |
| (n = X) | (Q3–Q1) | (% male) | Median ± IQR | Median ± IQR | Median ± IQR | ||
| (Q3–Q1) | (Q3–Q1) | (Q3–Q1) | |||||
| DARAD | All (Dementia) | 339 | 79±9 (73–82) | 48.7% | 12±4 (10–14) | 21±7 (17–24) | 34±22 (22–44) |
| GAT | NC | 252 | 74±15.25 (66–81.25) | 49.6% | 13±6 (10–16) | 30±1 (29–30) | 69±18 (60–78) |
| MCI | 619 | 76±11 (69–80) | 49.5% | 12±5 (9–14) | 28±2 (27–29) | 57.5±17.75 (48.25–66) | |
| Dementia | 1,242 | 79±9 (74–83) | 51.7% | 11±4 (9–13) | 23±7 (19–26) | 37±22.25 (26–48.25) | |
| All | 2,113 | 77±10 (72–82) | 50.8% | 12±5 (9–14) | 26±6 (22–28) | 47±28 (33–61) | |
| Qmci (validation) | NC | 623 | 67±14 (60–74) | 40.0% | 13±4 (12–16) | 29±2 (28–30) | 76±14 (69–83) |
| MCI | 147 | 75±14 (67–81) | 51.7% | 12±5 (10–15) | 28±2 (27–29) | 62±14 (53–67) | |
| Dementia | 165 | 79±8 (75–83) | 46.1% | 10±3 (9–12) | 22±7 (18–25) | 36±22 (23–45) | |
| All | 935 | 71±15 (63–78) | 42.9% | 13±6 (10–16) | 29±3 (27–30) | 70±22 (57–79) | |
| Total | NC | 875 | 70±14 (62–76) | 42.6% | 13±4 (12–16) | 29±2 (28–30) | 74±15 (66–81) |
| MCI | 766 | 76±10 (70–80) | 52.6% | 12±4 (10–14) | 28±3 (26–29) | 57±20 (46–66) | |
| Dementia | 1,746 | 78±8 (74–82) | 51.5% | 12±5 (9–14) | 23±8 (18–26) | 37±26 (23–49) | |
| All | 3,387 | 75±13.50(67.50–81) | 46.9% | 12±5 (10–15) | 27±7 (22–29) | 55±35 (36–71) |
| Comparison | Age | Education | Gender | SMMSE | Qmci |
| MCI versus NC | **z = 9.29, p < 0.001 | **z = 7.57, p < 0.001 | χ2(1) = 7.29, p < 0.01 | **z = 10.93, p < 0.001 | **z = 18.39, p < 0.001 |
| Dementia versus NC | **z = 20.22, p < 0.001 | **z = 12.32, p < 0.001 | χ2(1) = 11.13, p = 0.001 | **z = 33.00, p < 0.001 | **z = 34.23, p < 0.001 |
| Total | *χ2(2) = 417.6, p < 0.001 | *χ2(2) = 159.7, p < 0.001 | χ2(2) = 13.15, p = 0.001 | *χ2(2) = 1262, p < 0.001 | *χ2(2) = 1379, p < 0.001 |
| Between databases | *χ2(2) = 288.3, p < 0.001 | *χ2(2) = 80.7, p < 0.001 | *χ2(2) = 24.03, p < 0.001 | *χ2(2) = 615, p < 0.001 | *χ2(2) = 811, p < 0.001 |
SD, standard deviation; IQR, interquartile range. *Kruskal Wallis H test; **Mann Whitney U test.
Table 2
Comparison of area under the curve (AUC) values and cut-off scores calculated using the maximal accuracy approach for the total number of Standardized Mini-Mental State Examination (SMMSE) and Quick Mild Cognitive Impairment (Qmci) screen assessments available and grouped by age (≤75, >75 years) and education (<12, ≥12 years), comparing normal controls (NC) to those with cognitive impairment (CI), those with NC versus mild cognitive impairment (MCI), those with MCI versus dementia and those with dementia compared to the rest
| Subgroup (n = x) | Comparison | SMMSE AUC | SMMSE Cut-off | Qmci AUC | Qmci Cut-off | Comparison of AUC | Comparison of AUC |
| (95% CI) | based on AUC | (95% CI) | based on AUC | Qmci V | Qmci V SMMSE Adjusted | ||
| SMMSE (p = x) | for age/education (p = x) | ||||||
| Overall (n = 3,387) | CI versus NC | 0.86 (0.85–0.88) | <28 | 0.93 (0.92–0.94) | <63 | χ2(1) = 128.09 (p < 0.001) | χ2(1) = 69.94 (p < 0.001) |
| MCI versus NC | 0.72 (0.70–0.75) | <29 | 0.84 (0.82–0.86) | <67 | χ2(1) = 108.47 (p < 0.001) | χ2(1) = 61.22 (p < 0.001) | |
| MCI versus Dementia | 0.81 (0.79–0.83) | >25 | 0.79 (0.77–0.81) | >45 | χ2(1) = 4.69 (p = 0.03) | χ2(1) = 7.68 (p = 0.006) | |
| Dementia versus everything else | 0.87 (0.86–0.88) | <27 | 0.88 (0.87–0.89) | <54 | χ2(1) = 6.93 (p = 0.009) | χ2(1) = 1.23 (p = 0.27) | |
| Age ≤ 75 Edu <12 (n = 502) | CI versus NC | 0.83 (0.79–0.86) | <28 | 0.89 (0.87–0.92) | <59 | χ2(1) = 15.83 (p < 0.001) | χ2(1) = 12.66 (p < 0.001) |
| MCI versus NC | 0.69 (0.63–0.75) | <29 | 0.80 (0.75–0.85) | <65 | χ2(1) = 10.68 (p = 0.001) | χ2(1) = 7.82 (p = 0.005) | |
| MCI versus Dementia | 0.80 (0.76–0.85) | >25 | 0.79 (0.75–0.84) | >44 | χ2(1) = 0.29 (p = 0.59) | χ2(1) = 0.25 (p = 0.61) | |
| Dementia versus everything else | 0.85 (0.82–0.89) | <26 | 0.87 (0.84–0.90) | <55 | χ2(1) = 1.70 (p = 0.19) | χ2(1) = 1.45 (p = 0.23) | |
| Age ≤ 75 Edu ≥ 12 (n = 1009) | CI versus NC | 0.84 (0.82–0.87) | <29 | 0.92 (0.91–0.94) | <67 | χ2(1) = 59.38 (p < 0.001) | χ2(1) = 44.56 (p < 0.001) |
| MCI versus NC | 0.73 (0.68–0.77) | <29 | 0.86 (0.83–0.89) | <69 | χ2(1) = 41.22 (p < 0.001) | χ2(1) = 32.31 (p < 0.001) | |
| MCI versus Dementia | 0.78 (0.74–0.82) | >26 | 0.79 (0.75–0.83) | >47 | χ2(1) = 0.51 (p = 0.48) | χ2(1) = 0.15 (p = 0.70) | |
| Dementia versus everything else | 0.88 (0.85–0.90) | <28 | 0.92 (0.90–0.93) | <58 | χ2(1) = 17.53 (p < 0.001) | χ2(1) = 12.47 (p < 0.001) | |
| Age >75 Edu <12 (n = 784) | CI versus NC | 0.84 (0.80–0.88) | <27 | 0.89 (0.85–0.93) | <57 | χ2(1) = 7.61 (p = 0.006) | χ2(1) = 7.16 (p = 0.008) |
| MCI versus NC | 0.62 (0.54–0.70) | <29 | 0.80 (0.72–0.88) | <64 | χ2(1) = 13.07 (p < 0.001) | χ2(1) = 11.91 (p < 0.001) | |
| MCI versus Dementia | 0.89 (0.85–0.94) | >27 | 0.86 (0.82–0.91) | >45 | χ2(1) = 1.50 (p = 0.13) | χ2(1) = 10.78 (p = 0.001) | |
| Dementia versus everything else | 0.85 (0.82–0.88) | <26 | 0.82 (0.79–0.86) | <50 | χ2(1) = 5.05 (p = 0.025) | χ2(1) = 4.90 (p = 0.027) | |
| Age >75 Edu ≥ 12 (n = 849) | CI versus NC | 0.84 (0.81–0.87) | <28 | 0.91 (0.88–0.93) | <58 | χ2(1) = 22.77 (p < 0.001) | χ2(1) = 25.40 (p < 0.001) |
| MCI versus NC | 0.64 (0.59–0.70) | <29 | 0.78 (0.74–0.83) | <64 | χ2(1) = 23.68 (p < 0.001) | χ2(1) = 25.55 (p < 0.001) | |
| MCI versus Dementia | 0.84 (0.80–0.87) | >26 | 0.82 (0.78–0.85) | >48 | χ2(1) = 1.68 (p = 0.19) | χ2(1) = 1.91 (p = 0.17) | |
| Dementia versus everything else | 0.87 (0.85–0.89) | <27 | 0.88 (0.85–0.90) | <51 | χ2(1) = 0.58 (p = 0.45) | χ2(1) = 0.89 (p = 0.35) |
Cutoff points are determined using maximum accuracy method. With this approach the optimal cutoff point selected will result in highest value for the sum of true positive and true negative.
Table 3
Comparison of cut-off scores for the Standardized Mini-Mental State Examination (SMMSE) and Quick Mild Cognitive Impairment (Qmci) screen, using Youden’s Index and the maximal accuracy methods calculated from the area under the curve (AUC) grouped by age (≤75, >75 years) and education (<12,≥ 12 years), comparing normal controls (NC) to those with cognitive impairment (CI), those with dementia compared to the rest, those with NC versus mild cognitive impairment (MCI) and those with MCI versus dementia
| Subgroup (years) | Diagnosis | SMMSE Cut-off | SMMSE Cut-off | Qmci Cut-off | Qmci Cut-off |
| Youden’s Index | based on AUC | Youden’s Index | based on AUC | ||
| Overall (n = 3,387) | CI versus NC | <28 | <28 | <62 | <63 |
| MCI versus NC | <29 | <29 | <67 | <67 | |
| MCI versus Dementia | >25 | >25 | >45 | >45 | |
| Dementia versus everything else | <27 | <27 | <54 | <54 | |
| Age ≤ 75 Edu <12 (n = 502) | CI versus NC | <27 | <28 | <55 | <59 |
| MCI versus NC | <28 | <29 | <65 | <65 | |
| MCI versus Dementia | >23 | >25 | >44 | >44 | |
| Dementia versus everything else | <26 | <26 | <55 | <55 | |
| Age ≤ 75 Edu ≥ 12 (n = 1,009) | CI versus NC | <28 | <29 | <60 | <67 |
| MCI versus NC | <29 | <29 | <69 | <69 | |
| MCI versus Dementia | >26 | >26 | >49 | >47 | |
| Dementia versus everything else | <28 | <28 | <60 | <58 | |
| Age >75 Edu <12 (n = 784) | CI versus NC | <27 | <27 | <54 | <57 |
| MCI versus NC | <27 | <29 | <64 | <64 | |
| MCI versus Dementia | >25 | >25 | >45 | >45 | |
| Dementia versus everything else | <26 | <26 | <50 | <50 | |
| Age >75 Edu ≥ 12 (n = 849) | CI versus NC | <28 | <28 | <56 | <58 |
| MCI versus NC | <27 | <29 | <70 | <64 | |
| MCI versus Dementia | >26 | >26 | >45 | >48 | |
| Dementia versus everything else | <27 | <27 | <51 | <51 |


