
Diabetes and Alzheimer’s Disease: Can Elevated Free Copper Predict the Risk of the Disease?
Abstract
Background: Defective copper regulation, primarily referred to as chelatable redox active Cu(II), has been involved in the etiology of diabetes, and Alzheimer’s disease (AD).
Objectives: However, no study has determined levels of labile copper non-bound to ceruloplasmin (non-Cp Cu, also known as ‘free’ copper) in the blood of subjects with diabetes compared with that of AD patients.
Methods: To this aim, values of non-Cp Cu were measured in 25 Type 1 (T1D) and 31 Type 2 (T2D) subjects and in28 healthy controls, along with measurements of C-reactive protein, glycated hemoglobin A1c, cholesterol, and triglycerides. Non-Cp Cu levels were compared with those of an AD group previously studied.
Results: T2D subjects had significantly higher non-Cp Cu levels than Controls and T1D subjects (both p < 0.001 after adjusting for age, sex, and body mass index). A multinomial logistic model revealed that a one unit standard deviation increase of non-Cp Cu increased the relative risk of having T2D by 9.64 with respect to Controls (95% CI: 2.86–32.47). The comparison of non-Cp Cu levels in T2D with those of an AD population previously studied shows rising blood non-Cp Cu copper levels from Controls to T2D and AD.
Conclusion: These results suggest the involvement of catalytically-active Cu(II) and glucose dysregulation in oxidative stress reactions leading to tissue damage in both diseases.
INTRODUCTION
Diabetes represents a cluster of chronic metabolic conditions associated with defective insulin action and/or secretion, causing high blood sugar levels and an increased risk of microvascular complications, such as diabetic retinopathy, neuropathy, and nephropathy. In 2013 it was estimated that over382 million people throughout the world had diabetes. In type 1 diabetes (T1D), insulin production becomes inadequate for the control of blood glucose levels due to a near-total or complete destruction of beta cells in the pancreas. Approximately 10% of all diabetes cases are type 1. Typically, the disease first appears in childhood or early adulthood, but it can occur at any age.
In type 2 diabetes (T2D), insulin resistance is the predominant condition and more insulin than usual is needed for glucose to enter cells. Insulin resistance in the liver results in more glucose production, while resistance in peripheral tissues means that glucose uptake is impaired. The impairment stimulates the pancreas to make more insulin, but eventually the pancreas is unable to make enough to prevent blood sugar levels from rising too high.
The number of adults diagnosed with diabetes in the US has risen significantly in the past 30 years; it rose almost 5 fold from 5.5 million cases in 1980 to 29.1 million in 2014 [1]. Type 2 is the most common form of diabetes, accounting for over 90% of all diabetes cases.
Diabetes is a complex disease, in which polygenic and multifactorial effects, including auto-antigens, viruses, diet, and exercise can contribute to disease pathogenesis.
Since late 1970s, attention has been devoted to essential metal abnormalities in the etiology of this chronic metabolic disorder. Among the metals, copper, in particular, drew attention since hyperglycemia has been linked to tissue damage through impaired copper homeostasis. Non-clinical models of diabetes demonstrated that it causes defective copper regulation [2], primarily involving advanced-glycation end products (AGEs), that can modify amino acid residues producing pathological copper-binding sites within extracellular matrix components of the blood-vessel walls.
Alzheimer’s disease (AD) is another common age-associated disorder with a complex etiology in which metal abnormalities have been implicated. In the brain, AD is characterized by the presence of several kinds of amyloid plaques and neurofibrillary tangles, which consist mostly of the amyloid-β (Aβ) protein and hyperphosphorylated tau. Extensive experiments conducted by numerous groups using animal and cell models, as well as in vitro assays, have reached consensus regarding the involvement of metals and particularly copper in the toxic gain of function of the Aβ, which has been indicated to be central in the disease, a dogma which has been challenged in recent years. These studies demonstrated that the hypermetallation of the Aβ peptide is at the basis of the reduction-oxidation (redox) cycles of oxidative stress, which produce H2O2 as a by-product and are catalyzed by transition metals (Fenton’s and Haber Weiss chemistry) [3–5]. Evidence is also increasing about dietary AGEs as important risk factors forAD [6].
A number of studies have been performed investigating copper levels in T1D and T2D, most of them demonstrating elevated levels of copper in the serum or plasma of T2D patients. Studies of urinary copper excretion indirectly demonstrated excess of systemic chelatable free copper in diabetes patients [2, 7]. These findings were confirmed in clinical as well as nonclinical models of the disease [7–10]. Free copper, or more precisely copper not bound to ceruloplasmin (non-Cp Cu), is a pool of circulating redox-active copper loosely bound to albumin and micronutrients in the blood, available to meet tissue needs in the body. If the non-Cp Cu pool becomes expanded, this copper becomes toxic, as exemplified by Wilson’s disease, the paradigmatic disease of non-Cp Cu copper intoxication and accumulation [11–13]. More recently, elevations of non-Cp Cu have been identified in AD [14]. Even though a number of studies have investigated copper abnormalities in T1D and T2D, including those testing copper chelating agents in diabetic cardiovascular disease [2, 7, 8, 15], no study has been carried out so far testing the presence of labile non-Cp Cu copper in the blood of diabetic patients. The current study was exactly designed to explore the hypothesis of the existence of an expanded pool of chelatable non-Cp Cu in general circulation of persons with T2D.
METHODS
Subjects
Control, T1D, and T2D subjects were recruited from the University of Miami affiliated clinics. All patients provided informed consent; recruitment and all procedures were approved by the University of Miami Human Subjects Research Office. All procedures involving experiments on human subjects have been done in accordance with the ethical standards of the Committee on Human Experimentation of our institution and in accordance with the Helsinki Declaration of 1975 (revised 2008). Blind procedures for data collection and analyses were applied. Serum samples were obtained from fasting blood, and aliquots were stored frozen at –80°C until analysis.
Biochemical analyses
The direct fluorescent non-Cp Cu test is an in vitro method [16] carried out at IGEA Research Corporation Laboratories in Miami (FL, US). The method is based on two steps, as follows: i) a size exclusion solid-phase extraction (SPE) flow system separates the portion of low molecular weight non-Cp Cu present in serum from the protein-bound copper; ii) it is a direct fluorescent assay based on a coumarin fluorescent probe; finally, it is a microplate device for the reading of the fluorescence signal. The fluorescent coumarin probe is specific for Cu(II) and is added to the soluble fraction eluted from the previous steps for the fluorescence emission signal detection. When the probe captures the labile non-Cp Cu — as a Cu(II) — from small peptides and amino acids, there is a decay in its fluorescence emission, proportional to non-Cp Cu concentration. During step (i), serum is loaded to a SPE chromatography (Ultra-high molecular weight polyethylene; micro-column with resevoir-3 ml capacity). The stationary phase is compressed with 6 mL physiological solution (0.9% NaCl) using a peristaltic pump (ISMATEC IPC, Cole-Parmer GmbH, Germany) at a flow rate of 500 μL/min. Serum (200 μL) was loaded on the column and eluted at a flow rate of 200 μL/min. The fraction eluted, containing non-Cp Cu, is collected into polypropylene tubes. During step (ii), a 50 μL volume of the fraction eluted (in duplicate) is co-incubated with the fluorescent probe at a final concentration of 10–5 M into the well of a 96/wells micro-plate reader, and the complex is read in a Victor X2 fluorimeter (Perkin Elmer) at excitation and emission wavelength of 380 nm and 500 nm, respectively. The interaction of the fluorescent probe with Cu(II) present in the eluate of step (i) switches-off the fluorescent probe. The intensity of the decay of the fluorescent emission is proportional to the quantity of non-Cp Cu present in the original specimen.
Body mass index (BMI) was calculated as body weight (kg) divided by height squared (m2).C reactive protein (CRP), glycated hemoglobin A1c (HbA1c), cholesterol, and triglycerides were measured on a Cobas 6000 analyzer and using reagents from Roche Diagnostics (Indianapolis, IN), following all manufacturer instructions and procedures.
Statistics
Statistical significance of the differences between groups in the functional assays were made by one-way ANOVA, followed by Tukey’s multiple comparison test. A one-way analysis of covariance (ANCOVA) was conducted to determine if there were significant differences between groups on non-Cp Cu after adjusting for significant variables. Multiple comparisons tests were conducted to evaluate pairwise differences among the adjusted means using Bonferroni’s correction. Correlation analyses were evaluated by the Pearson correlation coefficient r. A multinomial logistic model was applied to predict the probability of developing one of the diagnoses (dependent variable), on the basis of the non-Cp Cu levels, BMI, age, and sex (indipendent variables). Control group was chosen as the referent group. Results were presented in term of relative risk ratios (RRR) and the corresponding 95% confidence interval (95% CI). Statistical analysis was made in Graphad Prism 7.0a (Graphad Software, La Jolla, CA, USA) or SPSS version 23 (IBM, Armonk, NY, USA).
RESULTS
Non-Cp Cu levels in healthy controls, T1D, and T2D patients
Table 1 shows the demographic and selected clinical variables of the study population. In general, the majority of subjects were Hispanic (62% of the entire cohort), 28% were non-Hispanic Caucasian, and 10% were African-American, representative of the Miami population. The T2D group was significantly older and had a higher BMI than the Control and T1D subjects. CRP levels, as a measure of systemic inflammation, were not statistically different between any of the groups. HbA1c was similar for T1D and T2D subjects. Lastly T1D and T2D subjects had significantly lower cholesterol levels than controls, likely accounted for by the increased use of statins in the diabetic subjects.
Figure 1 shows non-Cp Cu copper levels measured in the serum samples of all subjects. T2D subjects had significantly higher non-Cp Cu levels (1.97 ± 0.31 μM, mean ± Standard Deviation, SD) than Controls and T1D subjects (1.37 ± 0.42 and 1.54 ± 0.33, respectively, both p < 0.001 compared to T2D). There was no significant difference between the Control and T1D group.
The relationship between age and non-Cp Cu levels was evaluated, and no significant correlations were observed in any of the study cohorts (Pearson r all p > 0.1; Fig. 2). However, since age was significantly higher in the T2D subjects compared to Control and T1D subjects (Table 1), it was used as a covariate in the ANCOVA. There was a significant group effect on non-Cp Cu after controlling for age [F (1, 80) = 16.2, p < 0.001]. There were significant differences in the age-adjusted non-Cp Cu values between Control and T2D (1.35 ± 0.08 versus 1.98 ± 0.07, p < 0.001) and T1D versus T2D (1.53 ± 0.08 versus 1.98 ± 0.07, p < 0.001). Thus, the differences in non-Cp Cu in T1D were not due to the increased age of this group, relative to the Controls or T1D subjects.
The relationship between BMI and non-Cp Cu levels was evaluated and no significant correlations were observed (Pearson r all p > 0.1) in any of the study cohorts (Fig. 3). BMI was significantly higher for T2D compared to Control and T1D subjects (Table 1) and was used as a covariate in the ANCOVA (as above) to evaluate differences between groups (Control, T1D, T2D) that might be accounted for by the increased BMI. There remained a significant group effect on non-Cp Cu after controlling for BMI [F (1, 80) = 16.1, p < 0.001]. Significant differences persisted in the adjusted means between Control and T2D 1.37 ± 0.07 and 1.97 ± 0.07, p < 0.001) and between T1D and T2D (1.54 ± 0.08 and 1.97 ± 0.07, respectively, p < 0.001).
There were no significant correlations between non-Cp Cu and HbA1c in the diabetic subjects or CRP in any of the study groups (data not shown).
Multinomial logistic model
A multinomial logistic model has been applied to investigate the relationship between the diagnosis groups (T1D and T2D), assuming as the dependent variable, and the biological and demographical variables, as follows: non-Cp Cu, BMI, age, and sex (Table 2). The model revealed that none of the considered variables had an effect on the risk of having T1D. Conversely, the effect of non-Cp Cu and age on the relative risk (RRR) of having T2D was significant (Table 2). More specifically, a one unit standard deviation increase of non-Cp Cu increased the relative risk of having T2D by 9.64 with respect to Controls (95% CI: 2.86–32.47, holding constant the effect of the other variables in the model). In other words, we can say that if two subjects have identical age, BMI, and sex, but diverse non-Cp Cu, the subject with the higher standardized non-Cp Cu has a 10-times greater relative risk of having T2D than the subject with the lower value.
Even age had an effect on the risk of T2D but was less significant. In this model, a one-year increase of age raised the relative risk for T2D by about 17% (RRR = 1.17; 95% CI: 1.06–1.29, holding constant the effect of the other variables in the model).
Comparison of non-Cp Cu levels in Controls and T2D and AD
Figure 4 shows the comparison of non-Cp Culevels in Controls and T2D of the current study with those of an AD population previously studied [17]. Controls had significantly lower non-Cp Cu levels (p < 0.0005) than T2D and AD subjects. Levels in T2D (2.0 ± 0.3 μM; mean ± SD) approached those of the AD cohort (2.1 ± 0.6 μM) with no significant difference between these two groups. It should be noted that the AD subjects were older (81 ± 7 versus 67 ± 7 years), had a greater proportion of females (68 versus 50%), and were mostly European Caucasians compared to mostly Hispanic ethnicity relative to the T2D group in the current study. In spite of these demographic differences, these results demonstrate that elevated serum non-Cp Cu in T2D are comparable to levels observed in AD subjects [17].
Comparison of non-Cp Cu levels as revealed through the direct and the indirect method
Figure 5 shows the comparison of two methods of evaluation of non-Cp Cu levels [18]: the direct fluorescent method and the indirect method known as Walshe’s index [13] based on the subtraction of the quantity of the copper bound to ceruloplasmin from the total concentration of copper in the blood serum are compared in samples of 147 healthy subjects [(77 women, 52.7%), mean age 49 ± 12.7 years (25–84), Mini-Mental State Examination (MMSE) [19] 29 ± 1] and 89 AD patients [(52 women, 67.5%), mean age 73 ± 8.5 (50–86), MMSE 19 ± 4.7], studied in-depth elsewhere [18]. In healthy controls, the mean value of the direct measurement of non-Cp Cu with the fluorescent method was 1.07 (±0.6), and that calculated with the Walshe’s index was 0.79 (±1.3). In AD patients, the mean value of the direct measurement of non-Cp Cu with the fluorescent method was 2.3 (±1.5) and that calculated with the Walshe’s index 2.1 (±1.7).
DISCUSSION
The main result of the current study is that T2D patients have increased levels of labile non-Cp Cu in the peripheral circulation, which corresponds to an increase in the relative risk of having T2D that is approximately ten times higher than in Controls. This is not true for T1D. T1D, if anything, can be considered more severe than T2D, because of the total or near total immune destruction of insulin producing cells. Copper seems to play no role in T1D. Conversely, an increase in the risk of having T2D corresponding to an expanded pool of non-Cp Cu resembles a chronic dysfunction possibly associated with progressive amyloidosis in the pancreatic islets or other target tissue, theoretically comparable to what happens in the AD brain. A direct link between Cu(II) and AGEs as interacting risk factors increasing the probability of having AD [3, 20] can be suggested. Longitudinal studies are in progress to deepen the connection of copper and glucose altered metabolism and their effects on the cognitive state of diabetes patients.
The results presented in this study confirm previous indirect evidence of elevated systemic chelatable copper, as revealed by increased levels of basal urinary copper excretion in T2D [2, 7–10]. Moreover, they are in line with previous literature of systemic copper excess in T2D patients. More precisely, since the late 1970s, eleven studies demonstrated that copper in serum was increased in patients affected by T2D [21–31], four studies reported no change [32–35], and only two studies reported decreased level of copper in T2D, in comparison with healthy controls [36, 37]. Furthermore, our data can explain results of elevated copper balance in T2D, demonstrated by the fact that oral administration of trientine, a copper chelating agent, increased the urinary copper excretion in T2D patients in comparison with controls, as well as intravenous infusion of the drug dose in Zucker diabetic rats [38, 39].
T1D subjects showed no sign of copper abnormalities in terms of non-Cp Cu elevation, in agreement with previous evidence [31], even though literature regarding serum copper level in patients with T1D is very limited.
Another result of the current investigation is that abnormalities in non-Cp Cu levels revealed in T2D subjects approach those described in an AD population recently studied using the same methodology [17]. The mean value of non-Cp Cu in the AD population used in this comparison is 2.1 μM, but in previous studies, we reported higher values of non-Cp Cu in AD, ranging from 2.5-2.6 μM [40, 41] to 2.72 [42]. In the latter cited studies, the non-Cp Cu was evaluated by means of an indirect method, consisting of subtracting the quantity of the copper bound to ceruloplasmin from the total amount of the serum copper, with a calculation known as the Walshe’s index [13]. As discussed extensively in previous reports [14], this copper index has limitations. It assumes that ceruloplasmin is saturated, that it is in the correct stoichiometry with the moles of copper, and the most important limit is that the ceruloplasmin is overestimated by the immunologic assay, since it measures either the holo-form of ceruloplasmin or apo-forms of the protein (fragments of the protein not containing copper), thus providing un underestimation of the levels of non-Cp Cu in the calculation. This underestimation has as a result that the values of the Walshe’s index can be lower than the corresponding values measured with the direct fluorescent method (the Walshe’s formula can provide even negative values). This is evident in Fig. 5 that shows the comparison between the non-Cp Cu evaluated through the Walshe’s index and that obtained through the fluorescent direct method, which was applied in this current study and elsewhere [17, 43]. The comparison of the results shows that the two methods highly agree, albeit they do not correlate perfectly. However, the comparison cannot provide any information about the contribution of each copper component (albumin, transcuprein, small copper carriers [44]) present in the blood plasma to the non-Cp Cu pool. The variation in the average of the non-Cp Cu in AD estimated so far can be explained in terms of the method used, the size of the sample, and the demographic characteristics, but mostly by the percentage of the AD patients exhibiting abnormal non-Cp Cu levels present in the subject sample, since it is known that copper homeostasis abnormality is not a general condition of AD, but pertains to a subpopulation of patients, as recently demonstrated [17, 45].
As a whole, these findings strongly sustain a disease cascade pathway connecting high blood glucose levels with copper imbalance and tissue damage, affecting primarily vascular and cardiac tissues in T2D, through AGEs and oxidative stress, as proposed by some authors [2, 46]. From experimental models of the T2D, it derives that the amount of chelatable copper in the plasma of diabetic rats is approximately twice that in normal rat plasma [46]. Furthermore, there is substantial evidence that Cu(II) reacts with collagen and other extracellular matrix components, producing AGE-modification of proteins in blood-vessel walls. This appears as a widespread phenomenon [46–51], also confirmed in studies on humans [8, 39], closely linking copper alterations to the pathogenesis of vasculopathy and organ damage. More specifically, the mechanism appears to involve glycated proteins, which bind transition metals such as copper, and that the complexes Cu(II)-AGEs accumulate within the vasculature [46]. It has been demonstrated that AGEs can bind and localize the oxidative form of Cu(II), which is catalytically-active, thus prone to trigger oxidative stress reactions [8, 52]. The direct fluorescent method we employed to measure non-Cp Cu is specific for Cu(II) oxidative state, thus sustaining a precise involvement of this catalytically active Cu(II) in diabetes oxidative stress leading to tissue damage. Non-clinical models of the disease provided extensive evidence that once the Cu(II) mediated oxidative stress process becomes activated, it results in the progressive enhancement of further protein-modification and consequent copper-trapping potential [50], in a vicious circle of oxidative stress.
AD is another common age-associated disorder with a complex etiology in which metal abnormalities have been implicated. Elevated levels of chelatable non-Cp Cu in brain tissues [53] and body fluids [14] have been reported in humans and extensively in experimental models of AD as well: redox reactions promoting Aβ interaction with copper in AD have been proposed to cause processes of autoxidation promoting Aβ self-aggregation, eventually leading to oxidative stress and cell death (reviewed in [54]). Studies at the basis of the model of the toxic gain of function of Aβ mediated by transition metals [55, 56] demonstrated that the amyloid-β protein precursor (AβPP) binds and reduces copper from Cu(II) to Cu(I), modulating copper-induced toxicity in cell cultures and oxidative stress through the production of H2O2 [57], which appears to temporally precede Aβ plaques formation [58]. This results in Aβ and metals packed together in plaques [59, 60]. Aβ plaques disturb brain physiology, entrapping metals within the plaques, while cell-associated copper appears decreased [55].
Even though Aβ plaques remain major lesions in AD brain, the notion that AβPP mutations, through a gain of function process and Aβ deposits, are per se neurotoxic has repeatedly been called into question [58, 61]. Alternative hypotheses of Aβ’s loss of function positing a protective role of Aβ against toxic levels of metals are now substantiated by a critical mass of evidence [58, 62]. Aβ is proposed to chelate toxic metals and protect neurons from oxidative insult which appears to precede Aβ pathology [58, 62]. The loss of this protecting function cannot counteract the increase in the metal-oxidative stress insult, prompting the disease cascade [58, 62].
Even though the exact mechanism is still elusive, strong support of the breakdown of copper homeostasis as a risk factor pertinent to AD comes from a myriad of experimental, as well as clinical, genetic, and large population studies [63–67]. In this line, the most representative are the studies of meta-analyses, which show copper imbalance in AD, consisting of copper decreases in the brain [68], along with increases of total copper and non-Cp chelatable copper in the serum of AD patients [14, 69]. This condition is a typical sign of copper breakdown homeostasis, as shown by Wilson’s disease, the paradigmatic disorder of non-Cp Cu toxicosis and accumulation [11, 12].
Our results, therefore, would indicate that non-Cp Cu is specifically linked to T2D pathophysiology [2], suggesting a role similar to that already proposed in AD [70]. In past years, considerable evidence indicated that AD and diabetes share common pathways [71] and that altered copper and glucose metabolisms can contribute to the disease onset of these complex diseases. Enzymes and second messenger abnormalities in terms of mitochondrial dysfunctions and glucose and copper abnormalities have been described in both diseases. A receptor for AGEs (RAGE), a multi-ligand receptor, has been described to play a role in several inflammatory pathways shared among diabetes, obesity, and AD, transporting the circulating Aβ across the brain-blood barrier, producing oxidative stress and cerebral blood flow abnormalities [6, 72].
Current results strengthen previous evidence [2], which demonstrated that diabetes-evoked copper dysregulation has the potential to be a target for therapeutic and preventive interventions aimed atpreserving organ function in diabetes, heart failure, and some neurological disorders connected with aging, in line with recent suggestions to thepublic [73].
Limits of our study are the small size of the sample, possible sampling bias relative to the subjects studied and most of all the lack of a cognitive follow-up of the T2D patients. Moreover, our estimation of the RRR has a large IC due to the non-Cp Cu variability in the T2D group, which has then to be repeated in a new T2D population. Confirmation of the present findings in larger longitudinal cohorts to explore the connection between copper, alterations of glucose metabolism, risk of developing T2D, and their relationships with cognitive impairment and AD are therefore necessary.
CONCLUSIONS
The comparison of non-Cp Cu levels in T2D with those of an AD population previously studied shows rising blood non-Cp Cu copper levels from Controls to T2D and AD, demonstrating the involvement of catalytically-active Cu(II) and glucose dysregulation in oxidative stress reactions leading to tissue damage in both diseases. We suggest that the increased risk of AD in patients with T2D, as reported by epidemiological studies, may be mediated by abnormal copper metabolism, which even alone affects the risk on the disease.
ACKNOWLEDGMENTS
Authors thanks Dr. Valentine Negrouk for technical support.
This work was supported by National Research Council [Aging Program 2012–2014, ‘A low-copper diet as a preventive strategy for cognitive disability in Aging’]; Italian Ministry of Health [5XMille project ‘Un metodo sensibile, diretto e preciso per misurare il rame Non-legato alla Ceruloplasmina nel siero per applicazione in ambiente clinico’ 02/09/2013 al 31/08/2015]; Italian Ministry of Health [‘Tolerability and efficacy of Zinc therapy in Mild Cognitive Impairment for treatment and prevention of Alzheimer’s disease: a prospective, randomized, double blind, parallel, placebo controlled Phase II clinical trial’ (Project Code: CO-2013-02358488)]; Canox4drug SpA [2013–2016 ‘Non-Ceruloplasmin copper in Alzheimer’s disease’ (Prot. 30/2013)], Italian Ministry of Health, Ricerca Corrente.
Authors’ disclosures available online (http://j-alz.com/manuscript-disclosures/16-1033r2).
REFERENCES
[1] | Centers for Disease Control and Prevention ((2014) ) National Diabetes Statistics Report: Estimates of Diabetes and Its Burden in the United States. U.S. Department of Health and Human Services; Atlanta. |
[2] | Cooper GJ ((2012) ) Selective divalent copper chelation for the treatment of diabetes mellitus. Curr Med Chem 19: , 2828–2860. |
[3] | De Felice FG , Ferreira ST ((2014) ) Inflammation, defective insulin signaling, and mitochondrial dysfunction as common molecular denominators connecting type 2 diabetes to Alzheimer disease. Diabetes 63: , 2262–2272. |
[4] | Huang X , Atwood CS , Hartshorn MA , Multhaup G , Goldstein LE , Scarpa RC , Cuajungco MP , Gray DN , Lim J , Moir RD , Tanzi RE , Bush AI ((1999) ) The A beta peptide of Alzheimer’s disease directly produces hydrogen peroxide through metal ion reduction. Biochemistry 38: , 7609–7616. |
[5] | Huang X , Cuajungco MP , Atwood CS , Hartshorn MA , Tyndall JD , Hanson GR , Stokes KC , Leopold M , Multhaup G , Goldstein LE , Scarpa RC , Saunders AJ , Lim J , Moir RD , Glabe C , Bowden EF , Masters CL , Fairlie DP , Tanzi RE , Bush AI ((1999) ) Cu(II) potentiation of alzheimer abeta neurotoxicity. Correlation with cell-free hydrogen peroxide production and metal reduction. J Biol Chem 274: , 37111–37116. |
[6] | Perrone L , Grant WB ((2015) ) Observational and ecological studies of dietary advanced glycation end products in national diets and Alzheimer’s disease incidence and prevalence. J Alzheimers Dis 45: , 965–979. |
[7] | Cooper GJ , Chan YK , Dissanayake AM , Leahy FE , Keogh GF , Frampton CM , Gamble GD , Brunton DH , Baker JR , Poppitt SD ((2005) ) Demonstration of a hyperglycemia-driven pathogenic abnormality of copper homeostasis in diabetes and its reversibility by selective chelation: Quantitative comparisons between the biology of copper and eight other nutritionally essential elements in normal and diabetic individuals. Diabetes 54: , 1468–1476. |
[8] | Cooper GJ , Phillips AR , Choong SY , Leonard BL , Crossman DJ , Brunton DH , Saafi L , Dissanayake AM , Cowan BR , Young AA , Occleshaw CJ , Chan YK , Leahy FE , Keogh GF , Gamble GD , Allen GR , Pope AJ , Boyd PD , Poppitt SD , Borg TK , Doughty RN , Baker JR ((2004) ) Regeneration of the heart in diabetes by selective copper chelation. Diabetes 53: , 2501–2508. |
[9] | Ito S , Fujita H , Narita T , Yaginuma T , Kawarada Y , Kawagoe M , Sugiyama T ((2001) ) Urinary copper excretion in type 2 diabetic patients with nephropathy. Nephron 88: , 307–312. |
[10] | Lau AL , Failla ML ((1984) ) Urinary excretion of zinc, copper and iron in the streptozotocin-diabetic rat. J Nutr 114: , 224–233. |
[11] | Brewer GJ , Fink JK , Hedera P ((1999) ) Diagnosis and treatment of Wilson’s disease. Semin Neurol 19: , 261–270. |
[12] | Hoogenraad T ((2001) ) Wilson’s disease. Intermed Medical Publishers, Amsterdam/Rotterdam. |
[13] | Walshe JM , Clinical Investigations Standing Committee of the Association of Clinical Biochemists ((2003) ) Wilson’s disease: The importance of measuring serum caeruloplasmin non-immunologically. Ann Clin Biochem 40: , 115–121. |
[14] | Squitti R , Simonelli I , Ventriglia M , Siotto M , Pasqualetti P , Rembach A , Doecke J , Bush AI ((2014) ) Meta-analysis of serum non-ceruloplasmin copper in Alzheimer’s disease. J Alzheimers Dis 38: , 809–822. |
[15] | Cooper JG , Claudi T , Jenum AK , Thue G , Hausken MF , Ingskog W , Sandberg S ((2009) ) Quality of care for patients with type 2 diabetes in primary care in Norway is improving: Results of cross-sectional surveys of 33 general practices in 1995 and 2005. Diabetes Care 32: , 81–83. |
[16] | Colabufo N , Squitti R ((2014) ) Method and kit for determination of free copper in serum, WO2014/071973A1. |
[17] | Squitti R , Ventriglia M , Gennarelli M , Colabufo NA , El Idrissi IG , Bucossi S , Mariani S , Rongioletti M , Zanetti O , Congiu C , Rossini PM , Bonvicini C ((2016) ) Non-ceruloplasmin copper distincts subtypes in Alzheimer’s disease: A genetic study of ATP7B frequency. Mol Neurobiol. doi: 10.1007/s12035-015-9664-6. Erratum in Mol Neurobiol, doi: 10.1007/s12035-016-9734-4 |
[18] | Squitti R , Siotto M , Cassetta E , Ghafir El Idrissi I , Colabufo NA ((2016) ) Measurements of serum non-ceruloplasmin copper by a direct fluorescent method specific for Cu(II). Clin Chem Lab Med in press. |
[19] | Folstein MF , Folstein SE , McHugh PR ((1975) ) “Mini-mental state”. A practical method for grading the cognitive state of patients for the clinician. J Psychiatr Res 12: , 189–198. |
[20] | Crane PK , Walker R , Larson EB ((2013) ) Glucose levels and risk of dementia. N Engl J Med 369: , 1863–1864. |
[21] | Batista MN , Cuppari L , de Fatima Campos Pedrosa L , Almeida M , de Almeida JB , de Medeiros AC , Canziani ME ((2006) ) Effect of end-stage renal disease and diabetes on zinc and copper status. Biol Trace Elem Res 112: , 1–12. |
[22] | Schlienger JL , Grunenberger F , Maier EA , Simon C , Chabrier G , Leroy MJ ((1988) ) [Disorders of plasma trace elements in diabetes. Relation to blood glucose equilibrium]. Presse Med 17: , 1076–1079. |
[23] | Zhao C , Wang H , Zhang J , Feng L ((2008) ) Correlations of trace elements, glucose and body compositions in type 2 diabetics. Wei Sheng Yan Jiu 37: , 600–601, 605. |
[24] | Isbir T , Tamer L , Taylor A , Isbir M ((1994) ) Zinc, copper and magnesium status in insulin-dependent diabetes. Diabetes Res 26: , 41–45. |
[25] | Mateo MC , Bustamante JB , Cantalapiedra MA ((1978) ) Serum, zinc, copper and insulin in diabetes mellitus. Biomedicine 29: , 56–58. |
[26] | Zargar AH , Shah NA , Masoodi SR , Laway BA , Dar FA , Khan AR , Sofi FA , Wani AI ((1998) ) Copper, zinc, and magnesium levels in non-insulin dependent diabetes mellitus. Postgrad Med J 74: , 665–668. |
[27] | Ferdousi S , Mia AR ((2012) ) Serum levels of copper and zinc in newly diagnosed type-2 diabetic subjects. Mymensingh Med J 21: , 475–478. |
[28] | Flores CR , Puga MP , Wrobel K , Garay Sevilla ME , Wrobel K ((2011) ) Trace elements status in diabetes mellitus type 2: Possible role of the interaction between molybdenum and copper in the progress of typical complications. Diabetes Res Clin Pract 91: , 333–341. |
[29] | Thomas B , Gautam A , Prasad BR , Kumari S ((2013) ) Evaluation of micronutrient (zinc, copper and iron) levels in periodontitis patients with and without diabetes mellitus type 2: A biochemical study. Indian J Dent Res 24: , 468–473. |
[30] | Khan FA , Al Jameil N , Arjumand S , Khan MF , Tabassum H , Alenzi N , Hijazy S , Alenzi S , Subaie S , Fatima S ((2015) ) Comparative study of serum copper, iron, magnesium, and zinc in type 2 diabetes-associated proteinuria. Biol Trace Elem Res 168: , 321–329. |
[31] | Xu J , Zhou Q , Liu G , Tan Y , Cai L ((2013) ) Analysis of serum and urinal copper and zinc in Chinese northeast population with the prediabetes or diabetes with and without complications. Oxid Med Cell Longev 2013: , 635214. |
[32] | Aydin E , Cumurcu T , Ozugurlu F , Ozyurt H , Sahinoglu S , Mendil D , Hasdemir E ((2005) ) Levels of iron, zinc, and copper in aqueous humor, lens, and serum in nondiabetic and diabetic patients: Their relation to cataract. Biol Trace Elem Res 108: , 33–41. |
[33] | Car N , Car A , Granic M , Skrabalo Z , Momcilovic B ((1992) ) Zinc and copper in the serum of diabetic patients. Biol Trace Elem Res 32: , 325–329. |
[34] | Gouaref I , Bellahsene Z , Zekri S , Alamir B , Koceir EA ((2016) ) The link between trace elements and metabolic syndrome/oxidative stress in essential hypertension with or without type 2 diabetes. Ann Biol Clin (Paris) 74: , 233–243. |
[35] | Terres-Martos C , Navarro-Alarcon M , Martin-Lagos F , Lopez Gdl SH , Perez-Valero V , Lopez-Martinez MC ((1998) ) Serum zinc and copper concentrations and Cu/Zn ratios in patients with hepatopathies or diabetes. J Trace Elem Med Biol 12: , 44–49. |
[36] | Basaki M , Saeb M , Nazifi S , Shamsaei HA ((2012) ) Zinc, copper, iron, and chromium concentrations in young patients with type 2 diabetes mellitus. Biol Trace Elem Res 148: , 161–164. |
[37] | Chen MD , Lin WH , Lin PY , Wang JJ , Tsou CT ((1991) ) Investigation on the relationships among blood zinc, copper, insulin and thyroid hormones in non-insulin dependent diabetes mellitus and obesity. Zhonghua Yi Xue Za Zhi (Taipei) 48: , 431–438. |
[38] | Baynes JW , Murray DB ((2009) ) The metal chelators, trientine and citrate, inhibit the development of cardiac pathology in the Zucker diabetic rat. Exp Diabetes Res 2009: , 696378. |
[39] | Cooper GJ , Young AA , Gamble GD , Occleshaw CJ , Dissanayake AM , Cowan BR , Brunton DH , Baker JR , Phillips AR , Frampton CM , Poppitt SD , Doughty RN ((2009) ) A copper(II)-selective chelator ameliorates left-ventricular hypertrophy in type 2 diabetic patients: A randomised placebo-controlled study. Diabetologia 52: , 715–722. |
[40] | Squitti R , Bressi F , Pasqualetti P , Bonomini C , Ghidoni R , Binetti G , Cassetta E , Moffa F , Ventriglia M , Vernieri F , Rossini PM ((2009) ) Longitudinal prognostic value of serum “free” copper in patients with Alzheimer disease. Neurology 72: , 50–55. |
[41] | Squitti R , Ventriglia M , Barbati G , Cassetta E , Ferreri F , Dal Forno G , Ramires S , Zappasodi F , Rossini PM ((2007) ) ‘Free’ copper in serum of Alzheimer’s disease patients correlates with markers of liver function. J Neural Transm (Vienna) 114: , 1589–1594. |
[42] | Squitti R , Pasqualetti P , Polimanti R , Salustri C , Moffa F , Cassetta E , Lupoi D , Ventriglia M , Cortesi M , Siotto M , Vernieri F , Rossini PM ((2013) ) Metal-score as a potential non-invasive diagnostic test for Alzheimer’s disease. Curr Alzheimer Res 10: , 191–198. |
[43] | Siotto M , Simonelli I , Pasqualetti P , Mariani S , Caprara D , Bucossi S , Ventriglia M , Molinario R , Antenucci M , Rongioletti M , Rossini PM , Squitti R ((2016) ) Association between serum ceruloplasmin specific activity and risk of Alzheimer’s disease. J Alzheimers Dis 50: , 1181–1189. |
[44] | Linder MC ((2016) ) Ceruloplasmin and other copper binding components of blood plasma and their functions: An update. Metallomics 8: , 887–905. |
[45] | Tecchio F , Vecchio F , Ventriglia M , Porcaro C , Miraglia F , Siotto M , Rossini PM , Rongioletti M , Squitti R ((2016) ) Non-ceruloplasmin copper distinguishes a distinct subtype of Alzheimer’s disease: A study of EEG-derived brain activity. Curr Alzheimer Res 13: , 1374–1384. |
[46] | Eaton JW , Qian M ((2002) ) Interactions of copper with glycated proteins: Possible involvement in the etiology of diabetic neuropathy. Mol Cell Biochem 234-235: , 135–142. |
[47] | Baynes JW , Thorpe SR ((2000) ) Glycoxidation and lipoxidation in atherogenesis. Free Radic Biol Med 28: , 1708–1716. |
[48] | Degenhardt TP , Thorpe SR , Baynes JW ((1998) ) Chemical modification of proteins by methylglyoxal. Cell Mol Biol (Noisy-le-grand) 44: , 1139–1145. |
[49] | Fu MX , Wells-Knecht KJ , Blackledge JA , Lyons TJ , Thorpe SR , Baynes JW ((1994) ) Glycation, glycoxidation, and cross-linking of collagen by glucose. Kinetics, mechanisms, and inhibition of late stages of the Maillard reaction. Diabetes 43: , 676–683. |
[50] | Price DL , Rhett PM , Thorpe SR , Baynes JW ((2001) ) Chelating activity of advanced glycation end-product inhibitors. J Biol Chem 276: , 48967–48972. |
[51] | Thomas MC , Baynes JW , Thorpe SR , Cooper ME ((2005) ) The role of AGEs and AGE inhibitors in diabetic cardiovascular disease. Curr Drug Targets 6: , 453–474. |
[52] | Seifert ST , Krause R , Gloe K , Henle T ((2004) ) Metal complexation by the peptide-bound maillard reaction products N(epsilon)-fructoselysine and N(epsilon)-carboxymethyllysine. J Agric Food Chem 52: , 2347–2350. |
[53] | James SA , Volitakis I , Adlard PA , Duce JA , Masters CL , Cherny RA , Bush AI ((2012) ) Elevated labile Cu is associated with oxidative pathology in Alzheimer disease. Free Radic Biol Med 52: , 298–302. |
[54] | Squitti R ((2014) ) Copper subtype of Alzheimer’s disease (AD): Meta-analyses, genetic studies and predictive value of non-ceruloplasmim copper in mild cognitive impairment conversion to full AD. J Trace Elem Med Biol 28: , 482–485. |
[55] | Barnham KJ , Bush AI ((2008) ) Metals in Alzheimer’s and Parkinson’s diseases. Curr Opin Chem Biol 12: , 222–228. |
[56] | Bush AI ((2003) ) The metallobiology of Alzheimer’s disease. Trends Neurosci 26: , 207–214. |
[57] | White AR , Multhaup G , Maher F , Bellingham S , Camakaris J , Zheng H , Bush AI , Beyreuther K , Masters CL , Cappai R ((1999) ) The Alzheimer’s disease amyloid precursor protein modulates copper-induced toxicity and oxidative stress in primary neuronal cultures. J Neurosci 19: , 9170–9179. |
[58] | Lee HG , Castellani RJ , Zhu X , Perry G , Smith MA ((2005) ) Amyloid-beta in Alzheimer’s disease: The horse or the cart? Pathogenic or protective?. Int J Exp Pathol 86: , 133–138. |
[59] | Cherny RA , Legg JT , McLean CA , Fairlie DP , Huang X , Atwood CS , Beyreuther K , Tanzi RE , Masters CL , Bush AI ((1999) ) Aqueous dissolution of Alzheimer’s disease Abeta amyloid deposits by biometal depletion. J Biol Chem 274: , 23223–23228. |
[60] | Multhaup G , Schlicksupp A , Hesse L , Beher D , Ruppert T , Masters CL , Beyreuther K ((1996) ) The amyloid precursor protein of Alzheimer’s disease in the reduction of copper(II) to copper(I). Science 271: , 1406–1409. |
[61] | Smith MA , Joseph JA , Perry G ((2000) ) Arson. Tracking the culprit in Alzheimer’s disease. Ann N Y Acad Sci 924: , 35–38. |
[62] | Cavaleri F ((2015) ) Paradigm shift redefining molecular, metabolic and structural events in Alzheimer’s disease involves a proposed contribution by transition metals. Defined lengthy preclinical stage provides new hope to circumvent advancement of disease- and age-related neurodegeneration. Med Hypotheses 84: , 460–469. |
[63] | Lam PK , Kritz-Silverstein D , Barrett Connor E , Milne D , Nielsen F , Gamst A , Morton D , Wingard D ((2008) ) Plasma trace elements and cognitive function in older men and women: The Rancho Bernardo study. J Nutr Health Aging 12: , 22–27. |
[64] | Morris MC , Evans DA , Tangney CC , Bienias JL , Schneider JA , Wilson RS , Scherr PA ((2006) ) Dietary copper and high saturated and trans fat intakes associated with cognitive decline. Arch Neurol 63: , 1085–1088. |
[65] | Mursu J , Robien K , Harnack LJ , Park K , Jacobs DR Jr ((2011) ) Dietary supplements and mortality rate in older women: The Iowa Women’s Health Study. Arch Intern Med 171: , 1625–1633. |
[66] | Shen XL , Yu JH , Zhang DF , Xie JX , Jiang H ((2014) ) Positive relationship between mortality from Alzheimer’s disease and soil metal concentration in mainland china. J Alzheimers Dis 42: , 893–900. |
[67] | Zhou G , Ji X , Cui N , Cao S , Liu C , Liu J ((2015) ) Association between serum copper status and working memory in schoolchildren. Nutrients 7: , 7185–7196. |
[68] | Schrag M , Mueller C , Oyoyo U , Smith MA , Kirsch WM ((2011) ) Iron, zinc and copper in the Alzheimer’s disease brain: A quantitative meta-analysis. Some insight on the influence of citation bias on scientific oinion. Prog Neurobiol 94: , 296–306 . |
[69] | Wang ZX , Tan L , Wang HF , Ma J , Liu J , Tan MS , Sun JH , Zhu XC , Jiang T , Yu JT ((2015) ) Serum iron, zinc, and copper levels in patients with Alzheimer’s disease: A replication study and meta-analyses. J Alzheimers Dis 47: , 565–581. |
[70] | Pal A , Siotto M , Prasad R , Squitti R ((2015) ) Towards a unified vision of copper involvement in Alzheimer’s disease: A review connecting basic, experimental, and clinical research. J Alzheimers Dis 44: , 343–354. |
[71] | Xu J , Begley P , Church SJ , Patassini S , McHarg S , Kureishy N , Hollywood KA , Waldvogel HJ , Liu H , Zhang S , Lin W , Herholz K , Turner C , Synek BJ , Curtis MA , Rivers-Auty J , Lawrence CB , Kellett KA , Hooper NM , Vardy ER , Wu D , Unwin RD , Faull RL , Dowsey AW , Cooper GJ ((2016) ) Elevation of brain glucose and polyol-pathway intermediates with accompanying brain-copper deficiency in patients with Alzheimer’s disease: Metabolic basis for dementia. Sci Rep 6: , 27524. |
[72] | Puqazhenthi S , Qin L , Reddy PH ((2016) ) Common neurodegenerative pathways in obesity, diabetes, and Alzheimer’s disease. Biochim Biophys Acta. pii: S0925-4439(16)30097-7, doi: 10.1016/j.bbadis.2016.04.017 |
[73] | Barnard ND , Bush AI , Ceccarelli A , Cooper J , de Jager CA , Erickson KI , Fraser G , Kesler S , Levin SM , Lucey B , Morris MC , Squitti R ((2014) ) Dietary and lifestyle guidelines for the prevention of Alzheimer’s disease. Neurobiol Aging 35: (Suppl 2), S74–S78. |
Figures and Tables
Fig.1
Non-Cp Cu levels in Control, T1D, and T2D subjects. Scatter plots show the mean and SD of each group. p values determined by ANOVA.
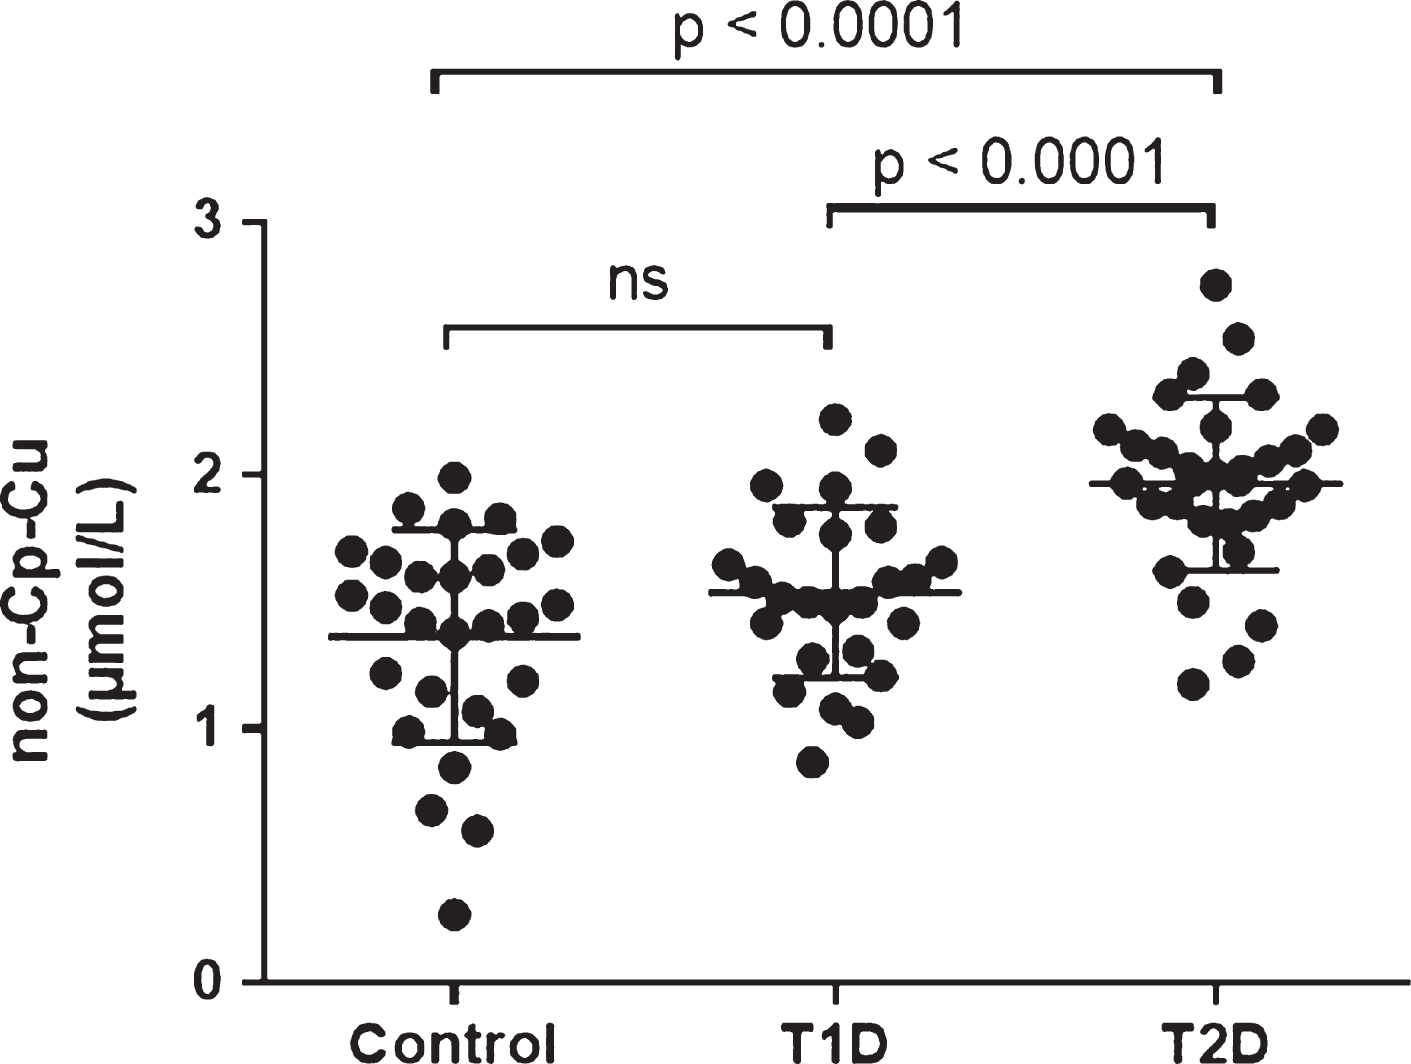
Fig.2
(Lack of) Correlation between non-Cp Cu and age. The Pearson correlation (r) were –0.280, 0.191, and –0.026 for Control, T1D and T2D subjects, respectively (all p > 0.1).
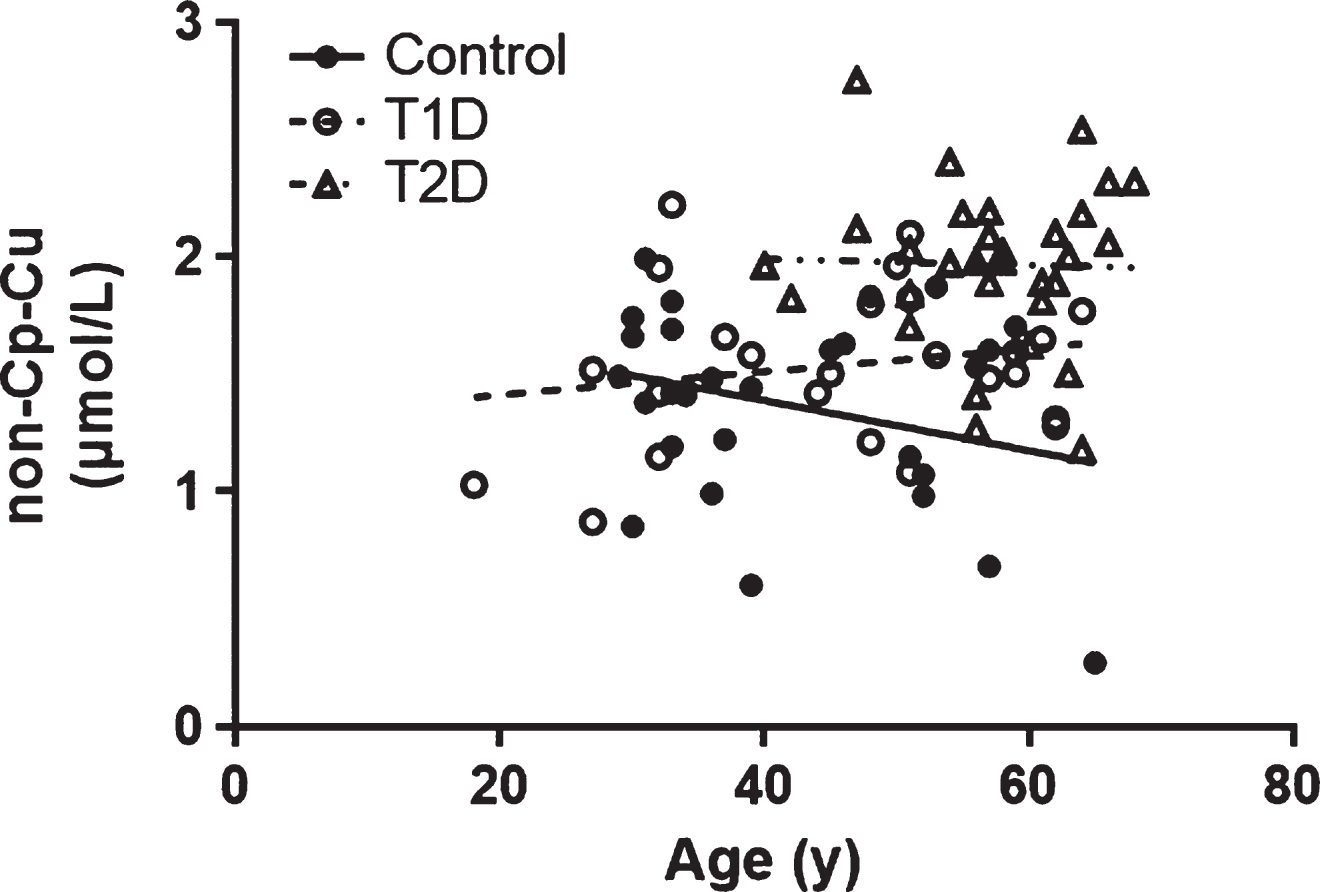
Fig.3
(Lack of) Correlation between non-Cp Cu and BMI. The Pearson correlation (r) were –0.112, 0.150, and –0.022 for Control, T1D, and T2D subjects, respectively (all p > 0.1).
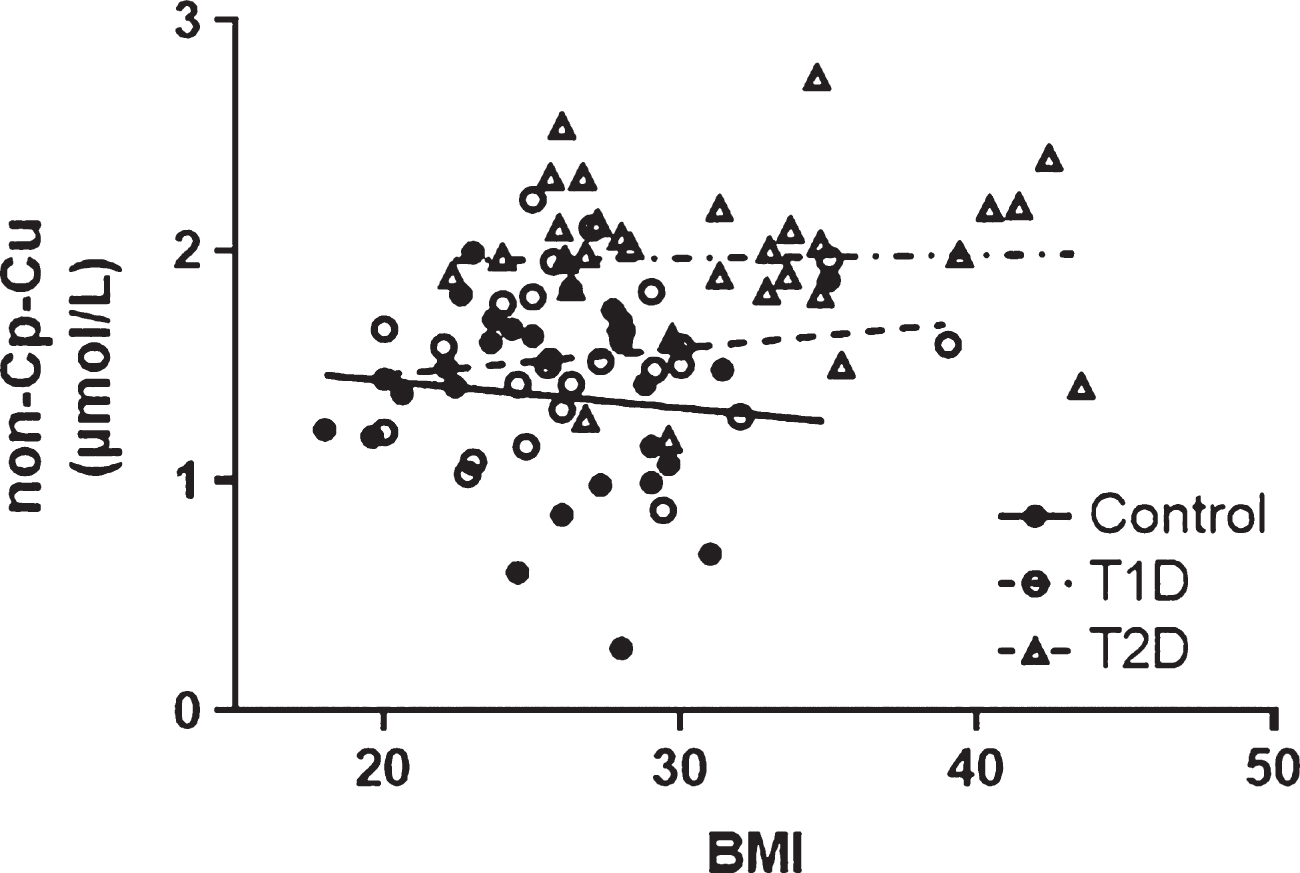
Fig.4
Comparison of non-Cp-Cu levels in Control, and T2D subjects to AD subjects. Scatter plots show the mean and SD of each group. p values determined by ANOVA.
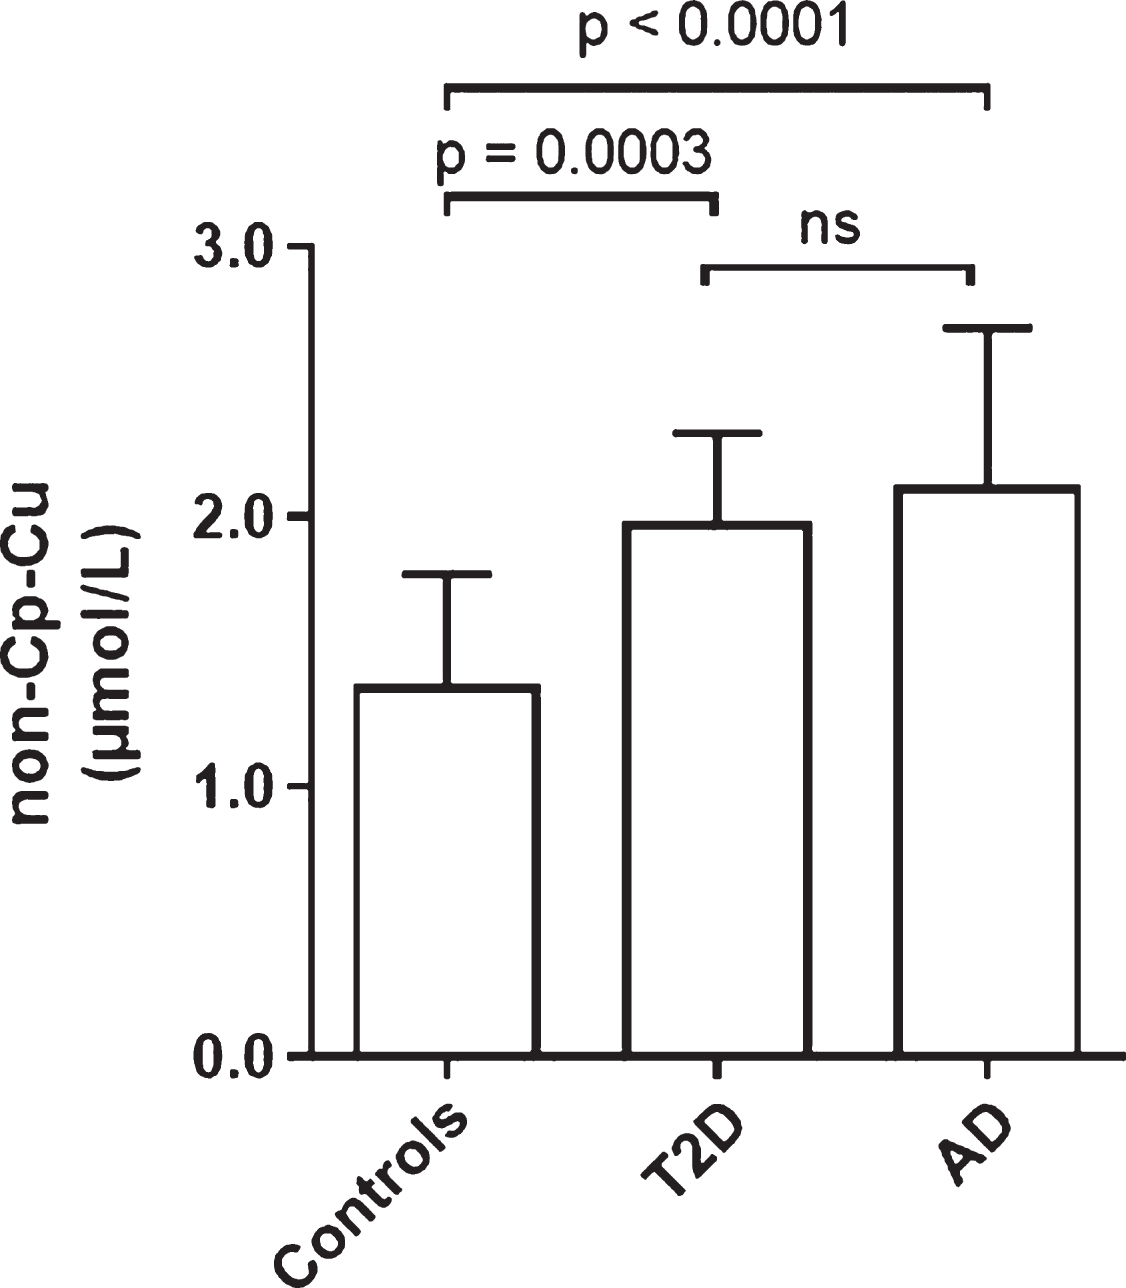
Fig.5
Comparison of non-Cp Cu levels as revealed through the direct method and the indirect non-Cp Cu Walshe’s index in samples from 147 healthy subjects and 89 AD patients.
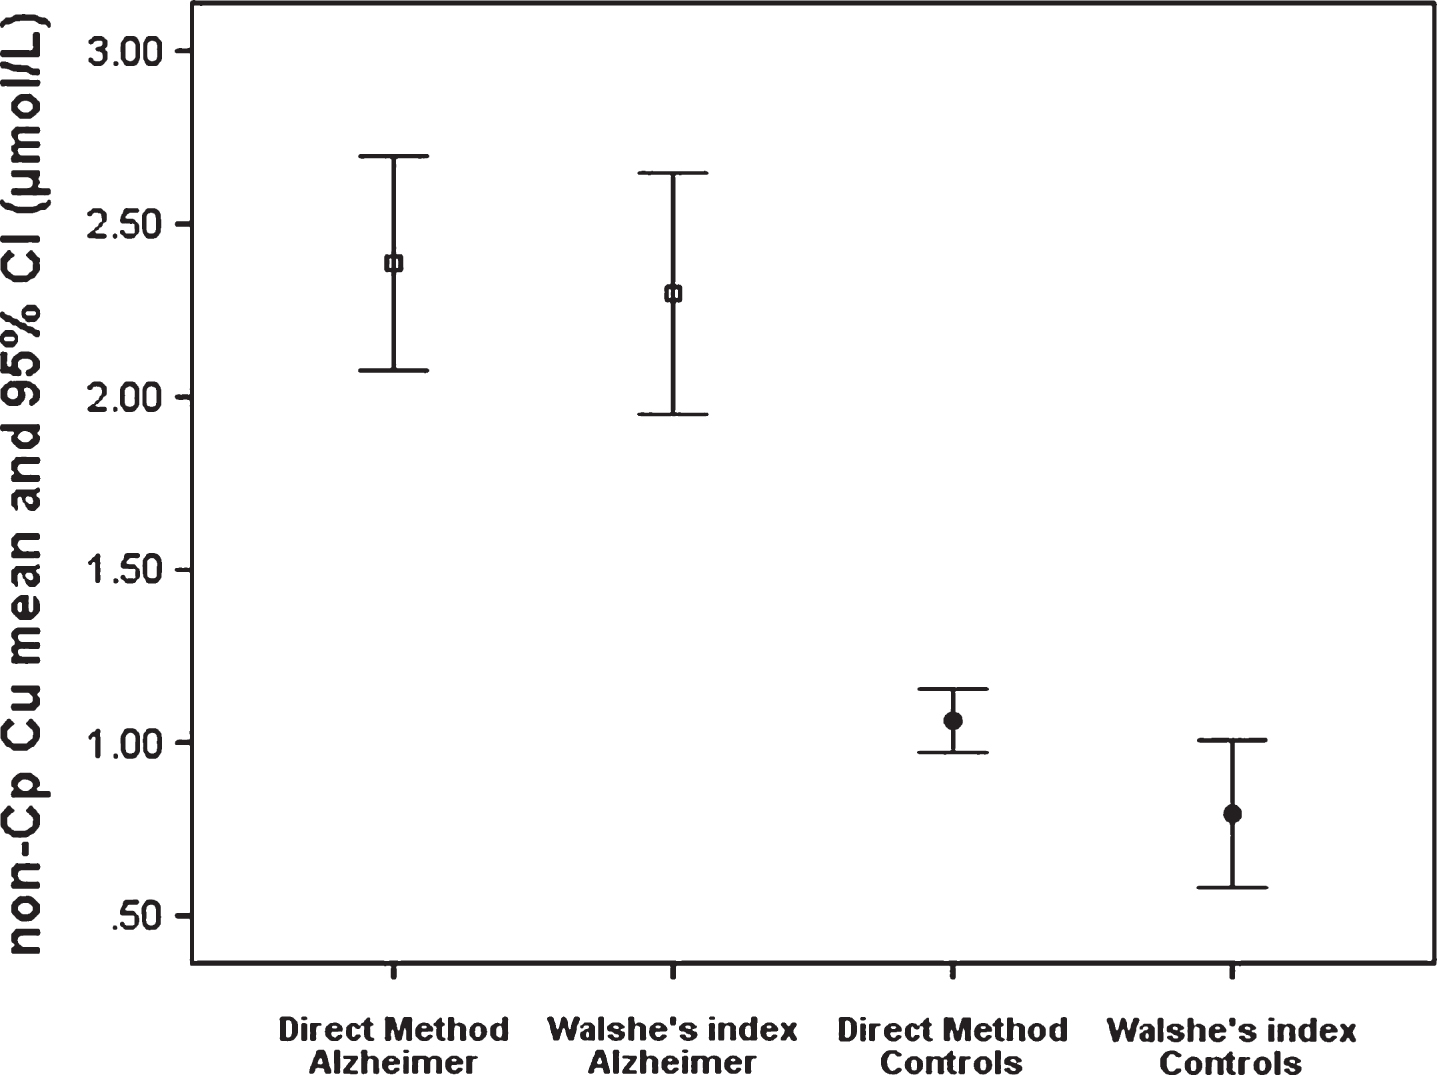
Table 1
Characteristics of study subjects
| Control | T1D | T2D | |
| n | 28 | 25 | 31 |
| Sex (M/F) | 14/14 | 12/13 | 10/21 |
| Ethnicity (NHW/ | 8/19/1 | 11/10/4 | 5/23/3 |
| HIS/BLA) | |||
| Age (y) | 42.0 ± 11.0 | 45.7 ± 13.0 | 57.1 ± 6.9* |
| Statin Use | 11% | 36% | 100% |
| BMI (kg/m2) | 25.7 ± 4.0 | 26.8 ± 4.4 | 31.3 ± 5.7* |
| HbA1c (%) | – | 8.2 ± 1.5 | 7.5 ± 1.3 |
| CRP (mg/L) | 1.8 ± 1.6 | 3.0 ± 2.6 | 3.0 ± 2.4 |
| Cholesterol | 206.8 ± 37.5 | 166.1 ± 25.6*** | 183.9 ± 36.6*** |
| (mg/dL) | |||
| Triglyceride | 131.5 ± 88.8 | 64.8 ± 24.6** | 156.1 ± 78.0 |
| (mg/dL) |
Data are expressed as the mean ± SD. CRP and Triglycerides log transformed for statistical analysis. *T2D significantly different from Control and T1D, p < 0.002 by ANOVA. **T1D significantly different from Controls (p < 0.001) and T2D (p < 0.05) by ANOVA. ***T1D and T2D significantly different from Controls (p < 0.05) by ANOVA. In bold are reported the significant results.
Table 2
Multinomial logistic regression results
| RRR | 95% CI | p | |
| T1D | |||
| Sex, F versus M | 0.76 | 0.24–2.47 | 0.653 |
| Standardized non-Cp Cu, | 1.67 | 0.89–3.14 | 0.109 |
| standard deviation unit | |||
| BMI, kg/m2 | 1.04 | 0.89–1.21 | 0.593 |
| Age, years | 1.03 | 0.87–1.08 | 0.317 |
| T2D | |||
| Sex, F versus M | 0.66 | 0.13–3.41 | 0.618 |
| Standardized non-Cp Cu, | 9.64 | 2.86–32.47 | < 0.001 |
| standard deviation unit | |||
| BMI, kg/m2 | 1.18 | 0.98–1.41 | 0.076 |
| Age, years | 1.17 | 1.06–1.29 | 0.002 |
| CONTROL BASE CATEGORY |
In bold are reported the significant results.


