
Decreased Expression of hsa-miR-4274 in Cerebrospinal Fluid of Normal Pressure Hydrocephalus Mimics with Parkinsonian Syndromes
Abstract
Background: Patients presenting with the classical idiopathic normal pressure hydrocephalus (iNPH) triad often show additional parkinsonian spectrum signs. Accurate differential diagnosis strongly influences the long-term outcome of cerebrospinal fluid (CSF) shunting.
Objective: The aim of this study was to find potential CSF microRNA (miRNA) biomarkers for NPH mimics with parkinsonian syndromes that can reliably distinguish them from iNPH patients.
Methods: Two cohorts of 81 patients (cohort 1, n = 55; cohort 2, n = 26) with possible iNPH who were treated in two centers between January 2011 and May 2014 were studied. In both cohorts, CSF samples were obtained from patients clinically diagnosed with iNPH (n = 21 and n = 10, respectively), possible iNPH with parkinsonian spectrum (PS) (n = 18, n = 10, respectively), possible iNPH with Alzheimer’s disease (AD) (n = 16), and non-affected elderly individuals (NC) (n = 6). A three-step qRT-PCR analysis of the CSF samples was performed to detect miRNAs that were differentially expressed in the groups.
Results: The expression of hsa-miR-4274 in CSF was decreased in both cohorts of PS group patients (cohort 1: p < 0.0001, cohort 2: p < 0.0001), and was able to distinguish PS from iNPH with high accuracy (area under the curve = 0.908). The CSF concentration of hsa-miR-4274 also correlated with the specific binding ratio of ioflupane (123I) dopamine transporter scan (r = –0.494, p = 0.044). By contrast, the level of hsa-miR-4274 was significantly increased in the PS group after CSF diversion.
Conclusion: Levels of CSF hsa-miR-4274 can differentiate PS from patients with iNPH, AD, and NC. This may be clinically useful for diagnostic purposes and predicting shunt treatment responses.
INTRODUCTION
Idiopathic normal pressure hydrocephalus (iNPH) is a chronic neurological disorder primarily affecting the elderly population, and usually presenting with Hakim’s triad of symptoms (dementia, urinary incontinence, and gait imbalance) [1, 2]. If not treated promptly, iNPH can cause significant disability [3, 4]. However, even after timely and careful diagnosis according to these criteria, the success of treatment is difficult to predict [5]. Indeed, the clinical picture of iNPH often overlaps with the symptoms of other neurodegenerative diseases, including dementias such as Alzheimer’s disease (AD) and dementia with Lewy bodies, or extrapyramidal spectrum disorders including Parkinson’s disease (PD), progressive supranuclear palsy (PSP), and corticobasal syndrome [1, 6]. This is not unexpected given that iNPH is also considered a neurodegenerative disorder [6–8], and that symptoms of different neurodegenerative diseases often coexist. Indeed, these problems can make precise diagnosis impossible before death and postmortem analysis. Even then, a coexistence of multiple types of pathological processes can be found in the brain [6–13]. Thus, identification of specific biomarkers is important to improve accurate diagnosis and for use of most appropriate treatmentstrategies.
Protein biomarkers for AD, such as amyloid-β (Aβ), total tau, and phosphorylated tau (p-tau), are already clinically established [14–16]. Similar proteins have also been investigated in a number of studies of on iNPH patients, albeit with mixed results [17–20]. MicroRNAs (miRNAs) are small, non-coding RNA molecules that consist of approximately 19–25 nucleotides. miRNAs act epigenetically through posttranscriptional control of gene expression, mainly by regulating stability and translation of messenger RNA [21, 22]. In the last decade, there has been an increasing interest in the use of miRNAs as biomarkers in different neurodegenerative diseases, including AD, PD, and other pathological conditions, although findings are often conflicting [23–28].
To our knowledge, the potential role of miRNAs in the diagnosis of NPH mimics combined with parkinsonian spectrum has not been reported. Thus, the aim of this study was to characterize the differential expression of microRNAs in NPH mimics with parkinsonian spectrum versus iNPHpatients.
METHODS
Patients
Two cohorts of patients with possible iNPH were studied. The first cohort involved 55 patients with possible iNPH treated in Juntendo University Hospital, and the second cohort involved 26 patients treated in Takasaki General Medical Center, between January 2011 and May 2014. The first cohort was used for the screening of miRNAs in the CSF. The second cohort was used for validation of selected miRNAs in the CSF.
The following criteria were used for possible iNPH diagnosis: age 60 years or older, with more than one symptom of the classical iNPH triad (gait disturbance, cognitive impairment, urinary incontinence), MRI findings of ventricular dilation with Evans index >0.3, clinical symptoms that cannot be explained by other underlying neurological or non-neurological diseases, and no obvious preceding diseases possibly explaining ventricular dilation such as subarachnoid hemorrhage, meningitis, head injury, congenital hydrocephalus, or aqueductal stenosis. Patients in the first cohort were divided into 3 groups. The first group consisted of 21 patients (5 women, 16 men; median age of 75 years) with definite iNPH according to the Japanese guidelines for iNPH [29]. The second group consisted of 18 patients (6 women, 12 men; median age of 74 years) with possible iNPH along with an abnormal cardiac scan according to metaiodobenzylguanidine (MIBG) scintigraphy, and/or ioflupane (123I) dopamine transporter scan (DaTScan) suggesting an extrapyramidal disease (PS group). The third group consisted of 16 patients (6 women, 10 men; median age of 81 years) with possible iNPH and additionally fulfilling National Institute of Neurological and Communicative Disorders and Stroke and the Alzheimer’s Disease and Related Disorders Association (NINCDS-ADRDA) criteria for AD [30], or having CSF protein biomarkers indicative of AD pathophysiology (AD group).
Patients in the second cohort were further divided into 3 groups. The first group consisted of 10 patients (3 women, 7 men; median age of 78 years) with iNPH. The second group consisted of 10 patients (5 women, 5 men; median age of 79 years) with PS. The normal control group (NC) had 6 non-affected patients (1 woman, 5 men; median age of 73 years). Scores on the iNPH Grading Scale (iNPHGS) [29, 31], Mini-Mental State Examination (MMSE)[32], Frontal Assessment Battery (FAB) [33], and modified Rankin Scale (mRS) [34] were collected. Based on MRI imaging, the Evans Index was calculated, and 2nd to 3rd degree white matter changes according to the Scale for Age-Related White Matter Changes (ARWMCRS) [35], together with presence of disproportionately enlarged subarachnoid space hydrocephalus (DESH), were estimated [4]. The demographics and scores of the patients of the 2 cohorts are shown in Tables 1 and 3,respectively.
In all patients, a CSF sample was obtained using a tap test at the initial evaluation. Based on the results, a lumboperitoneal shunt (LPS) was introduced in patients with probable iNPH. LPS was performed using adjustable valves with a small lumen catheter (Medtronic Neurosurgery, Goleta, CA, USA). Lumbar puncture was performed at the L3–L4 or L4–L5 interspace before LPS. CSF sampling prior to LPS was performed using an 18-gauge spinal needle. Re-evaluation and new CSF samples were obtained in patients at 1 year after LPS. To confirm that the shunt system was operating effectively, CSF was resampled through a puncture of the reservoir using a 27-gauge needle. No infections were reported following the tap-test or shunt valve puncture. All CSF samples were centrifuged to remove cells and debris, and then aliquoted and stored in polypropylene tubes at –80°C until biochemical analysis.
Ethics statement
All procedures were approved by the Juntendo University Hospital and Takasaki General Medical Center ethics committee. The patients and/or their relatives signed written informed consent to be a part of the investigation. Written informed consent was also obtained from patients and families prior to LPS placement for all patients who were positive for the tap test. The procedures were conducted according to the principles of the Declaration of Helsinki, and in accordance with international Good Laboratory Practice and Good Clinical Practice standards.
Immunochemistry
Measurements of soluble amyloid-β protein precursor α (sAβPPα), amyloid-β 1–42 (Aβ42), p-tau, and α-synuclein (α-syn) levels in the CSF were performed using commercial enzyme-linked immunosorbent assay kits (Human sAβPPα highly sensitive assay kit #27719, human α-syn assay kit #27740; IBL, Takasaki, Japan; Innotest Aβ42, phospho-tau-181p #81583; Fujirebio, Gent, Belgium), according to the manufacturer’s protocol.
RNA extraction and reverse transcription by qRT-PCR
Total RNA was obtained from 300 μl of CSF using the miRNeasy serum/plasma kit (Qiagen, Crawley, UK) following the manufacturer’s recommendations, and was spiked with miR-39 (C. Elegans miRNA cel-miR-39 oligonucleotide). The RT product (3 μl) was preamplified using a miScript PreAMP PCR kit (Qiagen). Preamplification products were analyzed by a 7500 Real-Time PCR System (Applied Biosystems, Thermo Fisher Scientific, Waltham, MA, USA) using SYBR Green Master Mix (Thermo Fisher Scientific). Relative miRNA expression levels between the groups were calculated using the 2(–ΔΔCt) method [36], with normalization of raw data to stable miRNAs levels (miR-3714, miR-659, miR-345). We set a quantification cycle (Cq) of 35 as a cut-off to define an miRNA aspositive.
The three-step analysis started with processing the CSF samples for 1008 candidate miRNAs using the Human miRNome miRNA PCR array (v16.0, 96-well/Rotor-Disc, R100, Format A; Qiagen) and qRT-PCR. An initial screening of 4 patients (2 pure iNPH, 1 PS, and 1 AD) showed dysregulation of 20 miRNAs, which were then further analyzed in steps 2 and 3. All qPCR experiments were designed and performed in compliance with the MIQE guidelines (Fig. 1). The target prediction for the tested miRNAs was performed using Ingenuity Pathway Analysis (IPA) software (Qiagen).
Statistical analysis
Statistical analysis was performed with statistical software (SPSS v.18 for Windows; SPSS, Cary, NC, USA). One-way analysis of variance (ANOVA) and Dunnett’s C post-hoc analysis were used for multiple comparisons between the three groups for numerical data, while a chi-squared test with Bonferroni’s correction was used for multiple comparisons for nominal data. Wilcoxon signed-rank test was used for in-group comparisons. Receiver operating characteristic (ROC) analysis was performed, and the area under (AUC) the curve calculated, for comparing miRNA levels between the groups. Correlations between biomarkers were obtained by Spearman’s rank correlation. In all cases, p < 0.05 was considered statistically significant.
RESULTS
Clinical evaluation and CSF protein biomarker analysis
Demographic data of the first cohort, including Evans index, DESH percentage, the percentage of positive tap tests, the percentage of CSF shunt surgeries performed, and the scores of the mRS, iNPHGS, MMSE, FAB, and ARWMCRS, are shown in Table 1. There was a significant difference in the percentage of positive tap tests and neuroradiological findings of DESH in the iNPH group compared with the other groups. Based on these results, 21 patients from iNPH group and 13 patients from PS group underwent subsequent shunting procedures. The results of protein biomarker testing from CSF samples of all groups of patients before shunting are shown in Table 2. Levels of sAβPPα and p-tau were significantly different between iNPH and AD patients, and between PS and AD patients. sAβPPα and p-tau concentrations were significantly higher in patients with concomitant AD pathology compared with the other groups. Aβ42 concentrations were significantly lower in the PS and AD groups compared with the iNPH group. The α-syn concentration was significantly lower in the PS group compared with the AD group.
CSF microRNA analysis
The first step of the CSF microRNA analysis provided 106 microRNAs with significant value out of the 1008 miRNAs initially screened by miRNA PCR array. Out of these 106 miRNAs, we selected the top 20 miRNAs that showed higher levels of expression in patients with iNPH, than in patients with PS or AD, with a cut-off cycle of 30 or less. We proceeded to secondary qPCR screening of those 20 microRNAs, which revealed a significant decrease of nine promising candidate microRNAs (Fig. 1). These nine miRNAs were further tested in 55 patients divided into three groups. The nine tested microRNAs, their genetic sequences, and –ΔΔCt values expressed as a median with interquartile range are shown in Supplementary Tables 1 and 2. qPCR analysis showed that all nine tested miRNAs were significantly dysregulated in the PS group compared with the iNPH and AD groups, and two miRNAs showed excellent results: miR-4274 (p < 0.0001) and miR-1280 (p < 0.0001). These findings were then confirmed in a second independent cohort of 10 patients with PS, 10 iNPH subjects, and 6 NC subjects (Table 3). Only hsa-miR-4274 was significantly decreased in the PS group compared with the iNPH and NC groups (Fig. 2). As our focus was to find new biomarkers to help in differentiate PS from iNPH, we performed a ROC analysis to evaluate the diagnostic potential of the examined miRNAs, and to test their sensitivity and specificity (Supplementary Table 3). hsa-miR-4274 showed the greatest diagnostic potential (AUC = 0.908; p < 0.0001), with a high sensitivity and specificity (Fig. 2).
Correlation between hsa-miR 4274 expression and specific binding ratio of DaTScan
Next, we calculated the correlation of tested miRNAs with the specific binding ratio (SBR) of the DaTScan, noting that 123I-ioflupane binds the dopamine transporter in the nigrostriatal dopaminergic neurons. hsa-miR-4274 showed the best correlation, with a lower hsa-miR-4274 level associated with a lower SBR (r = –0.494, p = 0.044; Fig. 2).
Post-shunting analysis
Additional CSF sampling was subsequently performed in 21 patients in the iNPH group and 13 patients with the PS group at 1 year after shunting. Protein biomarker analysis was repeated, and a complete re-evaluation of the clinical state was performed using MMSE, FAB, mRS, and iNPHGS (Table 4). All the re-evaluated data in the iNPH group were significantly different from initial evaluation scores. Although the clinical state of patients in the PS group did not improve at 1 year after CSF diversion, the concentrations of all three tested protein biomarkers in both groups were significantly increased. Next, we analyzed hsa-miR-4274 levels in CSF samples obtained from both groups. The level of hsa-miR-4274 was significantly lower in the PS group compared with the iNPH group before shunting. Additionally, the concentration of hsa-miR-4274 was significantly increased in the PS group 1 year after CSF diversion (p = 0.028), while there was no significant change in the iNPH group (p = 0.476; Table 4).
DISCUSSION
The target prediction for the nine miRNAs was performed using IPA software (Qiagen). IPA analysis found no information on the target prediction for hsa-miR-1280. In support, hsa-miR-1280 was recently suggested to be part of transfer RNA, rather than a classic microRNA [37]. IPA analysis also found no target genes for miR-3675. However, the remaining miRNAs provided numerous target genes involved in various pathways, including neurogenesis and neurodegeneration, such as dopaminergic, glutamatergic, amyloid, apoptotic, and axonal guidance signaling (Supplementary Table 4). hsa-miR-4274 was the most promising biomarker in our study, and IPA analysis showed that SAC18A2 (VMAT2; the vesicular monoamine transporter 2) was a target gene, with a connection between hsa-miR-4274 and dopamine receptor signaling. The exocytotic release of neurotransmitters requires active transport into synaptic vesicles and other types of secretory vesicles. SLC18A2 performs this function for monoamines such as dopamine and serotonin [38]. As hsa-miR-4274 levels were decreased in patients in the PS group, and were correlated to SBR of DaTScan, this may relate to impairment of the dopaminergic signaling pathway.
We also found an increase in a number of protein biomarkers at 1 year after shunting. As previously reported, this may be a consequence of an increase in extracellular space after shunting, which leads to better clearance of substances from the interstitial fluid to the CSF, or because of increased brain metabolism in the periventricular zone, as seen in PET and MRI studies [39, 40]. However, hsa-miR-4274 levels in iNPH were not changed after CSF diversion, suggesting that hsa-miR-4274 was not affected by hydrocephalus.
The generalization of our findings are limited because of the small number of patients and the absence of pathological confirmation. Further studies are required in a larger patient cohort to confirm the differential expression of hsa-miR-4274 in PS and iNPH patients, and to verify the relationship between hsa-miR-4274 and the responses of the patients to shunting. Nevertheless, as hsa-miR-4274 is relatively abundant and stable in the CSF, it may be a useful biomarker for differential diagnosis of iNPH, as well as for Parkinson’s syndrome.
In conclusion, hsa-miR-4274 is a potential CSF biomarker for differentiating PS from iNPH patients. hsa-miR-4274 may be useful for diagnostic purposes, as well as for predicting shunt treatmentresponses.
ACKNOWLEDGMENTS
We thank the patients for their participation.
This research was supported by JSPS KAKENHI Grant Number JP B#26293326.
Authors’ disclosures available online (http://j-alz.com/manuscript-disclosures/16-0848r1).
Appendices
The supplementary material is available in the electronic version of this article: http://dx.doi.org/10.3233/JAD-160848.
REFERENCES
[1] | Ghosh S , Lippa C ((2014) ) Diagnosis and prognosis in idiopathic normal pressure hydrocephalus. Am J Alzheimers Dis Other Demen 29: , 583–589. |
[2] | Wallenstein MB , McKhann GM 2nd ((2010) ) Salomón Hakim and the discovery of normal-pressure hydrocephalus. Neurosurgery 67: , 155–159. |
[3] | Andrén K , Wikkelsø C , Tisell M , Hellström P ((2014) ) Natural course of idiopathic normal pressure hydrocephalus. J Neurol Neurosurg Psychiatry 85: , 806–810. |
[4] | Kazui H , Miyajima M , Mori E , Ishikawa M ; SINPHONI-2 Investigators ((2015) ) Lumboperitoneal shunt surgery for idiopathic normal pressure hydrocephalus (SINPHONI-2): An open-label randomised trial. Lancet Neurol 14: , 585–594. |
[5] | Klassen BT , Ahlskog JE ((2011) ) Normal pressure hydrocephalus: How often does the diagnosis hold water? Neurology 77: , 1119–1125. |
[6] | Starr BW , Hagen MC , Espay AJ ((2014) ) Hydrocephalic Parkinsonism: Lessons from normal pressure hydrocephalus mimics. J Clin Mov Disord 1: , 2. |
[7] | Armstrong RA , Lantos PL , Cairns NJ ((2005) ) Overlap between neurodegenerative disorders. Neuropathology 25: , 111–124. |
[8] | Armstrong RA ((2012) ) On the ‘classification’ of neurodegenerative disorders: Discrete entities, overlap or continuum? Folia Neuropathol 50: , 201–208. |
[9] | Elobeid A , Laurell K , Cesarini KG , Alafuzoff I ((2015) ) Correlations between mini-mental state examination score, cerebrospinal fluid biomarkers, and pathology observed in brain biopsies of patients with normal-pressure hydrocephalus. J Neuropathol Exp Neurol 74: , 470–479. |
[10] | Leinonen V , Koivisto AM , Alafuzoff I , Pyykkö OT , Rummukainen J , von Und Zu Fraunberg M , Jääskeläinen JE , Soininen H , Rinne J , Savolainen S ((2012) ) Cortical brain biopsy in long-term prognostication of 468 patients with possible normal pressure hydrocephalus. Neurodegener Dis 10: , 166–169. |
[11] | Leinonen V , Koivisto AM , Savolainen S , Rummukainen J , Sutela A , Vanninen R , Jääskeläinen JE , Soininen H , Alafuzoff I ((2012) ) Post-mortem findings in 10 patients with presumed normal-pressure hydrocephalus and review of the literature. Neuropathol Appl Neurobiol 38: , 72–86. |
[12] | Lill CM , Bertram L ((2011) ) Towards unveiling the genetics of neurodegenerative diseases. Semin Neurol 31: , 531–541. |
[13] | Magdalinou NK , Ling H , Smith JD , Schott JM , Watkins LD , Lees AJ ((2013) ) Normal pressure hydrocephalus or progressive supranuclear palsy? A clinicopathological case series. J Neurol 260: , 1009–1013. |
[14] | Blennow K , Mattsson N , Schöll M , Hansson O , Zetterberg H ((2015) ) Amyloid biomarkers in Alzheimer’s disease. Trends Pharmacol Sci 36: , 297–309. |
[15] | Kanai M , Matsubara E , Isoe K , Urakami K , Nakashima K , Arai H , Sasaki H , Abe K , Iwatsubo T , Kosaka T , Watanabe M , Tomidokoro Y , Shizuka M , Mizushima K , Nakamura T , Igeta Y , Ikeda Y , Amari M , Kawarabayashi T , Ishiguro K , Harigaya Y , Wakabayashi K , Okamoto K , Hirai S , Shoji M ((1998) ) Longitudinal study of cerebrospinal fluid levels of tau, A beta-40, and A beta-42(43) in Alzheimer’s disease: A study in Japan. Ann Neurol 44: , 17–26. |
[16] | Zetterberg H ((2015) ) Cerebrospinal fluid biomarkers for Alzheimer’s disease: Current limitations and recent developments. Curr Opin Psychiatry 28: , 402–409. |
[17] | Miyajima M , Nakajima M , Ogino I , Miyata H , Motoi Y , Arai H ((2013) ) Soluble amyloid precursor protein α in the cerebrospinal fluid as a diagnostic and prognostic biomarker for idiopathic normal pressure hydrocephalus. Eur J Neurol 20: , 236–242. |
[18] | Herukka SK , Rummukainen J , Ihalainen J , von Und Zu Fraunberg M , Koivisto AM , Nerg O , Puli LK , Seppälä TT , Zetterberg H , Pyykkö OT , Helisalmi S , Tanila H , Alafuzoff I , Hiltunen M , Rinne J , Soininen H , Jääskeläinen JE , Leinonen V ((2015) ) Amyloid-β and tau dynamics in human brain interstitial fluid in patients with suspected normal pressure hydrocephalus. J Alzheimers Dis 46: , 261–269. |
[19] | Jingami N , Asada-Utsugi M , Uemura K , Noto R , Takahashi M , Ozaki A , Kihara T , Kageyama T , Takahashi R , Shimohama S , Kinoshita A ((2015) ) Idiopathic normal pressure hydrocephalus has a different cerebrospinal fluid biomarker profile from Alzheimer’s disease. J Alzheimers Dis 45: , 109–115. |
[20] | Kapaki EN , Paraskevas GP , Tzerakis NG , Sfagos C , Seretis A , Kararizou E , Vassilopoulos D ((2007) ) Cerebrospinal fluid tau, phospho-tau181 and beta-amyloid1-42 in idiopathic normal pressure hydrocephalus: A discrimination from Alzheimer’s disease. Eur J Neurol 14: , 168–173. |
[21] | Grinchuk OV , Jenjaroenpun P , Orlov YL , Zhou J , Kuznetsov VA ((2010) ) Integrative analysis of the human cis-antisense gene pairs, miRNAs and their transcription regulation patterns. Nucleic Acids Res 38: , 534–547. |
[22] | Kim VN ((2005) ) Small RNAs: Classification, biogenesis, and function. Mol Cells 19: , 1–15. |
[23] | Backes C , Haas J , Leidinger P , Frese K , Großmann T , Ruprecht K , Meder B , Meese E , Keller A ((2015) ) miFRame: Analysis and visualization of miRNA sequencing data in neurological disorders. J Transl Med 13: , 224. |
[24] | Danborg PB , Simonsen AH , Waldemar G , Heegaard NHH ((2014) ) The potential of microRNAs as biofluid markers of neurodegenerative diseases-a systematic review. Biomarkers 19: , 259–268. |
[25] | Gaughwin PM , Ciesla M , Lahiri N , Tabrizi SJ , Brundin P , Bjorkqvist M ((2011) ) Hsa-miR-34b is a plasma-stable microRNA that is elevated in pre-manifest Huntington’s disease. Hum Mol Genet 20: , 2225–2237. |
[26] | Grasso M , Piscopo MP , Confaloni A , Denti MA ((2014) ) Circulating miRNAs as biomarkers for neurodegenerative disorders. Molecules 19: , 6891–6910. |
[27] | Margis R , Margis R , Rieder CR ((2011) ) Identification of blood microRNAs associated to Parkinson’s disease. J Biotechnol 152: , 96–101. |
[28] | Van Giau V , An SSA ((2016) ) Emergence of exosomal miRNAs as a diagnostic biomarker for Alzheimer’s disease. J Neurol Sci 360: , 141–152. |
[29] | Mori E , Ishikawa M , Kato T , Kazui H , Miyake H , Miyajima M , Nakajima M , Hashimoto M , Kuriyama N , Tokuda T , Ishii K , Kaijima M , Hirata Y , Saito M , Arai H ((2012) ) Guidelines for management of idiopathic normal pressure hydrocephalus: Second edition. Japanese Society of Normal Pressure Hydrocephalus. Neurol Med Chir (Tokyo) 52: , 775–809. |
[30] | Dubois B , Feldman HH , Jacova C , Dekosky ST , Barberger-Gateau P , Cummings J , Delacourte A , Galasko D , Gauthier S , Jicha G , Meguro K , O’brien J , Pasquier F , Robert P , Rossor M , Salloway S , Stern Y , Visser PJ , Scheltens P ((2007) ) Research criteria for the diagnosis of Alzheimer’s disease: Revising the NINCDS-ADRDA criteria. Lancet Neurol 6: , 734–746. |
[31] | Akiguchi I , Ishii M , Watanabe Y , Watanabe T , Kawasaki T , Yagi H , Shiino A , Shirakashi Y , Kawamoto Y ((2008) ) Shunt-responsive parkinsonism and reversible white matter lesions in patients with idiopathic NPH. J Neurol 255: , 1392–1399. |
[32] | Tombaugh TN , McIntyre NJ ((1992) ) The mini-mental state examination: A comprehensive review. J Am Geriatr Soc 40: , 922–935. |
[33] | Dubois B , Slachevsky A , Litvan I , Pillon B ((2000) ) The FAB: A frontal assessment battery at bedside. Neurology 55: , 1621–1626. |
[34] | Banks JL , Marotta CA ((2007) ) Outcomes validity and reliability of the modified Rankin scale: Implications for stroke clinical trials: A literature review and synthesis. Stroke 38: , 1091–1096. |
[35] | Wahlund LO , Barkhof F , Fazekas F , Bronge L , Augustin M , Sjögren M , Wallin A , Ader H , Leys D , Pantoni L , Pasquier F , Erkinjuntti T , Scheltens P ((2001) ) European Task Force on Age-Related White Matter Changes. A new rating scale for age-related white matter changes applicable to MRI and CT. Stroke 32: , 1318–1322. |
[36] | Livak KJ , Schmittgen TD ((2001) ) Analysis of relative gene expression data using real-time quantitative PCR and the2(-Delta Delta C(T)) Method. Methods 25: , 402–408. |
[37] | Schopman NC , Heynen S , Haasnoot J , Berkhout B ((2010) ) A miRNA-tRNA mix-up: tRNA origin of proposed miRNA. RNA Biol 7: , 573–576. |
[38] | Lawal HO , Krantz DE ((2013) ) SLC18: Vesicular neurotransmitter transporters for monoamines and acetylcholine. Mol Aspects Med 34: , 360–372. |
[39] | Graff-Radford NR ((2014) ) Alzheimer CSF biomarkers may be misleading in normal-pressure hydrocephalus. Neurology 83: , 1573–1575. |
[40] | Jeppsson A , Zetterberg H , Blennow K , Wikkelsø C ((2013) ) Idiopathic normal-pressure hydrocephalus: Pathophysiology and diagnosis by CSF biomarkers. Neurology 80: , 1385–1392. |
Figures and Tables
Fig.1
Study flow chart. iNPH, idiopathic normal pressure hydrocephalus; PS, possible iNPH with parkinsonian spectrum; AD, possible iNPH with Alzheimer’s disease; NC, non-affected elderly individuals.
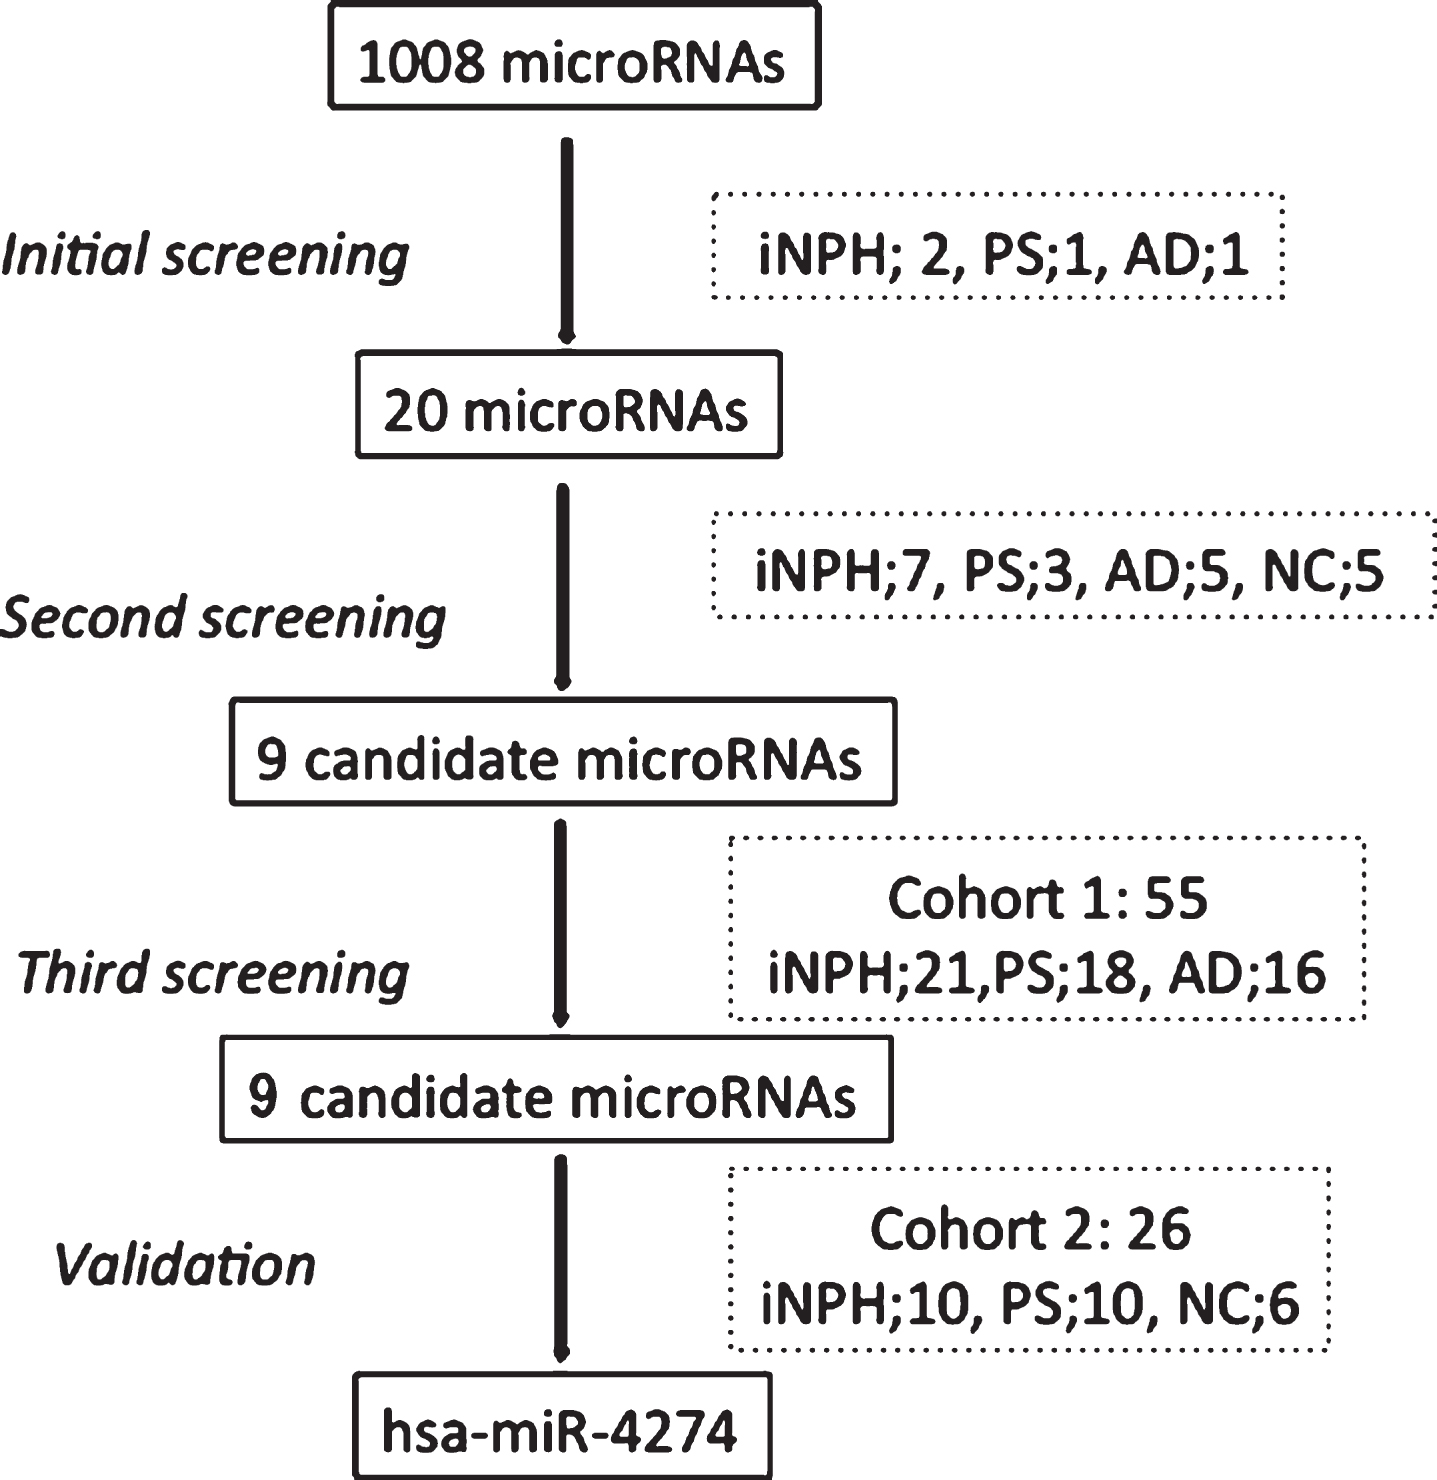
Fig.2
Graphical analysis comparing candidate miRNAs. A) Comparison of hsa-miR-4274 –ΔΔCt values between the various groups in the 2 individual cohorts. Box and whisker plot of hsa-miR-4274 expression in CSF samples of definite iNPH (NPH), possible iNPH with parkinsonian spectrum (PS), possible iNPH with Alzheimer’s disease (AD), and non-affected elderly individuals (NC). y-axis: –ΔΔCt values; x-axis: studied groups. Boxes: interquartile range, central line is the median. Whiskers: upper and lower adjacent values. Dots: outlier values. B) Receiver operating characteristic (ROC) analysis of the hsa-miR-4274 in iNPH group compared with the PS group. x-axis shows specificity values. y-axis shows sensitivity values. C) The correlation of hsa-miR-4274 expression with the specific binding ratio (SBR) of the dopamine transporter scan (DaTScan). hsa-miR-4274 –ΔΔCt values are plotted against SBR. iNPH patients (blue circles). PS patients (green triangles). hsa-miR-4274 levels are correlated with SBR (r = –0.493, p = 0.044; Spearman’s correlation.)
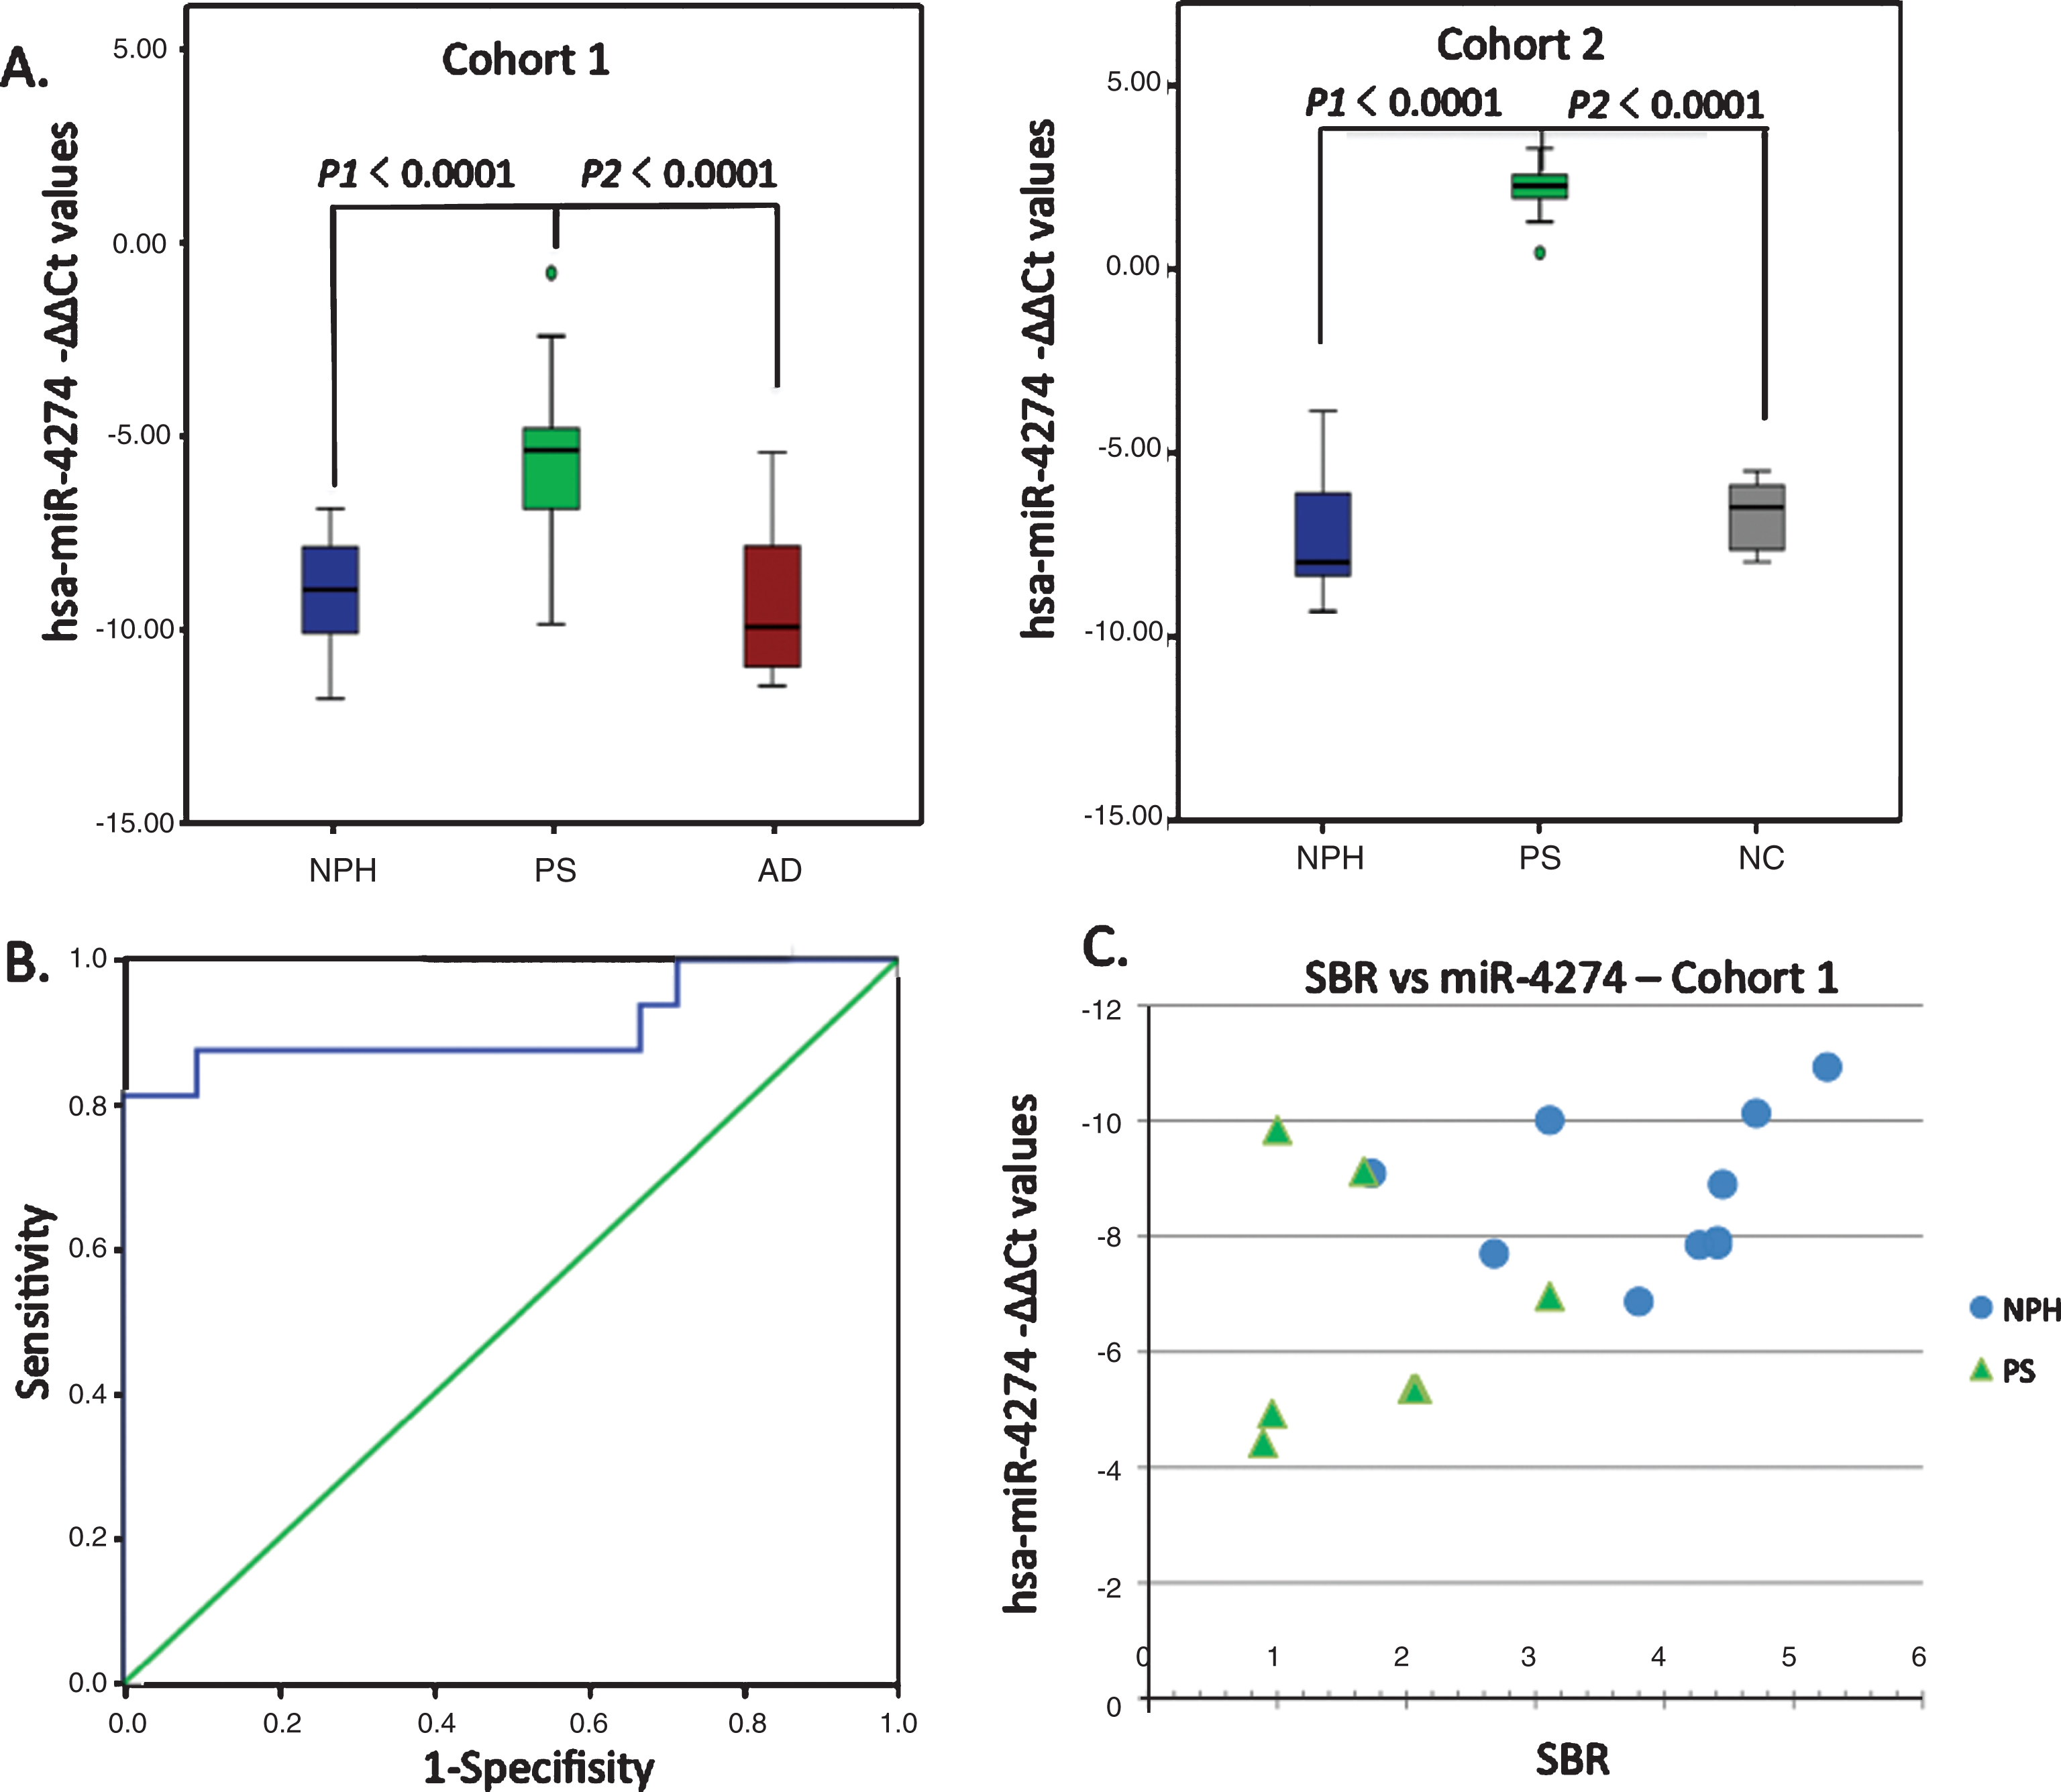
Table 1
Demographics and test scores of Cohort 1
| iNPH | PS | AD | |
| 21 | 18 | 16 | |
| Age (years) | 75 [72∼80] | 74 [72∼80] | 81 [79∼84] |
| Sex (female/male) | 5/16 | 6/12 | 6/10 |
| Evans index (%) | 35 [33∼37] | 33 [31∼35] | 32 [30∼35] |
| DESH | 95% (20/21) | 67% (12/18) | 25% (4/16) |
| ARWMCRS | 1 [1∼2] | 1 [0∼1] | 1 [1∼1] |
| Positive tap test | 90% (19/21) | 44% (8/18) | 38% (6/16) |
| CSF shunt surgery | 100% (21/21) | 72% (13/18) | 25% (4/16) |
| mRS | 2 [2∼2.5] | 2 [2∼3] | 3 [2∼3] |
| iNPHGS (G+C+U) | 5 [4∼6.5] | 5 [3∼6] | 7 [6∼8] |
| MMSE | 22 [19.5∼26.5] | 22 [17∼27] | 18 [11∼21] |
| FAB | 11 [9∼13] | 12 [9∼13] | 8 [5∼11] |
Data are shown as median values with interquartile range or as a percentage. iNPH, idiopathic normal pressure hydrocephalus; PS, possible iNPH with parkinsonian spectrum; AD, possible iNPH with Alzheimer disease; NC, non-affected elderly individuals; CSF, cerebrospinal fluid; mRS, modified Rankin scale; iNPHGS, idiopathic normal pressure hydrocephalus grading scale; G+C+U, gait disturbance + cognitive impairment + urinary dysfunction score; MMSE, mini-mental state examination; FAB, frontal assessment battery, ARWMCRS, Scale for Age-Related White Matter Changes; DESH, disproportionately enlarged subarachnoid space hydrocephalus.
Table 2
CSF protein biomarkers, hsa-miR-4274-ΔΔCt values, and specific binding ratio of DaTScan in Cohort 1
| N | iNPH | PS | AD | p-value |
| 21 | 18 | 16 | p1 = iNPH:PS | |
| p2 = iNPH:AD | ||||
| p3 = PS:AD | ||||
| sAβPPα (ng/ml) | 157 (61) | 165 (64) | 266 (81) | *p2 < 0.0001 |
| *p3 = 0.002 | ||||
| Aβ42 (pg/ml) | 630 (188) | 474 (186) | 433 (173) | *p1 = 0.047 |
| *p2 = 0.008 | ||||
| p-Tau | ||||
| (pg/ml) | 27 (9) | 33 (17) | 75 (23) | *p2 < 0.0001 |
| *p3 < 0.0001 | ||||
| α-syn (ng/ml) | 0.65 (0.27) | 0.51 (0.23) | 0.69 (0.20) | *p3 = 0.022 |
| hsa-miR-4274 | –8.90 | –5.14 | –9.92 | *p1 < 0.0001 |
| [–10.07∼–7.77] | [–6.83∼–3.11] | [–10.94∼–7.12] | *p3 < 0.0001 | |
| SBR | 4.3 | 1.9 | – | *p1 = 0.003 |
| [3.3∼4.4] | [1.3∼2.1] | |||
| (n = 10) | (n = 8) |
Data are shown as mean values (SD) or median values with interquartile range. *p < 0.05, significant difference (Dunnett’s test). Only statistically significant results are presented. sAβPPα, soluble amyloid precursor protein α; p-tau, phosphorylated Tau; α-syn, α-synuclein; SBR, specific binding ratio of ioflupane (123I) dopamine transporter scan (DaTScan).
Table 3
Demographics, test scores, CSF protein biomarkers, and hsa-miR-4274 –ΔΔCt values in Cohort 2
| N | iNPH | PS | NC | p-value |
| 10 | 10 | 6 | p1 = iNPH:PS | |
| p2 = PS:NC | ||||
| p3 = NC:iNPH | ||||
| Age (years) | 78 [70–80] | 79 [77–79] | 68 [65∼75] | |
| Sex (female/male) | 3/7 | 5/5 | 1/5 | |
| Evans Index (%) | 36 [32∼39] | 32 [30∼34] | – | |
| Positive tap test | 90% | 30% | – | |
| DESH | 100% | 50% | – | |
| MMSE score | 24 [16∼27] | 17 [14∼22] | – | |
| sAβPPα (ng/ml) | 124 (43) | 149 (136) | 271 (82) | p3 = 0.033 |
| Aβ42 (pg/ml) | 591 (243) | 496 (249) | 627 (230) | |
| p-Tau (pg/ml) | 22 (7) | 29 (11) | 34 (13) | |
| hsa-miR-4274 | –7.96 [–8.56∼–5.54] | 2.25 | –6.46 [–7.69∼–5.77] | p1 < 0.0001 |
| [1.75∼2.63] | p2 < 0.0001 |
Data are shown as mean values (SD) or median values with interquartile range. Only statistically significant results are presented.
Table 4
Comparison of test scores, CSF protein biomarkers, and miRNA –ΔΔCt values in iNPH and PS patients of Cohort at 1 before and 1 year after shunting
| iNPH | PS | p-value | |||
| before | after | before | after | ||
| shunting | shunting | shunting | shunting | p1 = iNPH before: after | |
| (n = 21) | (n = 21) | (n = 13) | (n = 13) | p2 = PS before: after | |
| MMSE | 22 | 27 | 26 | 24 | *p1 < 0.0001 |
| [19.5∼26.5] | [24.25∼28] | [20∼27] | [22.5∼26.5] | ||
| FAB | 11 [9∼13] | 12.5 [10.75∼15] | 12 [9∼14] | 11 [9∼13] | *p1 = 0.011 |
| mRS | 2 [2∼2.5] | 1 [1∼1.75] | 2 [2∼3] | 2 [2∼3] | *p1 = 0.001 |
| iNPHGS (G+C+U) | 5 [4∼6.5] | 2 [1∼3] | 5 [3.5∼6.5] | 6 [3∼7] | *p1 < 0.0001 |
| sAβPPα (ng/ml) | 157 (61) | 218 (83) | 153 (68) | 229 (161) | *p1 = 0.001 |
| *p2 = 0.008 | |||||
| Aβ42 (pg/ml) | 630 (188) | 782 (295) | 496 (192) | 731 (403) | *p1 = 0.030 |
| *p2 = 0.008 | |||||
| p-Tau (pg/ml) | 27 (9) | 65 (35) | 25 (7) | 58 (34) | *p1 < 0.0001 |
| *p2 = 0.008 | |||||
| hsa-miR-4274 | –8.9 | –9.6 | –4.6 | –7.4 | *p2 = 0.028 |
| [–10.1∼–7.8] | [–9.9∼–8.5] | [–5.2∼–2.0] | [–9.9∼–7.0] | ||
| (n = 6) | (n = 6) |
Data are shown as mean values (SD) or median values with interquartile range. *p < 0.05, significant difference (Wilcoxon’s signed rank test). Only statistically significant results are presented.


