
BACE1 Dynamics Upon Inhibition with a BACE Inhibitor and Correlation to Downstream Alzheimer’s Disease Markers in Elderly Healthy Participants
Abstract
The β-site amyloid-β protein precursor (AβPP) cleaving enzyme-1 (BACE1) is the rate limiting enzyme in the generation of amyloid-β peptide (Aβ) from AβPP, one of the major pathways in Alzheimer’s disease (AD) pathology. Increased BACE1 levels and activity have been reported in the brain of patients with sporadic AD. Therefore, changes of BACE1 levels in the cerebrospinal fluid (CSF) have also been investigated as a possible biomarker of the disease. We analyzed BACE1 levels in CSF of elderly healthy participants before and after chronic treatment with a BACE inhibitor (BACEi) and evaluated the correlation between BACE1 levels and downstream AD markers. Overall, BACE1 CSF levels showed strong correlations to all downstream AD markers investigated. This is the first reported finding that shows BACE1 levels in CSF were well correlated to its end product Aβ1 - 42. As previously described, BACE1 levels were strongly correlated to total-tau and phosphorylated tau levels in CSF. Generally, chronic BACE inhibition did not influence BACE1 CSF protein levels. Follow-up studies including early-stage AD pathophysiology and prodromal AD patients will help to understand the importance of measuring BACE1 routinely in daily clinical practice and AD clinical trials.
INTRODUCTION
Pathological changes in amyloid-β peptide (Aβ), total tau (t-tau), and hyperphosphorylated tau (p-tau) in cerebrospinal fluid (CSF) can be detected many years before neurodegeneration and clinical signs of dementia are observed in Alzheimer’s disease (AD) patients (reviewed in [1]). Although previous studies have shown that these CSF specific markers are well associated with the brain pathology and constitute reliable diagnostic biomarkers of AD [2–8], new biomarkers would be of additional value to predict disease progression, also in the early disease stages, in order to stratify patients and to evaluate treatment efficacy.
β-site amyloid precursor protein (AβPP) cleaving enzyme1 (BACE1) is the rate limiting enzyme in the generation of Aβ from AβPP [9, 10], one of the major pathways in AD pathology. AβPP can be cleaved by α-secretase or β-secretase within the extracellular domain resulting in the production of large soluble AβPP derivatives (sAβPPα and sAβPPβ, respectively) and membrane-bound carboxyl-terminal fragments (CTFα or CTFβ, respectively). Subsequently, γ-secretase cleaves AβPP within its transmembrane domain, producing either a 3 kDa product p3 from the CTFα in the non-amyloidogenic pathway, or Aβ from the CTFβ in the amyloidogenic pathway (reviewed in [11]). Increased BACE1 levels and activity have been reported in the brain of patients with sporadic AD [12–16]. Therefore, changes of BACE1 levels in the CSF have also been investigated as a possible biomarker of the disease (reviewed in [17]).
Previous investigations measuring the activity or protein levels of BACE1 in CSF have resulted in different conclusions and despite BACE1 being the rate limiting step in Aβ formation no direct correlation between BACE1 and its end product (Aβ1 - 42) could be established in non-diseased or diseased populations. Some studies observed an increase of BACE1 activity in CSF of AD patients versus non-demented subjects and other dementias [18–20] as well as a higher BACE1 activity in mild cognitive impaired (MCI) compared to AD patients [20, 21]. Other groups reported no differences between controls, MCI, and AD patients [22, 23] and some others even reported a decrease of BACE1 activity in CSF of AD [24] and multiple sclerosis patients [25]. Concerning BACE1 CSF levels, Zhong et al. [21], and Ewers et al. [20] reported increased levels of soluble BACE1 in MCI patients versus AD and non-demented controls. Another study revealed a mild increase in BACE1 levels in AD but also in other neurological disorders associated with inflammation such as autoimmune limbic encephalitis [26], suggesting BACE1 level in CSF is not a specific biomarker for the diagnosis of AD. Interestingly, several groups have reported a strong correlation between BACE1 levels and the levels of t-tau [22, 23, 26–28] and p-tau [22, 23, 26, 28] in CSF and associated it to a possible link between BACE1 and neurodegeneration [22, 26–28].
Inhibitors of BACE1 prevent the formation of Aβ1 - 42 as well as Aβ1 - 40, Aβ1 - 38, and Aβ1 - 43 and would be potential therapeutic agents in the treatment of AD. JNJ-54861911 is a potent orally active brain-penetrant BACE inhibitor (BACEi) developed by Janssen Research & Development in collaboration with Shionogi. In Phase I placebo-controlled single and multiple ascending dose studies in healthy elderly and young participants, JNJ-54861911 administered once daily (QD) achieved significant and sustained reduction in CSF Aβ (up to 95% at 90 mg QD for 14 days) and was safe and well tolerated without significant adverse events across the dose range investigated (5 mg–150 mg). As such, these results supported confirmation of target engagement of JNJ-54861911 (reduction in Aβ1 - 40 levels in plasma and CSF) through its peripheral and central BACE1 inhibition [29].
Given the current debate regarding the potential of BACE1 as a biomarker for AD and therapeutic target for the disease, we evaluated the correlation between BACE1 levels and downstream protein markers of AβPP metabolism and neuronal degeneration in CSF and analyzed BACE1 dynamics in CSF of elderly healthy individuals before and after chronic treatment with a BACEi.
METHODS
Study population
The study population considered for this analysis consisted of 38 elderly men or women (55–75 years; BMI: 18 to 32 kg/m2) enrolled in a double blind, multiple ascending dose (MAD) study to determine the safety, tolerability, pharmacokinetics, and central nervous effects of the BACEi JNJ-54861911 in healthy participants. The study consisted of a 4-week screening period, a 14-day treatment phase, and a follow-up period of 7 to 14 days after last dose administration. Elderly participants were considered healthy based on medical history, physical examination, 12-lead ECGs, and clinical laboratory evaluations. In the MAD study, elderly participants received double-blind JNJ-54861911 (n = 6/cohort) or placebo (n = 2/cohort) as oral suspension at escalating doses of 5, 30, 50, or 90 mg QD or open label JNJ-54861911 as solid dose formulation of 25 mg QD (n = 6) for 14 days.
The elderly participants included in the current analyses are a sub-sample of the study population enrolled in the MAD study, i.e., all elderly participants from whom CSF has been collected. Details of the study design have been described earlier [29]. The MAD study was conducted from June 2013 to December 2013 at SGS, Life Science Services, Clinical Pharmacology Unit, Belgium. The study protocol and its amendments were reviewed and approved by an Institutional Review Board (Commissie voor Medische Ethiek, Ziekenhuis Netwerk Antwerpen [ZNA], Antwerp, Belgium). All procedures followed were in accordance with the principles of the Declaration of Helsinki. Written informed consent was obtained from all participants before participation. The study is registered on ClinicalTrials.gov: NCT01887535.
APOE ɛ4 genotyping
From all participants, a blood sample for pharmacogenomic analysis (10 mL) was collected in tubes containing potassium/sodium EDTA. DNA was isolated using Puregene chemistry and automated extraction using an Autopure LS. For all participants, APOE ɛ4 carrier status was analyzed in a multiplex reaction using polymerase chain reaction/ligation detection reaction [30].
CSF collection and processing
For all elderly participants, a baseline CSF sample (12 mL) was collected predose on Day 1 (between 6:00 and 9:00 AM) in fasting condition by a single lumbar puncture between the L3 and L4 or L4 and L5 intervertebral space. Serial CSF sampling (4 mL/sample) was performed through an indwelling subarachnoid lumbar catheter from 2 h before and until 36 h after the last dosing, as described previously [29, 31]. CSF samples were collected in polypropylene tubes and aliquoted by immediate transfer of 500 μL samples to multiple storage tubes (Micronic 1.4 ml non-coded tubes U-bottom in Comorack-96, Cat No. MP22502 with caps from FluidX, Split TPE Capcluster Blue. Cat. No. 65-53028) and stored at –70°C immediately after collection. All samples analyzed in this study had at most two freeze-thawcycles.
Bioanalytical methods
Analysis of BACE1
BACE1 levels in CSF were analyzed using a BACE1 sandwich ELISA as previously described [26]. Briefly, NUNC ninety-six-well plates (Life Technologies) were coated with 50 μl/well of capture antibody (5G7 [32]) dissolved in coating buffer (10 mM Tris-HCl, 10 mM NaCl, 10 mM NaN3, pH 8.5) with a final concentration of 2 μg/ml. After overnight incubation at 4°C, the plates were washed with PBS+0.05% Tween 20 and blocked with 100 μl/well of casein buffer (1 g casein in 1 L PBS, pH7.4) for 4 h at room temperature. The coating was always done the day before the actual experiment. Samples or standards were diluted in casein buffer and mixed with the detection antibody (10B8-HRPO [32], 10 mg/ml) diluted 1:2000 in casein buffer. The mixtures were added to the ELISA plates and incubated overnight at 4°C. Plates were washed and developed with 0.2 mg/ml of 3,5,3’,5’-tetramethyl-benzidine (TMB, Sigma) dissolved in 100 mM sodium acetate (NaAc, pH 4.9) supplemented with 0.03% H2O2. The reactions were allowed to proceed for maximum 15 min on a plate shaker at room temperature. The reactions were stopped by adding 2 N H2SO4, 50 μl/well and the plates were read on a Perkin Elmer Envision 2103 multilabel reader at 450 nm. The anti-BACE1 monoclonal antibodies (mAbs) 5G7 and 10B8 were generated as described before [32]. These mAbs are highly specific for BACE1 and do not cross react with BACE2 or other structurally related aspartyl proteases [26, 32]. BACE1 levels were determined using a standard curve with a 4-parameter logistic model with 1/Y2 weighting function. All samples from each participant were analyzed in duplicate on the same assay plate. Only mean values with replicate well coefficient of variation (CV) of≤20% wereaccepted.
Analysis of Aβ1 - 37, Aβ1 - 38, Aβ1 - 40, and Aβ1 - 42 concentrations (MSD 4-plex)
A qualified prototype multiplex immunoassay based on Meso Scale Discovery (MSD) (Gaithersburg, MD, USA) electrochemiluminescence (ECL) detection technology was utilized for simultaneous detection of four Aβ species (Aβ1 - 37, Aβ1 - 38, Aβ1 - 40 and Aβ1 - 42). This method has been described previously [33, 34]. Briefly, the MSD 4-plex assay utilizes four different Janssen monoclonal antibodies with specificity for four different Aβ isoforms (Aβ1 - 37, Aβ1 - 38, Aβ1 - 40, and Aβ1 - 42) and allows simultaneous quantification of these four Aβ species in CSF. For all analytes, the lower and higher limit of quantitation were determined to be 4.57 and 10,000 pg/mL, respectively. Percentage cross-reactivity, defined as (mean predicted concentration/tested peptide concentration)*100, was shown to be < 1% for all combinations of antibodies and peptides tested. Detection was performed with labeled Janssen human-specific anti-Aβ antibody JRF/AβN/25 with specificity for Aβ isoforms with intact N-terminus, i.e., full-length Aβ. Aβ concentrations were determined using a standard curve with 4-parameter logistic model with 1/Y2 weighting function. All samples from each participant were analyzed in duplicate on the same assay plate. Only mean values with replicate well CV of≤20% were accepted.
Analysis of sAβPP concentrations
sAβPPα, sAβPPβ, and sAβPP total were quantified in CSF using MSD ECL detection technology. sAβPPα and sAβPPβ CSF concentrations were measured using MSD® 96-well MULTI-SPOT® sAβPPα/sAβPPβ assay according to manufacturer’s instructions [35].
For sAβPP total, an MSD ECL assay developed by Janssen Research & Development was used [29]. In brief, the assay uses P2-1 (against amino acid 104–118 of human AβPP695) as capturing antibody, and SULFO-TAGTM labeled anti-sAβPP JRD/sAβPP/23, raised against the peptide sequence of amino acids 557–576 of human AβPP695, as detection antibody. Briefly, 96-well SECTOR® standard plates were pre-wetted with PBS for 3 min and tapped dry, where after plates were coated with 1.25 μg/mL capture antibody overnight at 4°C. After a wash, plates were blocked and washed again. Next, 25 μL of standards or samples was applied, and the plate was incubated for 1 h at room temperature on a shaker. After the next washing step, 25 μL of the detection antibody (20 μg/mL) was added per well for an additional incubation step of 1 h. After the next wash step, read buffer was added to all wells, followed by 10 min of incubation. The plate was read with the Sector Imager 6000 (MSD).
The sAβPP levels were determined using a standard curve with 4-parameter logistic model with 1/Y2 weighting function. All samples from eachparticipant were analyzed in duplicate on the same assay plate. Only mean values with replicate well CV of≤20% were accepted.
Analysis of baseline CSF Aβ1 - 42, P-tau181P, and T-tau levels
Baseline Aβ1 - 42, phosphorylated tau at position threonine 181 (P-tau181P) and total tau (T-tau) concentrations were measured using INNO-BIA AlzBio3 kit reagents (Innogenetics now Fujirebio Europe, Ghent Belgium) and Luminex analytical platform [36, 37] with predefined assay acceptance criteria of CV <25% for duplicates [36]. Diagnostic threshold CSF concentrations for AD versus normal controls for Aβ1 - 42 were applied to current sample set to judge the likelihood of having cerebral amyloid plaque deposition [36, 37].
Statistical analysis
Baseline CSF concentrations of BACE1 were compared with amyloid downstream markers, markers of neurodegeneration and other baseline and demographic characteristics with Pearson correlation coefficients and linear regression. The percent change from baseline in CSF BACE1 concentrations after 14 days of treatment, 24-h post-dose, were computed. The relationships between the changes in CSF BACE1 with other factors were analyzed with an F-test. All analyses were performed using SAS statistical software version 9.2 (SAS Institute,Cary, NC).
RESULTS
Demographic characteristics
Demographic characteristics, APOE ɛ4 status, and pooled baseline CSF concentrations of BACE1 and all amyloid downstream markers and markers of neurodegeneration are summarized in Table 1. Thirty-eight elderly men and women (mean age 66.3 y) were enrolled and completed the study. Overall, 65.8% (n = 25/38) of subjects enrolled were male and 26.3% (n = 10/38) were identified as APOE ɛ4 carriers (Table 1). Pooled CSF BACE1 mean (SD) concentration was 4.4 (1.72) ng/mL and comparable to the 6.6 (0.7) ng/mL value reported by Barão et al. [26] for non-neurological disorder controls. Four participants had baseline Aβ1 - 42 concentrations below the threshold (249 pg/mL), suggestive ofcerebral amyloid plaque deposition [37], but none had elevated T-tau or P-tau181P values (data not shown).
Correlation between BACE1 and APOE ɛ4 status, gender, and age
Correlation analyses were performed between CSF BACE1 and APOE ɛ4 status, gender, and age. CSF BACE1 levels showed a weak positive correlation with age (r = 0.33: p = 0.0405; Fig. 1), but not with APOE ɛ4 status or gender (data not shown).
Correlation between BACE1 and Aβ1 - 37, Aβ1 - 38, Aβ1 - 40, and Aβ1 - 42 (MSD 4-plex)
CSF BACE1 levels for all participants combined (APOE ɛ4 carriers and non-carriers; Fig. 2A, D, G, J) correlated strongly and significantly with Aβ1 - 37 (r = 0.843; p < 0.0001), Aβ1 - 38 (r = 0.862; p < 0.0001), and Aβ1 - 40, (r = 0.869, p < 0.0001); and moderately with Aβ1 - 42 (r = 0.497; p = 0.002). Despite the small sample size of APOE ɛ4 carriers, strong and significant correlations with BACE1 were observed in this small subgroup for Aβ1 - 40, (r = 0.821; p = 0.004; Fig. 2E), Aβ1 - 38 (r = 0.865; p = 0.001; Fig. 2H), and Aβ1 - 37 (r = 0.864; p = 0.001; Fig. 2K). Separation of APOE ɛ4 carriers and non-carriers did not influence the correlation coefficients for Aβ1 - 40,1 - 38,1 - 37 species (Fig. 2F, I, L). The correlation between BACE1 and Aβ1 - 42 was moderate and significant in noncarriers (r = 0.567; p < 0.002; Fig. 2C) but weak and non-significant in the carrier group (r = 0.121; p = 0.740; Fig. 2B) which was likely due to the small sample size of APOE ɛ4 carriers in the analysis group.
Correlation between BACE1 and sAβPPα, sAβPP-β, and sAβPP-total
Within this overall elderly population, CSF BACE1 levels correlated significantly and positively with sAβPP-total (r = 0.878; p < 0.0001; Fig. 3A), sAβPPα (r = 0.5227; p = 0.0008; Fig. 3D) and sAβPPβ (r = 0.5871; p = 0.0001; Fig. 3G). These moderately strong correlations with sAβPP remained when evaluating APOE ɛ4 carriers (n = 10) (sAβPPβ [r = 0.6403; p = 0.0461]; sAβPPα [r = 0.6195; p = 0.0561); sAβPP-total [r = 0.6230; p = 0.0543]). Correlations and significance levels remained unchanged in the APOE ɛ4 non-carrier group (Fig. 3C, F, I).
Correlations between BACE1 and Aβ1 - 42, P-tau181P and T-tau levels (AlzBio3)
Moderately strong and significant positive correlations between CSF BACE1 and p-tau181P (r = 0.4406; p = 0.0063; Fig. 4D) and t-tau (r = 0.7355; p < 0.0001; Fig. 4G) were observed in this elderly population, while CSF Aβ1 - 42 as measured with the AlzBio3 assay did not correlate with BACE1 (r = 0.0305; p = 0.8575; Fig. 4A). Separation of carriers and non-carriers did not result in significant correlations with t-tau or p-tau181P for APOE ɛ4 carriers (Fig. 4B, E, H) perhaps due to its small sample size, while correlations were maintained for the APOE ɛ4 non-carriers (Fig. 4C, F, I).
CSF BACE1 dynamics upon chronic inhibition with JNJ-54861911
Overall treatment for up to 14 days with increasing dose levels (ranging from 5 to 90 mg) of the BACE inhibitor JNJ-54861911 did not influence CSF BACE1 protein levels as depicted in Fig. 5A (p = 0.5313).
However, it was noted that some individual participants (8/38; all APOE ɛ4 non-carriers) showed increases in CSF BACE1 protein levels ranging from 24 to 132% (Table 2) independent of dose level administered. None of these individuals had showed low CSF baseline levels of Aβ1 - 42 suggestive of absence of cerebral amyloid plaque deposition. Further investigation did not show a correlation between baseline biomarker levels (Aβ (all forms), sAβPPα, sAβPPβ, sAβPP total, t-tau, p-tau181p) and change in CSF BACE1 from baseline that could potentially clarify these increases. Similar findings have been observed upon acute dosing with JNJ-54861911 (dose levels ranging from 1 to 150 mg) in the single ascending dose study of JNJ-54861911 (see Supplementary Figure 1 and Supplementary Table 1), with the exception that individual participants showing increases >20% of CSF BACE1 protein levels upon dosing were identified as both APOE ɛ4 carriers and non-carriers (Supplementary Table 1).
DISCUSSION
Identification of new biomarkers may enhance efforts to diagnose AD in an early stage, to stratify patients, and to better evaluate treatment efficacy. Since BACE1 is the rate limiting enzyme in the generation of Aβ from AβPP [9, 10] and increased BACE1 levels and activity have been reported in the brain of patients with sporadic AD [12–16], changes of BACE1 levels in the CSF have been investigated as a possible biomarker of the disease (see Barao et al. for a review [17]). We analyzed BACE1 dynamics in CSF of elderly healthy individuals before and after chronic inhibition of BACE and evaluated its correlation to the well-known downstream AD markers to better understand the potential benefit of measuring BACE1 routinely in the clinics as a potential diagnostic or treatment effect biomarker for AD.
Savage et al. [23] reported that BACE1 activity increased approximately 1.8% /year in healthy controls but not in AD or MCI groups. However, in this cohort of healthy elderly individuals a weak correlation is observed between BACE1 CSF levels and age suggesting that BACE1 levels are minimally affected by age. Although increased BACE1 CSF activity has been associated with APOE ɛ4 genotype in subjects with MCI and AD [20], no significant correlation is observed between BACE1 levels and APOE ɛ4 status in healthy elderly individuals. The lack of such correlation is supported by similar findings by Zetterberg et al. [27], Mulder et al. [22], and Savage et al. [23], who found no evidence that number of APOE ɛ4 alleles among all diagnostic groups had any impact on mean BACE1 activity.
BACE1 CSF protein levels show strong correlations to all downstream AD markers including Aβ1 - 37, Aβ1 - 38, Aβ1 - 40, Aβ1 - 42, total sAβPP, sAβPPα, and sAβPPβ suggesting there is an upstream metabolic pathway that can regulate the concentration of these metabolites together. Interestingly, APOE ɛ4 carriers show a tendency for strong correlations for Aβ forms except Aβ1 - 42. However, these differences are not significant likely due to the small sample size.
In this study, for the first time, BACE1 levels correlate significantly with Aβ1 - 42 levels in CSF. In MCI and AD patients, an inverse relation or no relation may be expected as higher BACE1 levels in AD patients occur in combination with lower Aβ1 - 42 due to plaque formation, depending on the balance between dynamics of drug treatment and biology of AβPP processing on BACE1 levels. In healthy subjects, an increase in BACE1 levels would result in increased production of Aβ1 - 42, consistent with observations in this study. Intriguingly, this correlation is not observed when Aβ1 - 42 levels were measured by the Alzbio-3 assay but only when the Aβ MSD 4-plex assay was used (a moderate correlation was observed between the AlzBio-3 and MSD 4-plex assay [Pearson r = 0.659, p > 00001]; data not shown). The reason for this discrepancy is currently unclear, but might be multifactorial in nature. First of all, matrix effects are known to influence the concentration of Aβ1 - 42 among immunoassays [38]. The MSD 4-plex assay shows high sensitivity and specificity allowing measurements in diluted samples thereby reducing actual matrix effects. Secondly, both assays employ different antibodies. The Janssen antibodies might have differential binding properties altering the fraction of detectable Aβ1 - 42 with the MSD 4-plex assay. Thirdly, dissimilar sources for the calibrator peptides may lead to divergences in the absolute Aβ1 - 42 concentration. In addition, variable correlations between different Aβ1 - 42 immunoassays have been reported before ranging from moderate to very strong correlations [39–41]. The correlation between BACE1 and Aβ1 - 40 CSF levels is in line with earlier publications where BACE1 CSF activity was well correlated to Aβ1 - 40 CSF levels [22, 27].
Since sAβPPβ is the direct product from AβPP after BACE1 cleavage, the correlation between BACE1 and sAβPPβ CSF levels is not unexpected and is in line with the previous results describing a strong correlation between sAβPPβ and BACE1 CSF activity [23, 27, 28]. In contrast, the correlation between BACE1 and sAβPPα CSF levels appears more surprising. Nevertheless, this correlation might be explained by the strong correlation between sAβPPα and sAβPPβ CSF levels which also suggests that α- and β-secretase processing of AβPP can be co-regulated processes, as suggested by the previous results describing a strong correlation between sAβPPα and BACE1 CSF activity [27].
As previously reported, we also observed a strong correlation between BACE1 levels and t-tau [22, 23, 26–28] and p-tau [22, 23, 26, 28] levels in CSF of elderly healthy individuals. Although high amounts of t-tau and p-tau in CSF have been associated with increased neuronal damage [42–44] and have been considered a general marker for neurodegenerative processes [27, 42–44], in this study we only measured baseline tau levels in elderly healthy individuals and it is difficult to assume a direct link of BACE1 expression to tau hyperphosphorylation and/or tauopathy and therefore to neurodegeneration. Tau is a phosphorylated protein which explains why t-tau and p-tau are mostly correlated. Since in AD the increase in t-tau and p-tau in CSF correlate well to each other [27, 42, 43, 45], it remains to be established if that is just an increase of “normal” tau overproduced by a neurodegeneration-linked mechanism (e.g., stress response) or if the observed positive correlation in healthy individuals is due to another mechanism (e.g., aging) beyond the scope of this study.
Generally, BACE1 CSF protein levels are not affected by acute (see Supplementary Figure 1) or chronic BACE1 inhibition (Fig. 5). However, the observed tendency to increased levels of BACE1 in some individual participants could not be linked to changes in other biomarkers. In the MAD study (chronic dose), only APOE ɛ4 non-carriers show significant changes in BACE1 CSF levels, but in the single ascending dose study (54861911ALZ1001), both carriers and non-carriers show changes >20%. Therefore, more in depth analysis are needed to further understand the reasons for this individual variation.
The relatively small sample size of the healthy elderly cohort in the MAD study can be considered a limitation of the present study, particularly for the low number of APOE E4 carriers when compared to other published studies in patients with AD. Thus, correlations of BACE1 for all AD markers were reported for all participants combined (n = 38), APOE E4 carriers (n = 10) and non-carriers (n = 28) separately. Despite the small APOE E4 carrier subgroup, the observed correlations of biomarkers with BACE1 levels were found to be numerically comparable across all subgroups for all Aβ fragments except Aβ1 - 42.
Conclusions
In elderly healthy participants, BACE1 CSF levels show strong to moderate correlations to all downstream AD markers including Aβ1 - 42 and markers of neurodegeneration (t-tau and p-tau181p). For the first time, a (moderate) correlation between BACE1 levels in CSF and Aβ1 - 42 is shown. Generally, chronic BACE inhibition does not influence BACE1 CSF levels. Additional studies including preclinical (asymptomatic) and prodromal AD cases will help understanding the significance of measuring BACE1 routinely in clinical practice and in AD clinical trials.
This research was funded by Janssen Research & Development, a division of Janssen Pharmaceutica N.V., Beerse, Belgium and by a Transformational Medical Research Grant (IWT 120834) from Flanders Innovation & Entrepreneurship (VLAIO), Belgium.
Authors’ disclosures available online (http://j-alz.com/manuscript-disclosures/160829r1).
ACKNOWLEDGMENTS
The authors are most grateful to the study participants for their contributions and the investigational staff for the medical care. The authors acknowledge Bradford Challis, PhD (Janssen Research & Development, LLC) for additional editorial support. The authors also thank Marianne Borgers, Luc Gys, and Daan Van Glabbeek for their contributions to the development of sAβPP assays, Tine Vanhoutvin for her contribution to the development and performance of the BACE1 assay, and QPS Netherlands B.V. for CSF and plasma Aβ analyses.
Appendices
The supplementary material is available in the electronic version of this article: http://dx.doi.org/10.3233/JAD-160829.
REFERENCES
[1] | Jack CR Jr , Knopman DS , Jagust WJ , Petersen RC , Weiner MW , Aisen PS , Shaw LM , Vemuri P , Wiste HJ , Weigand SD , Lesnick TG , Pankratz VS , Donohue MC , Trojanowski JQ ((2013) ) Tracking pathophysiological processes in Alzheimer’s disease: An updated hypothetical model of dynamic biomarkers. Lancet Neurol 12: , 207–216. |
[2] | Strozyk D , Blennow K , White LR , Launer LJ ((2003) ) CSF Abeta 42 levels correlate with amyloid-neuropathology in a population-based autopsy study. Neurology 60: , 652–656. |
[3] | Mintun MA , Larossa GN , Sheline YI , Dence CS , Lee SY , Mach RH , Klunk WE , Mathis CA , DeKosky ST , Morris JC ((2006) ) [11C]PIB in a nondemented population: Potential antecedent marker of Alzheimer disease. Neurology 67: , 446–452. |
[4] | Buerger K , Ewers M , Pirttila T , Zinkowski R , Alafuzoff I , Teipel SJ , DeBernardis J , Kerkman D , McCulloch C , Soininen H , Hampel H ((2006) ) CSF phosphorylated tau protein correlates with neocortical neurofibrillary pathology in Alzheimer’s disease. Brain 129: , 3035–3041. |
[5] | Shaw LM , Vanderstichele H , Knapik-Czajka M , Clark CM , Aisen PS , Petersen RC , Blennow K , Soares H , Simon A , Lewczuk P , Dean R , Siemers E , Potter W , Lee VM , Trojanowski JQ , Alzheimer’s Disease Neuroimaging Initiative ((2009) ) Cerebrospinal fluid biomarker signature in Alzheimer’s disease neuroimaging initiative subjects. Ann Neurol 65: , 403–413. |
[6] | Bouwman FH , Schoonenboom NS , Verwey NA , van Elk EJ , Kok A , Blankenstein MA , Scheltens P , van der Flier WM ((2009) ) CSF biomarker levels in early and late onset Alzheimer’s disease. Neurobiol Aging 30: , 1895–1901. |
[7] | Bateman RJ , Xiong C , Benzinger TL , Fagan AM , Goate A , Fox NC , Marcus DS , Cairns NJ , Xie X , Blazey TM , Holtzman DM , Santacruz A , Buckles V , Oliver A , Moulder K , Aisen PS , Ghetti B , Klunk WE , McDade E , Martins RN , Masters CL , Mayeux R , Ringman JM , Rossor MN , Schofield PR , Sperling RA , Salloway S , Morris JC , Dominantly Inherited Alzheimer Network ((2012) ) Clinical and biomarker changes in dominantly inherited Alzheimer’s disease. N Engl J Med 367: , 795–804. |
[8] | Engelborghs S , De Vreese K , Van de Casteele T , Vanderstichele H , Van Everbroeck B , Cras P , Martin JJ , Vanmechelen E , De Deyn >PP ((2008) ) Diagnostic performance of a CSF-biomarker panel in autopsy-confirmed dementia. Neurobiol Aging 29: , 1143–1159. |
[9] | Vassar R , Bennett BD , Babu-Khan S , Kahn S , Mendiaz EA , Denis P , Teplow DB , Ross S , Amarante P , Loeloff R , Luo Y , Fisher S , Fuller J , Edenson S , Lile J , Jarosinski MA , Biere AL , Curran E , Burgess T , Louis JC , Collins F , Treanor J , Rogers G , Citron M ((1999) ) Beta-secretase cleavage of Alzheimer’s amyloid precursor protein by the transmembrane aspartic protease BACE. Science 286: , 735–741. |
[10] | Sinha S , Anderson JP , Barbour R , Basi GS , Caccavello R , Davis D , Doan M , Dovey HF , Frigon N , Hong J , Jacobson-Croak K , Jewett N , Keim P , Knops J , Lieberburg I , Power M , Tan H , Tatsuno G , Tung J , Schenk D , Seubert P , Suomensaari SM , Wang S , Walker D , Zhao J , McConlogue L , John V ((1999) ) Purification and cloning of amyloid precursor protein beta-secretase from human brain. Nature 402: , 537–540. |
[11] | De Strooper B , Vassar R , Golde T ((2010) ) The secretases: Enzymes with therapeutic potential in Alzheimer disease. Nat Rev Neurol 6: , 99–107. |
[12] | Holsinger RM , McLean CA , Beyreuther K , Masters CL , Evin G ((2002) ) Increased expression of the amyloid precursor beta-secretase in Alzheimer’s disease. Ann Neurol 51: , 783–786. |
[13] | Fukumoto H , Cheung BS , Hyman BT , Irizarry MC ((2002) ) Beta-secretase protein and activity are increased in the neocortex in Alzheimer disease. Arch Neurol 59: , 1381–1389. |
[14] | Yang LB , Lindholm K , Yan R , Citron M , Xia W , Yang XL , Beach T , Sue L , Wong P , Price D , Li R , Shen Y ((2003) ) Elevated beta-secretase expression and enzymatic activity detected in sporadic Alzheimer disease. Nat Med 9: , 3–4. |
[15] | Li R , Lindholm K , Yang LB , Yue X , Citron M , Yan R , Beach T , Sue L , Sabbagh M , Cai H , Wong P , Price D , Shen Y ((2004) ) Amyloid beta peptide load is correlated with increased beta-secretase activity in sporadic Alzheimer’s disease patients. Proc Natl Acad Sci U S A 101: , 3632–3637. |
[16] | Harada H , Tamaoka A , Ishii K , Shoji S , Kametaka S , Kametani F , Saito Y , Murayama S ((2006) ) Beta-site APP cleaving enzyme 1 (BACE1) is increased in remaining neurons in Alzheimer’s disease brains. Neurosci Res 54: , 24–29. |
[17] | Barao S , Moechars D , Lichtenthaler SF , De Strooper B ((2016) ) BACE1 Physiological functions may limit its use as therapeutic target for Alzheimer’s disease. Trends Neurosci 39: , 158–169. |
[18] | Verheijen JH , Huisman LG , van Lent N , Neumann U , Paganetti P , Hack CE , Bouwman F , Lindeman J , Bollen EL , Hanemaaijer R ((2006) ) Detection of a soluble form of BACE-1 in human cerebrospinal fluid by a sensitive activity assay. Clin Chem 52: , 1168–1174. |
[19] | Holsinger RM , McLean CA , Collins SJ , Masters CL , Evin G ((2004) ) Increased beta-secretase activity in cerebrospinal fluid of Alzheimer’s disease subjects. Ann Neurol 55: , 898–899. |
[20] | Ewers M , Zhong Z , Burger K , Wallin A , Blennow K , Teipel SJ , Shen Y , Hampel H ((2008) ) Increased CSF-BACE 1 activity is associated with ApoE-epsilon 4 genotype in subjects with mild cognitive impairment and Alzheimer’s disease. Brain 131: , 1252–1258. |
[21] | Zhong Z , Ewers M , Teipel S , Burger K , Wallin A , Blennow K , He P , McAllister C , Hampel H , Shen Y ((2007) ) Levels of beta-secretase (BACE1) in cerebrospinal fluid as a predictor of risk in mild cognitive impairment. Arch Gen Psychiatry 64: , 718–726. |
[22] | Mulder SD , van der Flier WM , Verheijen JH , Mulder C , Scheltens P , Blankenstein MA , Hack CE , Veerhuis R ((2010) ) BACE1 activity in cerebrospinal fluid and its relation to markers of AD pathology. J Alzheimers Dis 20: , 253–260. |
[23] | Savage MJ , Holder DJ , Wu G , Kaplow J , Siuciak JA , Potter WZ , Foundation for National Institutes of Health (FNIH) Biomarkers Consortium CSF Proteomics Project Team for Alzheimer’s Disease Neuroimaging Initiative ((2015) ) Soluble BACE-1 activity and sAβPPβ concentrations in Alzheimer’s disease and age-matched healthy control cerebrospinal fluid from the Alzheimer’s Disease Neuroimaging Initiative-1 baseline cohort. J Alzheimers Dis 46: , 431–440. |
[24] | Wu G , Sankaranarayanan S , Tugusheva K , Kahana J , Seabrook G , Shi XP , King E , Devanarayan V , Cook JJ , Simon AJ ((2008) ) Decrease in age-adjusted cerebrospinal fluid beta-secretase activity in Alzheimer’s subjects. Clin Biochem 41: , 986–996. |
[25] | Mattsson N , Axelsson M , Haghighi S , Malmestrom C , Wu G , Anckarsater R , Sankaranarayanan S , Andreasson U , Fredrikson S , Gundersen A , Johnsen L , Fladby T , Tarkowski A , Trysberg E , Wallin A , Anckarsater H , Lycke J , Andersen O , Simon AJ , Blennow K , Zetterberg H ((2009) ) Reduced cerebrospinal fluid BACE1 activity in multiple sclerosis. Mult Scler 15: , 448–454. |
[26] | Barao S , Zhou L , Adamczuk K , Vanhoutvin T , van Leuven F , Demedts D , Vijverman AC , Bossuyt X , Vandenberghe R , De Strooper B ((2013) ) BACE1 levels correlate with phospho-tau levels in human cerebrospinal fluid. Curr Alzheimer Res 10: , 671–678. |
[27] | Zetterberg H , Andreasson U , Hansson O , Wu G , Sankaranarayanan S , Andersson ME , Buchhave P , Londos E , Umek RM , Minthon L , Simon AJ , Blennow K ((2008) ) Elevated cerebrospinal fluid BACE1 activity in incipient Alzheimer disease. Arch Neurol 65: , 1102–1107. |
[28] | Perneczky R , Alexopoulos P , Alzheimer’s Disease Neuroimaging Initiative ((2014) ) Cerebrospinal fluid BACE1 activity and markers of amyloid precursor protein metabolism and axonal degeneration in Alzheimer’sdisease. Alzheimers Dement 10: , S425– S429 e421. |
[29] | Timmers M , Van Broeck B , Ramael S , Slemmon J , De Waepenaert K , Russu A , Bogert JM , Stieltjes H , Shaw LM , Engelborghs S , Moechars D , Mercken M , Liu E , Sinha V , Kemp J , Van Nueten L , Tritsmans L , Streffer JR ((2016) ) Profiling the dynamics of CSF and plasma Aβ reduction after treatment with JNJ-54861911, a potent oral BACE inhibitor. Alzheimers Dement (N Y) 2: , 202–212. |
[30] | Favis R , Gerry NP , Cheng YW , Barany F ((2005) ) Applications of the universal DNA microarray in molecular medicine. Methods Mol Med 114: , 25–58. |
[31] | Van Broeck B , Timmers M , Ramael S , Bogert J , Shaw LM , Mercken M , Slemmon J , Van Nueten L , Engelborghs S , Streffer JR ((2016) ) Impact of frequent cerebrospinal fluid sampling on Aβ levels: Systematic approach to elucidate influencing factors. Alzheimers Res Ther 8: , 21. |
[32] | Zhou L , Chavez-Gutierrez L , Bockstael K , Sannerud R , Annaert W , May PC , Karran E , De Strooper B ((2011) ) Inhibition of beta-secretase in vivo via antibody binding to unique loops (D and F) of BACE1. J Biol Chem 286: , 8677–8687. |
[33] | Struyfs H , Van Broeck B , Timmers M , Fransen E , Sleegers K , Van Broeckhoven C , De Deyn PP , Streffer JR , Mercken M , Engelborghs S ((2015) ) Diagnostic accuracy of cerebrospinal fluid amyloid-beta isoforms for early and differential dementia diagnosis. J Alzheimers Dis 45: , 813–822. |
[34] | Van Broeck B , Borgers M , Meulders G , Hermans B , Dhuyvetter D , Borghys H , Mercken M ((2013) ) Simultaneous evaluation of Aβ1-37/38/40/42 levels after treatment with secretase inhibitors and modulators using a novel immunoassay. Neurodegener Dis 11: . |
[35] | Lewczuk P , Kamrowski-Kruck H , Peters O , Heuser I , Jessen F , Popp J , Burger K , Hampel H , Frolich L , Wolf S , Prinz B , Jahn H , Luckhaus C , Perneczky R , Hull M , Schroder J , Kessler H , Pantel J , Gertz HJ , Klafki HW , Kolsch H , Reulbach U , Esselmann H , Maler JM , Bibl M , Kornhuber J , Wiltfang J ((2010) ) Soluble amyloid precursor proteins in the cerebrospinal fluid as novel potential biomarkers of Alzheimer’s disease: A multicenter study. Mol Psychiatry 15: , 138–145. |
[36] | Shaw LM , Vanderstichele H , Knapik-Czajka M , Figurski M , Coart E , Blennow K , Soares H , Simon AJ , Lewczuk P , Dean RA , Siemers E , Potter W , Lee VM , Trojanowski JQ , Alzheimer’s Disease Neuroimaging Initiative ((2011) ) Qualification of the analytical and clinical performance of CSF biomarker analyses in ADNI. Acta Neuropathol 121: , 597–609. |
[37] | Dean R , Shaw LM , Waligorska TW , Korecka M , Figurski M , Trojanowski JQ , Sundell K , Andersen SW , Holdridge K , Lachno DR , Talbot J , Siemers E ((2014) ) Inclusion of patients with Alzheimer’s disease pathology in solanezumab expedition 3 using florbetapir pet imaging or inno-bia alzbio3 CSF Aβ1-42. Alzheimers Dement 10: , P811. |
[38] | Slemmon JR , Shapiro A , Mercken M , Streffer J , Romano G , Andreasen N , Zetterberg H , Blennow K ((2015) ) Impact of cerebrospinal fluid matrix on the detection of Alzheimer’s disease with Abeta42 and influence of disease on the total-Abeta42/Abeta40 ratio. J Neurochem 135: , 1049–1058. |
[39] | Bjerke M , Andreasson U , Kuhlmann J , Portelius E , Pannee J , Lewczuk P , Umek RM , Vanmechelen E , Vanderstichele H , Stoops E , Lewis J , Vandijck M , Kostanjevecki V , Jeromin A , Salamone SJ , Schmidt O , Matzen A , Madin K , Eichenlaub U , Bittner T , Shaw LM , Zegers I , Zetterberg H , Blennow K ((2016) ) Assessing the commutability of reference material formats for the harmonization of amyloid-beta measurements. Clin Chem Lab Med 54: , 1177–1191. |
[40] | Cicognola C , Chiasserini D , Eusebi P , Andreasson U , Vanderstichele H , Zetterberg H , Parnetti L , Blennow K ((2016) ) No diurnal variation of classical and candidate biomarkers of Alzheimer’s disease in CSF. Mol Neurodegener 11: , 65. |
[41] | Mattsson N , Andreasson U , Persson S , Arai H , Batish SD , Bernardini S , Bocchio-Chiavetto L , Blankenstein MA , Carrillo MC , Chalbot S , Coart E , Chiasserini D , Cutler N , Dahlfors G , Duller S , Fagan AM , Forlenza O , Frisoni GB , Galasko D , Galimberti D , Hampel H , Handberg A , Heneka MT , Herskovits AZ , Herukka SK , Holtzman DM , Humpel C , Hyman BT , Iqbal K , Jucker M , Kaeser SA , Kaiser E , Kapaki E , Kidd D , Klivenyi P , Knudsen CS , Kummer MP , Lui J , Llado A , Lewczuk P , Li QX , Martins R , Masters C , McAuliffe J , Mercken M , Moghekar A , Molinuevo JL , Montine TJ , Nowatzke W , O’Brien R , Otto M , Paraskevas GP , Parnetti L , Petersen RC , Prvulovic D , de Reus HP , Rissman RA , Scarpini E , Stefani A , Soininen H , Schroder J , Shaw LM , Skinningsrud A , Skrogstad B , Spreer A , Talib L , Teunissen C , Trojanowski JQ , Tumani H , Umek RM , Van Broeck B , Vanderstichele H , Vecsei L , Verbeek MM , Windisch M , Zhang J , Zetterberg H , Blennow K ((2011) ) The Alzheimer’s Association external quality control program for cerebrospinal fluid biomarkers. Alzheimers Dement 7: , 386–395. e386. |
[42] | Goedert M ((1993) ) Tau protein and the neurofibrillary pathology of Alzheimer’s disease. Trends Neurosci 16: , 460–465. |
[43] | Blennow K , Wallin A , Agren H , Spenger C , Siegfried J , Vanmechelen E ((1995) ) Tau protein in cerebrospinal fluid: A biochemical marker for axonal degeneration in Alzheimer disease? Mol Chem Neuropathol 26: , 231–245. |
[44] | Hesse C , Rosengren L , Vanmechelen E , Vanderstichele H , Jensen C , Davidsson P , Blennow K ((2000) ) Cerebrospinal fluid markers for Alzheimer’s disease evaluated after acute ischemic stroke. J Alzheimers Dis 2: , 199–206. |
[45] | Goedert M , Jakes R , Crowther RA , Six J , Lubke U , Vandermeeren M , Cras P , Trojanowski JQ , Lee VM ((1993) ) The abnormal phosphorylation of tau protein at Ser-202 in Alzheimer disease recapitulates phosphorylation during development. Proc Natl Acad Sci U S A 90: , 5066–5070. |
Figures and Tables
Fig.1
Correlation of β-site AβPP-cleaving enzyme-1 (BACE1) protein levels in CSF with age in healthy elderly participants. A Pearson correlation coefficient was calculated to evaluate the possible correlation between BACE1 and age. Regression line R2 = 0.1114; statistical significant level was set at 0.05. n = 38; rho = 0.33; p = 0.0406.
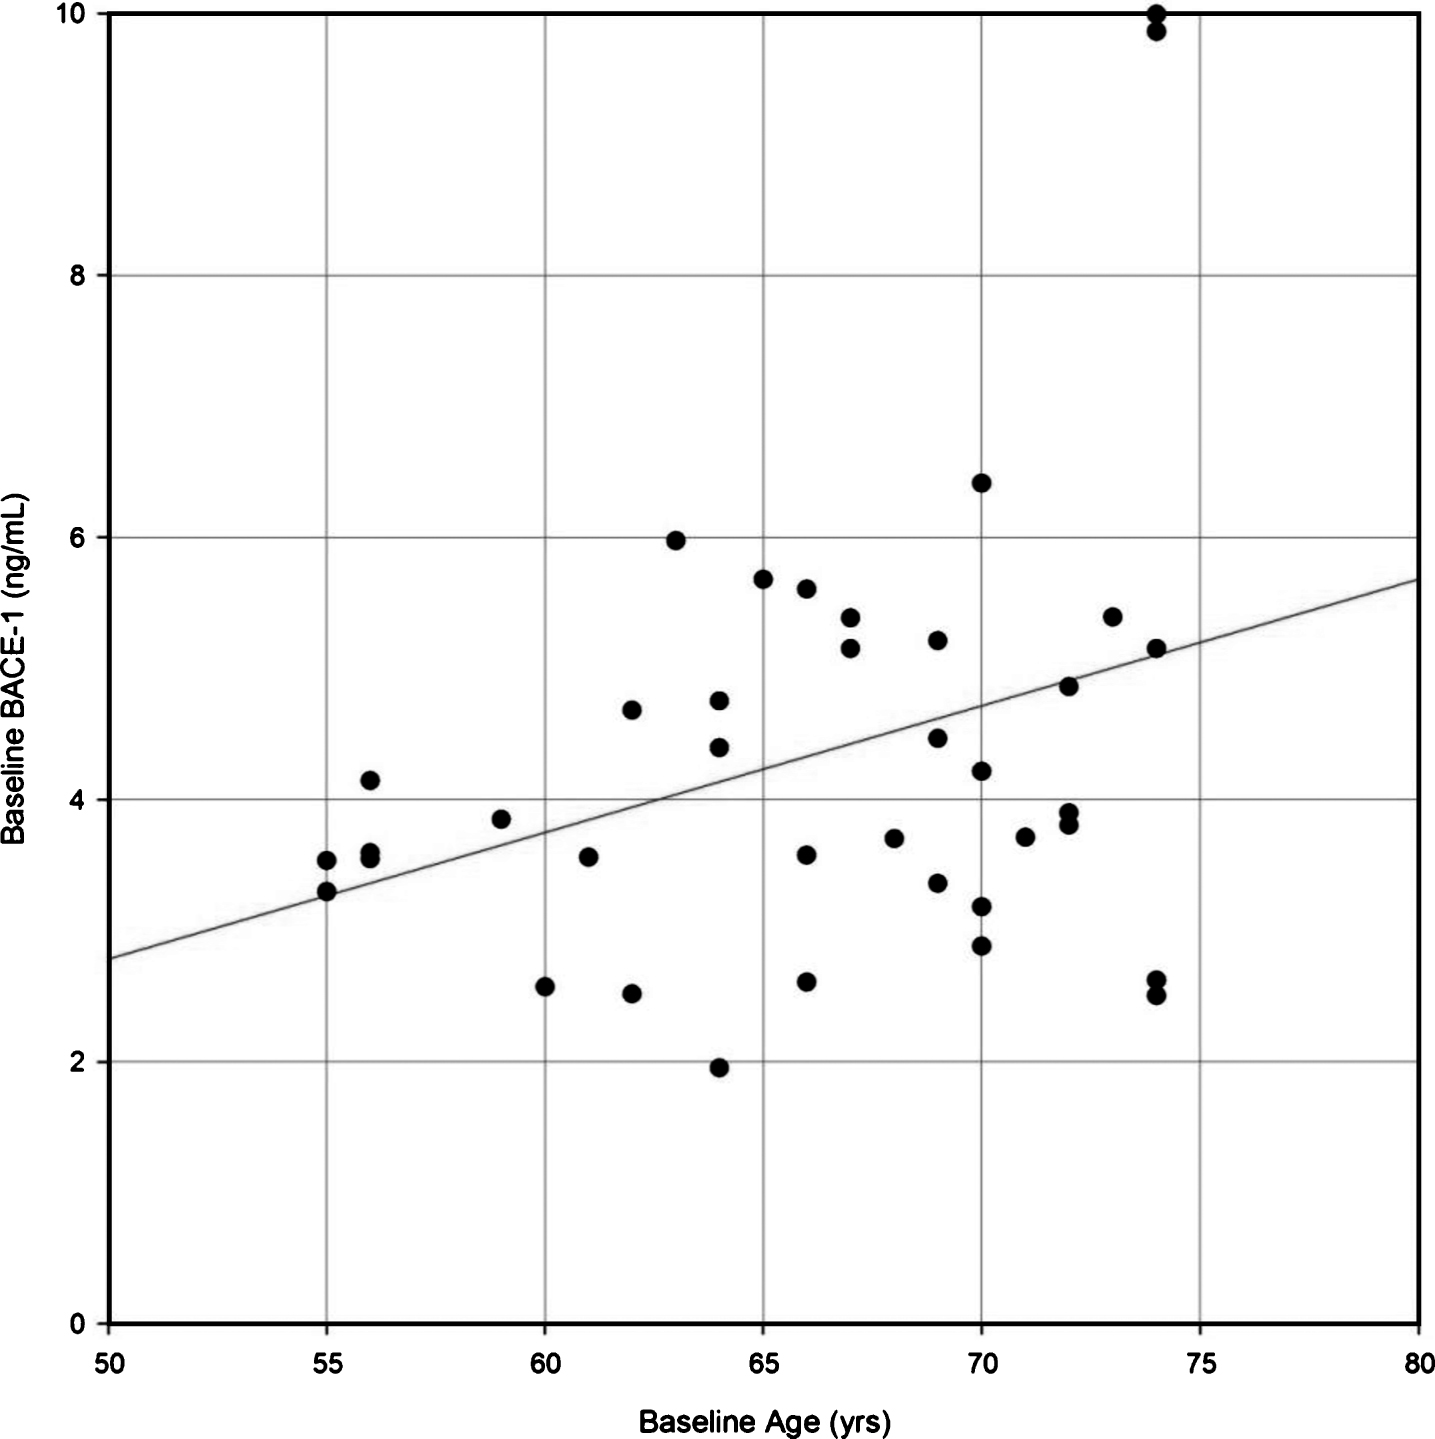
Fig.2
Correlation of β-site AβPP-cleaving enzyme-1 (BACE1) protein levels with Aβ species (Aβ1 - 42, Aβ1 - 40, Aβ1 - 38, Aβ1 - 37) at baseline in CSF of healthy elderly for all participants (A, D, G, J), for APOE ɛ4 allele carriers (B, E, H, K), and for APOE ɛ4 non-carriers (C, F, I, L) measured by MSD4-plex assay system. A Pearson correlation coefficient was calculated to evaluate the possible correlation between BACE1 and Aβ1 - 42 (A-C); between BACE1 and Aβ1 - 40 (D-F); between BACE1 and Aβ1 - 38 (G-I); and between BACE1 and Aβ1 - 37 (K-L) for all, APOE ɛ4 carrier and non-carriers, respectively. Number of participants for whom samples could be analyzed and for which levels were above LOQ are indicated below each panel. p < 0.05 was set as a statistically significant level.
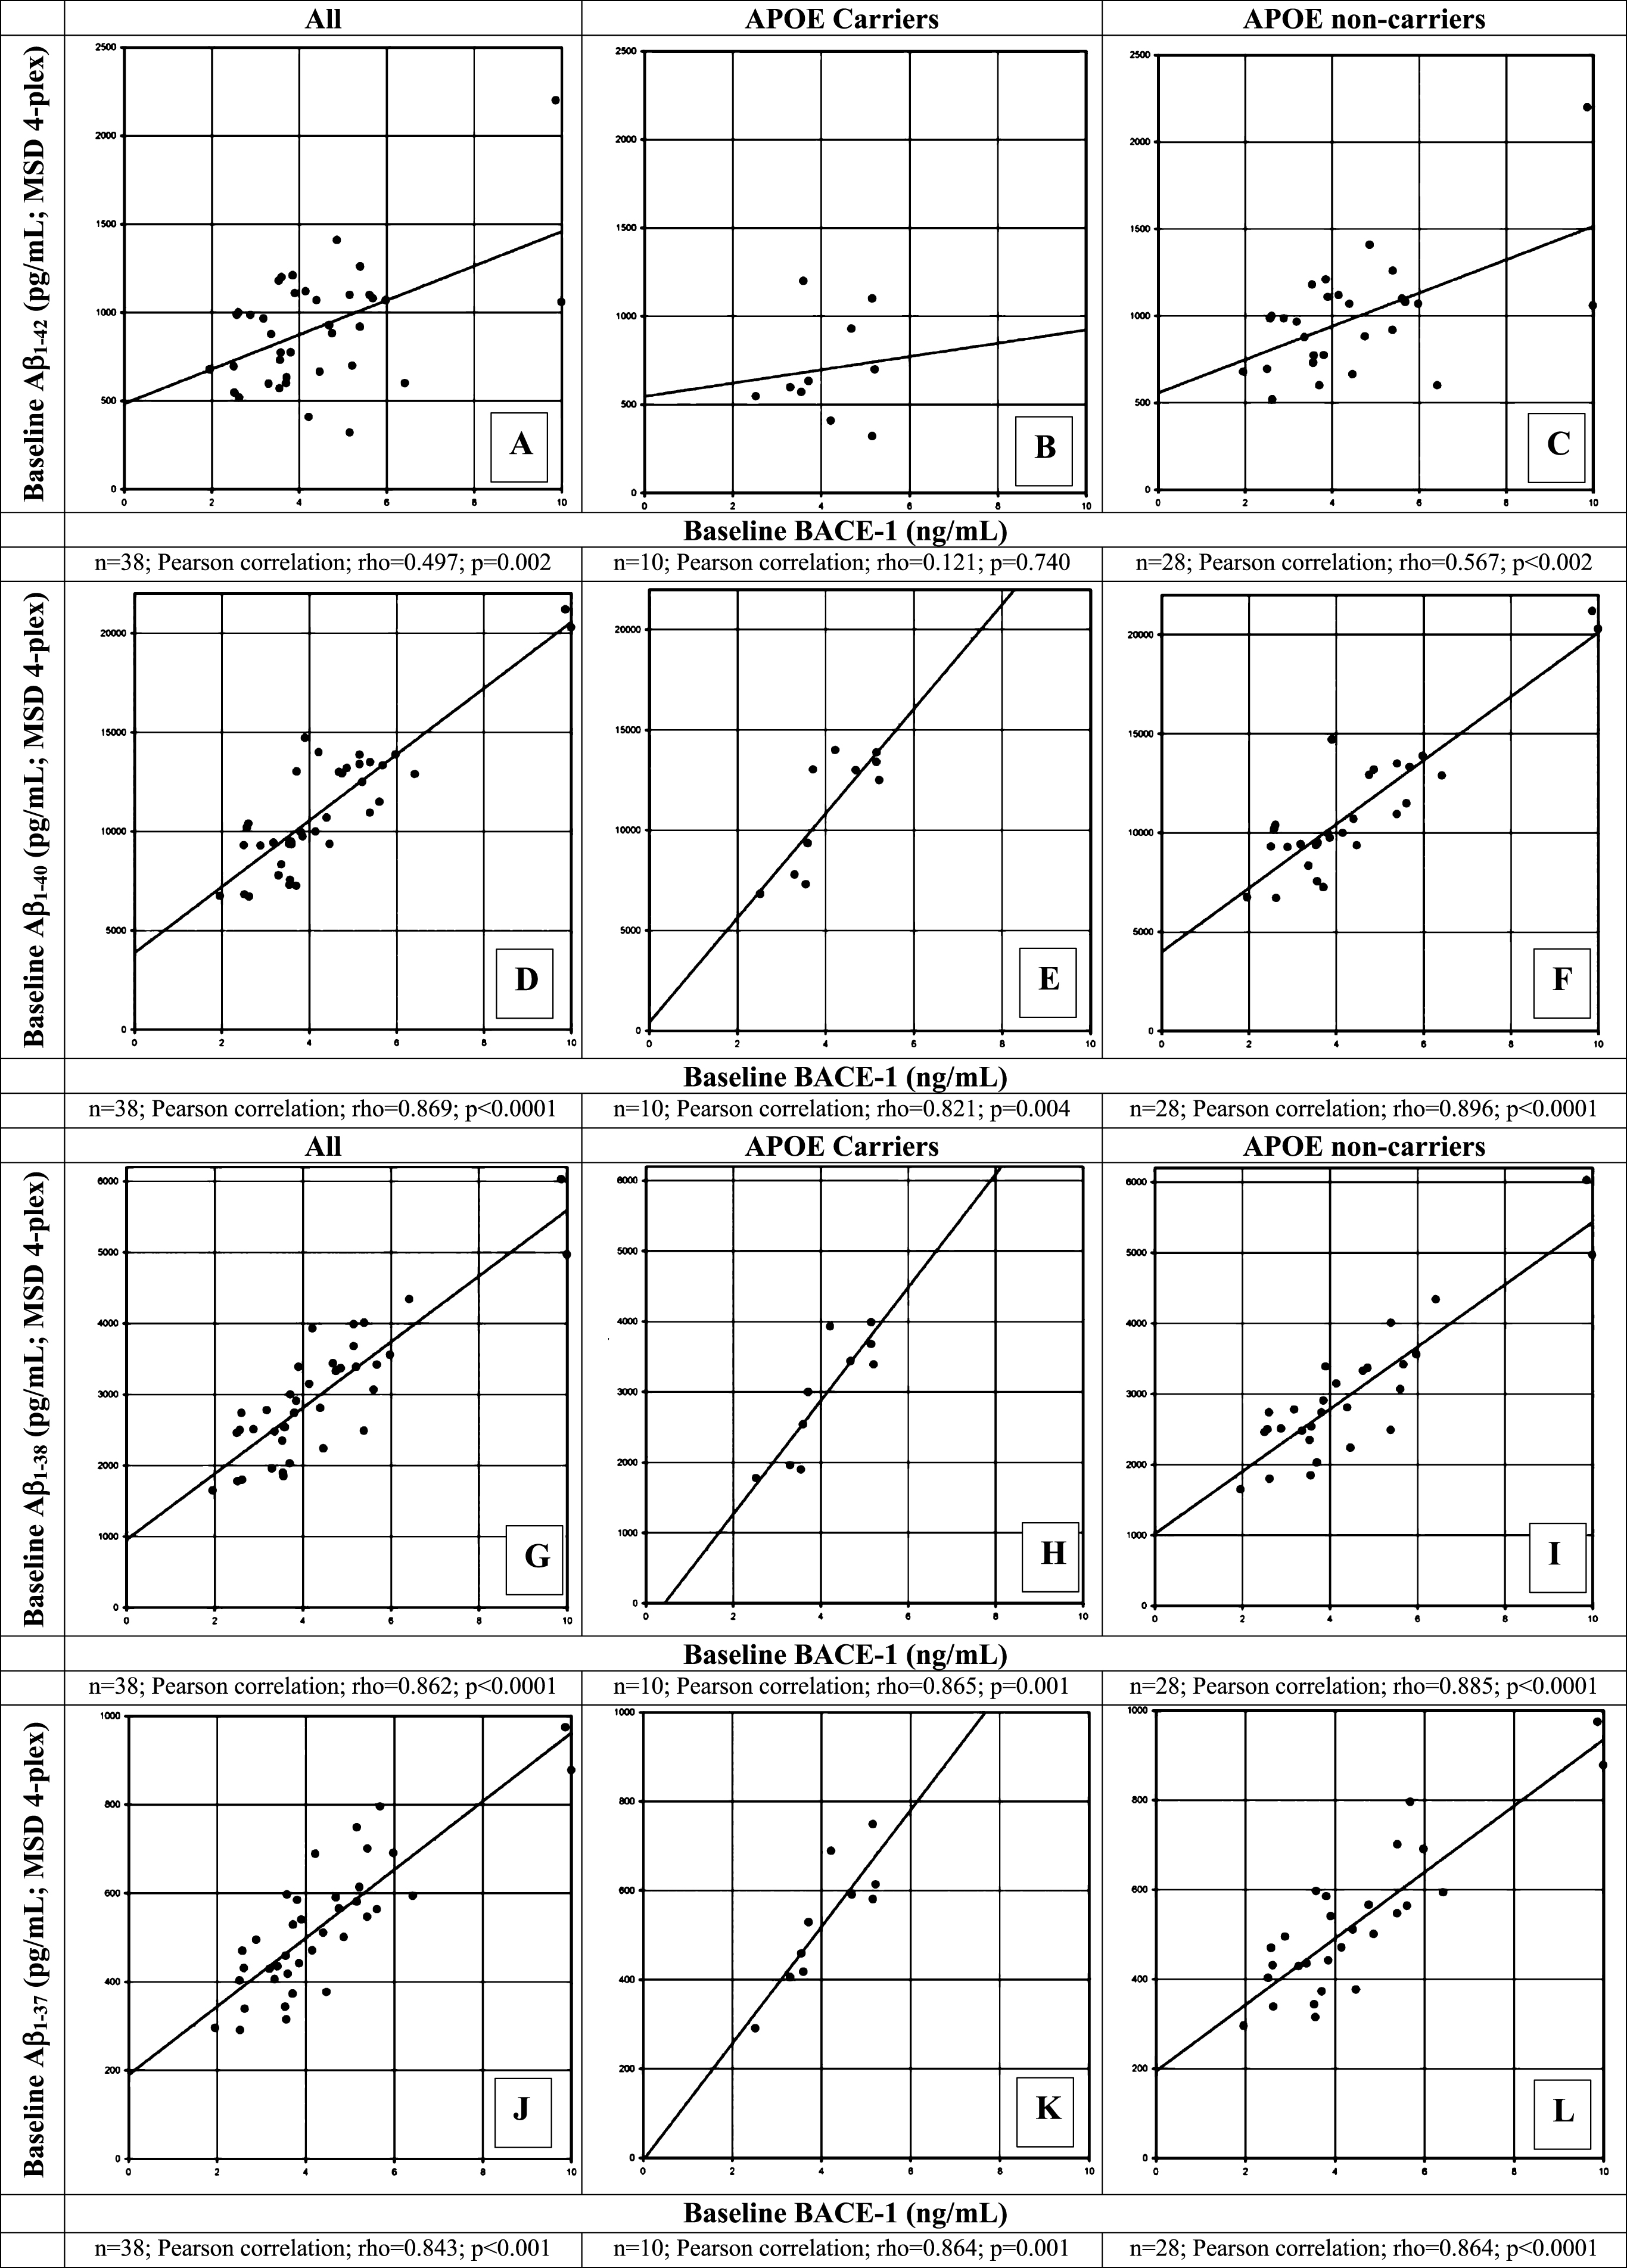
Fig.3
Correlation of β-site AβPP-cleaving enzyme-1 (BACE1) protein levels with sAβPP total (A-C), sAβPPα (D-F), and sAβPPβ (G-I) at baseline in CSF of healthy elderly for all participants (A, D, G), for apolipoprotein (APOE) ɛ4 allele carriers (B, E, H), and for APOE ɛ4 non-carriers (C, F, I). A Pearson correlation coefficient was calculated to evaluate the possible correlation between BACE1 and sAβPP total (A-C); between BACE1 and sAβPPα (D-F); and between BACE1 and sAβPPβ (G-I) for all APOE ɛ4 carriers and non-carrier participants, respectively. Number of participants for whom samples could be analyzed and for which levels were above LOQ are indicated below each panel. p < 0.05 was set as a statistically significant level.
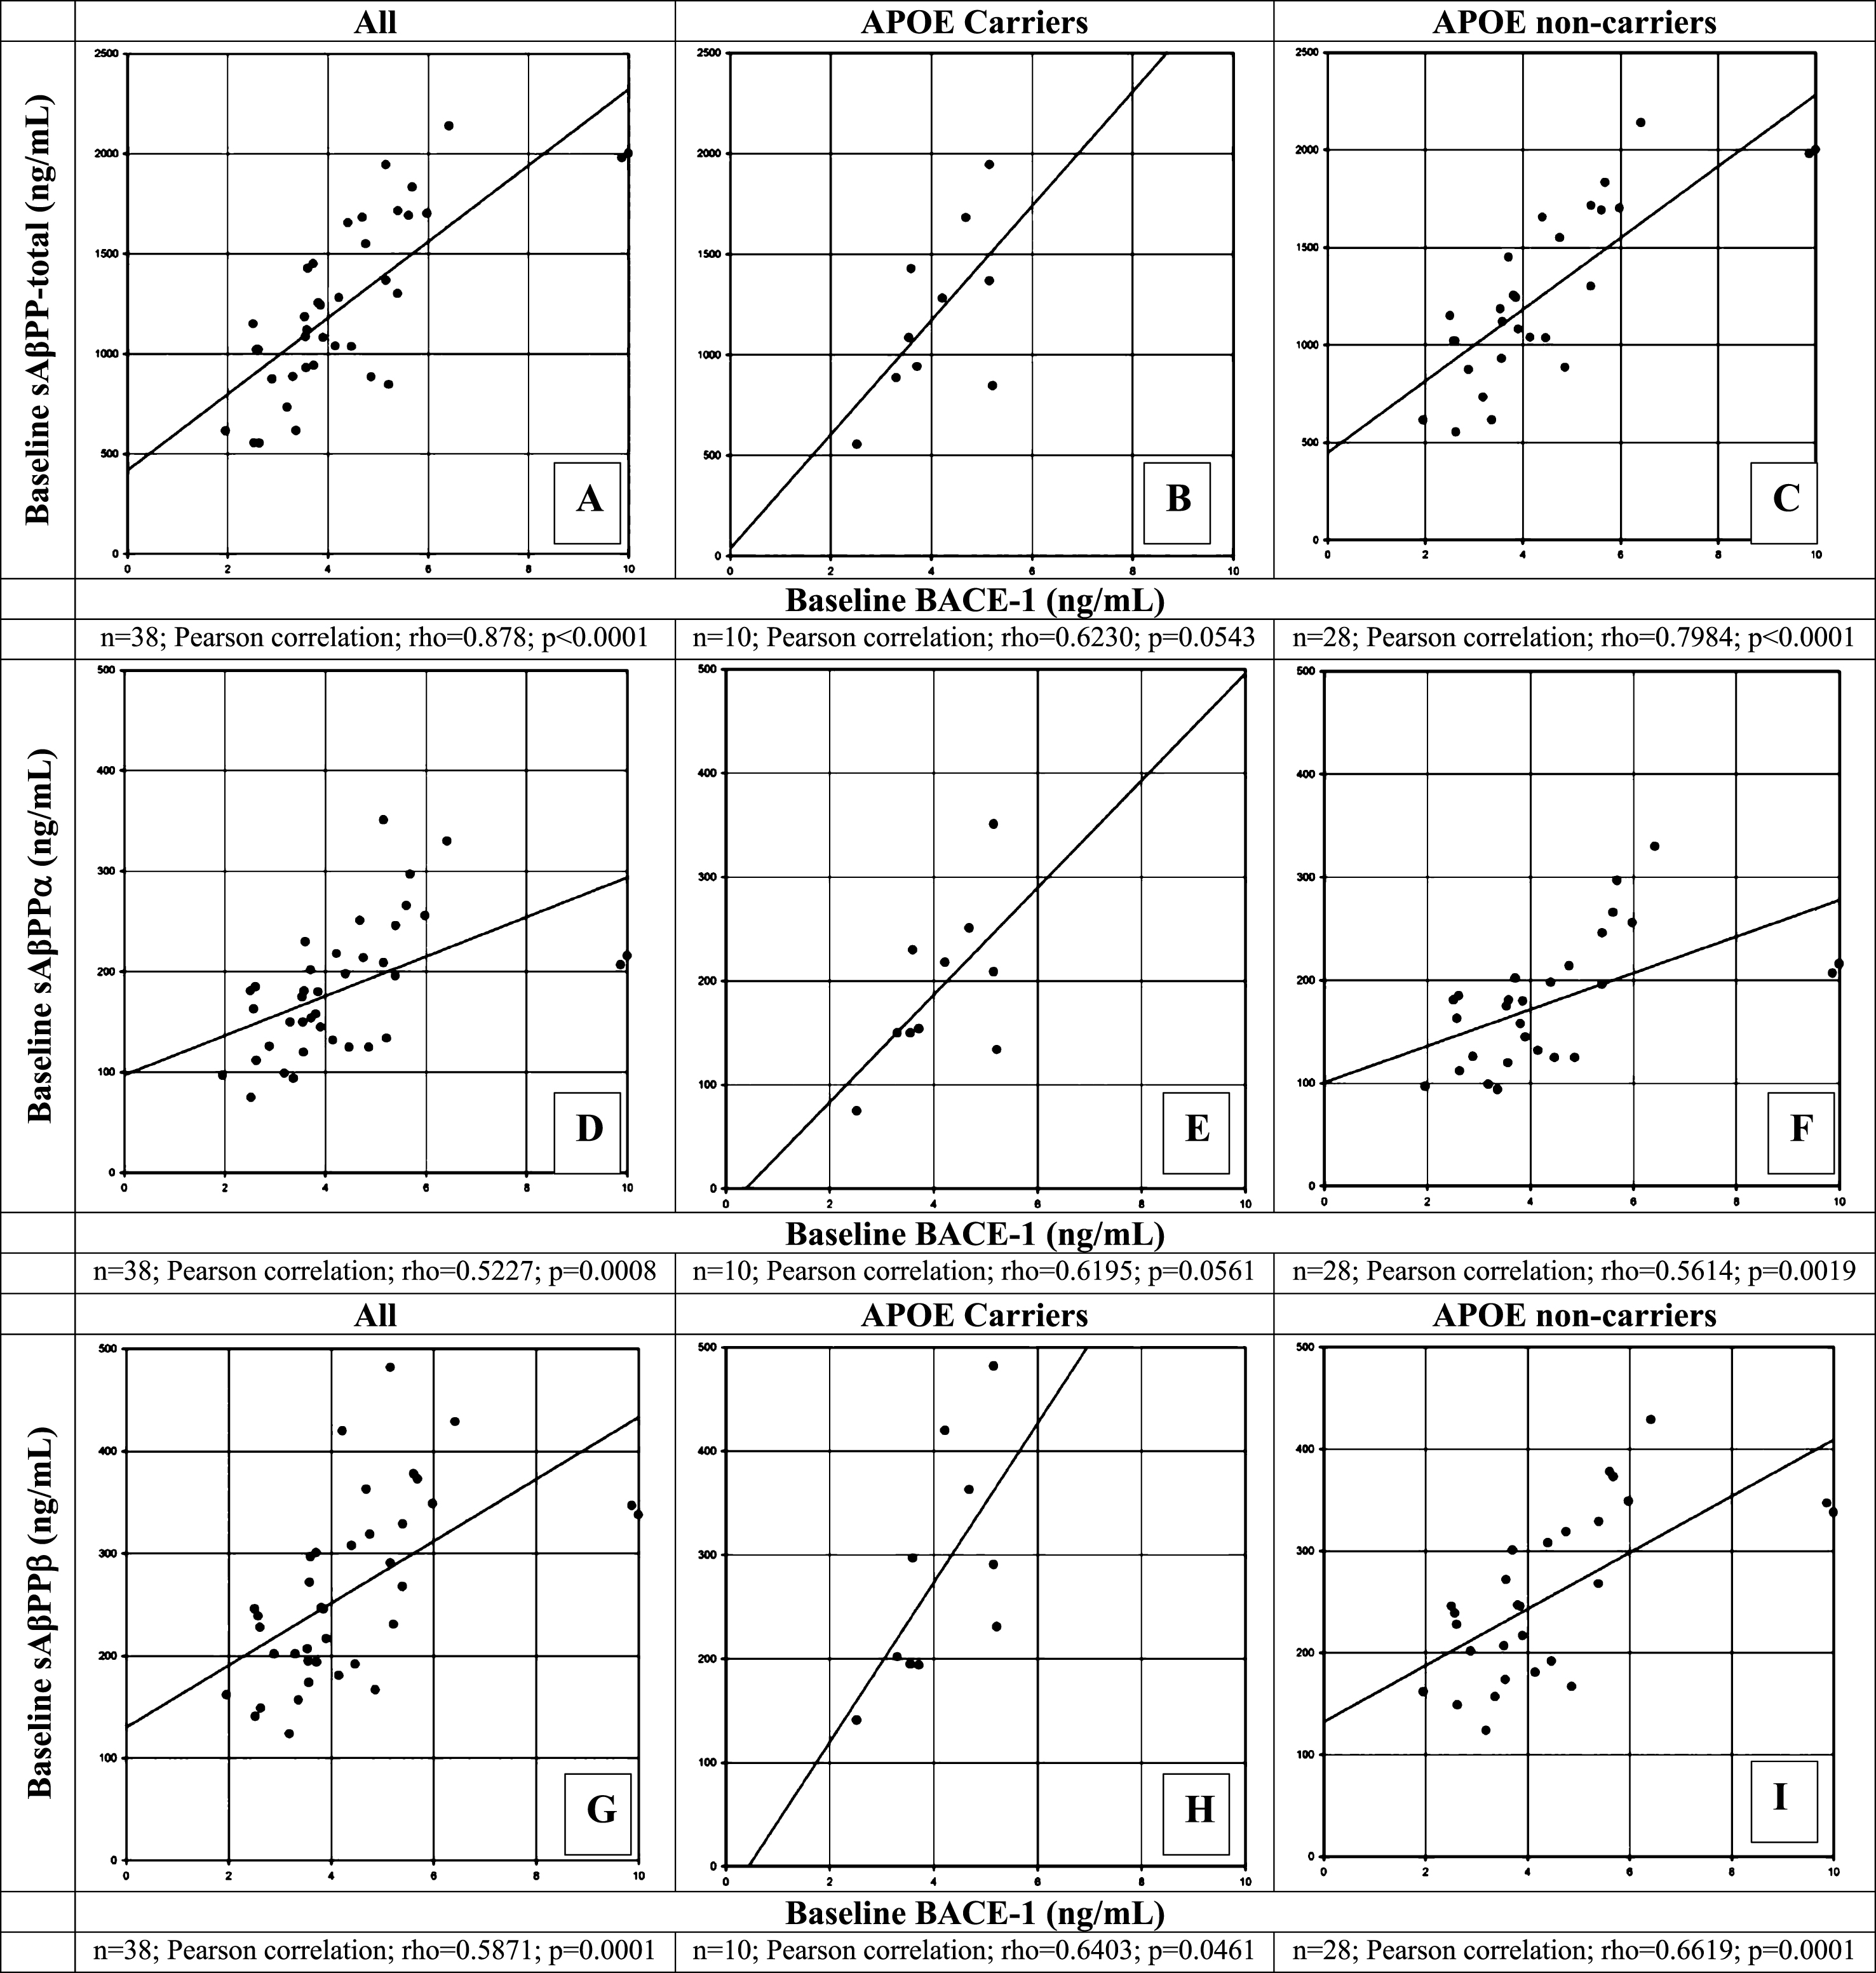
Fig.4
Correlation of β-site AβPP-cleaving enzyme-1 (BACE1) protein levels with Aβ1 - 42 (A-C), phosphorylated tau (p-tau181p, D-F), and total tau (t-tau, G-I) at baseline in CSF of healthy elderly for all participants (A, D, G), for apolipoprotein (APOE) ɛ4 allele carriers (B, E, H),and for APOE ɛ4 non-carriers (C, F, I) measured by the ALZBio3 (xMAP) assay. A Pearson correlation coefficient was calculated to evaluate the possible correlation between BACE1 and Aβ1 - 42 (A-C); between BACE1 and p-tau181p (D-F); and between BACE1 and t-tau (G-I) for all, APOE ɛ4 carriers and non-carriers, respectively. Number of participants for whom samples could be analyzed and for which levels were above LOQ are indicated below each panel. p < 0.05 was set as a statistically significant level.
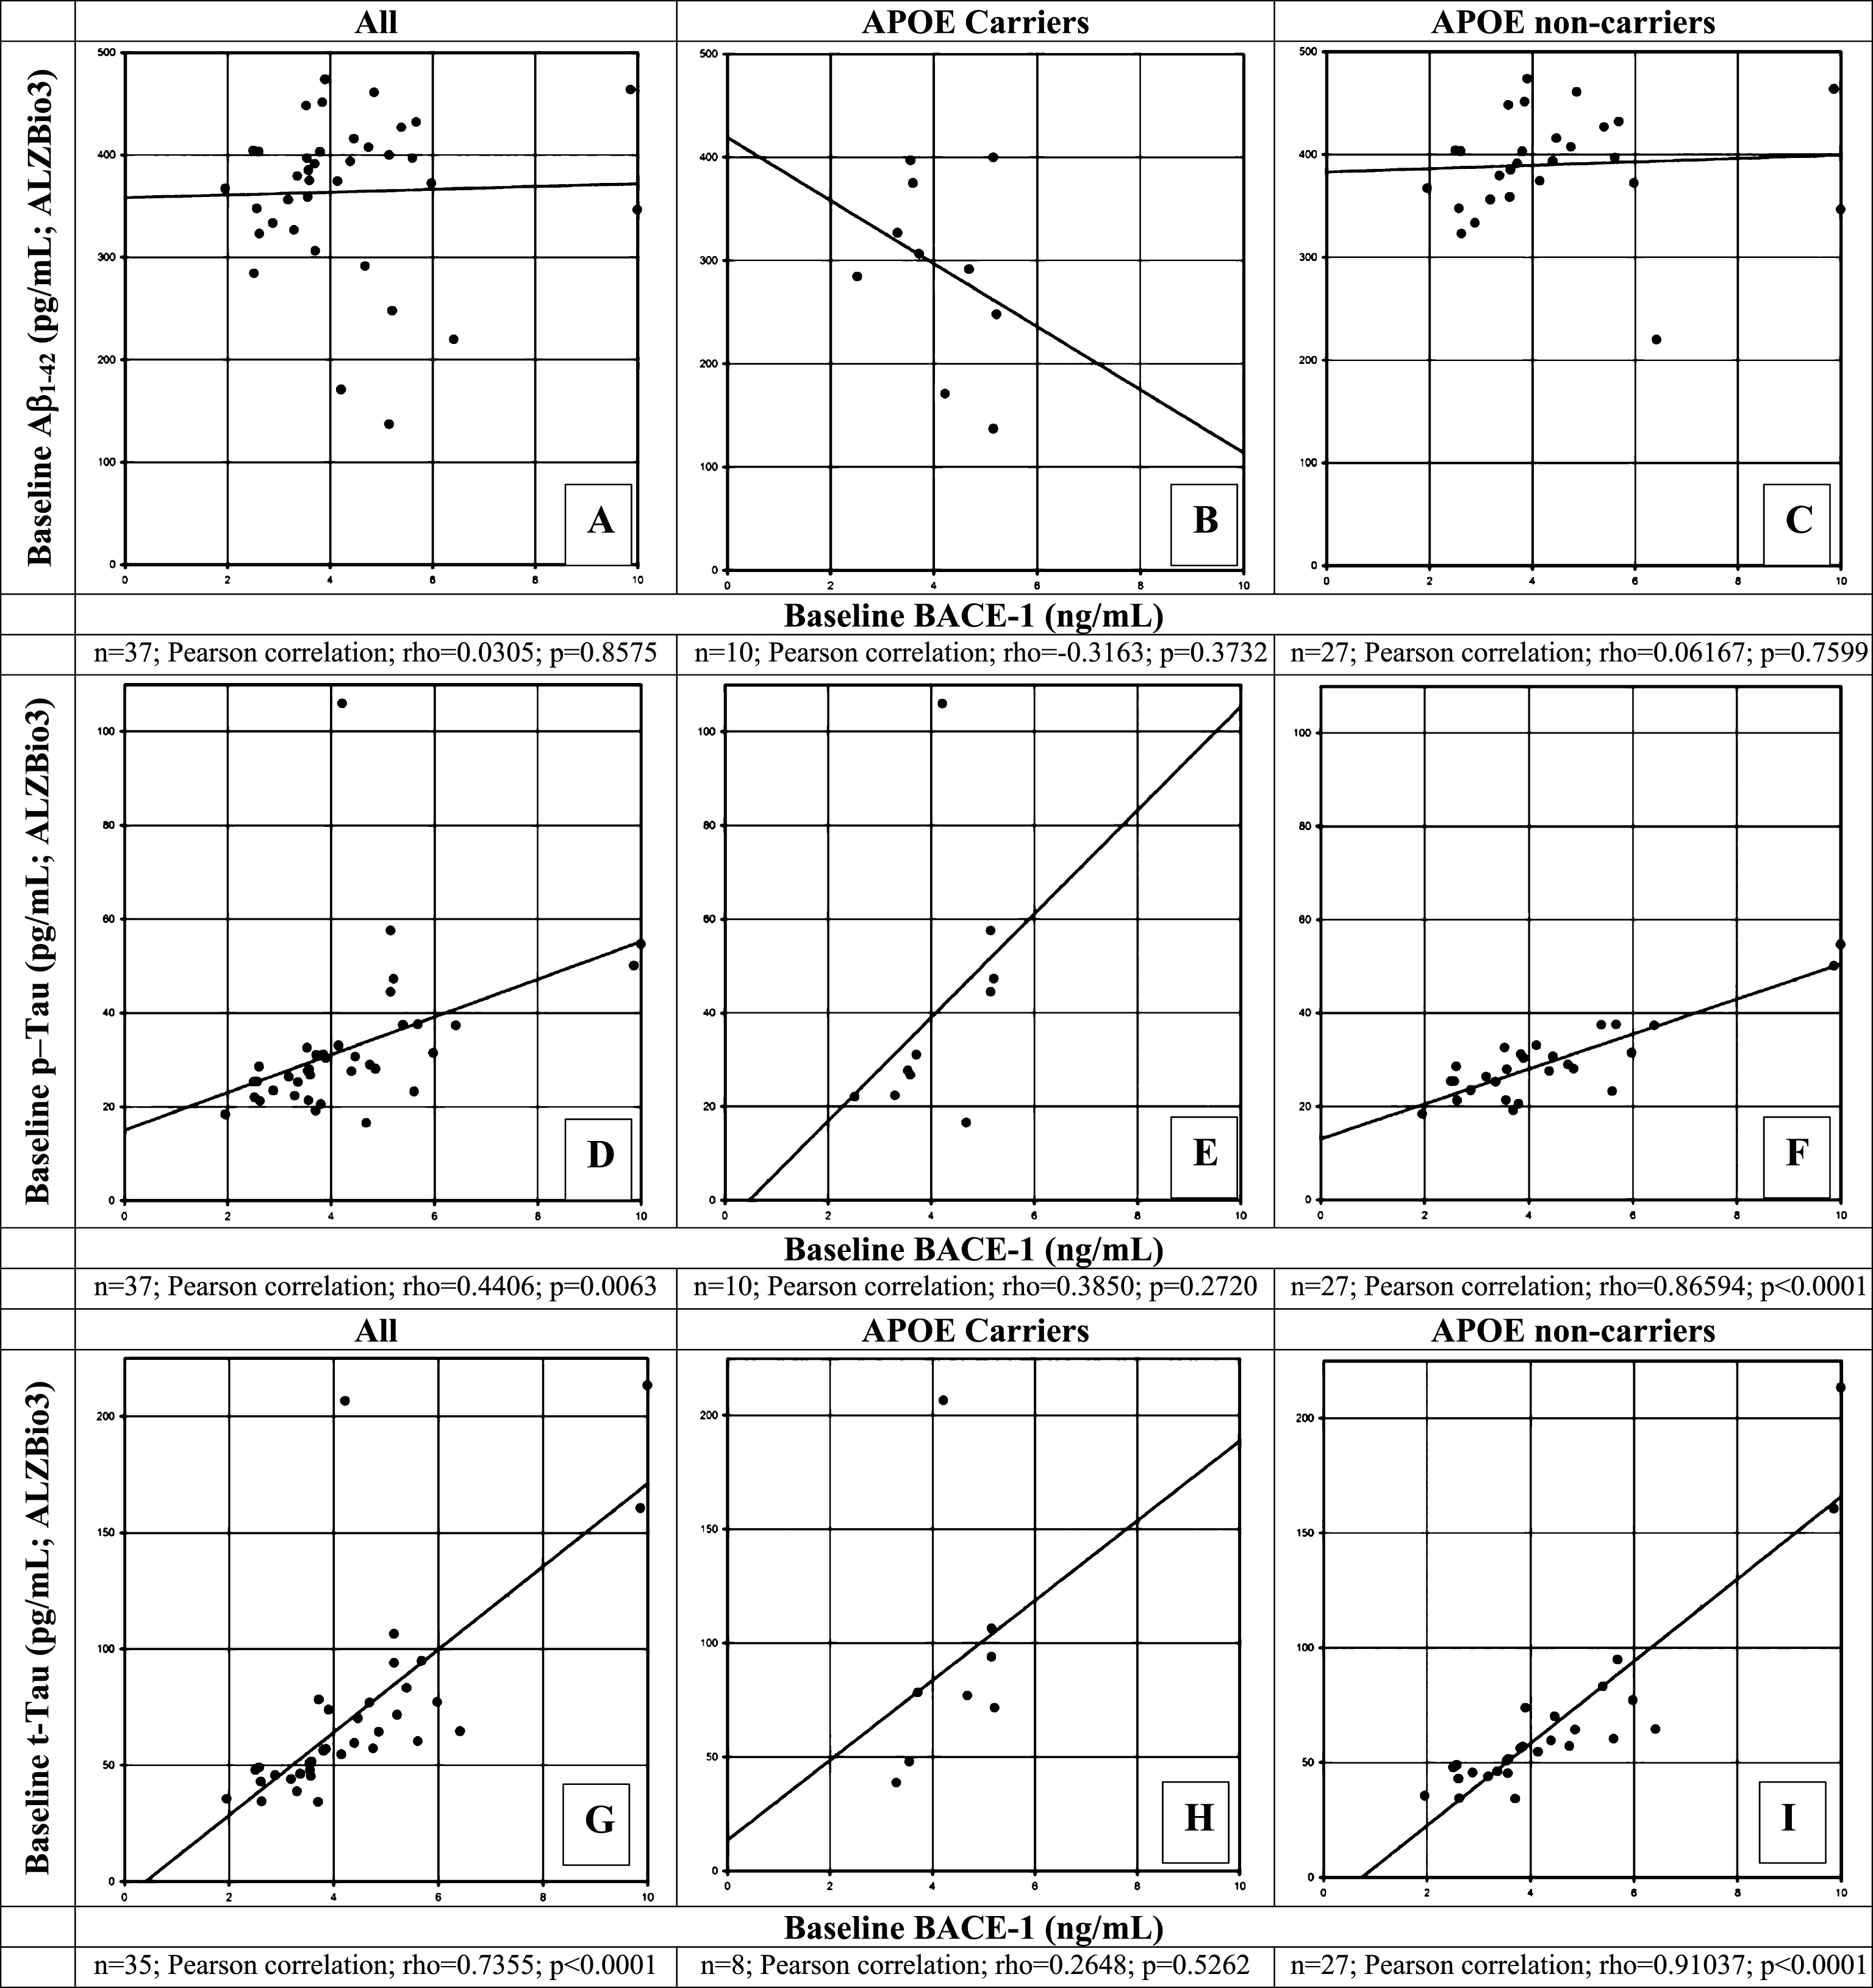
Fig.5
Percent change in BACE1 levels from Day 1 baseline to Day 14 for those with > 20% change of BACE1 protein levels from baseline following repeated once daily dosing with JNJ-54861911 at 5, 25, 30, 50, and 90 mg or placebo for 14 days. Data are represented as individual and mean percent change (n = 8/38) in BACE1 from Day 1 baseline to Day 14 (24-h post dose).
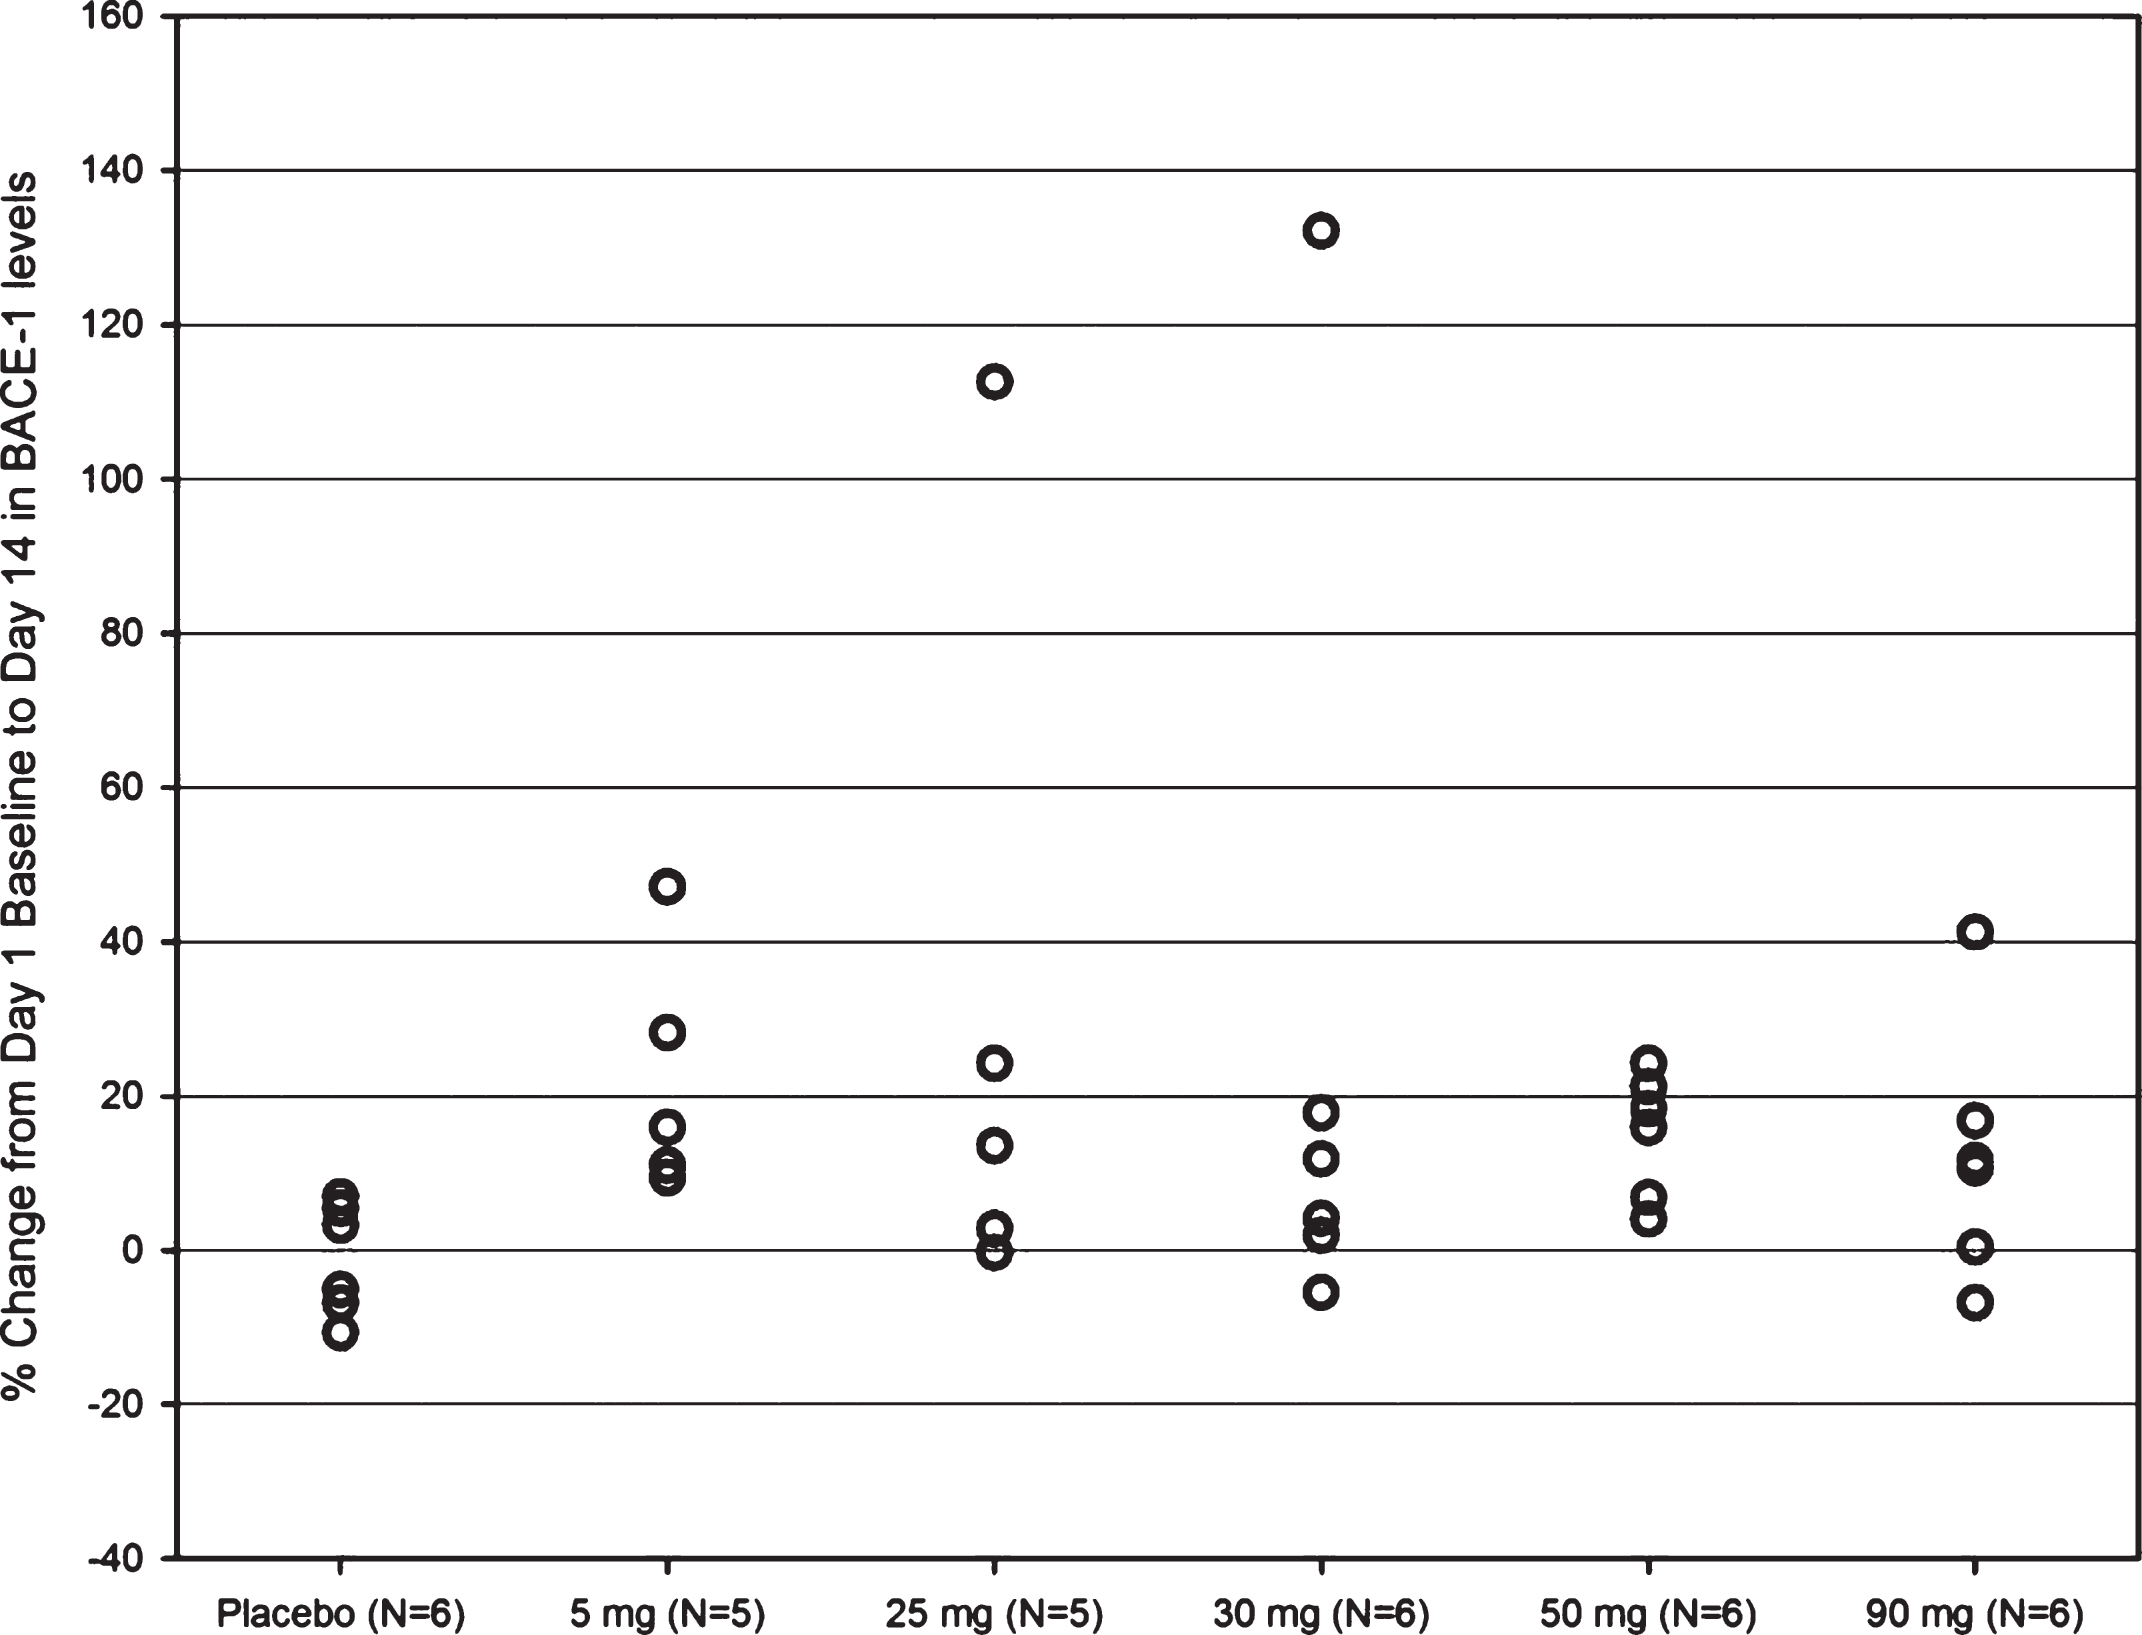
Table 1
Demographics and baseline cerebrospinal fluid (CSF) biomarker concentrations for study participants
| Demographic and Baseline Characteristics for CSF | |
| Cohorts: ALZ1002 | |
| Pooled CSF Subjects | |
| ALZ1002 | |
| n | 38 |
| Sex, Male, n (%) | 25 (65.8%) |
| Age, years | |
| Mean (SD) | 66.3 (5.93) |
| Median (Range) | 67 (55, 74) |
| Race, White, n (%) | 36 (94.7%) |
| APOE E4 Carrier Status, n (%) | |
| No | 28 (73.7%) |
| Yes | 10 (26.3%) |
| Aβ1 - 37, pg/mL, n | 38 |
| Mean (SD) | 526.2 (157.53) |
| Median (Range) | 506 (291, 975) |
| Aβ1 - 38, pg/mL, n | 38 |
| Mean (SD) | 2977.1 (925.54) |
| Median (Range) | 2975 (1650, 6030) |
| Aβ1 - 40, pg/mL, n | 38 |
| Mean (SD) | 11143.2 (3301.40) |
| Median (Range) | 10300 (6720, 21200) |
| Aβ1 - 42, pg/mL, n | 38 |
| Mean (SD) | 908.8 (337.02) |
| Median (Range) | 924 (321, 2200) |
| Aβ1 - 42/Aβ1 - 40 Ratio, n | 38 |
| Mean (SD) | 0.08 (0.024) |
| Median (Range) | 0.08 (0.02, 0.13) |
| Aβ1 - 42 (AlzBio3), pg/mL, n | 37 |
| Mean (SD) | 364.2 (76.86) |
| Median (Range) | 380 (137, 474) |
| T-tau, pg/mL, n | 35 |
| Mean (SD) | 71.3 (42.44) |
| Median (Range) | 57 (34, 213) |
| P-tau181, pg/mL, n | 37 |
| Mean (SD) | 32.4 (15.83) |
| Median (Range) | 28 (17, 106) |
| sAβPP Total, ng/mL, n | 38 |
| Mean (SD) | 1248.1 (433.21) |
| Median (Range) | 1169 (555, 2140) |
| sAβPP alpha, ng/mL, n | 38 |
| Mean (SD) | 182.8 (64.67) |
| Median (Range) | 181 (75, 351) |
| sAβPPβ, ng/mL, n | 38 |
| Mean (SD) | 262.2 (88.81) |
| Median (Range) | 246 (124, 482) |
| BACE-1, ng/mL, n | 38 |
| Mean (SD) | 4.4 (1.72) |
| Median (Range) | 3.9 (2.0, 10.0) |
Table 2
Participant baseline characteristics and CSF markers for those with >20% change of BACE1 protein levels from baseline following repeated once daily dosing with JNJ-54861911 at 5, 25, 30, 50, and 90 mg or placebo for 14 days
| Age | Sex | Treatment | APOE ɛ4 | Baseline | Day 14 BACE1 | BACE1 | Baseline CSF Markers | |||||||||
| mg QD | carrier | BACE1 | ng/mL | % change | Aβ1 - 37 | Aβ1 - 38 | Aβ1 - 40 | Aβ1 - 42 | ALZBIO3 | p-tau181p | t-tau | sAβPP | sAβPPα | sAβPPβ | ||
| status | ng/mL | (24 h post | from | pg/mL | pg/mL | pg/mL | pg/mL | Aβ1 - 42 | pg/mL | pg/mL | Total | ng/mL | ng/mL | |||
| dose) | baseline | pg/mL | ng/mL | |||||||||||||
| 66 | F | 30 | N | 2.6035 | 6.0455 | 132.2 | 431 | 2740 | 10400 | 1000 | 403.5 | 28.6 | 43 | 1022 | 185 | 228 |
| 64 | M | 90 | N | 1.952 | 2.7565 | 41.2 | 296 | 1650 | 6750 | 679 | 367.3 | 18.4 | 35.6 | 616 | 97 | 162 |
| 72 | M | 5 | N | 3.8965 | 5.73 | 47.1 | 541 | 3390 | 14720 | 1110 | 473.8 | 30.4 | 73.9 | 1082 | 145 | 217 |
| 64 | M | 5 | N | 4.75 | 6.0885 | 28.2 | 566 | 3330 | 12930 | 882 | 407.5 | 29 | 57.2 | 1551 | 214 | 319 |
| 69 | M | 50 | N | 4.464 | 5.412 | 21.2 | 377 | 2240 | 9370 | 665 | 416 | 30.7 | 70.2 | 1037 | 125 | 192 |
| 63 | M | 50 | N | 5.9745 | 7.419 | 24.2 | 691 | 3560 | 13890 | 1070 | 372.4 | 31.5 | 77.2 | 1702 | 256 | 349 |
| 70 | M | 25 (solid) | N | 6.413 | 7.965 | 24.2 | 594 | 4340 | 12900 | 601 | 219.9 | 37.4 | 64.6 | 2140 | 330 | 429 |
| 59 | M | 25 (solid) | N | 3.8465 | 8.1775 | 112.6 | 442 | 2910 | 9750 | 1210 | 451.4 | 31.2 | 57 | 1244 | 180 | 246 |
Individual participants (n = 8/38) showing > 20% change from baseline in CSF BACE1 levels are depicted including their baseline biomarker profiles, APOE ɛ4 status and treatment allocation.


