Investigations into Retinal Pathology in the Early Stages of a Mouse Model of Alzheimer’s Disease
Abstract
There is increasing recognition that visual performance is impaired in early stages of Alzheimer’s disease (AD); however, no consensus exists as to the mechanisms underlying this visual dysfunction, in particular regarding the timing, nature, and extent of retinal versus cortical pathology. If retinal pathology presents sufficiently early, it offers great potential as a source of novel biomarkers for disease diagnosis. The current project utilized an array of immunochemical and molecular tools to perform a characterization of retinal pathology in the early stages of disease progression using a well-validated mouse model of AD (APPSWE/PS1ΔE9). Analytical endpoints included examination of aberrant amyloid and tau in the retina, quantification of any neuronal degeneration, delineation of cellular stress responses of neurons and particularly glial cells, and investigation of oxidative stress. Brain, eyes, and optic nerves were taken from transgenic and wild-type mice of 3 to 12 months of age and processed for immunohistochemistry, qPCR, or western immunoblotting. The results revealed robust expression of the human APP transgene in the retinas of transgenic mice, but a lack of identifiable retinal pathology during the period when amyloid deposits were dramatically escalating in the brain. We were unable to demonstrate the presence of amyloid plaques, dystrophic neurites, neuronal loss, macro- or micro-gliosis, aberrant cell cycle re-entry, oxidative stress, tau hyperphosphorylation, or upregulations of proinflammatory cytokines or stress signaling molecules in the retina. The overall results do not support the hypothesis that detectable retinal pathology occurs concurrently with escalating amyloid deposition in the brains of APPSWE/PS1ΔE9 mice.
INTRODUCTION
Alzheimer’s disease (AD) is an age-related, progressive neurodegenerative disorder that is characterized histopathologically by neuronal loss, accumulation of senile plaques composed of aggregated amyloid-β (Aβ) peptides, and the presence of neurofibrillary tangles consisting of hyperphosphorylated tau [1]. In recent years, a variety of transgenic mouse models of AD have been developed. The prudent use of such models can increase our understanding of the pathogenesis of AD, provide a platform to screen potential therapies, and assist in the search for novel biomarkers to detect and monitor disease progression [2]. The development of a sensitive biomarker that can be used to accurately diagnose AD concurrent with, or even prior to, the onset of cognitive impairment is proving one of the major challenges in AD research. One area of focus is the eye, which, uniquely within the central nervous system, is ideally suited to modern, non-invasive imaging techniques [3, 4]. Indeed, the retina [5] and its associated optic nerve [6] have been termed “windows to the brain”. A key issue when considering the retina as a source of biomarkers for AD relates to whether pathological events actually manifest to a measurable degree at sufficiently early time points to prove diagnostically useful. To date, the accumulated evidence is equivocal.
It has long been recognized that patients with AD have difficulties with complex visual processing [7]. It is less widely known, but incontrovertibly the case, that many AD patients have impairments in “lower” levels of visual processing, including contrast sensitivity, color vision, stereoacuity, and visual acuity [8, 9]. Elucidating the etiology of these impairments, however, has not been straightforward, owing to the difficulty in discriminating retinal defects from those originating in the cortex. Nevertheless, pathology within the pre-cortical visual system, in particular in retinal ganglion cells (RGCs), has been proposed as one mechanism that could underlie AD-associated visual impairments. Research conducted to date in AD patients provides limited support for this hypothesis, although it is beset by methodological limitations. A number of early histological studies found RGC loss, retinal nerve fiber layer thinning, and axonal degeneration in AD patients when compared to age-matched controls [10–14]. These findings are supported by recent imaging and electrophysiological studies (see [8, 15] for reviews). Other studies, however, have failed to find differences between AD patients and matched controls in RGC density [16] and myelinated axon number [17]. Meanwhile, studies investigating amyloid-β (Aβ) accumulation in the retinas of AD patients have produced similarly disparate results. While some researchers have found evidence for the selective deposition of Aβ [18, 19] or hyperphosphorylated tau [20], the majority of studies to date, notably the rigorous work of Eberhart and colleagues [21], indicate that Aβ and phospho-tau are not deposited in the retina in an analogous way to the brain.
Amyloid plaques have been detected in the retinas of transgenic mouse models of AD in advanced stages of the disease [19, 22–25]. Intriguingly, one study has demonstrated Aβ accumulation in retina prior to that in brain [18]; however, no consensus has been reached about the timing and extent of Aβ accumulation in the retina, or its spatio-temporalrelationship to any pathological changes to neurons or glia. As reasoned by Krantic and Torriglia [4], there is an urgent need for studies that analyze the retinas of AD mice during the period preceding significant Aβ accumulation. The aim of the current study, therefore, was to utilize an array of histological, immunochemical, and molecular tools to perform a characterization of putative retinal pathology in the early stages of disease progression using a well-validated mouse model of AD (APPSWE/PS1ΔE9). Analytical endpoints included examination of aberrant amyloid and tau in the retina, quantification of any neuronal degeneration, delineation of stress responses of neurons and particularly glial cells, and investigation of oxidative stress.
MATERIALS AND METHODS
Animals and procedures
Double transgenic (APP/PS1) mice expressinga chimeric mouse/human amyloid precursor proteinand mutant human presenilin 1 (B6C3-Tg(APPswe,PSEN1dE9)85Dbo/Mmjax) (stock number: 034829-JAX), and wild-type littermates, were purchased from Jackson Laboratory (Bar Harbor, ME, USA).
This study was approved by the SA Pathology/Central Area Health Local Network Animal Ethics committee and conformed with the Australian Code of Practice for the Care and Use of Animals for Scientific Purposes, 2013. All experiments also conformed to the ARVO Statement for the Use of Animals in Ophthalmic and Vision Research. Mice were housed in a temperature- and humidity-controlled environment with a 12-h light, 12-h dark cycle and were provided with food and water adlibitum.
Tissue processing and immunohistochemistry
A total of 50 transgenic (Tg) and 50 wild-type (WT) mice were used for the study. At each monthly time point, from 3 to 12 months of age, 5 Tg and 5 WT mice were humanely killed. The brain, both eyes, and the optic nerves were carefully dissected. From each animal, the brain, the right eye, and its corresponding optic nerve were immersion fixed and processed for immunohistochemistry, while the left eye and corresponding optic nerve were taken for RT-PCR and western immunoblotting. Tissues for immunohistochemistry were fixed in 10% buffered formalin for at least 24 h. Following fixation, 2 mm coronal slices of the brain were taken starting from the dorsal and proceeding to the caudal portion of the brain. Brain slices, along with the globe and optic nerve, were then processed for routine paraffin-embedded sections. Globes were embedded sagitally, while optic nerves were embedded longitudinally. In all cases, 5 μm serial sections were cut using a rotary microtome. Hematoxylin and eosin staining of retinal sections was performed using a standard methodology. From the right optic nerve of 11-12-month-old animals, a short piece of tissue was removed for resin processing and subsequently toluidine blue staining as previously reported [26].
Colorimetric immunohistochemistry was performed as previously described [27]. Briefly, tissue sections were deparaffinized and endogenous peroxidase activity was blocked with H2O2. For the majority of antibodies, antigen retrieval was performed by microwaving sections in 10 mM citrate (pH 6.0). For detection of Aβ, Aβ1 - 40, and Aβ1 - 42, sections were incubated for 5 min in 100% formic acid followed by retrieval in 1 mM EDTA (pH 8.0). Non-specific labeling was blocked with PBS containing 3% normal horse serum (PBS-NHS). Sections were then incubated overnight at room temperature in primary antibody (in PBS-NHS, see Supplementary Table 1), followed by consecutive incubations with biotinylated secondary antibody (Vector, Burlingame, CA) and streptavidin-peroxidase conjugate (Pierce, Rockford, IL). Color development was achieved using 3’-,3’-diaminobenzidine for 5 min. Sections were counterstained with hematoxylin, dehydrated, cleared in histolene, and mounted. Fluorescent immunohistochemistry was performed using a 3-step procedure (primary antibody, biotinylated secondary antibody, streptavidin-conjugated AlexaFluor 594) as previously described [27]. Sections were mounted using anti-fade mounting medium and examined under a confocal fluorescence microscope. Confirmation of the specificity of antibody labeling was judged by the morphology and distribution of the labeled cells, by the absence of signal when the primary antibody was replaced by isotype/serum controls, by comparison with the expected staining pattern based on our own, and other, previously published results, and, by the detection within retinal samples of a protein at the expected molecular weight by western blotting. To provide positive control samples for the detection of GFAP, cyclin D1, ciliary neurotrophic factor (CNTF) and heme oxygenase-1(HO-1) in tissue sections, we used tissue blocks from a mouse model of branch retinal vein occlusion (BRVO), which shows a pronounced retinal glial stress response.
Quantification of retinal thickness and cell-specific immunohistochemical labeling
Retinal thickness measurements and immunolabeling for each antigen were performed in age-matched batches of WT and Tg samples. All analyses were conducted in a blinded fashion by an independent reviewer. In order to minimize sampling errors, all quantifications were conducted on two sections taken at, or adjacent to, the optic nerve head. Thickness measurements of the various retinal layers were taken in both the central retina (at 500 μm either side of the optic nerve head) and peripheral retina (at 500 μm from each ciliary body margin) using the ImageJ Measure tool. To quantify the nuclei of the outer nuclear layer (ONL), the number of rows of photoreceptors were counted in 3 columns per image. Synaptic density was demarcated by ImageJ analysis of fluorescent immunolabeling for synaptophysin in both the central and peripheral retina. Images were captured, thresholded, and fluorescent signal calculated over a distance of 200 μm per image.
Amyloid load and amyloid-β protein precursor (AβPP)-dystrophic neurites in the retina were determined by quantification of the number of individual plaques/dystrophic neurites present along the entire length of the retina (from ciliary body to ciliary body). To verify the lack of amyloid plaques in the retinas of Tg animals, immunolabeling for Aβ, MOAB-2, Aβ1 - 40, and Aβ1 - 42 was also conducted at three additional tissue depths: prior to reaching the optic nerve head, and two levels subsequent to the optic nerve head.
The number of Brn3a-positive RGCs and calbindin-positive horizontal cells were quantified over a total distance of 2 mm, 1 mm each side of the optic nerve head, using the 20x objective lens of a light microscope equipped with an ocular micrometer bar. Owing to the higher density of calretinin-positive amacrine cells, cone arrestin-labeled cone photoreceptors, and PKCα-positive bipolar cells, quantification of these markers was achieved by analysis of four photomicrographs, two taken in the mid retina and two in the central retina, either side of the optic nerve head, comprising a total retinal length of 1.33 mm.
Relative abundances of GFAP and nestin (both markers of macrogliosis) in WT and Tg groups were determined by analysis of four photomicrographs (as above) using a 4-point grading system, as detailed previously [28]. Expression of two additional markers of Müller cell stress, CNTF and cyclin D1, were similarly evaluated from four photomicrographs per retina using 4-point grading systems. For glutamine synthetase, qualitative analysis of four photomicrographs (taken as above) was undertaken to evaluate any differences in distribution patterns between WT and Tg retinas. To investigate the presence of any oxidative stress, the number of cells positively labeled for HO-1 were quantified along the entire length of the retina. Likewise, the number of unambiguously immunopositive cFOS and phosphorylated cJUN(p-cJUN) cells were quantified along the entire length of the retina.
The microglial response in Tg versus WT mice was analyzed by two means: firstly, an iba1-immunoreactive area for each animal was calculated by analysis of four photomicrographs (as above). Color deconvolution was applied to extract the DAB staining. After manual thresholding, the area of iba1-positive staining was measured. Evaluations were performed using the ImageJ 1.42q software package platform (http://rsb.info.nih.gov/ij/). Second, microglial activation status was evaluated in each animal by quantification of the number of reactive/amoeboid-type iba1-positive microglia within the four photomicrographs. Although microglia are commonly divided into four phenotypes (ramified, intermediate, reactive, and ameboid), within the mouse retina phenotypic differences are apparent between microglial populations present within the different layers of the retina in healthy animals and also with regard to elongated perivascular microglia [29]. Accordingly, unambiguous demarcation between ramified and intermediate microglia is problematic, except in the case when flat-mounted retinas and a z-stack confocal microscope are used; the use of which permits visualization of the entire microglial tree. As such, we demarcated only two types of microglia: resting microglia featuring a small soma and multiple thin processes, and activated microglia that displayed thicker, less numerous processes together with a larger soma.
For immunohistochemical evaluations, statistical analysis was carried out by an unpaired Student’s t-test if parametric assumptions were met and by a Mann-Whitney test otherwise. The null hypothesis tested was that values would be the same in WT and Tg animals. Owing to the fact that three different age groups (7–8, 9–10, and 11–12 months) were analyzed, a Bonferroni correction for multiple comparisons was applied to minimize the risk of a Type I statistical error.
Evaluation of semi-thin toluidine blue stained optic nerve cross sections
Axon counting was determined using a semi-quantitative, automated, fixed pattern sampling approach as previously described [30]. All evaluations were performed in a blinded fashion. Five photomicrographs were taken from each ON cross-section, representing a total sampling area of approximately 6%. Images were contrast-enhanced, and each axon with a single, intact myelin sheath was counted using a macro-routine written for ImageJ. The mean count from the five photomicrographs was used to extrapolate the number of axons in the cross-section. Statistical analysis was carried out by unpaired Student’s t-test. The null hypothesis tested was that estimated axon number would be the same in WT and Tg animals.
Western immunoblotting
Electrophoresis/western blotting was performed as previously described [2]. In brief, tissue extracts from 11–12-month-old animals were sonicated in homogenization buffer, diluted with an equal volume of sample buffer, and boiled for 3 min. Electrophoresis was performed using non-denaturing 10% polyacrylamide gels. After separation, proteins were transferred to polyvinylidine fluoride membranes for immunoprobing. Blocking of membranes was carried out in a solution of tris-buffered saline (TBS) containing 0.1% (v/v) Tween-20 and 5% (w/v) non-fat dried skimmed milk (TBS-TM). Membranes were then incubated consecutively with the appropriate primary antibody (Supplementary Table 1), biotinylated secondary antibody and streptavidin-peroxidase conjugate. Color development was achieved using3-amino-9-ethylcarbazole. The images were captured and analyzed for densitometry using the program, Adobe PhotoShop CS2. Densitometry values were normalized for actin. Statistical analysis was carried out by Student’s unpaired t-test. The null hypothesis tested was that densitometry measurements for target proteins (normalized for actin) would be the same in age-matched WT and Tg animals. To provide positive control sample for the presence of phosphorylated tau and HO-1 in western immunoblots, we used mixed retinal cultures treated with the potent phosphatase inhibitor calyculin A (Cell Signaling Technology, Danvers, MA) and the pro-oxidant hydrogen peroxide, respectively.
Real-time RT-PCR
Real time PCR studies were carried out essentially as described previously [31]. In brief, tissues were dissected, total RNA was isolated, and first strand cDNA was synthesized from DNase-treated RNA samples. Real-time PCR reactions were carried out in 96-well optical reaction plates using the cDNA equivalent of 20 ng total RNA for each sample in a total volume of 20 μl containing either 1×SYBR Green or 1×SSOAdvanced PCR master mix (BioRad), plus forward and reverse primers. Thermal cycling conditions were 95°C for 3 min and 40 cycles of amplification comprising 95°C for 12 s, appropriate annealing temperature for 30 s and 72°C for 30 s. Primer sets used are detailed in Supplementary Table 2. PCR assays were performed using the CFX cycler (Bio-Rad) and all samples were run in duplicate. All primer sets amplified with high efficiency and linearity during real-time PCR. Accordingly, results obtained from the real-time PCR experiments were quantified using the comparative threshold cycle (CT) method (ΔΔCT) for relative quantitation of gene expression [32]. All values were normalized using the endogenous housekeeping gene GAPDH and expressed relative to the WT group. Statistical analysis was carried out Student’s unpaired t-test. The null hypothesis tested was that CT differences between target and housekeeping genes would be the same in age-matched WT and Tg retinas.
Terminal deoxynucleotidyl transferase-mediated, dUTP nick end labeling (TUNEL) assay
TUNEL assays were performed as previously described [33]. In brief, sections were deparaffinized, rehydrated, and treated with proteinase K. Endogenous peroxidases were inactivated by incubation in H2O2. Sections were equilibrated in TdT buffer (30 mM Tris-HCl, pH 7.2 containing 140 mM sodium cacodylate, 1 mM cobalt chloride), prior to incubation in the same buffer containing TdT (0.15 U/μl) and biotin-16-dUTP (10 μM). The reaction was terminated by two washes in saline sodium citrate solution. Non-specific binding sites were blocked using bovine serum albumin prior to incubation of sections with streptavidin-peroxidase conjugate. Color development was achieved by using 3’–,3’-diaminobenzidine for 5 min. Sections were counterstained with hematoxylin and subsequently mounted. The number of TUNEL-positive cells in the ganglion cell layer and inner nuclear layer were quantified along the entire length of the retina.
RESULTS
Amyloid plaques and dystrophic neurites
Amyloid plaques were delineated by immunolabeling with four antibodies: Aβ (clone 6E10), Aβ1 - 40, Aβ1 - 42, and MOAB-2, a pan-specific antibody that recognizes residues 1–4 of Aβ peptide 40/42. All four antibodies yielded similar patterns of immunolabeling (see Fig. 1). In the cerebral cortex and hippocampus of Tg mice, amyloid plaques were first detected at 4 months of age and their abundance and burden increased in an age-dependent manner up to 11 months of age (data not shown). Amyloid deposition comprised both diffuse deposits and dense cored (fibrillar) plaques. No amyloid deposits or plaques were observed in the brains of age-matched WT littermates (Fig. 1). In the retina, no amyloid deposits or plaques were observed in any Tg or WT mice at any time point from 3 to 12 months of age (see Fig. 1 for representative images and Supplementary Table 3). The lack of amyloid plaques was consistent across the four antibodies used. Neither increasing section thickness, nor increasing primary antibody concentrations, nor altering antigen retrieval conditions impacted upon the negative results in the retina (data not shown). In fact, altering antibody dilution, time spent in formic acid, or concentration of formic acid used was detrimental to the amyloid signal-to-noise ratio in the brain. Given the lack of amyloid plaques in the retinas of Tg mice of all ages, the remaining analyses were only conducted on animals taken at the later time points (7 to 12 months). Further, to provide greater statistical power to the study (n = 10 versus n = 5), mice were divided into three age groups: 7–8, 9–10, and 11–12 months, rather than analyzed as individual monthly time points.
The APP/PS1 Tg mice used herein are genetically modified to overexpress mutated human AβPP protein under the control of a mouse prion protein promoter element, directing transgene expression predominantly to central nervous system neurons. As such, neurons in Tg mice should feature a higher level of APP transgene expression than that of endogenous AβPP in age-matched WT neurons. Moreover, AβPP has been shown to accumulate in dystrophic neurites surrounding amyloid plaques from the onset of Aβ peptide deposition [34, 35]. To confirm these findings and to examine AβPP expression in the retinas of Tg mice versus WT littermates, we immunolabeled tissue sections for AβPP using a well-described primary antibody (clone 22C11) that detects a shared epitope in the N-terminal region of mouse and human APP and hence recognizes endogenous murine APP and the human APP transgene. In the cortex and hippocampus, results were as anticipated: at all ages from 7 to 12 months, neuronal cytoplasmic AβPP expression was higher in Tg than WT mice, while AβPP-positive dystrophic neurites surrounded plaques (Fig. 2A-D). In WT retinas, AβPP localized to the cytoplasm of RGCs, but was scarcely detectable in other neuronal classes (Fig. 2E, F). This finding concurs with the previously reported distribution of AβPP in the retina [36]. In Tg retinas of all ages, AβPP expression was consistently higher than in WTs and localized to other classes of neurons as well as RGCs (Fig. 2G, H). RGCs were intensely labeled by AβPP, but appeared phenotypically normal with no evidence of any dystrophic neurites. Quantification of the level of APP transgene expression in the retinas of Tg mice was achieved by qPCR analysis using primers directed to human AβPP (see Supplementary Figure 1). The data revealed that the prion protein promoter-driven APPswe transgene was detectable with a Cq of approximately 23 cycles in the retinas of 11–12-month-old Tg mice. This is a similar level of expression to that measured in the brains of 12-month-old APPSWE/PS1ΔE9 mice using the same APP primers [37]. The overall results indicate that retinal neurons, in particular RGCs, are directed to express the APP transgene, but that in the cohort of animals used in this study such expression did not result in the appearance of plaques.
Retinal thickness and synaptic abundance
To assess retinal pathology in Tg mice, we firstly investigated the thicknesses of the various retinal layers in WT and Tg retinas of 9 to 12 months (Fig. 3A-J). The results showed no significant differences in the thickness of the ONL or in the number of rows of cells in the ONL among WT and Tg mice, either in the central or peripheral retina. In the mouse, the ONL is comprised overwhelming of rod photoreceptors, hence, the data indicate a lack of rod photoreceptor degeneration in Tg mice of 9 to 12 months of age. Likewise, there were no significant differences in the thicknesses of the inner nuclear layer, the inner plexiform layer, or the outer plexiform layer in the central or peripheral retina between WT and Tg mice. To verify the lack of shrinkage in the plexiform layers, we quantified the density of immunolabeling of the synaptic marker synaptophysin in WT and Tg mice (Fig. 3K-M). The data showed no decrease in synaptic density in the central or peripheral retinas of 9–to 12–month-old Tg mice as compared to age-matched WT mice.
Retinal ganglion cells
There is interest into the potential use of optical coherence tomography imaging of the retinal nerve fiber layer as a diagnostic tool for early detection of AD. Thinning of the nerve fiber layer necessarily reflects a loss of RGCs and their axons. We utilized a number of methodologies to investigate whether RGC loss was occurring during the period when amyloid load increased in the brain. Initially, we quantified numbers of Brn3a-labeled RGCs in transverse sections of WT and Tg retinas. Brn3a expression is a sensitive marker for assessing RGC health: for example, it is downregulated prior to nerve fiber layer thinning following RGC axonal injury [38]. The results revealed no significant differences between WT and Tg mice at any of the three age groups (Fig. 4A-C). Next, we performed TUNEL labeling to assess whether any ongoing programmed cell death is evident in retinas of Tg mice. The results showed negligible TUNEL-positive cells in the ganglion cell layer of the retina in any of the age groups (Fig. 4D-F). Both of the methods highlighted above required the use of transverse sections and allowed analysis of only a proportion of the entire retinal area. Accordingly, we used the other eye from each animal of the 11-12 month cohorts to extract total mRNA and protein. First, we measured the totalretinal content of mRNAs encoding the RGC-specific markers Thy1 and β3-tubulin. The data showed there to be no difference in the level of either marker in Tg versus WT mice (Fig. 4G). Similarly, analysis of the protein levels of axonal markers in WT versus Tg retinas by western immunoblotting revealed no difference between cohorts (Fig. 4G). Confirmation of the lack of RGC degeneration in Tg mice was obtained by analysis of optic nerves, whose axons are formed exclusively by RGCs. Both axon counting of toluidine blue stained cross-sections (Fig. 4J-L) and western immunoblotting of optic nerve extracts for axonal protein content (Fig. 4M. N)demonstrated no difference between WT and Tgmice.
Other neuronal classes
Much attention is currently focused on the health of RGCs during AD, but it is presently unknown whether the other neuronal classes of the retina are affected. We quantified the numbers of amacrine cells, rod bipolar cells, horizontal cells, and cone photoreceptors in WT and Tg retinas of 7 to 12 months of age by immunohistochemical labeling using specific, previously-validated antibodies. Calretinin localizes to amacrine cell bodies and three clearly defined bands within the inner plexiform layer. There was no qualitative change to the distribution of calretinin immunoreactivity in Tg mice (Fig. 5A, B), while quantification of cell numbers within the inner nuclear layer showed no difference between WT and Tg cohorts in any of the three age groups (Fig. 5C). PKCα is associated with bipolar cell perikarya and their axons that extend to the ganglion cell layer. There was no qualitative change to the distribution of PKCα immunoreactivity in Tg mice (Fig. 5D, E), while quantification of somal numbers revealed no difference between WT and Tg cohorts in any of the three age groups (Fig. 5F). Calbindin identifies horizontal cell bodies together with a single band of dendrites in the outer plexiform layer. No qualitative or quantitative changes were evident between calbindin immunoreactivity in WT and Tg mice in any of the age brackets (Fig. 5G-I). Cone arrestin labels the somata and segments of both short and mid length cone photoreceptors. As was the case for calretinin, PKCα and calbindin, no qualitative or quantitative changes were apparent between cone arrestin immunolabeling in WT and Tg mice in any of the age brackets (Fig. 5J-L).
Microglia and proinflammatory cytokines
One of the characteristic features of pathology in transgenic models of AD is an elevated neuroinflammatory profile. This manifests as an increased recruitment and activation of microglia to the sites of amyloid plaques, together with an associated upregulation of proinflammatory cytokines [39, 40]. We investigated microglial responses and mRNA levels of three proinflammatory cytokines implicated in AD, namely interleukin-1β (IL-1β), tumor necrosis factorα (TNFα), and interleukin-6 (IL-6), in Tg retinas of 7 to 12 months of age. Qualitative inspection of the brains of Tg mice showed the expected increase in iba1 coverage and activation status in the parietal cortex and hippocampus when compared to WT mice (Fig. 6A-D). In the retina, quantitative evaluation of iba1-labeling area and semi-quantitative evaluation of activations status of iba1-positive cells revealed no differences between Tg and WT retinas in any of the three age groups (Fig. 6E-H); indeed, with very few exceptions, the overwhelming majority of microglia in both cohorts displayed a ramified-like morphology. Likewise, qPCR showed that expression levels of the three proinflammatory cytokines were not statistically different in Tg versus WT retinas(Fig. 6I).
Macroglia
Astroglial changes are strongly correlated with disease progression in mouse models of AD. Most prominently, GFAP-positive, hypertrophic astrocytes surround every plaque [41]. In the healthy retina, Müller cells rather than astrocytes represent the major glial cell. Müller cells constitutively express glutamine synthetase, but unlike astrocytes, they do not normally express GFAP. In response to homeostatic disturbance, however, both macroglial cell types upregulate GFAP. Induction of GFAP therefore represents an early, non-specific, highly sensitive and easily detectable response to harmful stimuli [42]. We assessed GFAP expression in WT and Tg retinas of 7 to 12 months of age. Qualitative inspection of the brains of Tg mice showed the anticipated striking upregulation of GFAP surrounding amyloid deposits in parietal cortex and hippocampus when compared to WT mice (Fig. 7A-D). In the retina, neither semi-quantitative grading of GFAP immunolabeling nor measurement of GFAP content by western immunoblotting showed any statistical differences between Tg and WT retinas (Fig. 7E-J). Notably, Müller cells failed to upregulate GFAP in a manner characteristic of retinal injury in Tg mice, although it is worth noting that the highest immunohistochemical grades were recorded by the oldest cohorts. Qualitative scrutiny of glutamine synthetase in WT and Tg cohorts revealed no obvious differences in the patterns or intensities of distribution (data not shown).
Markers of cellular stress
In order to better investigate the effect of retinal pathology in the APP/PS1 model of AD, we analyzed various markers of glial or neuronal stress that have been shown to be robustly induced in situations of retinal injury. For each marker, we labeled, in parallel, tissue sections from a mouse model of branch retinal vein occlusion to ensure sensitivity and specificity of each antibody.
Expression of the intermediate filament nestin is low in the mature rodent retina, but a striking and sustained induction by astrocytes and Müller cells occurs in numerous pathological situations encompassing reactive gliosis. We explored whether nestin is upregulated in Tg mice versus WTs of 7 to 12 months of age. Results from immunohistochemistry and western immunoblotting experiments indicate that nestin expression remains unchanged from its low level in Tg retinas (Fig. 8A-C).
In the brains of transgenic mouse models of AD, ectopic neuronal cell cycle events occur prior to the appearance of senile plaques [43]. Moreover, in the retina, Müller cells upregulate factors involved in dedifferentiation, such as cyclin D1 and proliferating cell nuclear antigen, in response to retinal injury. Herein, we evaluated cyclin D1 expression in WT and Tg retinas. The results showed no positive labeling of RGCs or any other neuronal classes at any time point in WT or Tg retinas (data not shown), while semi-quantitative grading of cyclin D1 immunolabeling in Müller cells of WT and Tg retinas revealed no differences between WT and Tg retinas at any time point (Fig. 8D-F).
Heat shock proteins and trophic factors are important groups of cellular stress response proteins in the retina, which are induced by a multitude of stimuli. In healthy retinas, astrocytes and Müller cells express low levels of small heat shock protein 25 (hsp25) and fibroblast growth factor-2 (FGF-2), respectively, while both astrocytes and Müller cells synthesize low levels of CNTF [27]. We investigated whether any of these proteins display altered patterns of expression in Tg mice. Semi-quantitative grading of CNTF immunolabeling in WT and Tg retinas revealed no differences at any of the three age groups studied (Fig. 8H-K). Immunohistochemical observation of Hsp27 revealed no discernible alteration in labeling patterns in Tg versus WT mice (data not shown), while western immunoblotting showed that the overall levels of both hsp25 and FGF-2 in the retina were not significantly different in the two cohorts (Fig. 8L, M).
Oxidative stress is increasingly considered to be an early, causative event in the development of AD. The antioxidant enzyme HO-1 is highly sensitive to oxidative stress, and its induction by glia has been documented in the brains of both AD patients and APP/PS1 mice [44, 45]. We utilized immunohistochemistry and western immunoblotting to assess HO-1 expression in the retinas of WT and Tg mice. In both WT and Tg mice, HO-1 expression was undetectable within retinal tissue sections at all ages from 7 to 12 months, while western blotting revealed no discernible upregulation of the protein from the low basal level (see Fig. 9 for representative results). In contrast to Tg mice, positive labeling for HO-1 was clearly present in astrocytes, Müller cells and microglia/macrophages in retinal sections of a mouse model of BRVO, which served as our positive control (Fig. 9).
The final markers of cellular stress evaluated were the immediate early gene c-FOS and the stress-activated transcription factor p-cJUN. Neuronal and glial populations of the retina typically upregulate expression of cFOS and p-cJUN rapidly in response to stress and injury. In the retinas of mice subjected to branch retinal vein occlusion, Müller cells and RGCs labelled positively for both markers (Fig. 10A, B,E, F). In contrast, no clear-cut response was apparent in Tg retinas at any time point from 7 to 12 months of age. The occasional, lightly stained p-cJUN- or cFOS-positive cell was evident in both WT or Tg retinas.
Hyperphosphorylation of tau
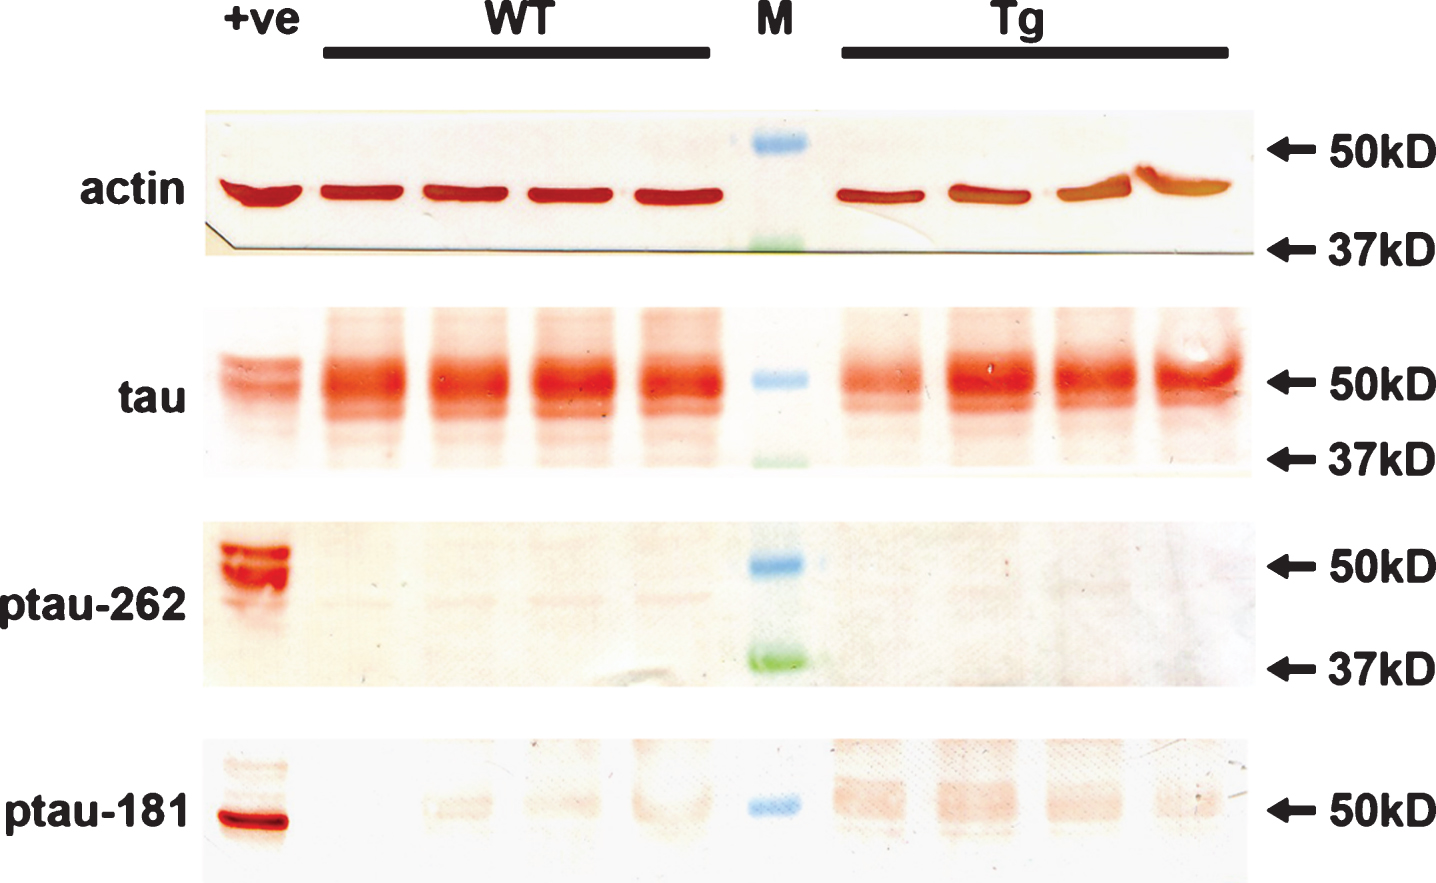
Although APP/PS1 mice do not develop neurofibrillary tangles in conjunction with amyloid deposits, accumulation of hyperphosphorylated tau in the brain has been documented [2, 46]. Moreover, hyperphosphorylation of tau has also been reported in the retinas of 13-month-old animals [24]. We utilized western immunoblotting to assess tau phosphorylation status in the retinas of WT and Tg mice. In both cohorts, an abundant signal for tau was present in retinal extracts (Fig. 10); however, no signals were detected in any retinal extracts from WT or Tg mice using antibodies directed against p-tau-T181 and p-tau-S262 (Fig. 11). Strong protein signals were detected in an extract from a retinal culture treated with the potent phosphatase inhibitor calyculin A, which acted as a positive control for the validity of the antibodies.
DISCUSSION
In recent years, there has been increasing recognition that visual performance is impaired in early stages of AD. A lack of consensus exists, however, as to the exact mechanisms underlying visual dysfunction in AD, in particular regarding the timing, nature, and extent of retinal versus cortical pathology. If retinal pathology presents at a sufficiently early stage of the disease, it offers great potential as a source of novel biomarkers for diagnosis, owing to the numerous possibilities afforded by modern, non-invasive screening methodologies. The aim of the current study was to characterize retinal pathology in the early stages of disease at a time when amyloid burden is increasing in the brain. To this end and to impart maximal perspective on the results, we utilized a very widely-studied transgenic mouse model, the APPSWE/PS1ΔE9 strain from The Jackson Laboratory. Our results indicated a complete lack of identifiable retinal pathology during the period, namely 4 to 12 months of age, when amyloid deposits are dramatically escalating in the brain. We were unable to demonstrate the presence of amyloid plaques, dystrophic neurites, retinal thinning, neuronal loss, synaptic shrinkage, macro- or micro-gliosis, aberrant cell cycle re-entry, oxidative stress, tau hyperphosphorylation, or upregulations of proinflammatory cytokines or stress signaling molecules in the retina. In short, we could identify no differences at all when comparing the retinas of Tg and WT mice.
The first issue to consider is the lack of amyloid plaques in the Tg retina. From a technical standpoint, there are minimal grounds for disputing the veracity of the results. We used four different complementary antibodies to detect amyloid deposits: Aβ (clone 6E10), Aβ1 - 40, Aβ1 - 42, and MOAB-2, a pan-specific antibody to residues 1–4 of Aβ peptide 40/42. All four antibodies yielded high signal-to-background ratios in brain sections labeled in parallel and all four antibodies delineated plaques from as early as 4 months of age, a time frame consistent with previous work [39, 47]. Altering assay conditions, such as increasing section thickness or using a higher primary antibody concentration, either elicited no improvement in signal strength or was detrimental to the signal-to-noise ratio. Thioflavin-S is frequently used for detecting plaque burden, but it has been shown to offer inferior sensitivity to that of anti-Aβ antibodies, including in this mouse strain [39, 47]. Our failure to detect significant amyloid deposition in the retina of animals up to one year of age is not inconsistent with previous studies to have used APPSWE/PS1ΔE9 mice [22, 23, 25, 48], with one exception [18]. We were unable to confirm the striking findings ofKoronyo-Hamaoui et al. [18] who showed Aβ accumulation in retina prior to its appearance in the brain. Although no plaques were evident within the four levels of the retina that were analyzed, it would be injudicious to dismiss the possibility that a small number of plaques may have been present, owing to the fact that we did not analyze the entire retina. It is a limitation of the present study that retinal wholemounts were not used. Yet, this explanation is only partially satisfactory, since Koronyo-Hamaoui et al. detected plaques in both wholemounts and transverse sections. Despite the lack of amyloid plaques, there appears little doubt that the APP transgene was robustly expressed within the retina. Firstly, in Tg retinas of all ages, AβPP protein expression was consistently higher than in WT mice and was associated with all neuronal classes, not just RGCs, a result in agreement with earlier work with this model [48]. Secondly, qPCR analysis of the human APP transgene in 11–12-month-old Tg retinas revealed a robust level of expression not dissimilar to that observed in the brains of 12-month-old APPSWE/PS1ΔE9 mice using the same qPCR primers [37]. As expected, RGCs were intensely labeled by AβPP in Tg retinas, but they appeared phenotypically normal with no evidence of any dystrophic neurites, a result which parallels our finding of a lack ofplaques.
A key focus in the search for a retinal biomarker for AD concerns RGC pathology. An exciting, but preliminary, body of work has led researchers to hypothesize that RGC degeneration not only occurs in AD patients, but that it is coexistent with the first clinical manifestations of the disease and can be monitored by recently developed, high resolution imaging technologies, such as optical coherence tomography, scanning laser ophthalmoscopy and polarimetry [3, 4, 8, 15, 49]. At this stage, caution should be exercised, not least because various studies have noted high rates of glaucoma among patients with AD, and conversely an increased prevalence of cognitive impairment in glaucoma sufferers. These clinical associations have fostered the idea that there are common pathologies or, at the very least, a close association between AD and glaucoma [50], but they necessarily complicate interpretation of data. Rodent models of early-onset AD help overcome these difficulties. In the brains of APP/PS1 mice, there is scant evidence of widespread neuronal loss despite the huge amyloid burden [46]. Logically, therefore, minimal death of RGCs might also be expected, particularly given the dramatically lower, arguably non-existent, amyloid burden in the retina at early-mid stages of the disease. To date, no consensus has emerged about the scale or timing of any RGC degeneration [19, 23, 24, 51]. We quantified RGC degeneration using a complementary array of techniques, including RGC somal and synaptic immunolabeling in retinal sections, western immunoblotting of axonal proteins in retinal and optic nerve extracts, optic nerve axon counting, and analysis of RGC-specific mRNAs in the retina. The combined data showed no differences between age-matched Tg and WT animals, and we are therefore obliged to conclude that no overt RGC degeneration had occurred by 12 months of age. It follows that techniques such as optical coherence tomography, which is able to quantify thinning of the retinal nerve fiber layer (a correlate for loss of intra-retinal RGC axons), would have likewise been unable to discriminate between WT and Tg cohorts. More subtle analyses of RGC changes, such as the dendritic shrinkage noted by Williams et al. [52] in 14-month-old Tg2576 mice, or the decrease in specific components of the pattern electroretinogram noted by Gao et al. [51] in 13-month-old APP/PS1 animals, arguably offer greater potential for detection of RGC abnormalities, but there remains an overwhelming difficulty to surmount in the use of RGC markers for detection of AD in patients: the problem of differentiating AD-specific RGC changes from those emanating from other optic neuropathies.
To date, researchers have focused on investigating RGC degeneration in AD, but amyloid deposits have been observed throughout the various layers of the retina in older animals, while mechanistic similarities exist between AD and age-related macular degeneration [50]. Therefore, it is important not to ignore these other neuronal classes. We examined the outer nuclear layer to delineate any rod photoreceptor loss, synaptophysin immunoreactivity to reveal any decrease in synaptic density, and the distributions of amacrine, bipolar, horizontal, and cone photoreceptor cell markers to detect any adverse effects on these neuronal classes. Analyses of the thickness of the outer nuclear layer and the number of rows of rod photoreceptors showed no alteration between WT and Tg mice, results consistent with earlier work [51], synaptophysin immunolabeling was unchanged in Tg mice, while calretinin, calbindin, PKCα, and cone arrestin patterns of immunoreactivity were indistinguishable in WT and Tg cohorts. The combined data, suggest that neither inner nor outer retinal neurons were detrimentally affected in Tg mice at the time points analyzed.
It has been widely documented that reactive microglia cluster around plaques in AD brains, but an increasing body of evidence attests to microglial changes and neuroinflammatory processes, including upregulation of proinflammatory cytokines, commencing even before amyloid is deposited (see for example [53–56]). At present, no data are available concerning microglial responses in the prodromal AD retina. Previous studies have shown an approximate two-fold increase in microglial density in the retinas of 13–15-month-old APPSWE/PS1ΔE9 mice with a greater proportion displaying an activated phenotype [23, 24, 51]. Interestingly, none of these studies showed activated microglia surrounding amyloid plaques, with the logical implication being that microgliosis encompassed the entire retina. In our study, we found no evidence for an increased density of iba1-positive microglia in the retina of 7 to 12 months Tg mice, or for an increased number of microglia with the activated phenotype, or for a higher level of expression of mRNAs encoding stereotypical proinflammatory cytokines. Our results are consistent with the lack of amyloid deposits in the retina and the lack of any retinal neurodegeneration. We can only conclude that the requisite signals for microgliosis were not present at the time points analyzed. It is a limitation of our study that analyses were performed in transverse sections rather than wholemounts, which permit more detailed and accurate data acquisition [29, 57], but this is unlikely to account for the negative findings, as all of the studies using older APPSWE/PS1ΔE9 mice also used transversesections.
The most striking difference between the macroglial landscapes of the retina and brain is that Müller cells, rather than astrocytes, represent the dominant retinal glial cell. Müller cell processes span the entire retina, providing structural and metabolic support for every neuron, while astrocytes are restricted to the nerve fiber layer [42]. Müller cells constitutively express glutamine synthetase, but not GFAP and induction of GFAP represents an early, non-specific, highly sensitive response to harmful stimuli [42]. To knowledge, no studies have analyzed GFAP expression in the retinas of APP/PS1 mice, but Müller cells of 9-month-old 3XTg-AD mice retinas have been shown to display upregulated GFAP as well as an increase in process number, especially in close proximity to amyloid deposits [58]. Furthermore, subretinal injection of human Aβ1–42 in C57BL/6J mice resulted in inductions of GFAP, vimentin, and nestin in Müller cells [59]. Interestingly, amyloid-induced gliosis in the brains of APPSWE/PS1ΔE9 mice does not stimulate re-expression of nestin by astrocytes, highlighting differences between the retina and brain [60]. Herein, we found no evidence for upregulations of GFAP, nestin, or glutamine synthetase in Müller cells of 7–to 12–month-old Tg mice, results consistent with the study as a whole. It is worth noting that GFAP expression showed a trend to higher scores in older WT and Tg mice, which likely illustrates an aging effect. As for microglial analyses, it should again be acknowledged that the lack of wholemount analyses is a limitation of the study.
In addition to classical neuronal and glial markers, we analyzed various stress markers that have been shown to be robustly induced, either in glia or neurons, in situations of retinal injury. These included trophic factors, such as CNTF and FGF-2, hsp25, the cell cycle re-entry marker cyclin D1, the oxidative stress marker HO-1, and the early response transcription factors cFOS and p-cJUN. HO-1 [45] and cFOS [61] expression by glia, and neuronal cell cycle re-entry [62] have all been documented in the brain in the early stages of mouse models of AD. For each marker, we ran, in parallel, tissue sections from a mouse model of branch retinal vein occlusion to ensure sensitivity and specificity of each antibody. Unlike the retinas that had undergone branch retinal vein occlusion, no definitive responses were observed in Tg retinas, results which further testify to the lack of overt pathology at the ages analyzed. Of particular note were the negative results obtained with cyclin D1. Ectopic cell cycling events occur prior to the appearance of senile plaques in mouse and human AD brains [43] and may even predict the sites of neuronal death [63].
Finally, we investigated, by western immunoblotting, whether hyperphosphorylated tau is present in significant amounts in the Tg retinas. Although APP/PS1 mice do not develop tangles and neuropil threads, accumulation of hyperphosphorylated tau in the brain does occur, notably in dystrophic neurites [2, 46]. In both WT and Tg retinas, we detected tau, but not p-tau-T181 or p-tau-S262, elevated levels of which are present in pre-tangle AD brains [64]. The results are consistent with the lack of dystrophic neurites in our retinas.
In summary, the results of our study do not support the hypothesis that detectable retinal pathology occurs concurrently with escalating amyloid deposition in the brain during the early stages of AD in our mouse model. These data add a note of caution to expectations that the retina may prove a source of biomarkers for early detection of AD. Caveats to this conclusion relate to the fact that marked variation can occur not only between different strains of AD mice, but also between different populations of the same original strain where genetic backgrounds and housing/breeding conditions differ. Investigation of early retinal pathology in other mouse strains, particularly the 3XTg-AD, is warranted. Likewise, physiological biomarkers of retinal health, such as measurement of the electroretinogram and contrast sensitivity testing, may prove more sensitive than molecular/histological biomarkers. A final caveat to the findings of this study relates to whether a forced overexpression model such as the APP/PS1 mouse strain faithfully mimics the pathological changes seen in humanswith AD.
ACKNOWLEDGMENTS
Support from the Ophthalmic Research Institute of Ophthalmology and from NHMRC’s Australian Centre for Electromagnetic Bioeffects Radiation is gratefully acknowledged. The authors are also indebted to Mark Daymon and Teresa Mammone for expert technical assistance, to Dr Andreas Ebneter, Bern University Hospital, for kindly providing tissue blocks of retinas subjected to branch retinal vein occlusion, and to Professor Peter Blumbergs, University of Adelaide, for helpful comments.
Authors’ disclosures available online (http://j-alz.com/manuscript-disclosures/160823r2).
Appendices
The supplementary material is available in the electronic version of this article: http://dx.doi.org/10.3233/JAD-160823.
REFERENCES
[1] | Goedert M , Spillantini MG ((2006) ) A century of Alzheimer’s disease. Science 314: , 777–781. |
[2] | Puzzo D , Gulisano W , Palmeri A , Arancio O ((2015) ) Rodent models for Alzheimer’s disease drug discovery. Expert Opin Drug Discov 10: , 703–711. |
[3] | Javaid FZ , Brenton J , Guo L , Cordeiro MF ((2016) ) Visual and ocular manifestations of Alzheimer’s disease and their use as biomarkers for diagnosis and progression. Front Neurol 7: , 55. |
[4] | Krantic S , Torriglia A ((2014) ) Retina: Source of the earliest biomarkers for Alzheimer’s disease? J Alzheimers Dis 40: , 237–243. |
[5] | London A , Benhar I , Schwartz M ((2013) ) The retina as a window to the brain-from eye research to CNS disorders. Nat Rev Neurol 9: , 44–53. |
[6] | Miller N , Drachman DA ((2006) ) The optic nerve: A window into diseases of the brain? Neurology 67: , 1742–1743. |
[7] | Mendez MF , Mendez MA , Martin R , Smyth KA , Whitehouse PJ ((1990) ) Complex visual disturbances in Alzheimer’s disease. Neurology 40: , 439–443. |
[8] | Kirby E , Bandelow S , Hogervorst E ((2010) ) Visual impairment in Alzheimer’s disease: A critical review. J Alzheimers Dis 21: , 15–34. |
[9] | Cormack FK , Tovee M , Ballard C ((2000) ) Contrast sensitivity and visual acuity in patients with Alzheimer’s disease. Int J Geriatr Psychiatry 15: , 614–620. |
[10] | Hinton DR , Sadun AA , Blanks JC , Miller CA ((1986) ) Optic-nerve degeneration in Alzheimer’s disease. N Engl J Med 315: , 485–487. |
[11] | Sadun AA , Bassi CJ ((1990) ) Optic nerve damage in Alzheimer’s disease. Ophthalmology 97: , 9–17. |
[12] | Blanks JC , Hinton DR , Sadun AA , Miller CA ((1989) ) Retinal ganglion cell degeneration in Alzheimer’s disease. Brain Res 501: , 364–372. |
[13] | Blanks JC , Schmidt SY , Torigoe Y , Porrello KV , Hinton DR , Blanks RH ((1996) ) Retinal pathology in Alzheimer’s disease. II. Regional neuron loss and glial changes in GCL. Neurobiol Aging 17: , 385–395. |
[14] | Blanks JC , Torigoe Y , Hinton DR , Blanks RH ((1996) ) Retinal pathology in Alzheimer’s disease. I. Ganglion cell loss in foveal/parafoveal retina. Neurobiol Aging 17: , 377–384. |
[15] | Chang LY , Lowe J , Ardiles A , Lim J , Grey AC , Robertson K , Danesh-Meyer H , Palacios AG , Acosta ML ((2014) ) Alzheimer’s disease in the human eye. Clinical tests that identify ocular and visual information processing deficit as biomarkers. Alzheimers Dement 10: , 251–261. |
[16] | Curcio CA , Drucker DN ((1993) ) Retinal ganglion cells in Alzheimer’s disease and aging. Ann Neurol 33: , 248–257. |
[17] | Davies DC , McCoubrie P , McDonald B , Jobst KA ((1995) ) Myelinated axon number in the optic nerve is unaffected by Alzheimer’s disease. Br J Ophthalmol 79: , 596–600. |
[18] | Koronyo-Hamaoui M , Koronyo Y , Ljubimov AV , Miller CA , Ko MK , Black KL , Schwartz M , Farkas DL ((2011) ) Identification of amyloid plaques in retinas from Alzheimer’s patients and noninvasive in vivo optical imaging of retinal plaques in a mouse model. Neuroimage 54: (Suppl 1), S204–S217. |
[19] | Tsai Y , Lu B , Ljubimov AV , Girman S , Ross-Cisneros FN , Sadun AA , Svendsen CN , Cohen RM , Wang S ((2014) ) Ocular changes in TgF344-AD rat model of Alzheimer’s disease. Invest Ophthalmol Vis Sci 55: , 523–534. |
[20] | Schon C , Hoffmann NA , Ochs SM , Burgold S , Filser S , Steinbach S , Seeliger MW , Arzberger T , Goedert M , Kretzschmar HA , Schmidt B , Herms J ((2012) ) Long-term in vivo imaging of fibrillar tau in the retina of P301S transgenic mice. PLoS One 7: , e53547. |
[21] | Ho CY , Troncoso JC , Knox D , Stark W , Eberhart CG ((2014) ) Beta-amyloid, phospho-tau and alpha-synuclein deposits similar to those in the brain are not identified in the eyes of Alzheimer’s and Parkinson’s disease patients. Brain Pathol 24: , 25–32. |
[22] | Ning A , Cui J , To E , Ashe KH , Matsubara J ((2008) ) Amyloid-beta deposits lead to retinal degeneration in a mouse model of Alzheimer disease. Invest Ophthalmol Vis Sci 49: , 5136–5143. |
[23] | Perez SE , Lumayag S , Kovacs B , Mufson EJ , Xu S ((2009) ) Beta-amyloid deposition and functional impairment in the retina of the APPswe/PS1DeltaE9 transgenic mouse model of Alzheimer’s disease. Invest Ophthalmol Vis Sci 50: , 793–800. |
[24] | Yang Y , Shiao C , Hemingway JF , Jorstad NL , Shalloway BR , Chang R , Keene CD ((2013) ) Suppressed retinal degeneration in aged wild type and APPswe/PS1DeltaE9 mice by bone marrow transplantation. PLoS One 8: , e64246. |
[25] | Shimazawa M , Inokuchi Y , Okuno T , Nakajima Y , Sakaguchi G , Kato A , Oku H , Sugiyama T , Kudo T , Ikeda T , Takeda M , Hara H ((2008) ) Reduced retinal function in amyloid precursor protein-over-expressing transgenic mice via attenuating glutamate-N-methyl-d-aspartate receptor signaling. J Neurochem 107: , 279–290. |
[26] | Ebneter A , Casson RJ , Wood JP , Chidlow G ((2010) ) Microglial activation in the visual pathway in experimental glaucoma: Spatiotemporal characterization and correlation with axonal injury. Invest Ophthalmol Vis Sci 51: , 6448–6460. |
[27] | Chidlow G , Daymon M , Wood JP , Casson RJ ((2011) ) Localization of a wide-ranging panel of antigens in the rat retina by immunohistochemistry: Comparison of Davidson’s solution and formalin as fixatives. J Histochem Cytochem 59: , 884–898. |
[28] | Holman MC , Chidlow G , Wood JP , Casson RJ ((2010) ) The effect of hyperglycemia on hypoperfusion-induced injury. Invest Ophthalmol Vis Sci 51: , 2197–2207. |
[29] | Rojas B , Gallego BI , Ramirez AI , Salazar JJ , de Hoz R , Valiente-Soriano FJ , Aviles-Trigueros M , Villegas-Perez MP , Vidal-Sanz M , Trivino A , Ramirez JM ((2014) ) Microglia in mouse retina contralateral to experimental glaucoma exhibit multiple signs of activation in all retinal layers. J Neuroinflammation 11: , 133. |
[30] | Ebneter A , Casson RJ , Wood JP , Chidlow G ((2012) ) Estimation of axon counts in a rat model of glaucoma: Comparison of fixed-pattern sampling with targeted sampling. Clin Experiment Ophthalmol 40: , 626–633. |
[31] | Chidlow G , Wood JP , Manavis J , Osborne NN , Casson RJ ((2008) ) Expression of osteopontin in the rat retina: Effects of excitotoxic and ischemic injuries. Invest Ophthalmol Vis Sci 49: , 762–771. |
[32] | Livak KJ , Schmittgen TD ((2001) ) Analysis of relative gene expression data using real-time quantitative PCR and the 2(-Delta Delta C(T)) Method. Methods 25: , 402–408. |
[33] | Chidlow G , Wood JP , Sarvestani G , Manavis J , Casson RJ ((2009) ) Evaluation of Fluoro-Jade C as a marker of degenerating neurons in the rat retina and optic nerve. Exp Eye Res 88: , 426–437. |
[34] | Blanchard V , Moussaoui S , Czech C , Touchet N , Bonici B , Planche M , Canton T , Jedidi I , Gohin M , Wirths O , Bayer TA , Langui D , Duyckaerts C , Tremp G , Pradier L ((2003) ) Time sequence of maturation of dystrophic neurites associated with Abeta deposits in APP/PS1 transgenic mice. Exp Neurol 184: , 247–263. |
[35] | Irizarry MC , McNamara M , Fedorchak K , Hsiao K , Hyman BT ((1997) ) APPSw transgenic mice develop age-related A beta deposits and neuropil abnormalities, but no neuronal loss in CA1. J Neuropathol Exp Neurol 56: , 965–973. |
[36] | Chidlow G , Ebneter A , Wood JP , Casson RJ ((2011) ) The optic nerve head is the site of al transport disruption, axonal cytoskeleton damage and putative al regeneration failure in a rat model of glaucoma. Acta Neuropathol 121: , 737–751. |
[37] | Cohen E , Paulsson JF , Blinder P , Burstyn-Cohen T , Du D , Estepa G , Adame A , Pham HM , Holzenberger M , Kelly JW , Masliah E , Dillin A ((2009) ) Reduced IGF-1 signaling delays age-associated proteotoxicity in mice. Cell 139: , 1157–1169. |
[38] | Rovere G , Nadal-Nicolas FM , Agudo-Barriuso M , Sobrado-Calvo P , Nieto-Lopez L , Nucci C , Villegas-Perez MP , Vidal-Sanz M ((2015) ) Comparison of retinal nerve fiber layer thinning and retinal ganglion cell loss after optic nerve transection in adult albino rats. Invest Ophthalmol Vis Sci 56: , 4487–4498. |
[39] | Ruan L , Kang Z , Pei G , Le Y ((2009) ) Amyloid deposition and inflammation in APPswe/PS1dE9 mouse model of Alzheimer’s disease. Curr Alzheimer Res 6: , 531–540. |
[40] | McGeer PL , McGeer EG ((2015) ) Targeting microglia for the treatment of Alzheimer’s disease. Expert Opin Ther Targets 19: , 497–506. |
[41] | Kamphuis W , Orre M , Kooijman L , Dahmen M , Hol EM ((2012) ) Differential cell proliferation in the cortex of the APPswePS1dE9 Alzheimer’s disease mouse model. Glia 60: , 615–629. |
[42] | Bringmann A , Pannicke T , Grosche J , Francke M , Wiedemann P , Skatchkov SN , Osborne NN , Reichenbach A ((2006) ) Muller cells in the healthy and diseased retina. Prog Retin Eye Res 25: , 397–424. |
[43] | Yang Y , Varvel NH , Lamb BT , Herrup K ((2006) ) Ectopic cell cycle events link human Alzheimer’s disease and amyloid precursor protein transgenic mouse models. J Neurosci 26: , 775–784. |
[44] | Schipper HM , Bennett DA , Liberman A , Bienias JL , Schneider JA , Kelly J , Arvanitakis Z ((2006) ) Glial heme oxygenase-1 expression in Alzheimer disease and mild cognitive impairment. Neurobiol Aging 27: , 252–261. |
[45] | Xing S , Shen D , Chen C , Wang J , Yu Z ((2014) ) Early induction of oxidative stress in a mouse model of Alzheimer’s disease with heme oxygenase activity. Mol Med Rep 10: , 599–604. |
[46] | McGowan E , Eriksen J , Hutton M ((2006) ) A decade of modeling Alzheimer’s disease in transgenic mice. Trends Genet 22: , 281–289. |
[47] | Garcia-Alloza M , Robbins EM , Zhang-Nunes SX , Purcell SM , Betensky RA , Raju S , Prada C , Greenberg SM , Bacskai BJ , Frosch MP ((2006) ) Characterization of amyloiddeposition in the APPswe/PS1dE9 mouse model of Alzheimer disease. Neurobiol Dis 24: , 516–524. |
[48] | Dutescu RM , Li QX , Crowston J , Masters CL , Baird PN , Culvenor JG ((2009) ) Amyloid precursor protein processing and retinal pathology in mouse models of Alzheimer’s disease. Graefes Arch Clin Exp Ophthalmol 247: , 1213–1221. |
[49] | Cheung CY , Ong YT , Hilal S , Ikram MK , Low S , Ong YL , Venketasubramanian N , Yap P , Seow D , Chen CL , Wong TY ((2015) ) Retinal ganglion cell analysis using high-definition optical coherence tomography in patients with mild cognitive impairment and Alzheimer’s disease. J Alzheimers Dis 45: , 45–56. |
[50] | Sivak JM ((2013) ) The aging eye: Common degenerative mechanisms between the Alzheimer’s brain and retinaldisease. Invest Ophthalmol Vis Sci 54: , 871–880. |
[51] | Gao L , Chen X , Tang Y , Zhao J , Li Q , Fan X , Xu H , Yin ZQ ((2015) ) Neuroprotective effect of memantine on the retinal ganglion cells of APPswe/PS1DeltaE9 mice and its immunomodulatory mechanisms. Exp Eye Res 135: , 47–58. |
[52] | Williams PA , Thirgood RA , Oliphant H , Frizzati A , Littlewood E , Votruba M , Good MA , Williams J , Morgan JE ((2013) ) Retinal ganglion cell dendritic degeneration in a mouse model of Alzheimer’s disease. Neurobiol Aging 34: , 1799–1806. |
[53] | Pomilio C , Pavia P , Gorojod RM , Vinuesa A , Alaimo A , Galvan V , Kotler ML , Beauquis J , Saravia F ((2016) ) Glial alterations from early to late stages in a model of Alzheimer’s disease: Evidence of autophagy involvement in Abeta internalization. Hippocampus 26: , 194–210. |
[54] | Wright AL , Zinn R , Hohensinn B , Konen LM , Beynon SB , Tan RP , Clark IA , Abdipranoto A , Vissel B ((2013) ) Neuroinflammation and neuronal loss precede Abeta plaque deposition in the hAPP-J20 mouse model of Alzheimer’s disease. PLoS One 8: , e59586. |
[55] | Cavanagh C , Colby-Milley J , Bouvier D , Farso M , Chabot JG , Quirion R , Krantic S ((2013) ) betaCTF-correlated burst of hippocampal TNFalpha occurs at a very early, pre-plaque stage in the TgCRND8 mouse model of Alzheimer’sdisease. J Alzheimers Dis 36: , 233–238. |
[56] | Franceschi C , Valensin S , Lescai F , Olivieri F , Licastro F , Grimaldi LM , Monti D , De Benedictis G , Bonafe M ((2001) ) Neuroinflammation and the genetics of Alzheimer’s disease: The search for a pro-inflammatory phenotype. Aging (Milano) 13: , 163–170. |
[57] | Bosco A , Steele MR , Vetter ML ((2011) ) Early microglia activation in a mouse model of chronic glaucoma. J Comp Neurol 519: , 599–620. |
[58] | Edwards MM , Rodriguez JJ , Gutierrez-Lanza R , Yates J , Verkhratsky A , Lutty GA ((2014) ) Retinal macroglia changes in a triple transgenic mouse model of Alzheimer’s disease. Exp Eye Res 127: , 252–260. |
[59] | Dinet V , Bruban J , Chalour N , Maoui A , An N , Jonet L , Buret A , Behar-Cohen F , Klein C , Treton J , Mascarelli F ((2012) ) Distinct effects of inflammation on gliosis, osmohomeostasis, and vascular integrity during amyloid beta-induced retinal degeneration. Aging Cell 11: , 683–693. |
[60] | Kamphuis W , Mamber C , Moeton M , Kooijman L , Sluijs JA , Jansen AH , Verveer M , de Groot LR , Smith VD , Rangarajan S , Rodriguez JJ , Orre M , Hol EM ((2012) ) GFAP isoforms in adult mouse brain with a focus on neurogenic astrocytes and reactive astrogliosis in mouse models of Alzheimer disease. PLoS One 7: , e42823. |
[61] | Beauquis J , Vinuesa A , Pomilio C , Pavia P , Galvan V , Saravia F ((2014) ) Neuronal and glial alterations, increased anxiety, and cognitive impairment before hippocampal amyloid deposition in PDAPP mice, model of Alzheimer’s disease. Hippocampus 24: , 257–269. |
[62] | Varvel NH , Bhaskar K , Kounnas MZ , Wagner SL , Yang Y , Lamb BT , Herrup K ((2009) ) NSAIDs prevent, but do not reverse, neuronal cell cycle reentry in a mouse model of Alzheimer disease. J Clin Invest 119: , 3692–3702. |
[63] | Busser J , Geldmacher DS , Herrup K ((1998) ) Ectopic cell cycle proteins predict the sites of neuronal cell death in Alzheimer’s disease brain. J Neurosci 18: , 2801–2807. |
[64] | Augustinack JC , Schneider A , Mandelkow EM , Hyman BT ((2002) ) Specific tau phosphorylation sites correlate with severity of neuronal cytopathology in Alzheimer’s disease. Acta Neuropathol 103: , 26–35. |
Figures and Tables
Fig.1
Representative images of Aβ, MOAB-2, Aβ1 - 40, and Aβ1 - 42 immunolabeling in the brain and retina of 12-month-old WT and Tg mice. In Tg parietal cortex (A, B, E, F, I, J, M, N) amyloid plaques are abundant. All four antibodies display high signal-to-noise ratios. In contrast, no amyloid deposits are evident in sections of WT (C, G, K, O) or Tg (D, H, L, P) retinas. Scale bar: A, E, I, M = 250 μm; B-D, F-H, J-L, N-P = 50 μm; GCL, ganglion cell layer; INL, inner nuclear layer; ONL, outer nuclear layer.
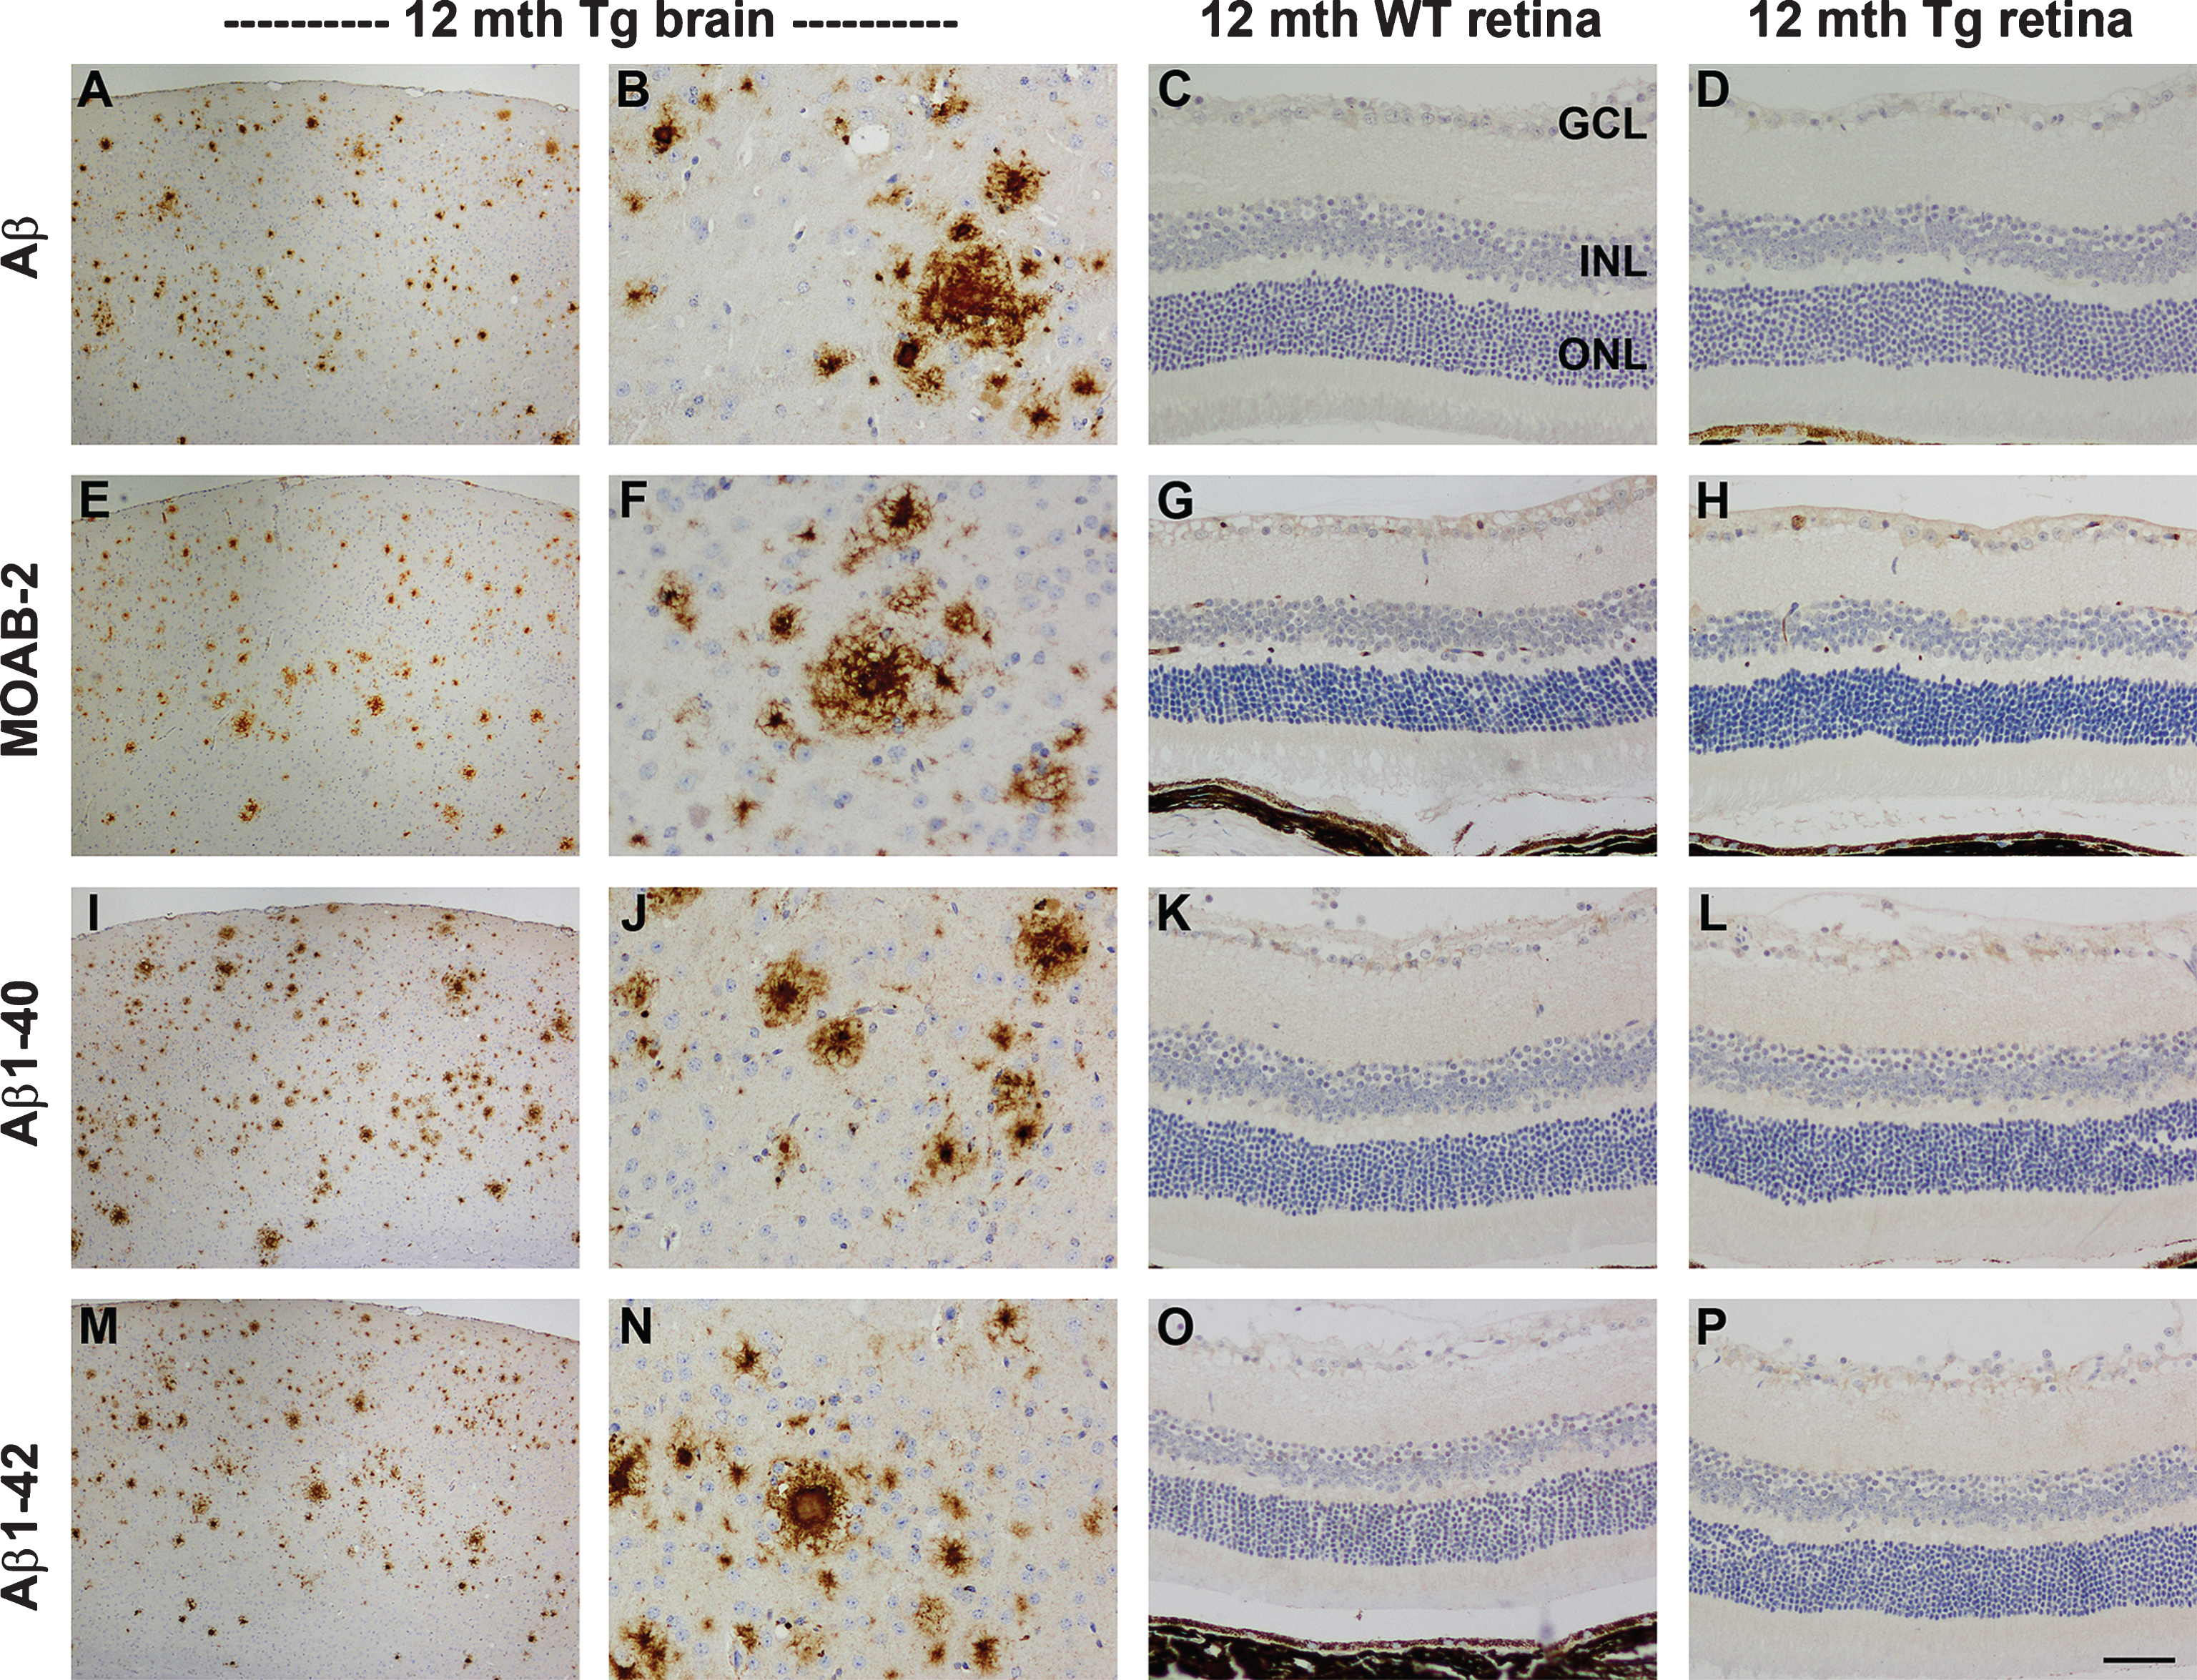
Fig.2
Representative images of AβPP immunolabeling in the brain and retina of 11-month-old WT and Tg mice. In WT parietal cortex (A) and hippocampus (B), AβPP localizes to the cytoplasm of neurons. In Tg mice, neuronal expression of AβPP is higher, and numerous dystrophic neurites surrounding amyloid plaques are present within the parietal cortex (C, arrowheads) and hippocampus (D). In the WT retina, AβPP localizes to the cytoplasm of RGCs (arrow), but is barely detectable within amacrine cells (arrowhead) or other neuronal cell types. In Tg mice, AβPP expression is markedly higher in RGCs (arrow), and is also clearly detectable in other neuronal populations (arrowhead); however, no AβPP-positive dystrophic neurites are evident. Scale bar: A, C = 100 μm; E, G = 50 μm, B,D,F,H = 25 μm.
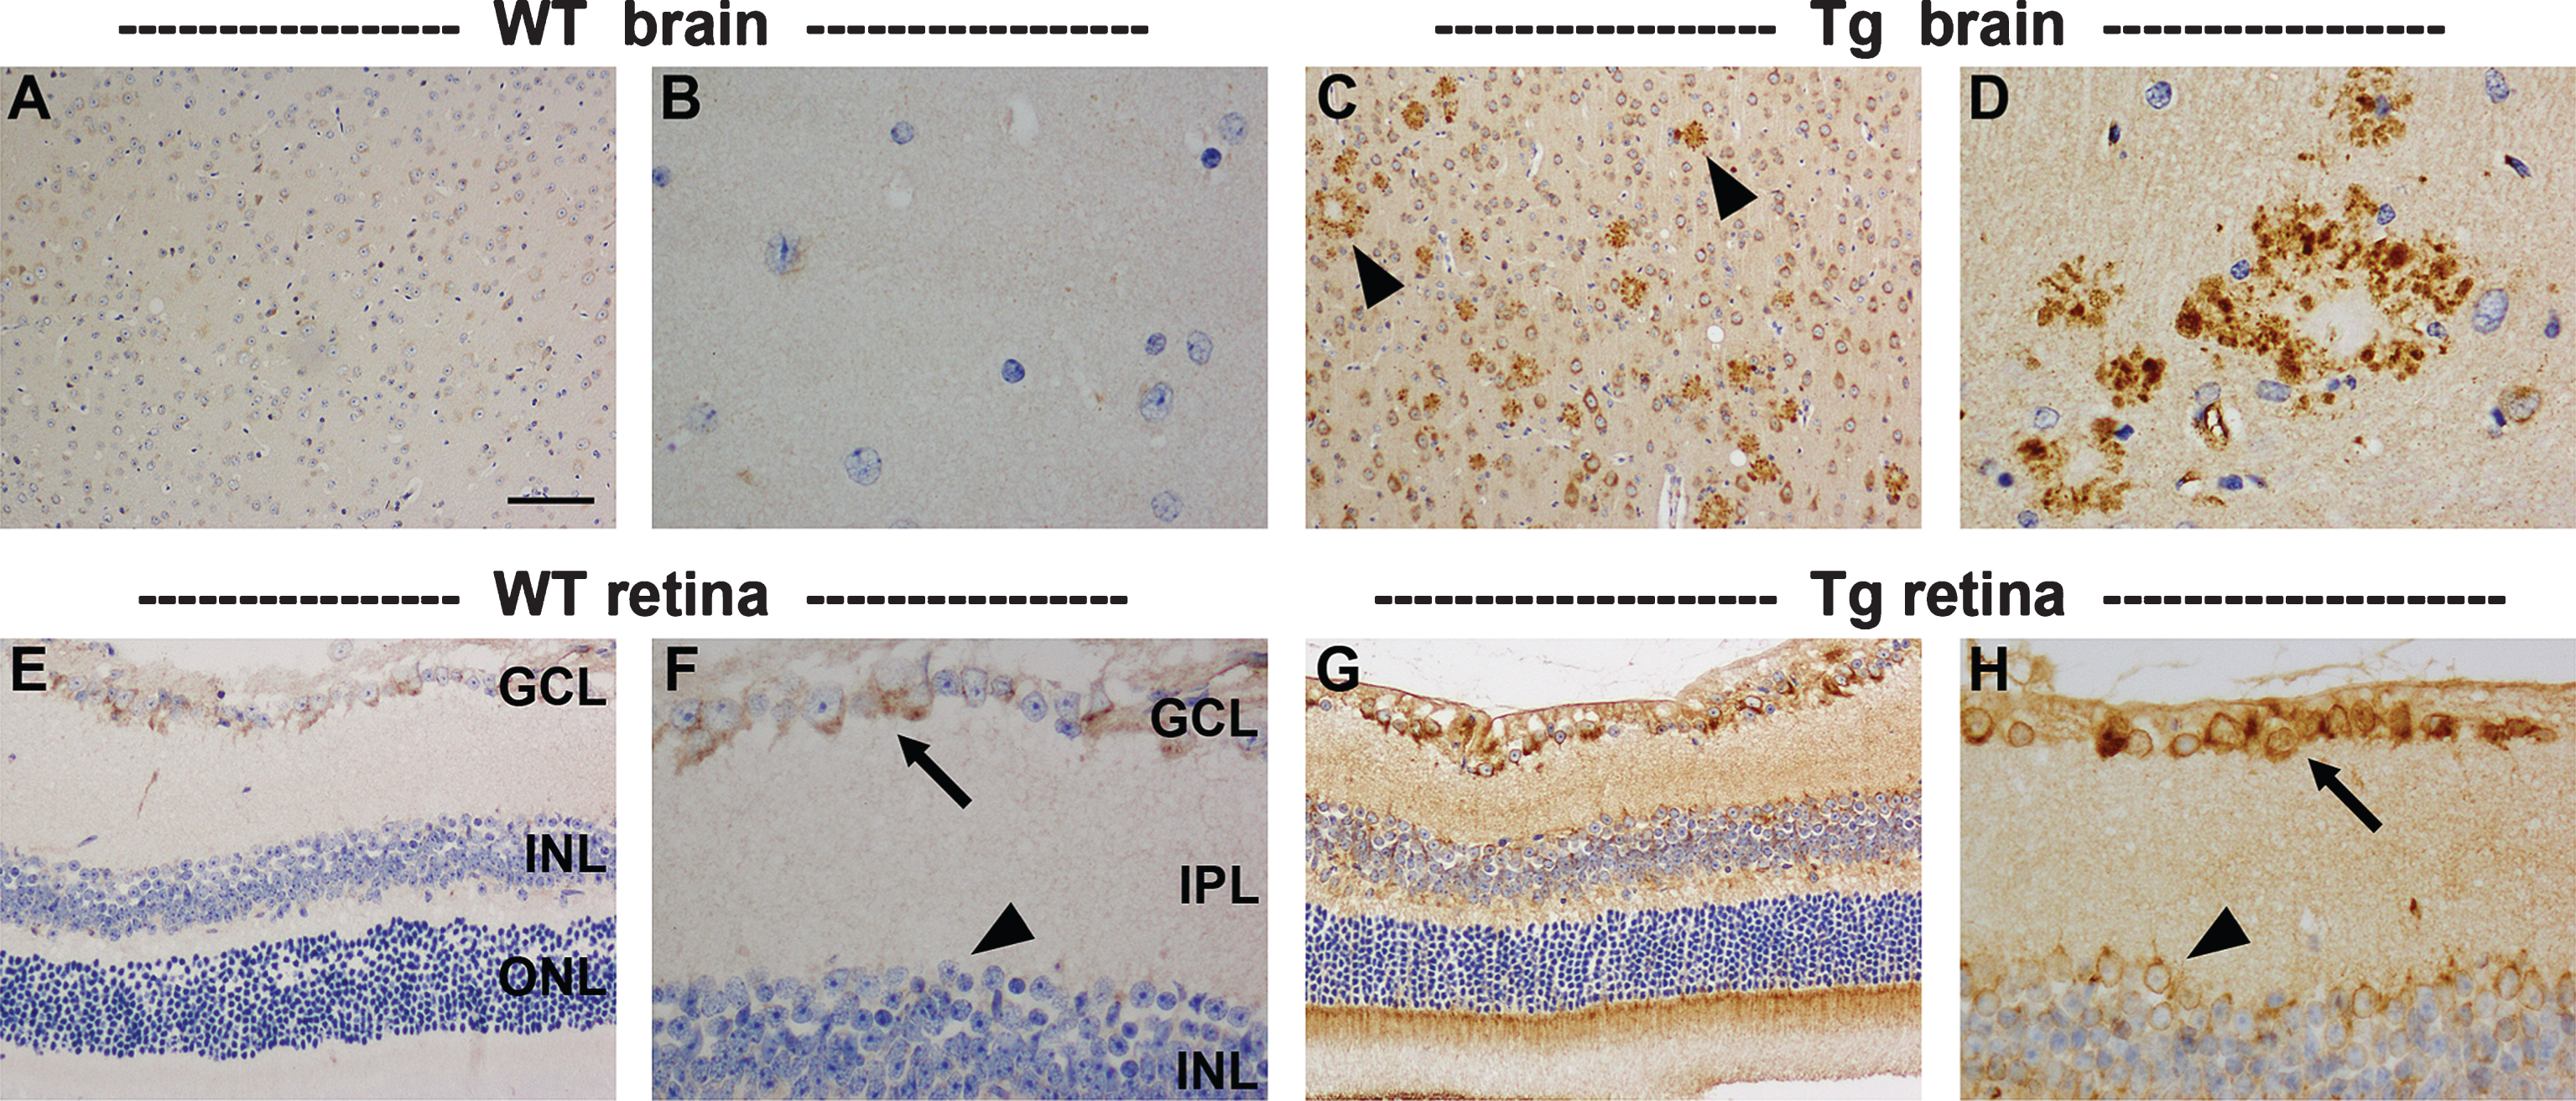
Fig.3
Analysis of retinal thickness and synaptic density in 9–to 12–month-old WT and Tg mice. Representative images of hematoxylin and eosin staining in the central (A, B) and peripheral (C, D) retinas of 11-month-old WT and Tg mice. E) Identification of the retinal layers. F, G) Quantification of the number of rows of cells and the thickness of the outer nuclear layer (ONL). H-J) Quantification of the thicknesses of the inner nuclear layer (INL), inner plexiform layer (IPL), outer plexiform layer (OPL). K-M) Representative images of synaptophysin immunolabeling in the central retinas of 12-month-old WT and Tg mice. Quantification of synaptophysin density in the central and peripheral retina is also shown. In each case, data are expressed as mean±SEM, where n = 10 for each age-matched group. Student’s unpaired t-tests revealed no significant differences. Scale bars: 50 μm.
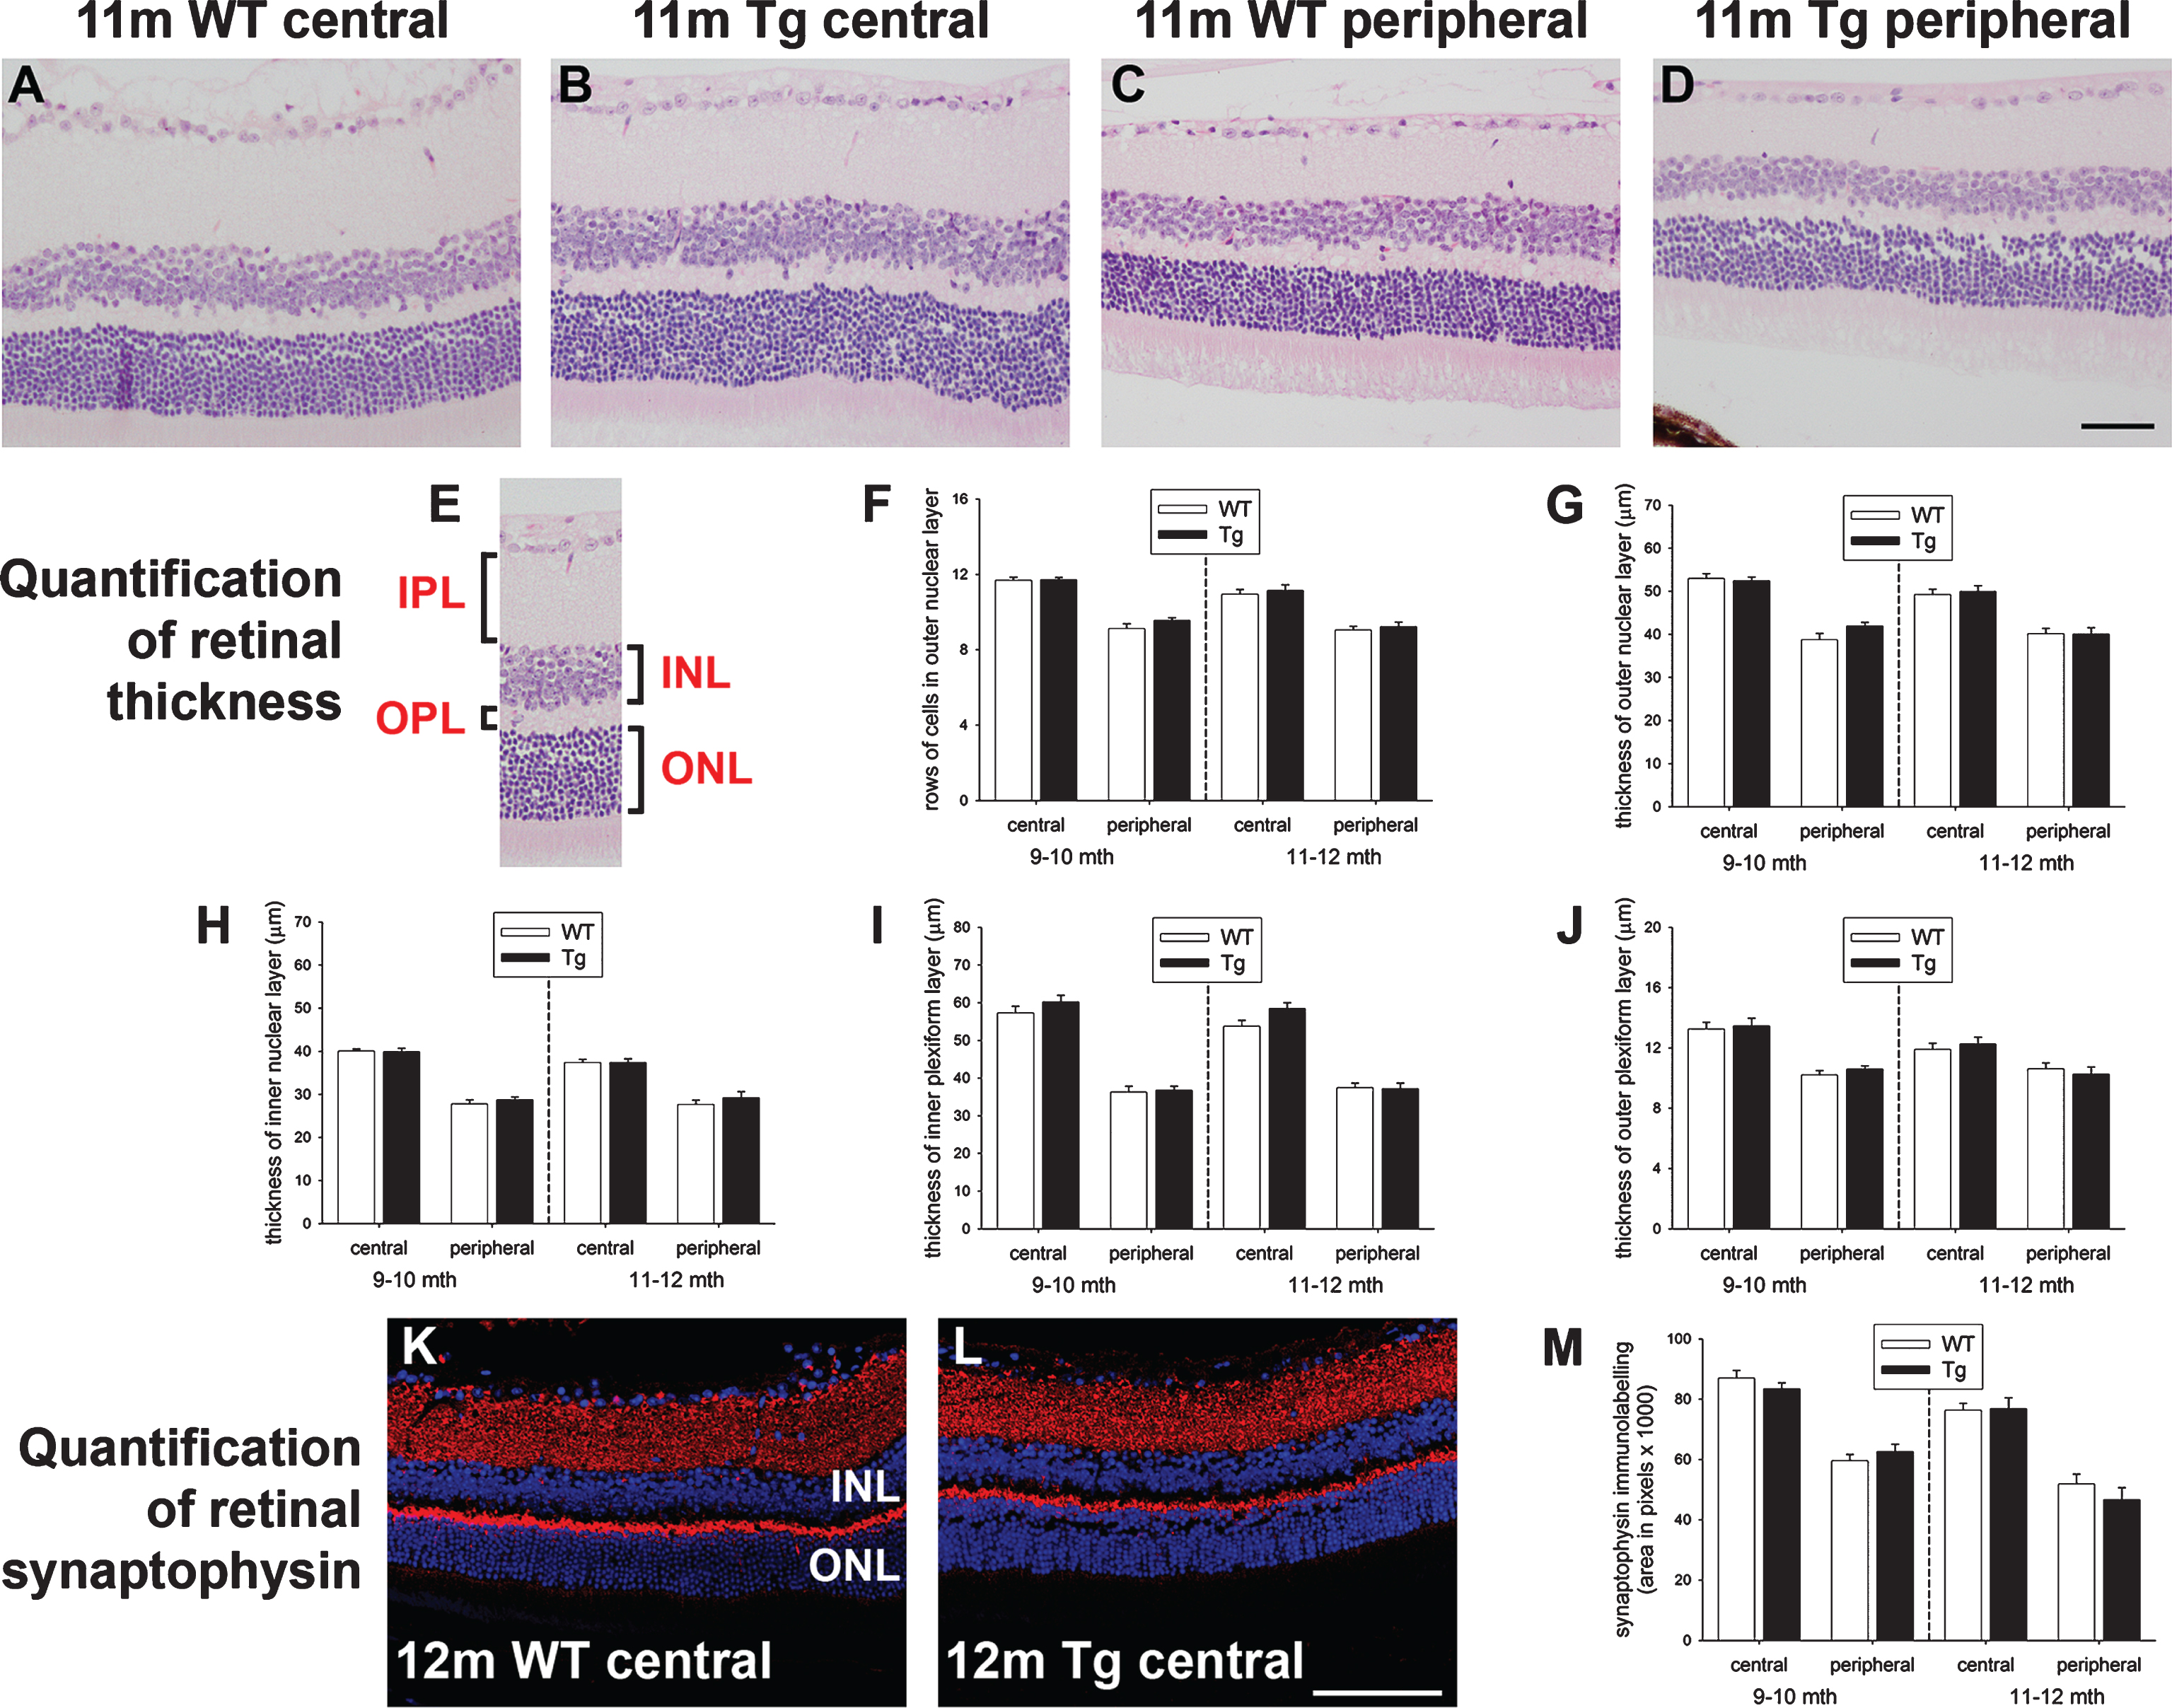
Fig.4
Analysis of retinal ganglion cells (RGC) in 7–to 12–month-old WT and Tg mice. A-C) Representative images of Brn3a immunolabeling, together with quantification of numbers of Brn3a-labeled RGCs. Brn3a localizes to RGC nuclei (yellow arrow). D-F) Representative images of TUNEL labeling in an NMDA-treated retina (+ve control, see arrows) and 12-month Tg retina, together with quantification of numbers of TUNEL-positive cells in the GCL. G) Levels of RGC-specific (Thy1 and β3-tubulin) mRNAs in Tg retinas as measured by qPCR. Data are normalized for GAPDH and expressed relative to WT. H, I, M, N) Expression of RGC axonal proteins in WT and Tg retinas (H, I), and WT and Tg optic nerves (M, N) as evaluated by western immunoblotting. Single bands of the expected molecular weight are apparent. Data are normalized for actin and expressed relative to WT. J-L) Representative photomicrographs of toluidine blue-stained cross-sections of WT and Tg optic nerves from 12-month-old mice, together with estimated axon counts. Data are expressed relative to WT. For all analyses, data are expressed as mean±SEM, where n = 10 for each age-matched group. Student’s unpaired t-tests revealed no significant differences between WT and Tg cohorts for any of the parameters measured. Scale bar: A, B = 50 μm; D, E = 25 μm, J, K = 10 μm. GCL, ganglion cell layer; INL, inner nuclear layer; β3-tub, β3-tubulin; p-NFH, phosphorylated neurofilament heavy chain.
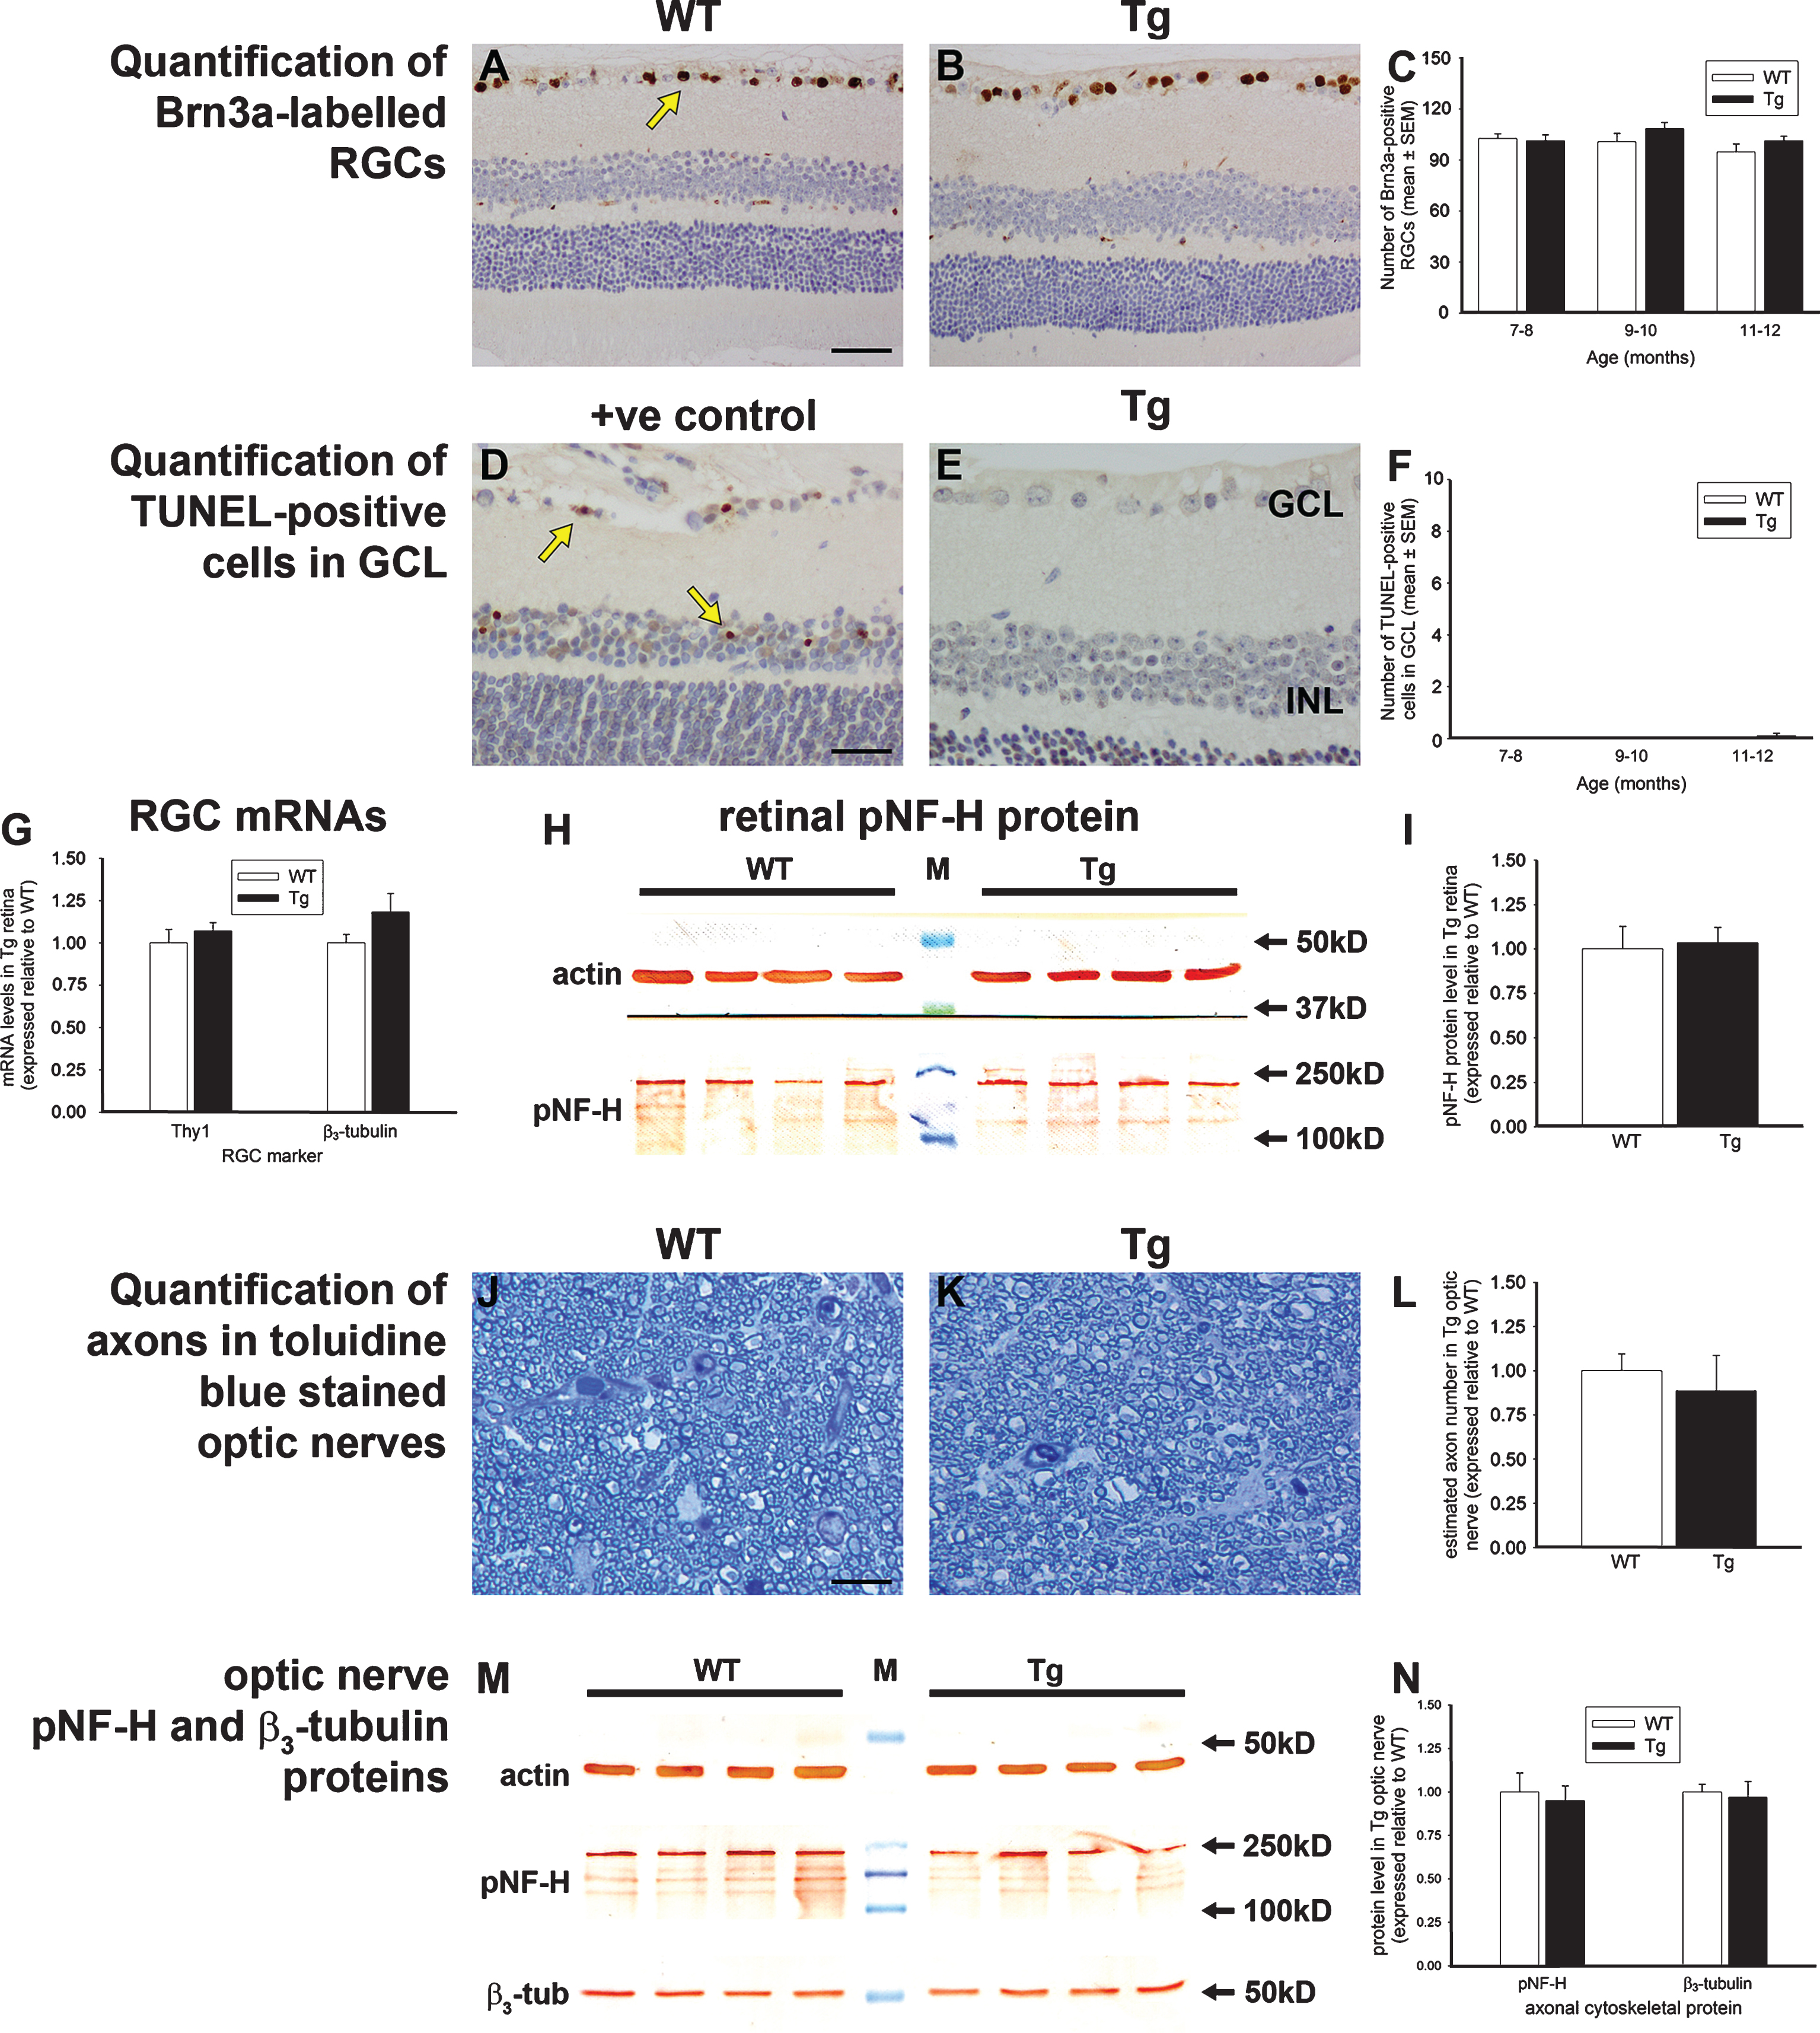
Fig.5
Analysis of amacrine cells, bipolar cells, horizontal cells, and cone photoreceptors in 7 to 12-month-old Tg retinas. Representative images of calretinin (A, B), PKCα (D, E), calbindin (G, H), and cone arrestin (J, K) immunolabeling are shown. Calretinin is associated with amacrine cell somata (arrow) located in the inner part of the INL, layers of terminals visible in the IPL (arrowhead), and displaced amacrine and ganglion cells in the GCL. PKCα labels bipolar cell somata (arrow) located in the INL and their processes that synapse with photoreceptors and retinal ganglion cells. Calbindin is associated with horizontal cell somata (arrow) located in the outer part of the INL and their dendrites in the outer plexiform layer. Cone arrestin labels cone photoreceptor cell bodies (arrow) located in the ONL, inner and outer cone segments, and synapses in the outer plexiform layer. Quantification of numbers of calbindin-labeled horizontal cells (C), calretinin-labeled amacrine cells (F), PKCα-labeled bipolar cells (I), and cone arrestin-labeled cone photoreceptors (L) are also shown. In each case, data are expressed as mean±SEM, where n = 10 for each age-matched group. Student’s unpaired t-tests revealed no significant differences between the treatment groups at any of the three age groups for any of the four cell types. Scale bars: 50 μm. GCL, ganglion cell layer; INL, inner nuclear layer; ONL, outer nuclear layer.
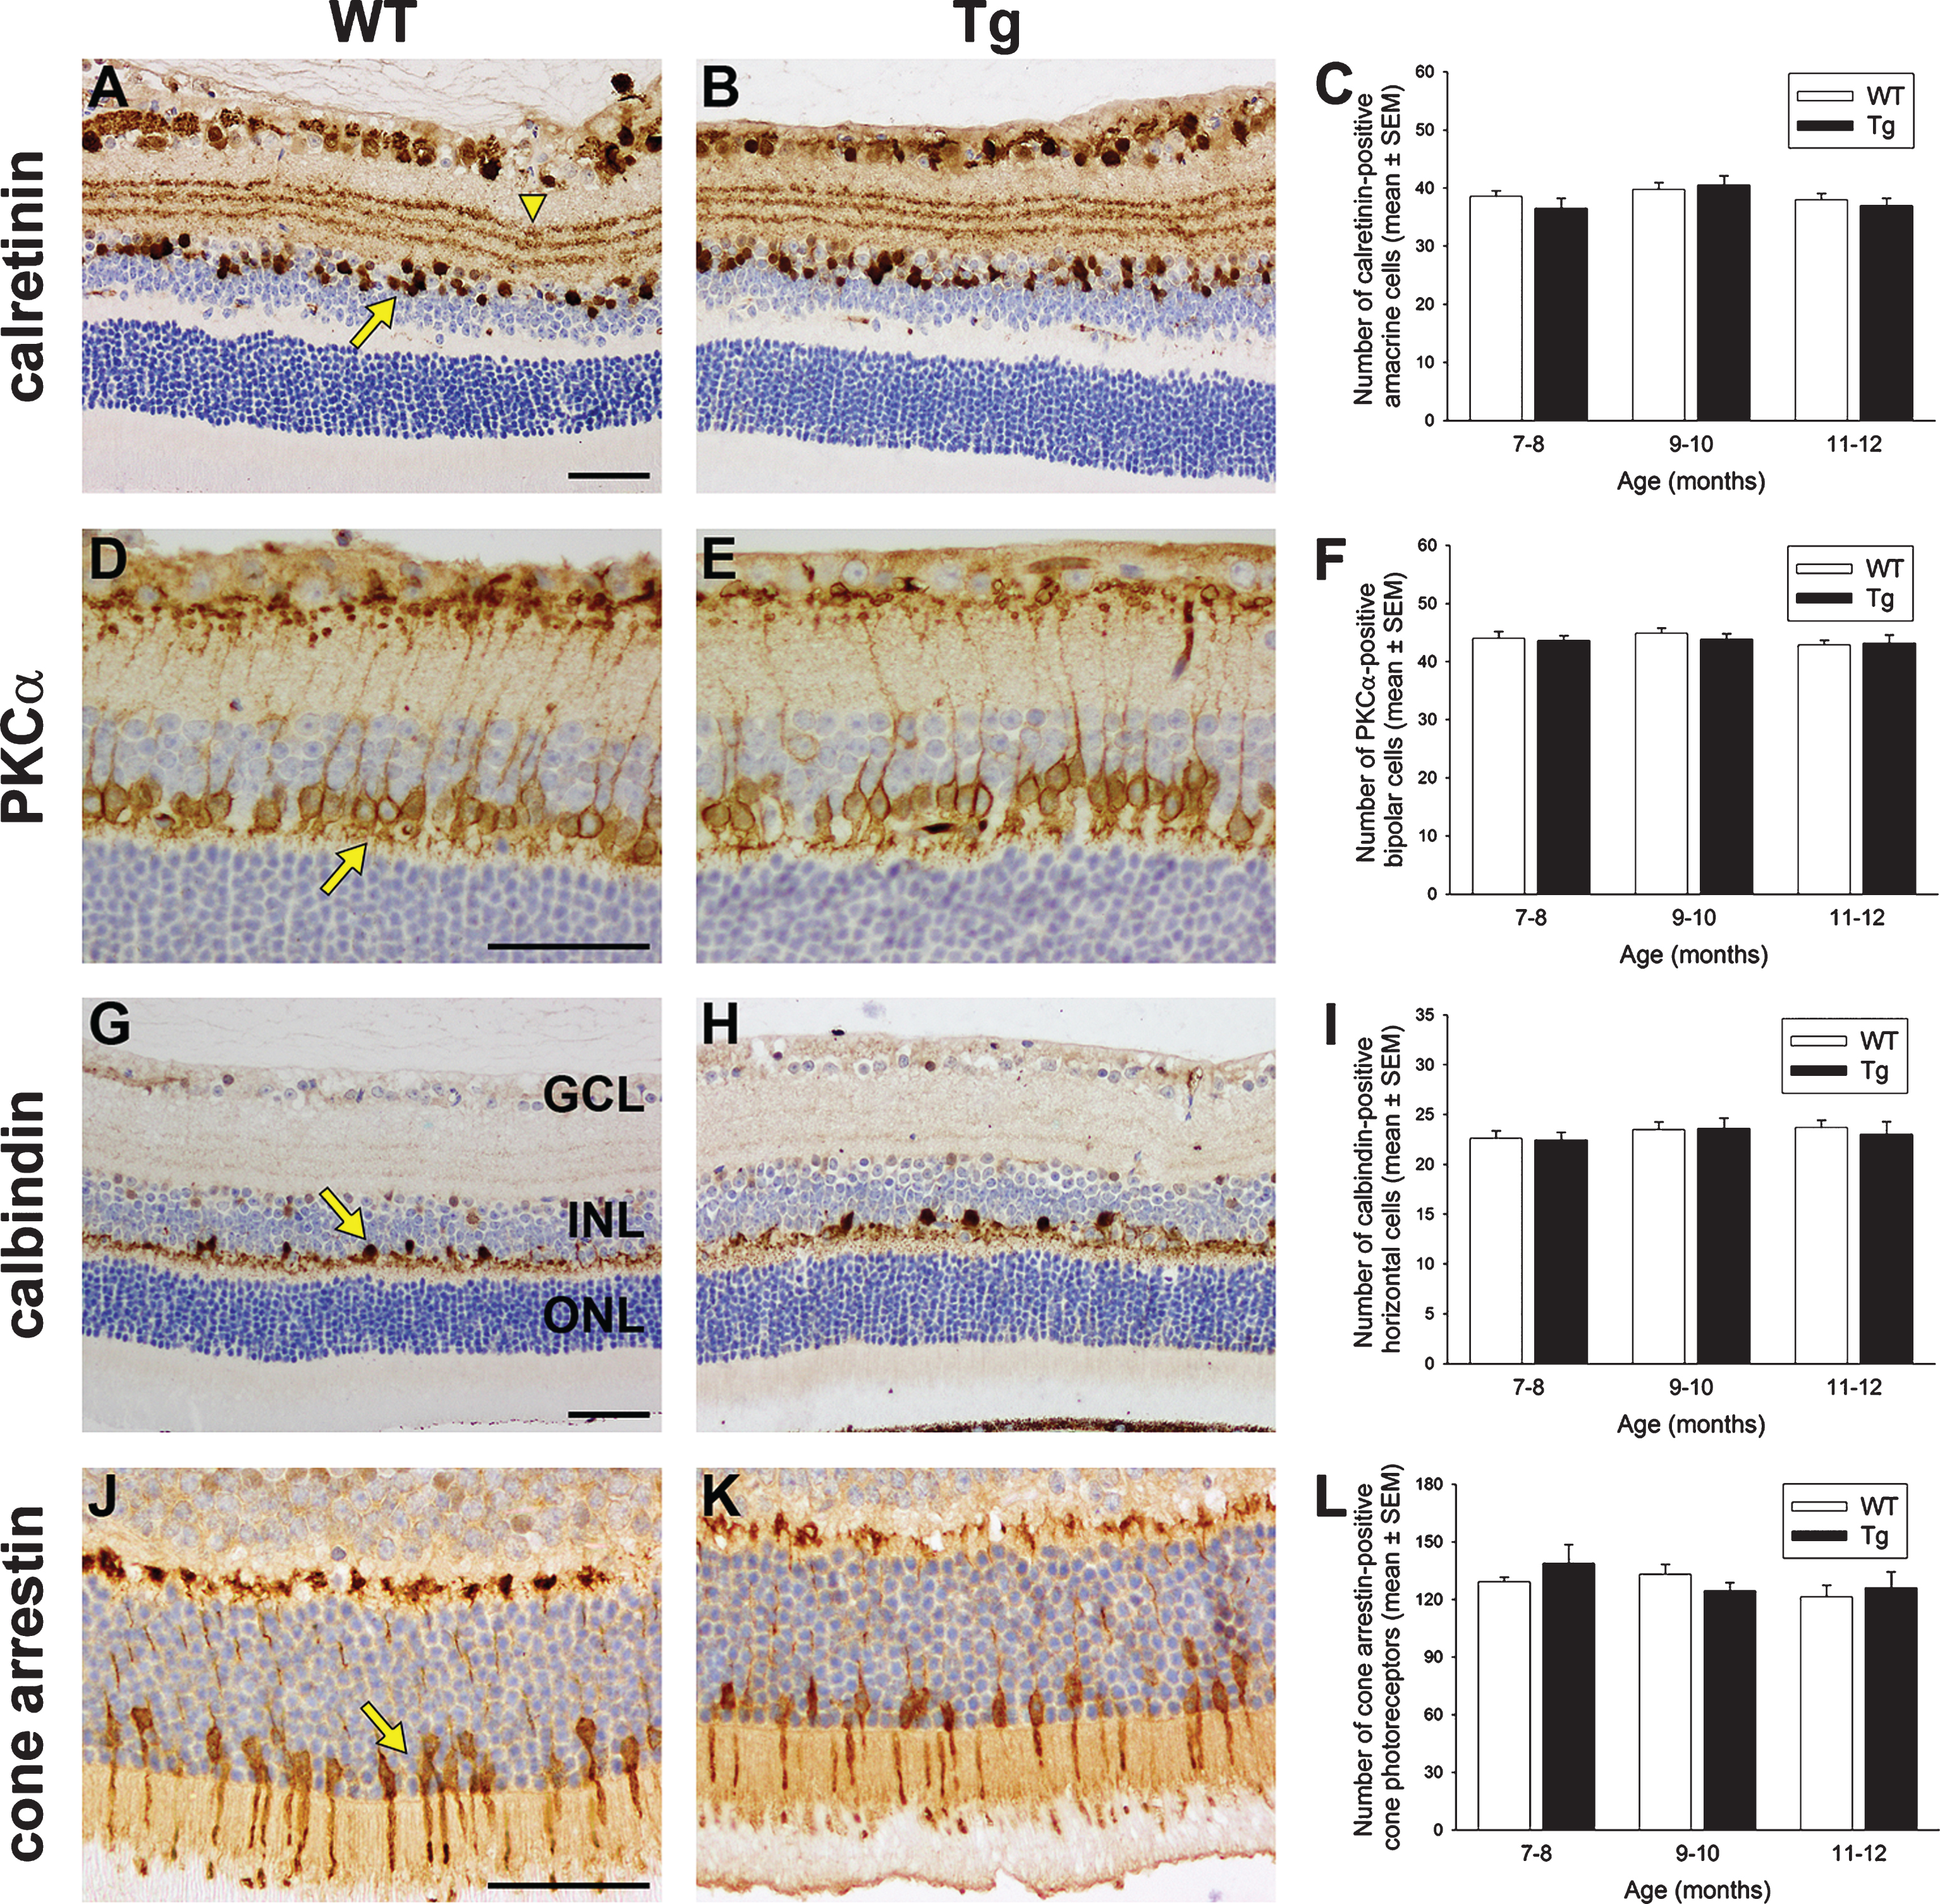
Fig.6
Analysis of microglia and proinflammatory cytokine levels in WT and Tg mice. Representative images of iba1 immunolabeling in 10-month-old WT and Tg parietal cortex (A, B) and hippocampus (C, D). In Tg brains, reactive microgliosis is evident surrounding amyloid plaques, signified by red asterisks. E, F) Representative images of iba1 immunolabeling in 11-month-old WT and Tg retina. Microglia in both cohorts display ramified morphologies. G, H) Quantitative evaluation of iba1 area and semi-quantitative evaluation of activations status of iba1-positive cells. (I) Levels of IL-1β, TNFα, and IL-6 in Tg retinas as measured by qPCR. Data are normalized for GAPDH and expressed relative to WT. For all analyses, data are expressed as mean±SEM, where n = 10 for each age-matched group. Student’s unpaired t-tests revealed no significant differences between WT and Tg cohorts for any of the parameters measured. Scale bar: A, B = 250 μm; C-F = 25 μm. GCL, ganglion cell layer; INL, inner nuclear layer; ONL, outer nuclear layer.
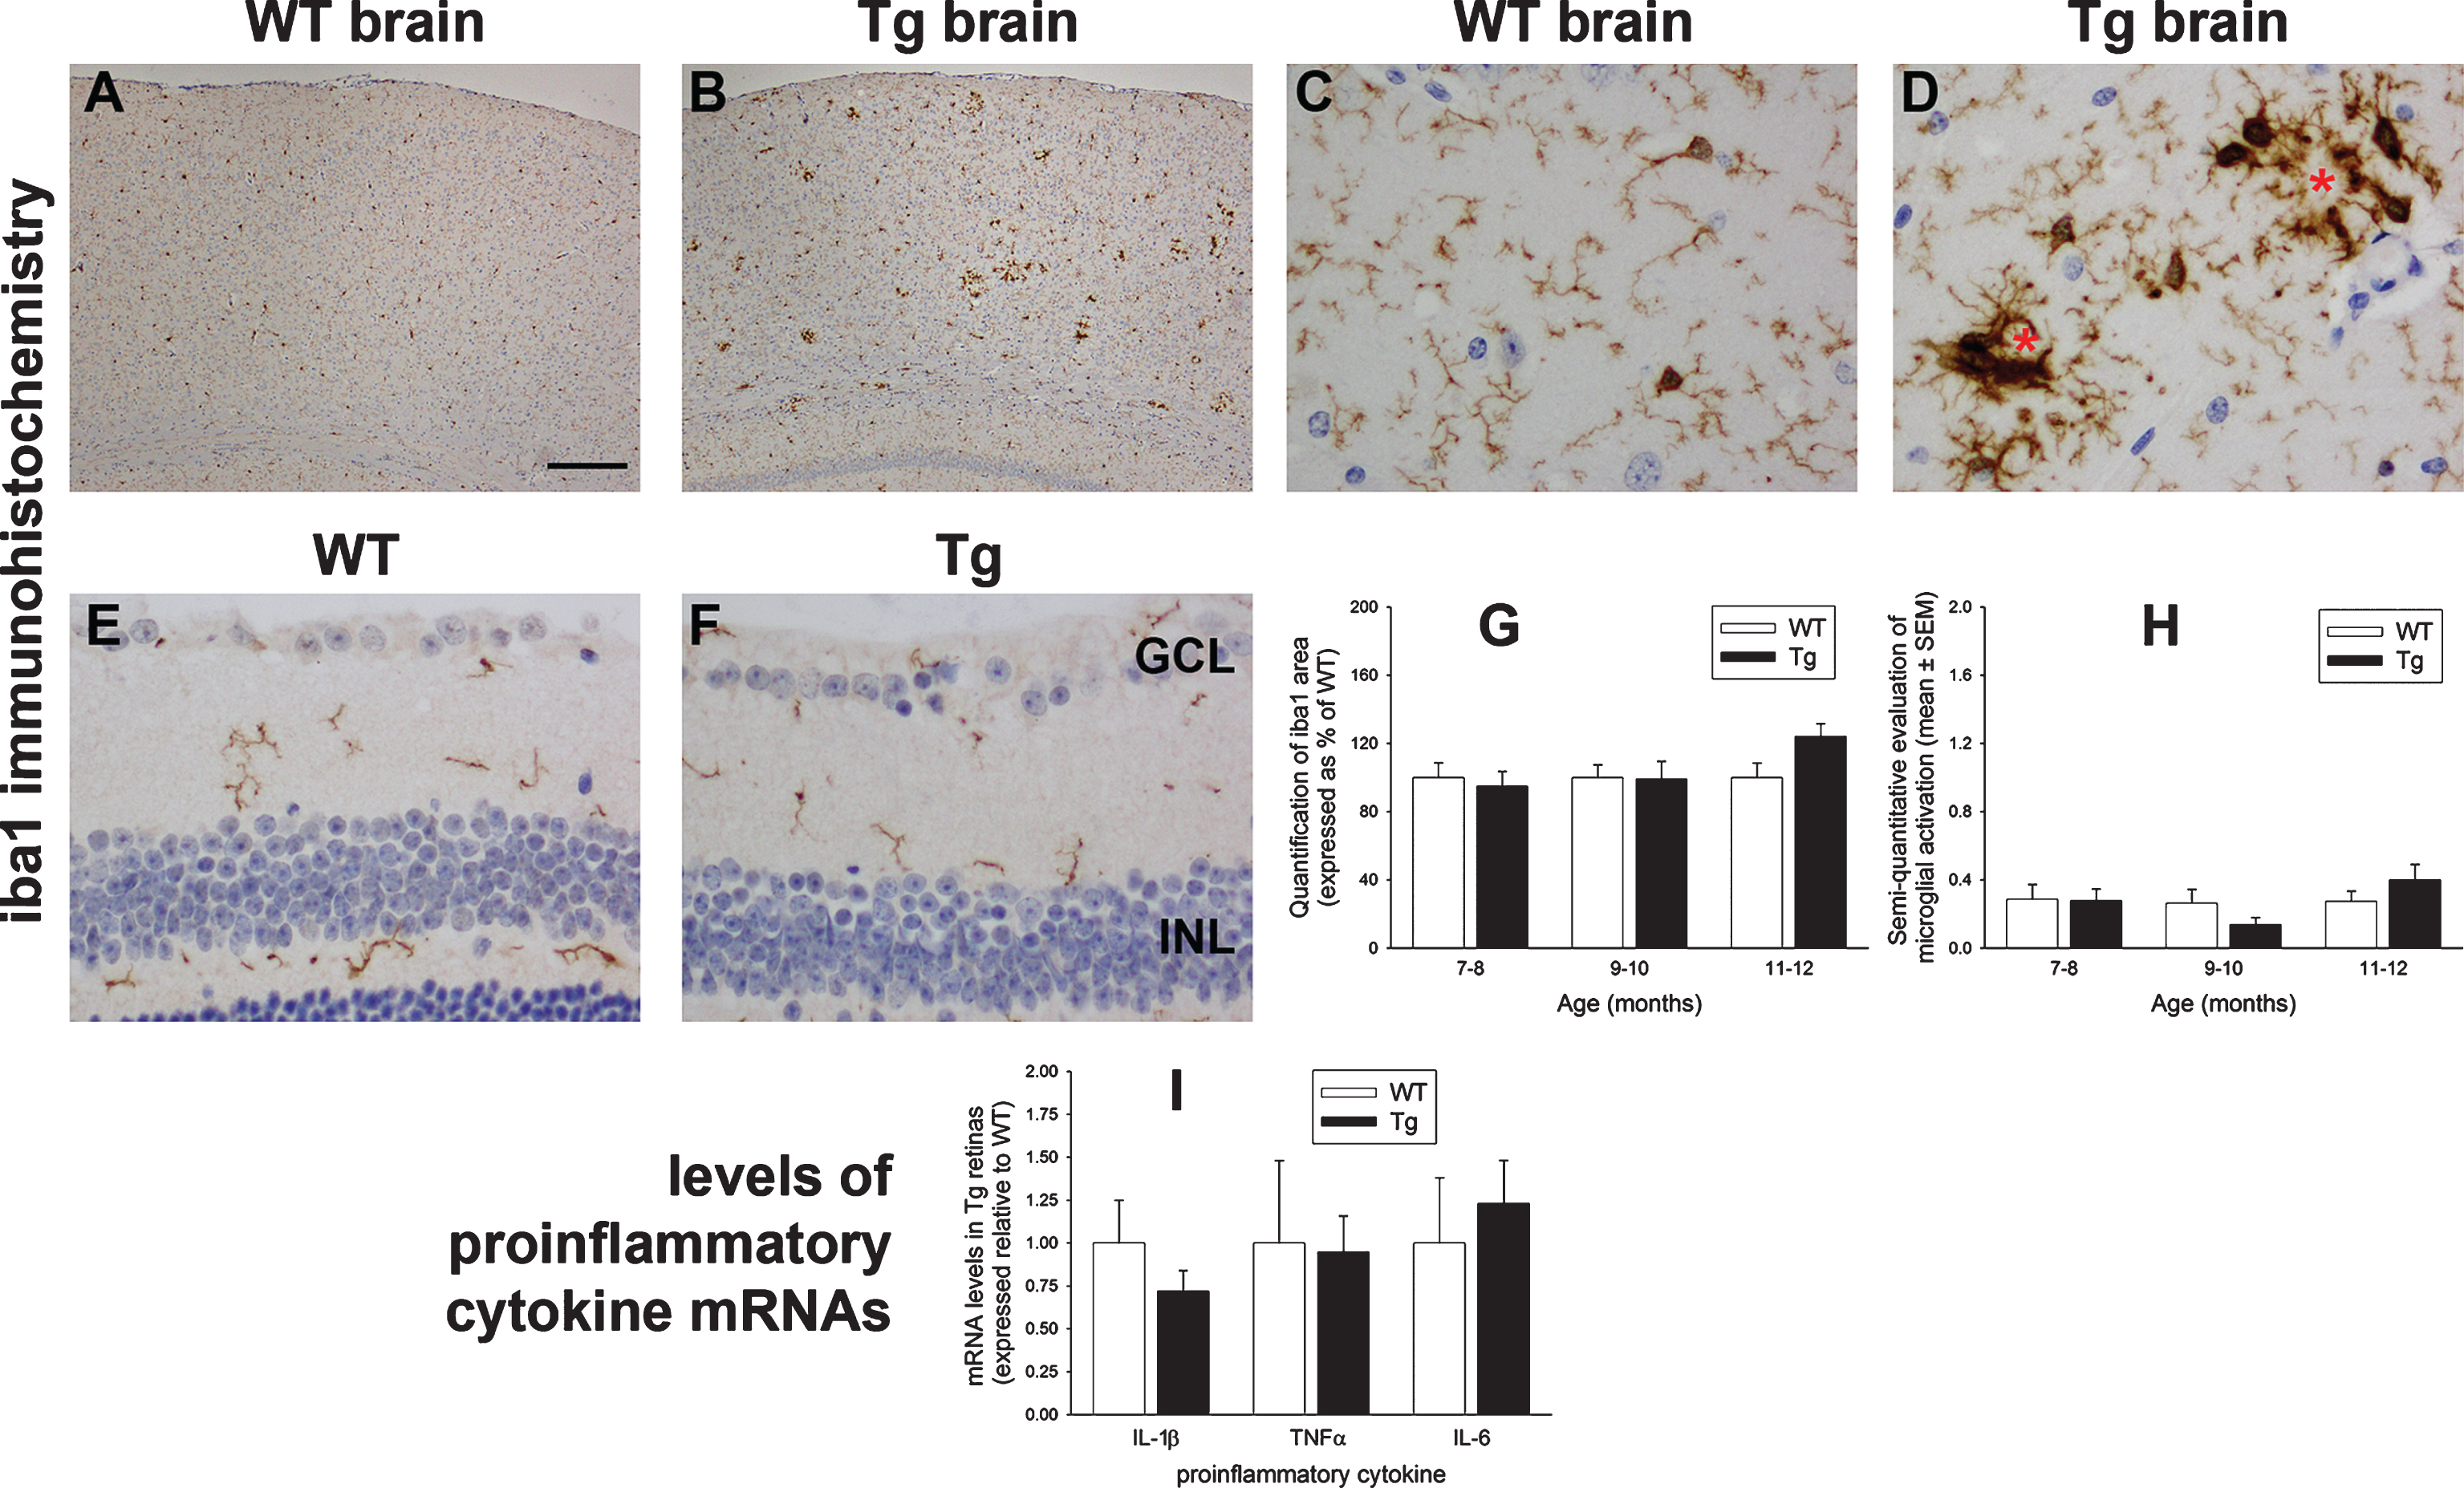
Fig.7
Analysis of GFAP expression in WT and Tg mice. Representative images of GFAP immunolabeling in 11-month-old WT and Tg parietal cortex (A, B) and hippocampus (C, D). In Tg brains, numerous GFAP-positive astrocytes are evident surrounding amyloid plaques, signified by red asterisks. E-G) Representative images of GFAP labeling in a retina subjected to branch retinal vein occlusion (BRVO, +ve control), and in 12-month-old WT and Tg retinas. GFAP immunoreactivity is chiefly restricted to astrocytes in the retinas of WT and Tg mice. In contrast, four days after BRVO, a substantial upregulation of GFAP is evident both in astrocytes (arrowhead) and Müller cells (arrow). Note: the area of retina shown is adjacent to the vein occlusion site and not directly affected. H) Semi-quantification evaluation of GFAP grade in WT and Tg retinas. Data are expressed as mean±SEM, where n = 10 for each age-matched group. Mann-Whitney test revealed no significant differences between the treatment groups. Scale bar: A, B = 250 μm; C, D = 25 μm; E-G = 50 μm. GCL, ganglion cell layer; INL, inner nuclear layer; ONL, outer nuclear layer. I, J) Expression of GFAP protein in 11–12-month-old WT and Tg retinas as evaluated by western immunoblotting. A single band of the expected molecular weight is apparent. Data (expressed as mean±SEM, where n = 10) are normalized for actin and expressed relative to WT. Student’s unpaired t-test revealed no significant difference between the treatment groups.
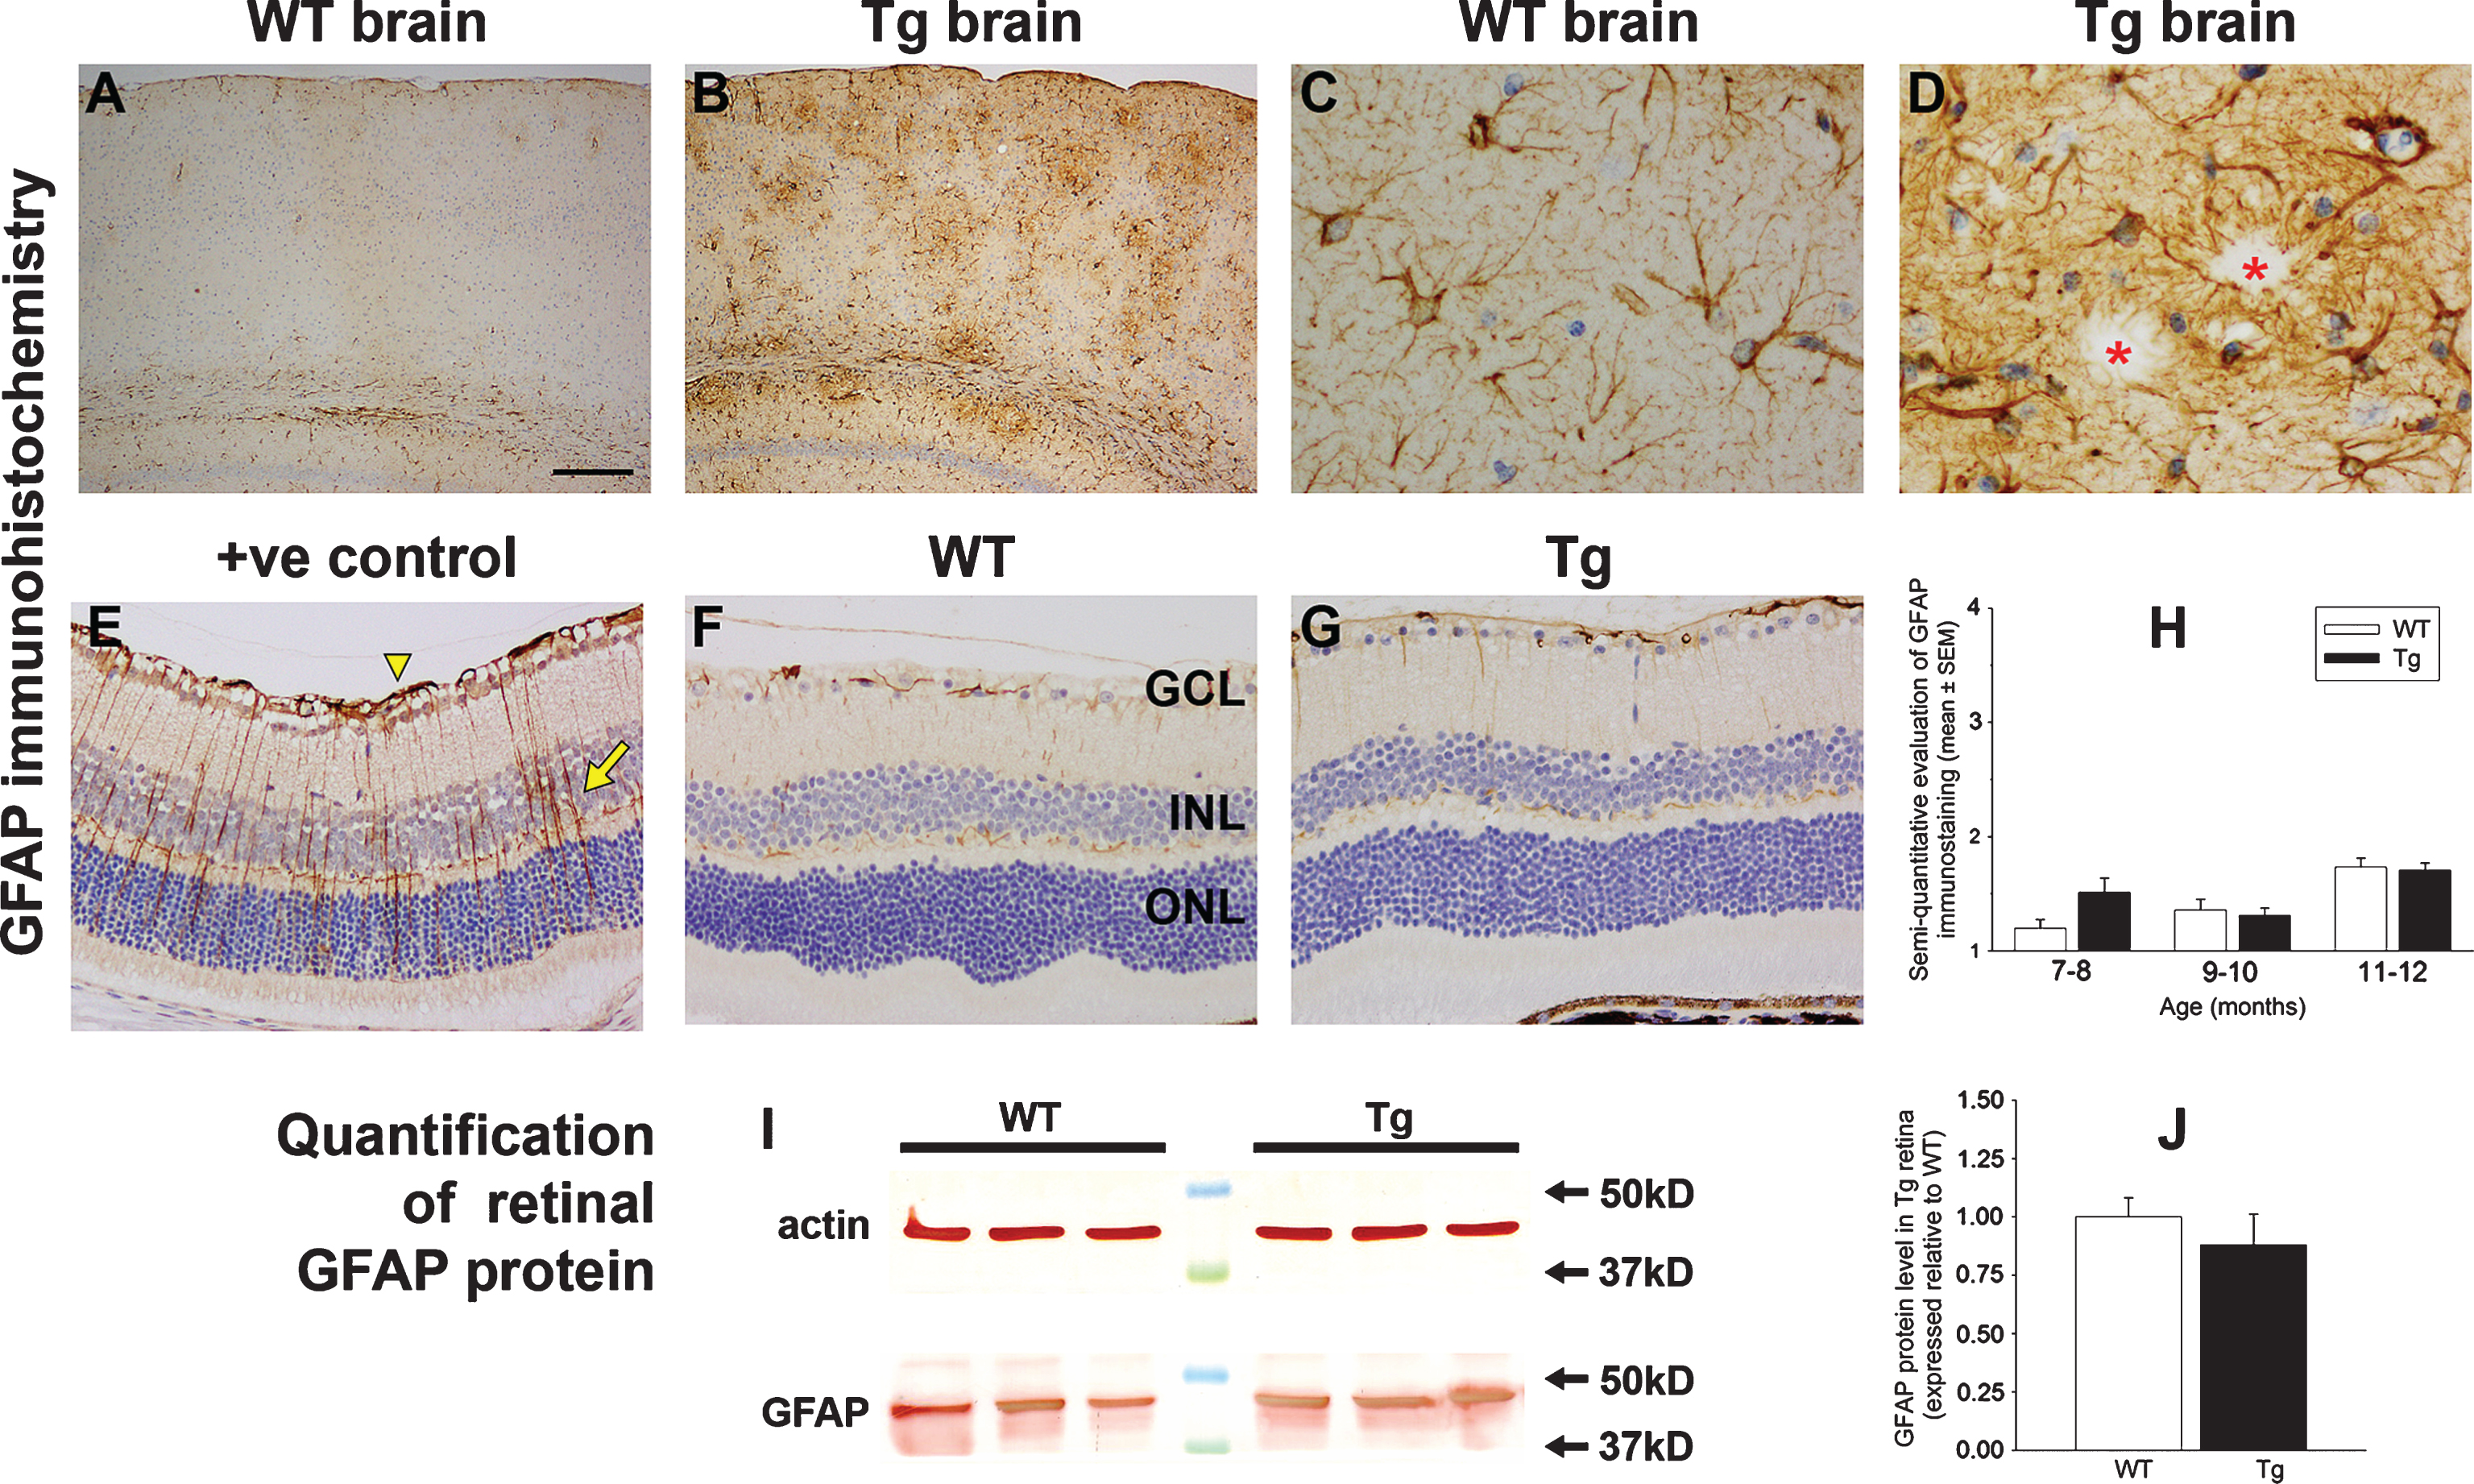
Fig.8
Analysis of various cellular stress markers in the retinas of WT and Tg mice. A-C) Expression of nestin in WT and Tg retinas. A) By western immunoblotting, a single band of the expected molecular weight is apparent in an extract from a retinal culture, but no obvious band is apparent in WT or Tg retinas. B) Representative image of nestin labeling in a 12-month-old Tg retina. C) Semi-quantification evaluation of nestin grade in WT and Tg retinas. Data are expressed as mean±SEM, where n = 10 for each age-matched group. Mann-Whitney test revealed no significant differences between the treatment groups. n.d., not determined. D-K) Representative images of cyclin D1 and CNTF labeling in a retina subjected to branch retinal vein occlusion (BRVO, +ve control), and in 12-month-old WT and Tg retinas. D, H) One day after BRVO, astrocytes (arrowhead) and Müller cells (arrow) label strongly for cyclin D1 and CNTF. Note: the area of retina shown is adjacent to the vein occlusion site and not directly affected. E, F) Cyclin D1 immunoreactivity is faintly associated with Müller cells in the retinas of both WT and Tg mice. I, J) CNTF immunoreactivity is faintly associated with Müller cells and astrocytes in the retinas of both WT and Tg mice. G, K) Semi-quantification evaluation of cyclin D1 and CNTF grades in WT and Tg retinas. Data are expressed as mean±SEM, where n = 10 for each age-matched group. Mann-Whitney tests revealed no significant differences between the treatment groups. Scale bar: B = 50 μm; D-F, H-J = 25 μm. GCL, ganglion cell layer; INL, inner nuclear layer; ONL, outer nuclear layer. L, M) Expression of FGF-2 and hsp25 proteins in 11–12-month-old WT and Tg retinas as evaluated by western immunoblotting. A single band of the expected molecular weight is apparent (representative 12 month samples are shown). Data (expressed as the mean±SEM, where n = 10) are normalized for actin and expressed relative to WT. Student’s unpaired t-tests revealed no significant difference between the treatment groups.
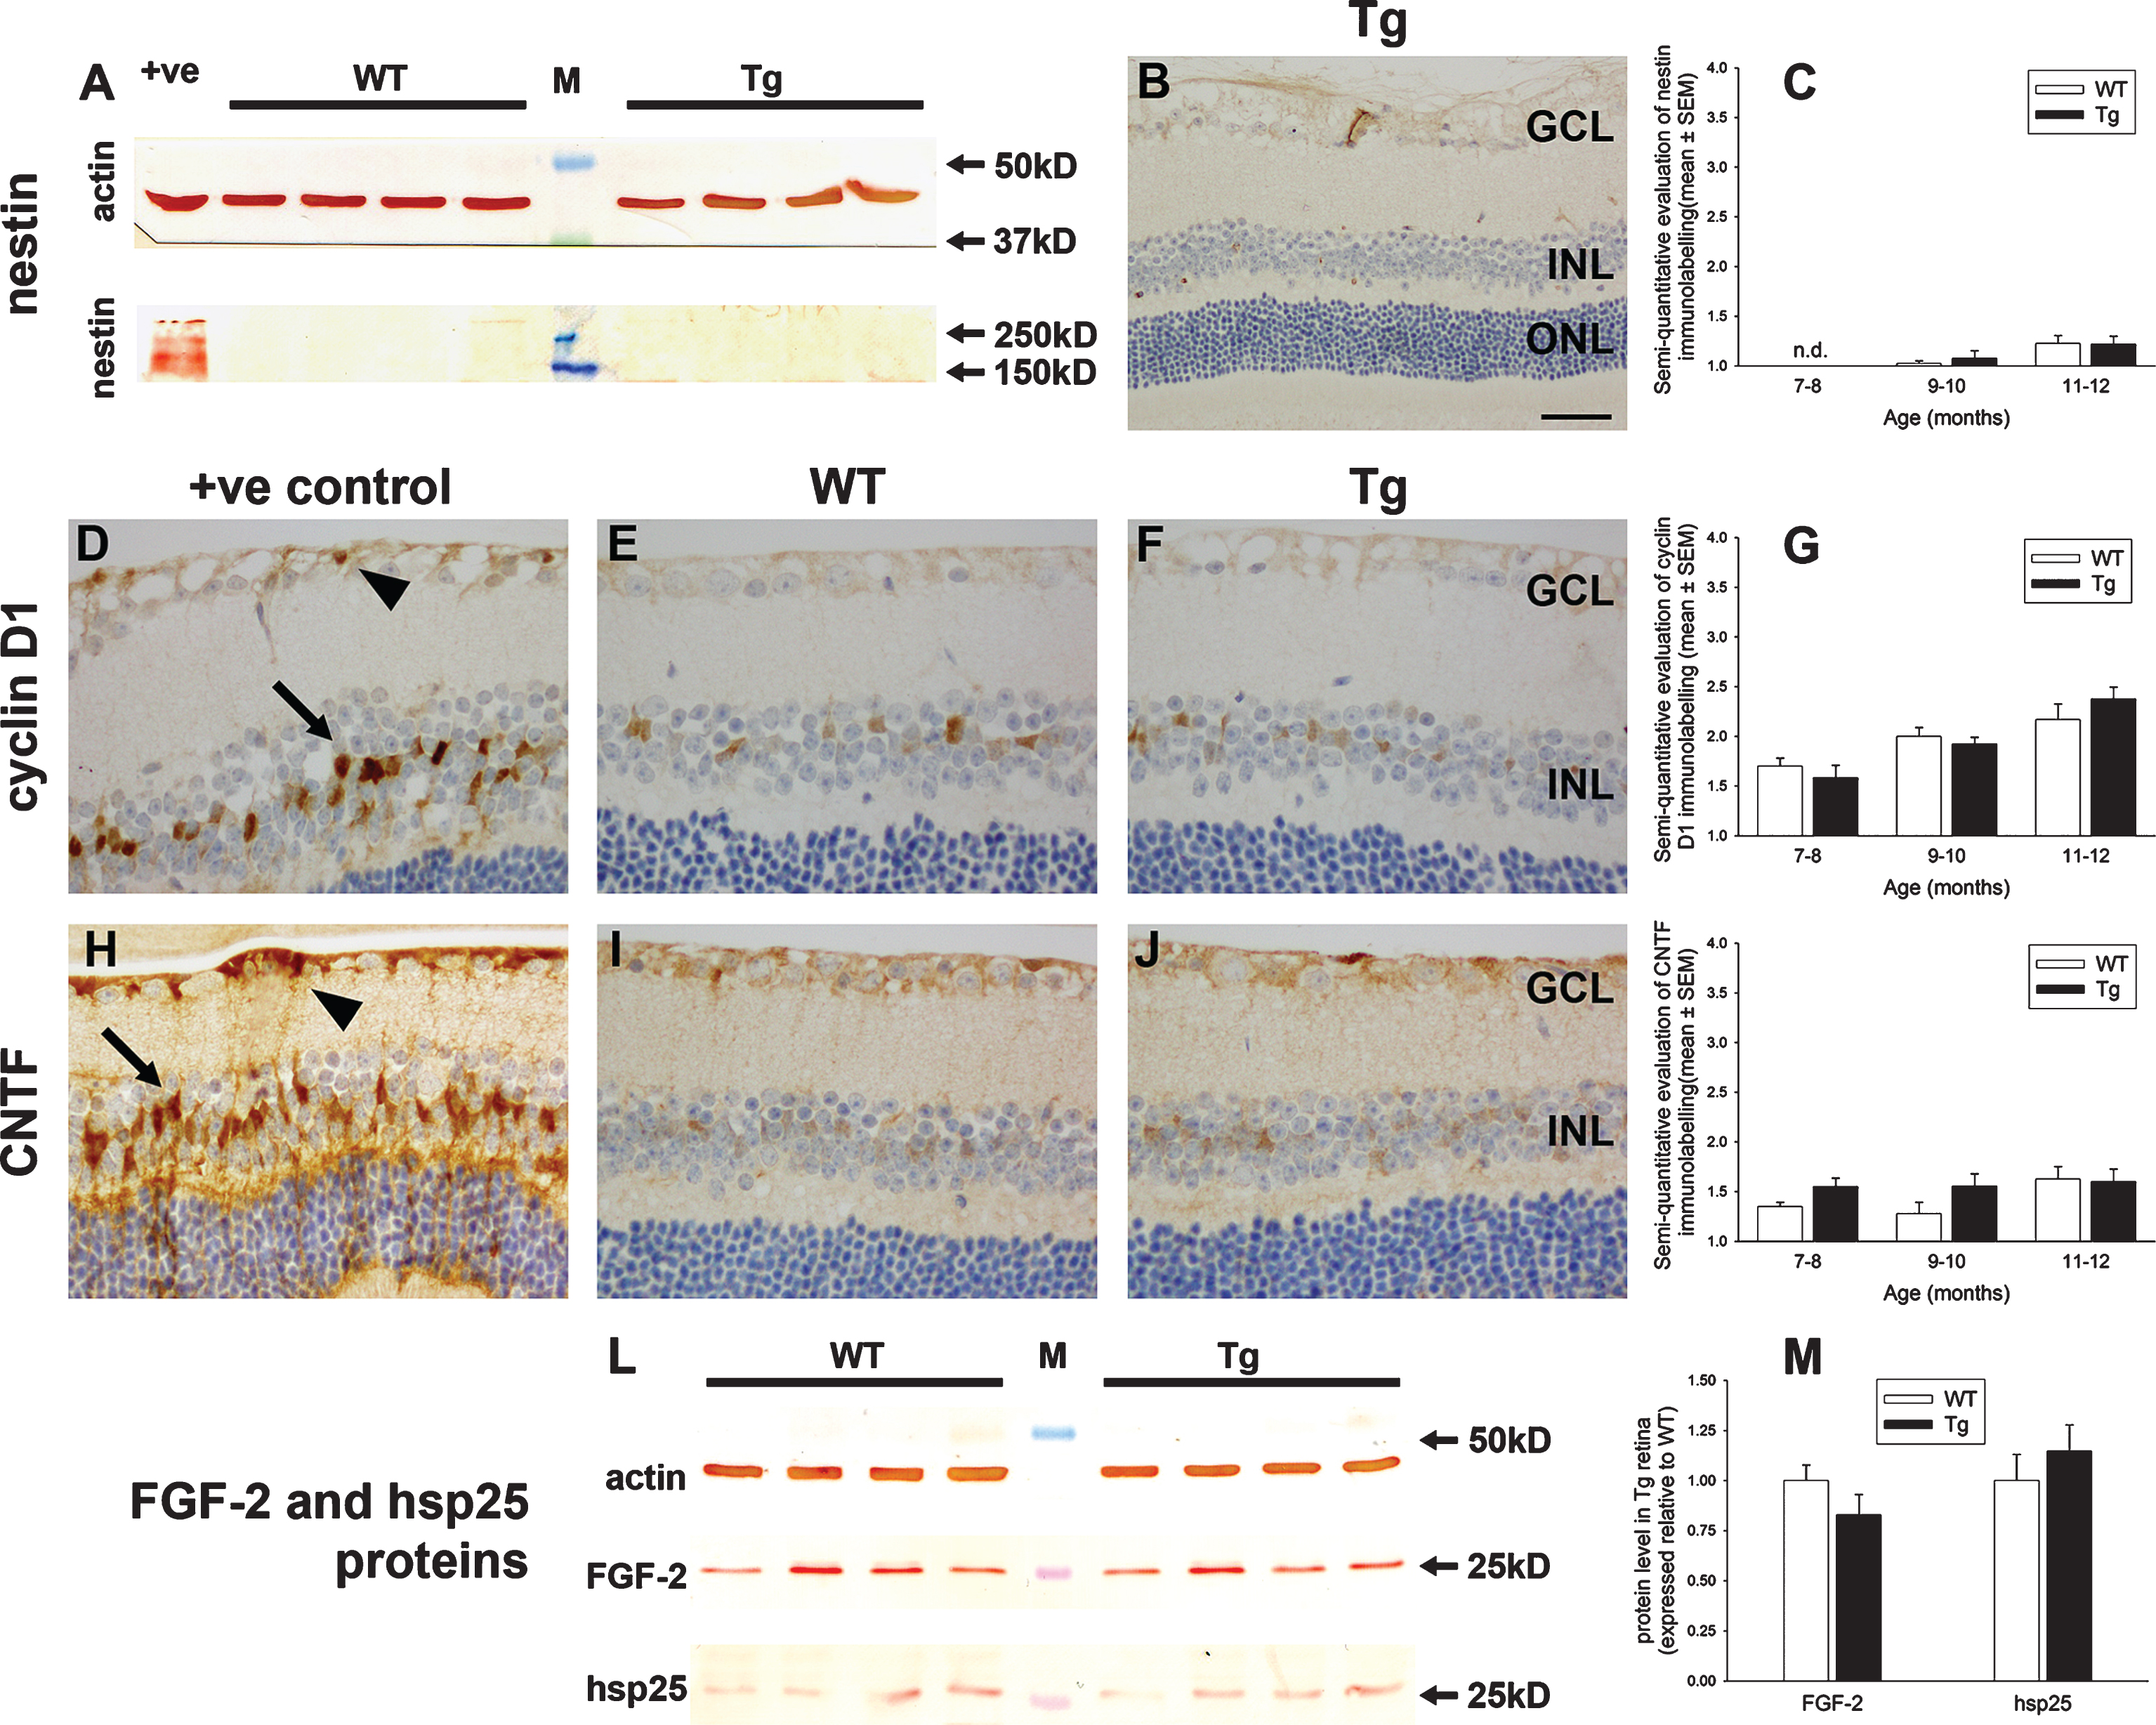
Fig.9
Analysis of heme oxygenase-1 (HO-1) expression in WT and Tg retinas. A) Expression of HO-1 protein in 12-month-old WT and Tg retinas as evaluated by western immunoblotting. An intense, single band of the expected molecular weight (32 kD) is apparent in an extract from a retinal culture treated with the pro-oxidant hydrogen peroxide (+ve). In WT and Tg retinas, a faint band of the correct molecular weight is evident. B) Representative images of HO-1 labeling in a retina subjected to branch retinal vein occlusion (BRVO, +ve control), and in 12-month-old WT and Tg retinas. HO-1 immunoreactivity is associated with astrocytes and Müller cells (arrows) in the retina analyzed 1d after induction of BRVO, and in activated microglia in the retina analyzed four days after induction of BRVO. Note: the area of retina shown is immediately adjacent to the vein occlusion site and not directly affected. No HO-1-positive cells are evident in WT or Tg retinas. Scale bar: 50 μm. GCL, ganglion cell layer; IPL, inner plexiform layer; INL, inner nuclear layer.
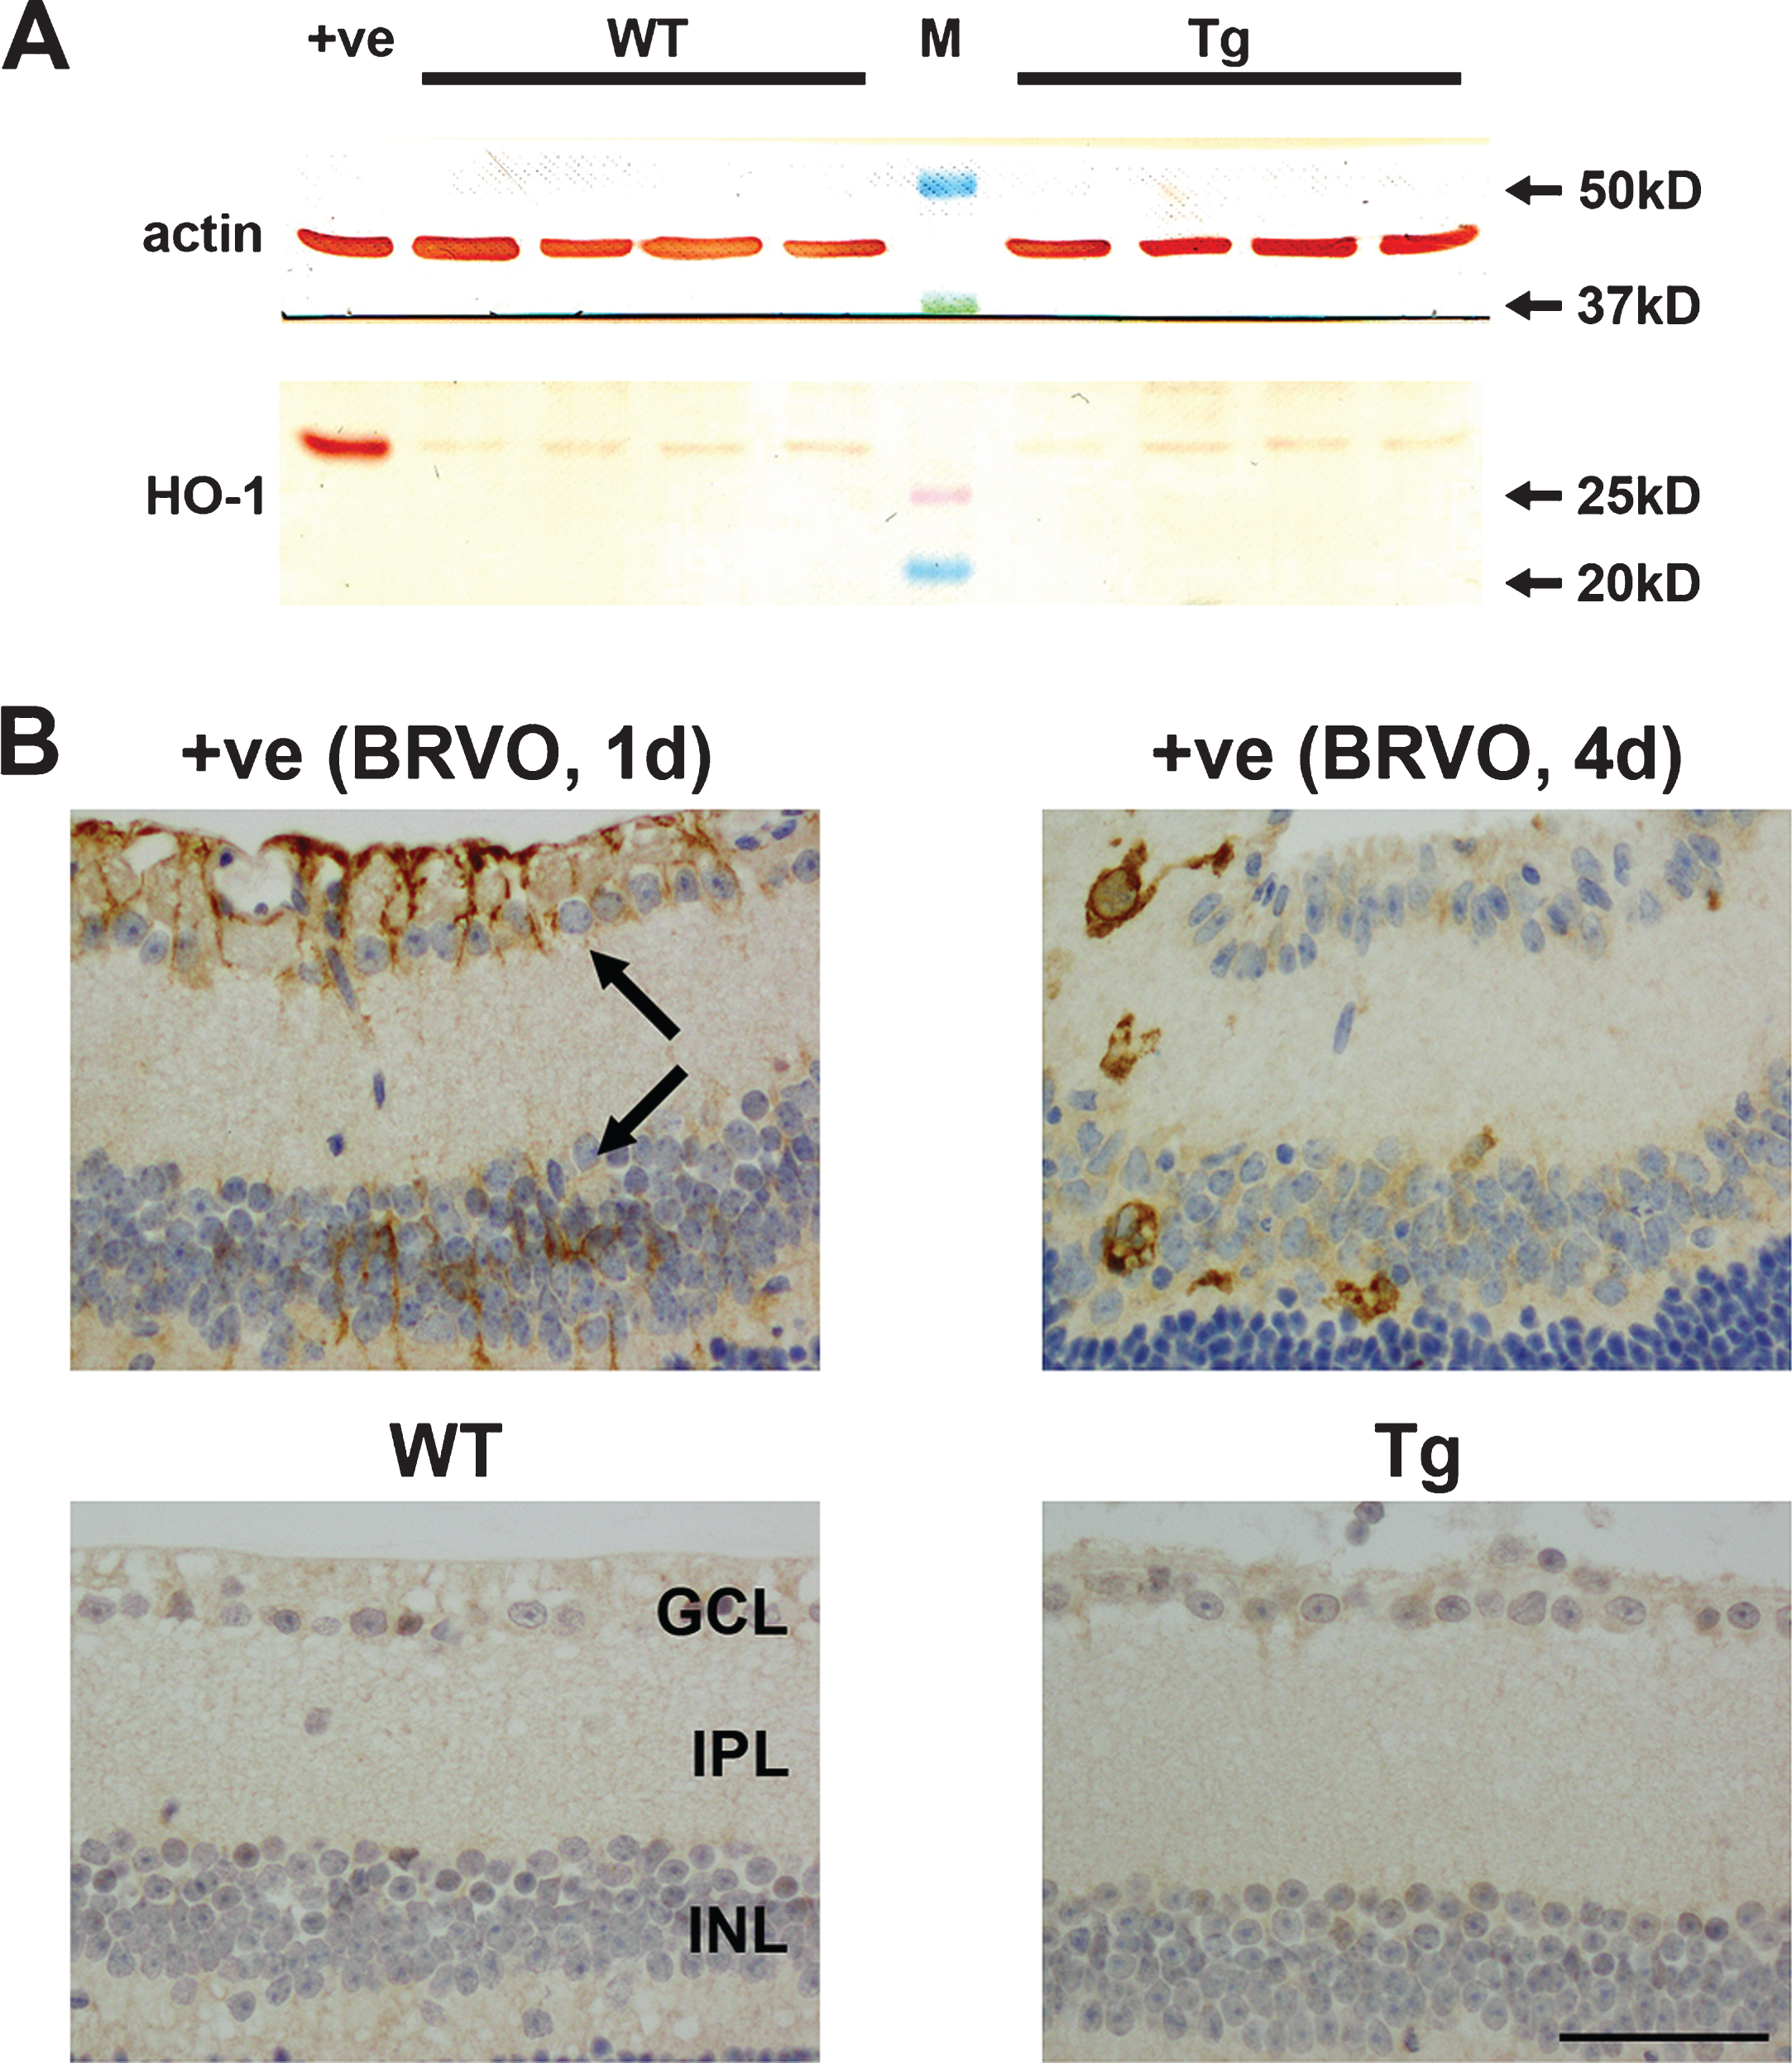
Fig.10
Representative images of p-cJUN and cFOS immunolabeling in 11-month-old WT and Tg retinas. A, B, E, F) Representative images of p-cJUN and cFOS labeling in a retina subjected to branch retinal vein occlusion (BRVO, positive controls) one day previously. p-cJUN (A, B) and cFOS (E, F) are upregulated by Müller cells (yellow arrows), astrocytes (yellow arrowheads), and RGCs (black arrows). Note: the areas of retina shown are not directly affected by the venous occlusion. C, D, G, H) No intensely labeled p-cJUN- or cFOS-positive cells are evident in WT or Tg retinas. Scale bar: 50 μm. GCL, ganglion cell layer; INL, inner nuclear layer.
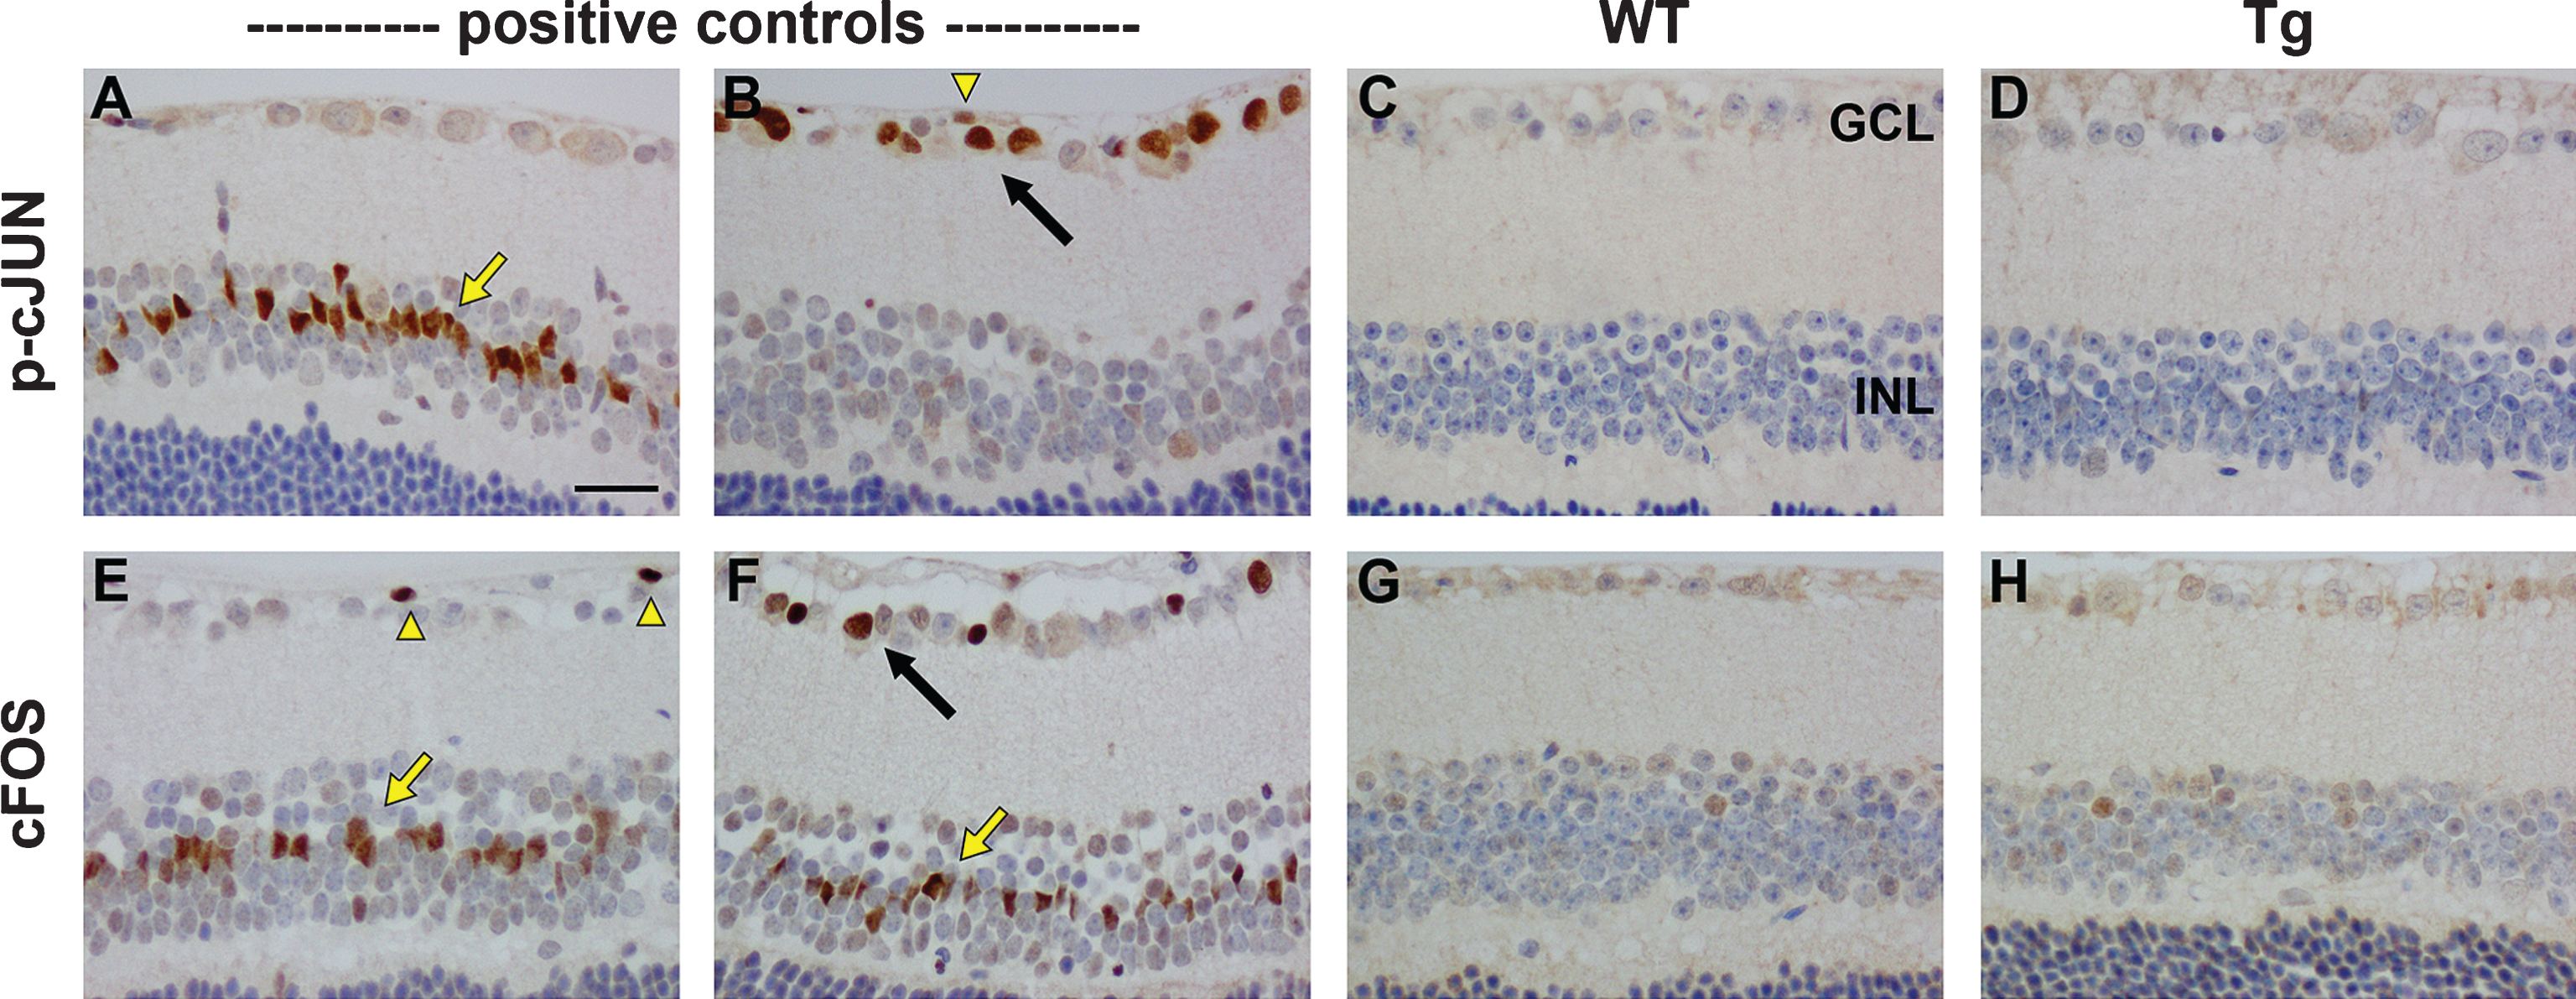
Fig.11
Analysis of hyperphosphorylated tau in WT and Tg retinas. Expression of tau, p-tau-T181, and p-tau-S262 proteins in 12-month-old WT and Tg retinas, as evaluated by western immunoblotting. Representative blots are shown from 12-month-old animals. Tau is abundant in extracts from WT and Tg retinas. In contrast, no unambiguous bands of the correct molecular weight are evident when membranes are incubated with antibodies directed against p-tau-T181 and p-tau-S262. Intense, single bands of the expected molecular weights are, however, apparent in an extract from a retinal culture treated with the potent phosphatase inhibitor calyculin A (+ve).