
The Identification of Aluminum in Human Brain Tissue Using Lumogallion and Fluorescence Microscopy
Abstract
Aluminum in human brain tissue is implicated in the etiologies of neurodegenerative diseases including Alzheimer’s disease. While methods for the accurate and precise measurement of aluminum in human brain tissue are widely acknowledged, the same cannot be said for the visualization of aluminum. Herein we have used transversely-heated graphite furnace atomic absorption spectrometry to measure aluminum in the brain of a donor with Alzheimer’s disease, and we have developed and validated fluorescence microscopy and the fluor lumogallion to show the presence of aluminum in the same tissue. Aluminum is observed as characteristic orange fluorescence that is neither reproduced by other metals nor explained by autofluorescence. This new and relatively simple method to visualize aluminum in human brain tissue should enable more rigorous testing of the aluminum hypothesis of Alzheimer’s disease (and other neurological conditions) in the future.
INTRODUCTION
Quantitative and semi-quantitative methods have confirmed the presence of aluminum in human brain tissue [1]. Recent research has highlighted some of the difficulties in obtaining reliable and reproducible quantitative data for brain aluminum content and specifically in relation to its heterogeneous distribution or tendency to be found in focal or discrete deposits [2, 3]. It is of critical importance that we are able to make accurate measurements of the aluminum content of human brain tissue as aluminum is implicated in the etiologies of a number of neurodegenerative diseases and especially in Alzheimer’s disease [4] where it may contribute toward disease onset and progression [5]. While significant progress has been made in measuring the aluminum content of brain tissue, there have not been similar advances in the ability to visualize aluminum in human brain tissue sections postmortem. The spectroscopically ‘silent’ Al3 + cation does not lend itself easily to imaging techniques now routinely used to identify other metal ions in human brain tissue. However, there is a clear need for a relatively simple and non-invasive microscopy-based method to image aluminum and thereby complement and add credence to quantitative measurements. Herein we have optimized the fluor, lumogallion, for the identification of aluminum in human brain tissue using fluorescence microscopy. Lumogallion [4-chloro-3-(2,4 dihydroxyphenylazo)-2-hydroxybenzene-1-sulphonic acid] has a high affinity for Al3 + and has been used for decades to measure aluminum in seawater with a limit of detection of ca 2 nM [6]. Upon binding Al3 + and excitation at ca 500 nm, the 1 : 1 complex emits aluminum-specific fluorescence at ca 590 nm and these properties have already been adapted for the identification of aluminum in plant tissues [7] and recently to show the intracellular presence of aluminum in immune-reactive cells [8]. We have measured the aluminum content of brain tissue donated by an individual with Alzheimer’s disease and complemented these data with the unequivocal visual identification of aluminum using fluorescence microscopy.
MATERIALS AND METHODS
The donor was a 69-year-old man, originally from the town of Camelford, Cornwall, and known to have been exposed to aluminum during this, now, infamous event when 20 tons of aluminum sulphate were inadvertently added to the potable water supply [9]. In 2005, aged 60, the donor was admitted to a nursing home with suspected Alzheimer’s disease. He died in 2014, at which point the left half of the brain was fixed in formalin and retained for neuropathological examination, while the right half of the brain had been sliced and frozen for the MRC London Neurodegenerative Diseases Brain Bank. The fixed left half of the brain weighed 463 g and the left half brain stem and cerebellum weighed 81 g. External examination revealed cerebral atrophy and coronal slices of the cerebral hemisphere confirmed atrophy with a small hippocampus. The histology showed extensive and widespread tau pathology in the form of neuritic plaques, neurofibrillary tangles, and neuropil threads in addition to amyloid-β deposition in the form of plaques and moderate amyloid angiopathy. This met the criteria for Brain Net Europe (BNE)/modified Braak stage VI of Alzheimer’s disease [10], and reached the score A-3, B-3, C-3 (high Alzheimer’s disease neuropathological change) according to the National Institute of Aging-Alzheimer’s Association guidelines [11]. There was also some cortical Lewy body and TDP-43 pathology noted.
There was ethical approval from The MRC London Neurodegenerative Diseases Brain Bank at King’s College, London (08/MRE09/38 + 5).
Frozen tissue samples, 5–10 g, were transported on dry ice to Keele University and stored frozen. The aluminum content of these tissues was measured by an established and fully validated method, which herein is described briefly. Thawed tissues were cut using a stainless steel blade to give individual samples of ca 0.5 g wet weight and dried to a constant weight at 37°C. Dried and weighed tissues were digested in a microwave (MARS Xpress CEM Microwave Technology Ltd.) in a mixture of 1 mL 15.8 M HNO3 (Fisher Analytical Grade) and 1 mL 30% w/v H2O2 (BDH Aristar). Digests were clear with no fatty residues and, upon cooling, were made up to 5 mL volume using ultrapure water (cond. <0.067 μS/cm). Total aluminum was measured in each sample by transversely-heated graphite furnace atomic absorption spectrometry (TH GFAAS) using matrix-matched standards and an established analytical program [2].
A 1 mM lumogallion (Tokyo Chemical Industry, UK) solution was prepared in 50 mM PIPES (Sigma-Aldrich, UK), buffered to pH 7.40±0.05 and stored in the dark when not in use. A 50 mM PIPES rinse solution buffered to pH 7.40±0.05 was also prepared. An ethanol gradient series (100, 95, 90, 70, 50, and 30%) was prepared using ultrapure water and absolute ethanol. The clearing agent, Histo-ClearTM (National Diagnostics, UK), was used as purchased. Superfrost®Plus slides (Thermo Scientific, UK) were used to adhere brain tissue sections. Slides were cleaned using lens tissue (Polysciences Inc., UK). Fluoromounttrademark (Sigma-Aldrich, UK) was used as an aqueous mounting medium and was stored in the dark when not in use. Formalin-fixed brain tissue was supplied as pre-embedded paraffin blocks representing frontal, parietal, and temporal and occipital lobes. Hippocampal sections were not available. Prior to microtomy blocks were cooled in ice for 3 h before 5 μm sections were cut at a clearance angle of 5°. Sections were floated onto a 50°C water bath for approximately 30 s before being mounted on microscope slides and thereafter being placed on a hotplate at 30°C for 2 h. Slides were then stored at room temperature overnight to ensure they were fully dried out. Slides were dewaxed using Histo-ClearTM and run through the aforementioned ethanol gradient from 100 to 30% before being immersed for 30 s in ultrapure water to remove all residual alcohol. Serial adjacent sections were then incubated in either 1 mM lumogallion in 50 mM PIPES at pH 7.40±0.05 or simply 50 mM PIPES at pH 7.40±0.05 for 45 min, the latter being used to determine the contribution from autofluorescence. Incubated slides from either treatment were rinsed 6 times in 50 mM PIPES at pH 7.40±0.05, placed in a dish of ultrapure water for 30 s before coverslips were secured using 2 drops of Fluoromounttrademark mounting medium. All of the aforementioned procedures, from sectioning to mounting, are the final outcomes of significant optimization to give the very best reproducible materials for subsequent fluorescence microscopy. Slides were imaged using an Olympus BX50 fluorescence microscope with a BX-FLA reflected light fluorescence attachment, equipped with a mercury burner and a vertical illuminator. For lumogallion (and autofluorescence) imaging, a U-MNIB3 fluorescence filter cube was used (bandpass excitation filter: 470–495 nm, dichromatic mirror: 505 nm, longpass emission filter: 510 nm) (both from Olympus, UK). Images were obtained using CellD software (Olympus Soft Imaging Solutions GmbH).
Agarose gels were prepared as surrogates for human tissues. Agarose (National Diagnostics, USA) at 2% w/v was dissolved in either ultra-pure water (<0.067 μS/cm) or 10 mM certified (PE Life Sciences) metal stocks (Al, Cu, Fe, Zn, Ca, Mg) in ultra-pure water, adjusted to pH 5.0, by heating to 95°C for up to 30 min. Blocks of metal-impregnated agarose were prepared by pouring hot solution into molds and leaving to solidify at 4°C. Square sections, 0.5 cm by 0.5 cm, of agarose block were cut by hand and then processed for lumogallion staining as per brain tissues described above.
RESULTS
Aluminum content of brain tissue
The mean aluminum content in each brain region varied from 0.45 (0.84) μg/g dry wt. in the hippocampus to 1.75 (1.43) μg/g dry wt. in the occipital lobe (Table 1). The concentration of aluminum in tissue replicates ranged from the limit of detection, 0.01 μg/g dry wt. to 5.58 μg/g dry wt. with the temporal lobe showing 1/9 values considered as pathologically significant; the hippocampus showing 1/10 values considered as pathologically concerning; the occipital lobe showing 9/21 values as either pathologically concerning or significant; the frontal lobe showing 1/21 values as pathologically significant and the parietal lobe showing 5/21 values as either pathologically concerning or significant.
Fluorescence imaging of aluminum in agarose sections
Only aluminum-impregnated agarose blocks produced characteristic orange fluorescence upon staining with lumogallion and imaging with the U-MNIB3 fluorescence filter cube (Fig. 1B, I). Neither pure agarose nor agarose impregnated with Ca(II), Cu(II), Fe(III), Mg(II), or Zn(II) produced any lumogallion-related fluorescence (Fig.1).
Fluorescence imaging of aluminum in brain tissue
Aluminum was identified as orange fluorescence in grey and white matter from all four lobes of the brain (Figs. 2–4). There was no aluminum-related autofluorescence in adjacent serial sections and this helped to confirm the positive and unequivocal identification of aluminum in each of the sections Figs. 2A‒C, 3A‒C, 4A, C. Yellow ‘fluorescence’ in all sections is suggested to be lipofuscin and is similarly identified under autofluorescence in all sections. Bright green fluorescence in lumogallion-stained tissues with the appearance of lipofuscin may be indicative of the co-localization of aluminum and lipofuscin (Fig. 3E). Aluminum was easily identified throughout the occipital lobe and appeared primarily as diffuse, almost certainly, extracellular deposits (Figs. 2 and 3). Easily identifiable aluminum fluorescence covered areas of tissue up to a diameter of 20 μm or more and these upon closer inspection appeared to include distinct punctate deposits of aluminum not dissimilar in structure to those making up yellow lipofuscin granules. Sub-micron particles exhibiting orange fluorescence suggest the possibility of intraneuronal aluminum though such must remain equivocal for now. Aluminum fluorescence was identifiable in grey matter of temporal lobe (Fig. 4) though the numbers of deposits were fewer and further between and generally they were also smaller in size.
DISCUSSION
Aluminum was identified quantitatively by TH GFAAS (Table 1) and qualitatively by fluorescence microscopy (Figs. 2–4) in brain tissue from a donor diagnosed with Alzheimer’s disease. The latter represents the first unequivocal identification of aluminum in human brain tissue using fluorescence microscopy. Aluminum was found in concentrations deemed to be pathologically-significant in each of the four main lobes and pathologically-concerning in the hippocampus. Aluminum content was especially high in occipital and parietal lobes and was coincident with significant Alzheimer’s disease-related neuropathology. This detailed neuropathology will be described in a companion paper. We confirmed the measurements of aluminum using TH GFAAS by using fluorescence microscopy to show unequivocally the presence of aluminum in human brain tissue. We developed the aluminum-selective fluor lumogallion specifically for this purpose and confirmed the identification of aluminum by proving that the observed fluorescence could neither by explained by another metal (Fig. 1) nor autofluorescence. The ability to measure aluminum in human brain tissue with accuracy and precision is now widely accepted while a relatively simple method to visualize aluminum in human brain tissue has hitherto been elusive. The method developed in this research should be immediately accessible to most laboratories and combined with other microscopy techniques should allow the detailed investigation of not only the presence of aluminum but its locations and potentially, associations, in human brain tissue.
ACKNOWLEDGMENTS
This research is supported by an Acorn (CMSRI/Keele University) PhD studentship awarded to AM. Dr. MJ Mold is thanked for his help in developing the lumogallion staining method.
Authors’ disclosures available online (http://j-alz.com/manuscript-disclosures/16-0648r1).
REFERENCES
[1] | Exley C , House E ((2011) ) Aluminium in the human brain. Monat Chem 142: , 357–363. |
[2] | House E , Esiri M , Forster G , Ince PG , Exley C ((2012) ) Aluminium, iron and copper in human brain tissues donated to the medical research council’s cognitive function and ageing study. Metallomics 4: , 56–65. |
[3] | Exley C , Vickers T ((2014) ) Elevated brain aluminium and early onset Alzheimer’s disease in an individual occupationally exposed to aluminium: A case report. J Med Case Rep 8: , 41. |
[4] | Perl DP , Brody AR ((1980) ) Alzheimer’s disease – x-ray spectrometric evidence of aluminum accumulation in neurofibrillary tangle-bearing neurons. Science 208: , 297–299. |
[5] | Exley C ((2014) ) Why industry propaganda and political interference cannot disguise the inevitable role played by human exposure to aluminum in neurodegenerative diseases, including Alzheimer’s disease. Front Neurol 5: , 212. |
[6] | Hydes DJ , Liss PS ((1976) ) Fluorimetric method for determination of low concentrations of dissolved aluminium in natural waters. Analyst 101: , 922–931. |
[7] | Kataoka T , Mori M , Nakanishi TM , Matsumoto S , Uchiumi A ((1997) ) Highly sensitive analytical method for aluminum movement in soybean root through lumogallion staining. J Plant Res 110: , 305–309. |
[8] | Mold M , Eriksson H , Siesjö P , Darabi A , Shardlow E , Exley C ((2014) ) Unequivocal identification of intracellular aluminium adjuvant in a monocytic THP-1 cell line. Sci Rep 4: , 6287. |
[9] | Exley C , Esiri M ((2006) ) Severe cerebral congophilic angiopathy coincident with increased brain aluminium in a resident of Camelford, Cornwall, UK. J Neurol Neurosurg Psychiatry 77: , 877–879. |
[10] | Alafuzoff I , Arzberger T , Al-Sarraj S , Bodi I , Bogdanovic N , Braak H , Bugiani O , Del-Tredici K , Ferrer I , Gelpi E , Giaccone G , Graeber MB , Ince P , Kamphorst W , King A , Korkolopoulou P , Kovács G , Larionov S , Meyronet D , Monoranu C , Parchi P , Patsouris E , Roggendorf W , Seilhean D , Tagliavini F , Stadelmann C , Streichenberger N , Thal DR , Wharton SB , Kretzschmar H ((2008) ) Staging of neurofibrillary pathology in Alzheimer’s disease: A study of the BrainNet Europe Consortium. Brain Pathol 18: , 484–496. |
[11] | Montine TJ , Phelps CH , Beach TG , Bigio EH , Cairns NJ , Dickson DW , Duyckaerts C , Frosch MP , Masliah E , Mirra SS , Nelson PT , Schneider JA , Thal DR , Trojanowski JQ , Vinters HV , Hyman BT; National Institute on Aging; Alzheimer’s Association ((2012) ) National Institute on Aging – Alzheimer’s Association guidelines for the neuropathologic assessment of Alzheimer’s disease: A practical approach. Acta Neuropathol 123: , 1–11. |
Figures and Tables
Fig.1
Light and fluorescence images of metal-impregnated agarose blocks stained with lumogallion. A, H) agarose gel only; B, I) agarose gel + Al(III); C, J) agarose gel + Ca(II); D, K) agarose gel + Cu(II); E, L) agarose gel + Fe(III); F, M) agarose gel + Mg(II); G, N) agarose gel + Zn(II). Stars indicate equivalent areas of each agarose block. Scale bar is 50 μm.
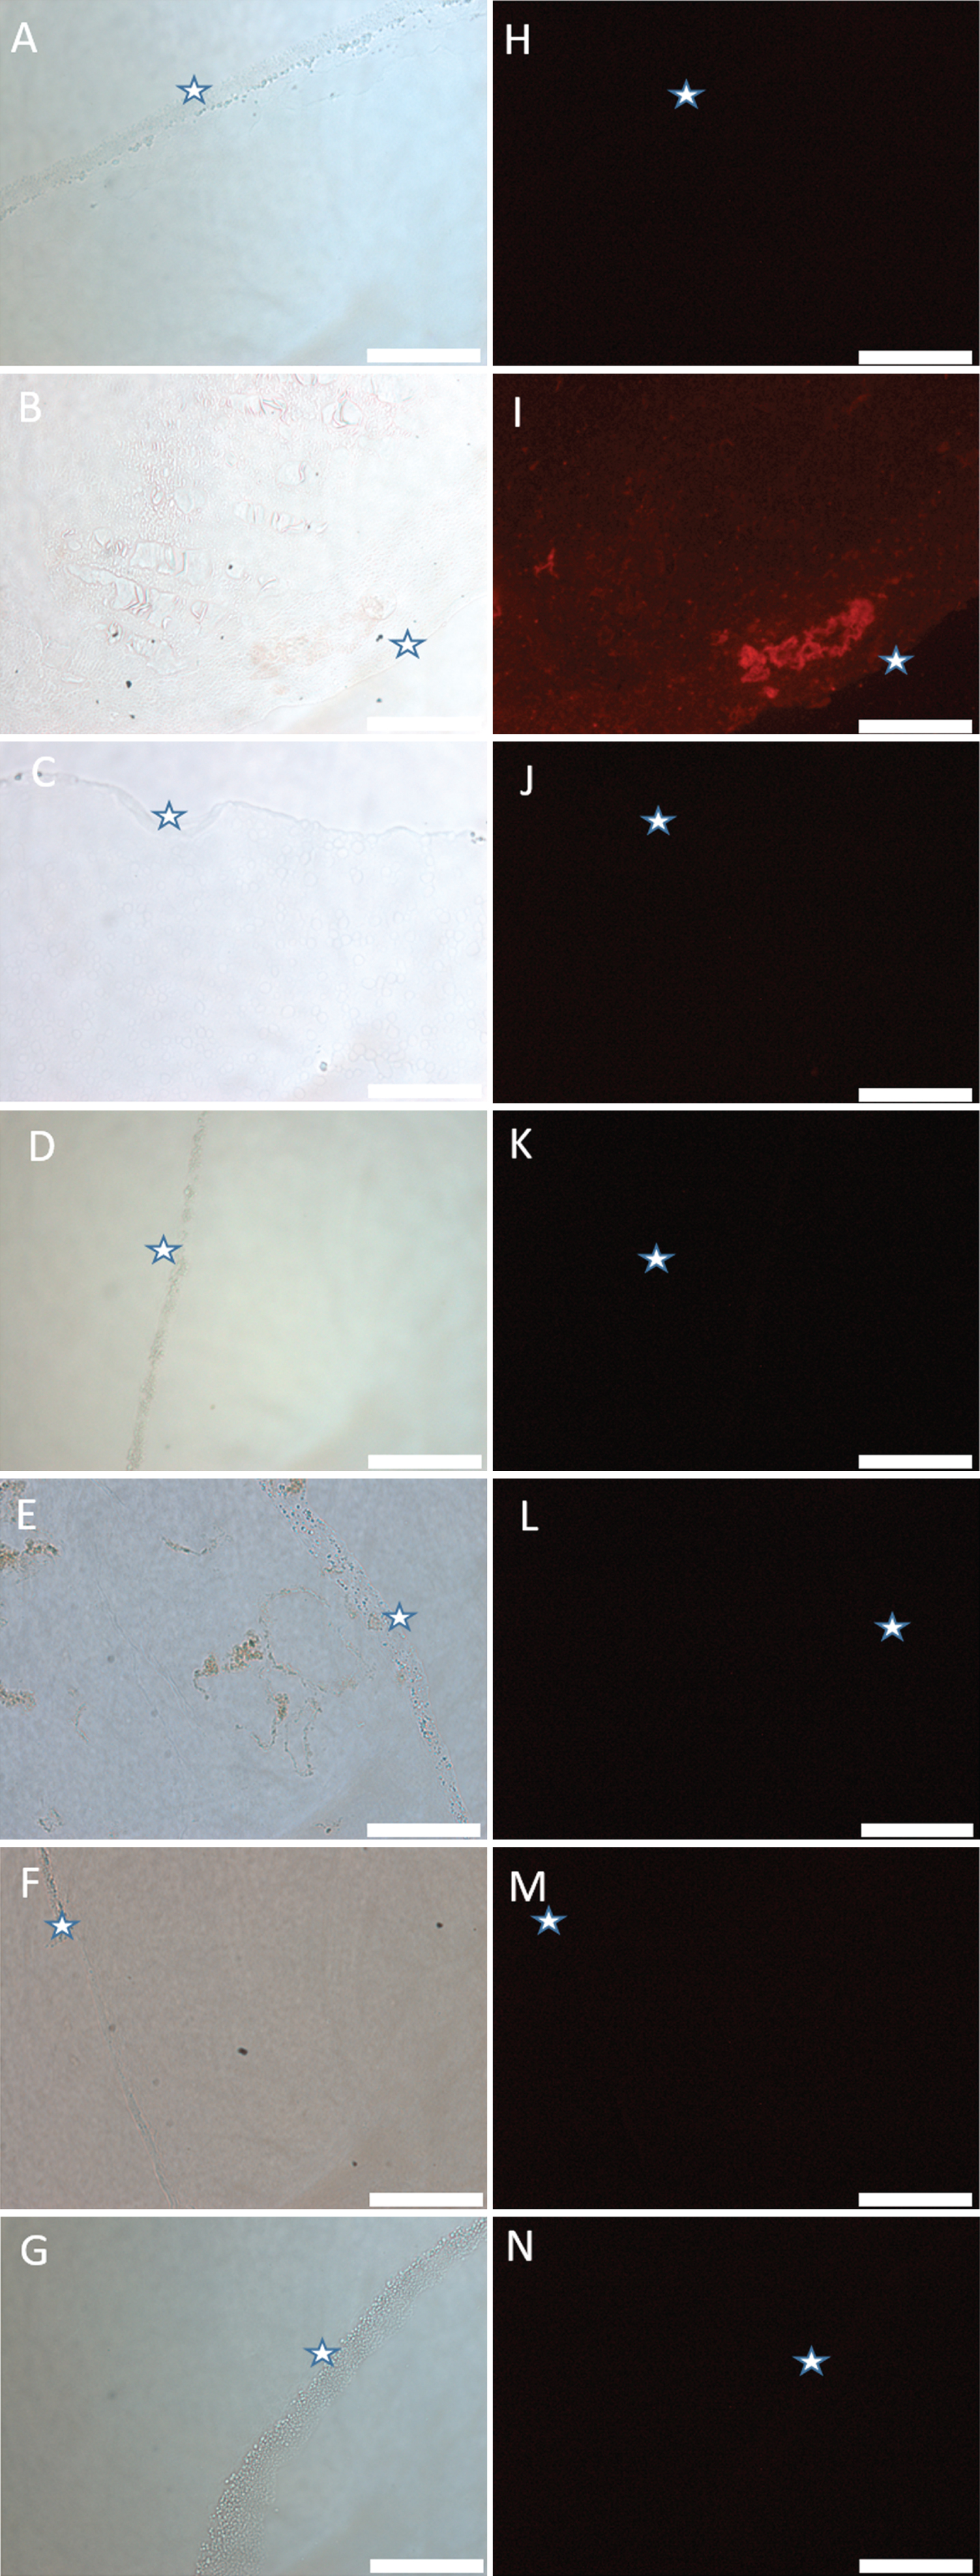
Fig.2
Autofluorescence (A–C) and fluorescence (D–F) images of occipital lobe stained with lumogallion. Significant deposits of aluminum showing strong positive fluorescence are circled. Scale bar is 100 μm (A and D) and 50 μm (B, C, E, F).
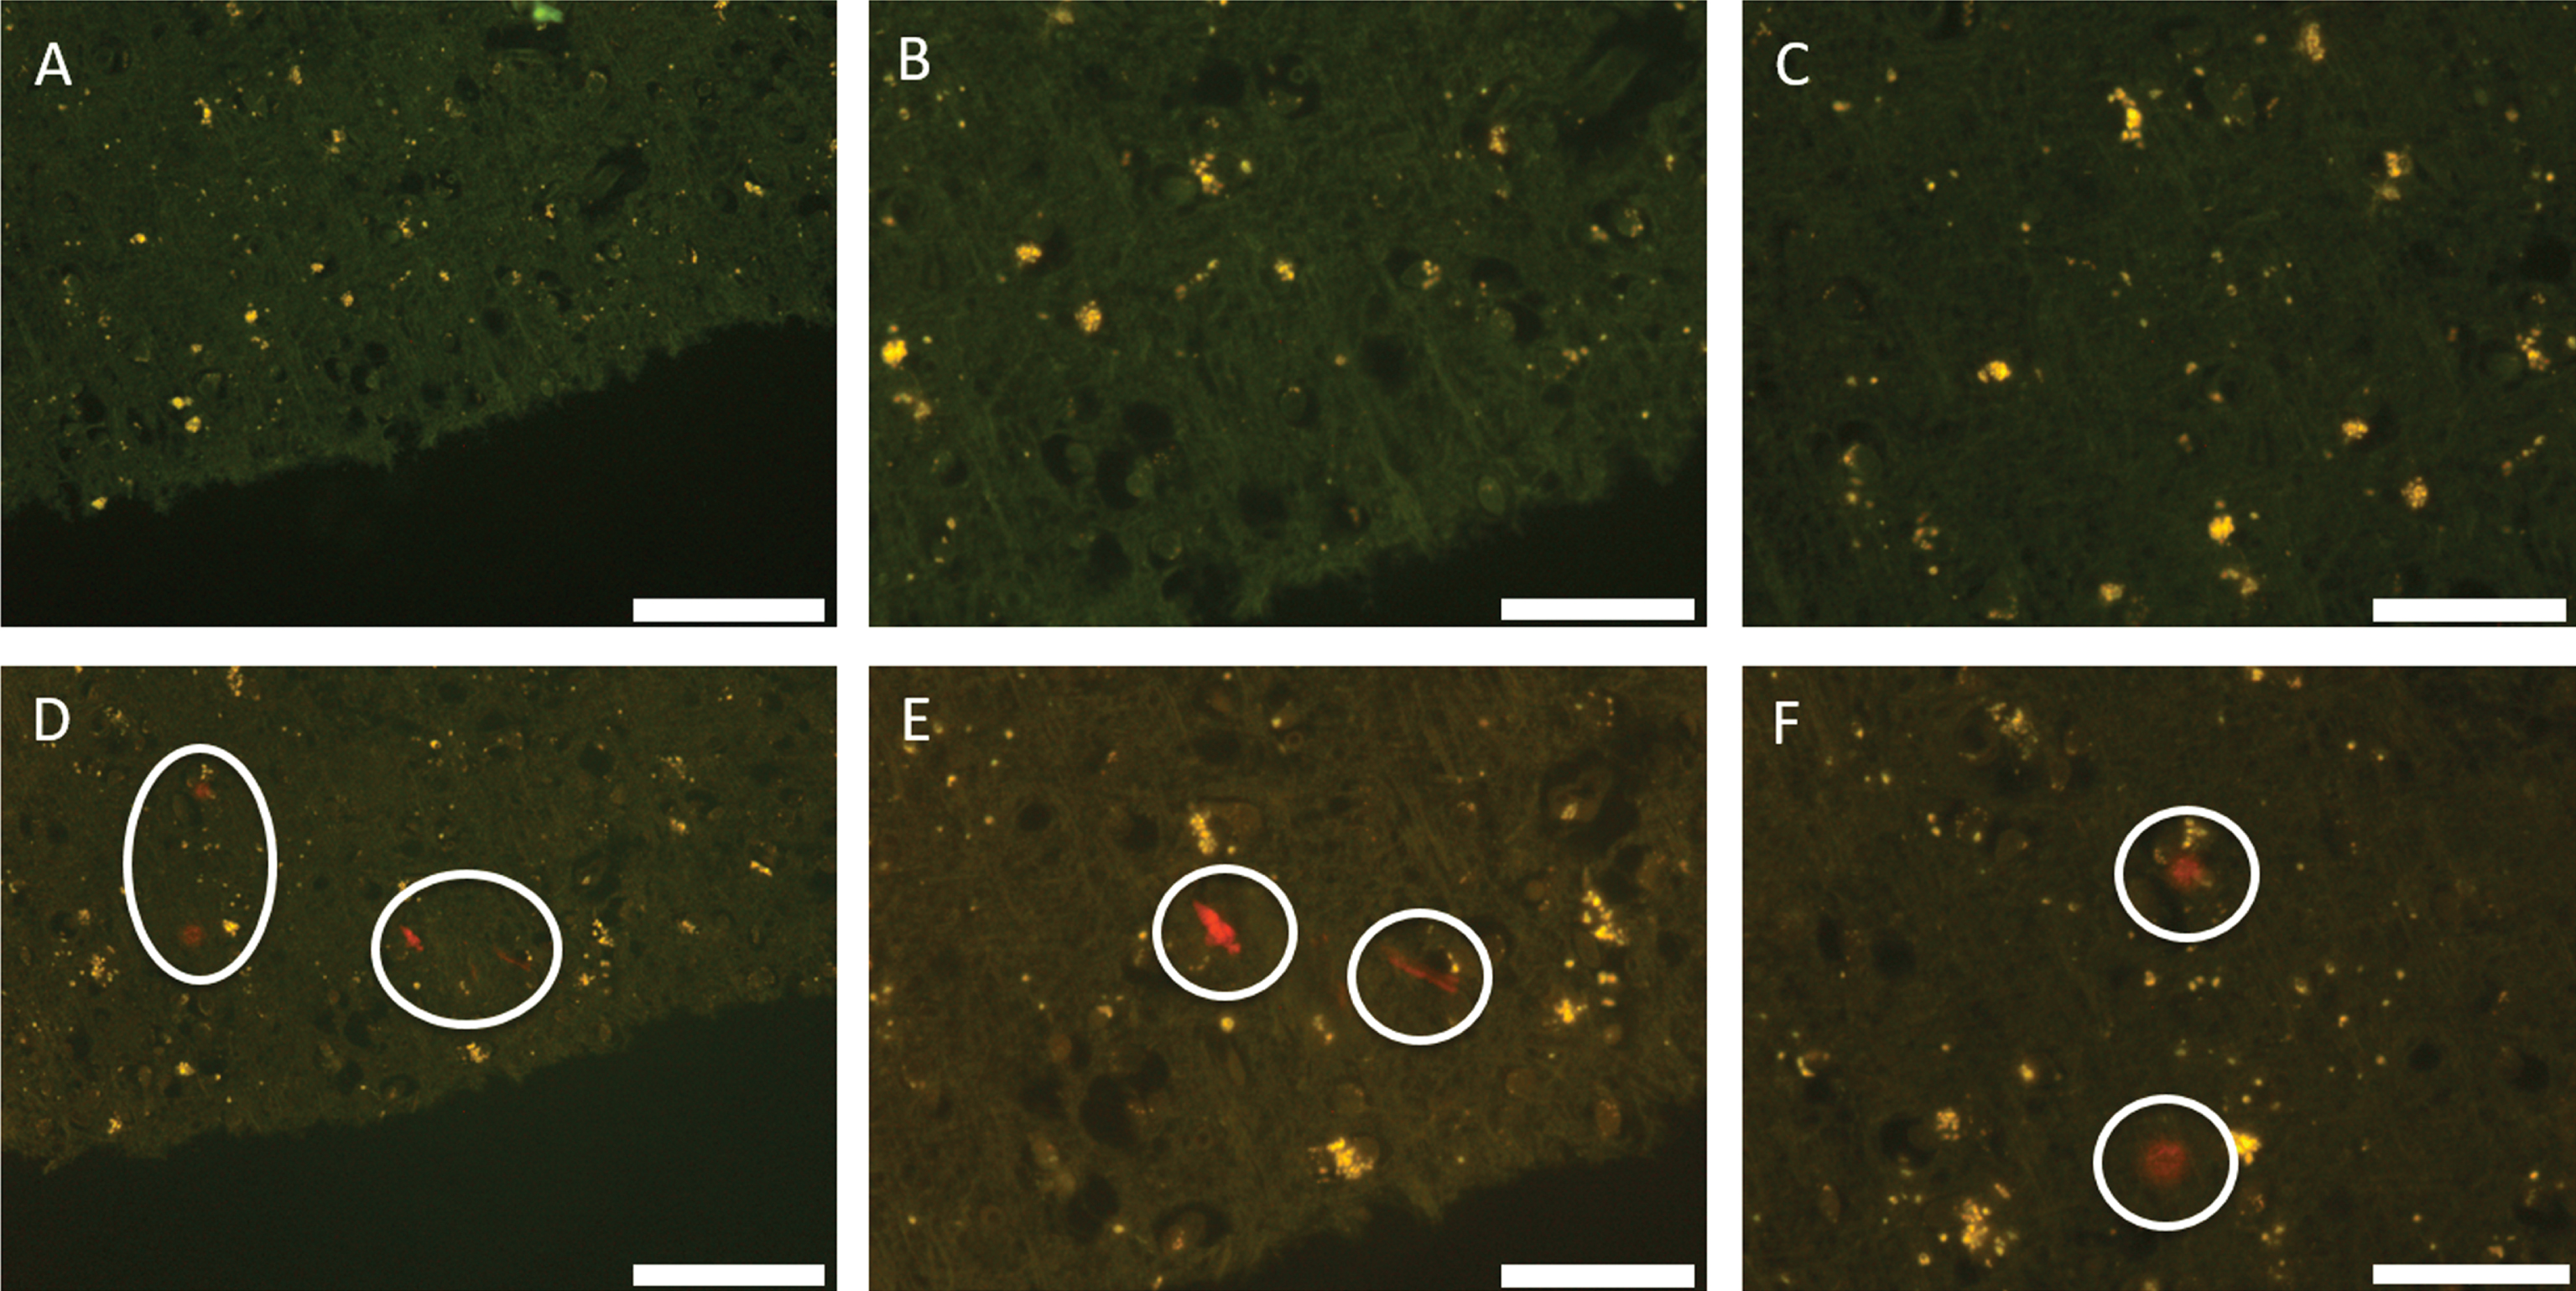
Fig.3
Autofluorescence (A–C) and fluorescence (D–F) images of occipital lobe stained with lumogallion. Significant deposits of aluminum showing strong positive fluorescence are circled. Bright green fluorescence suggesting co-deposition of aluminum and lipofuscin are indicated by arrows. Scale bar is 100 μm (A, D) and 50 μm (B, C, E, F).
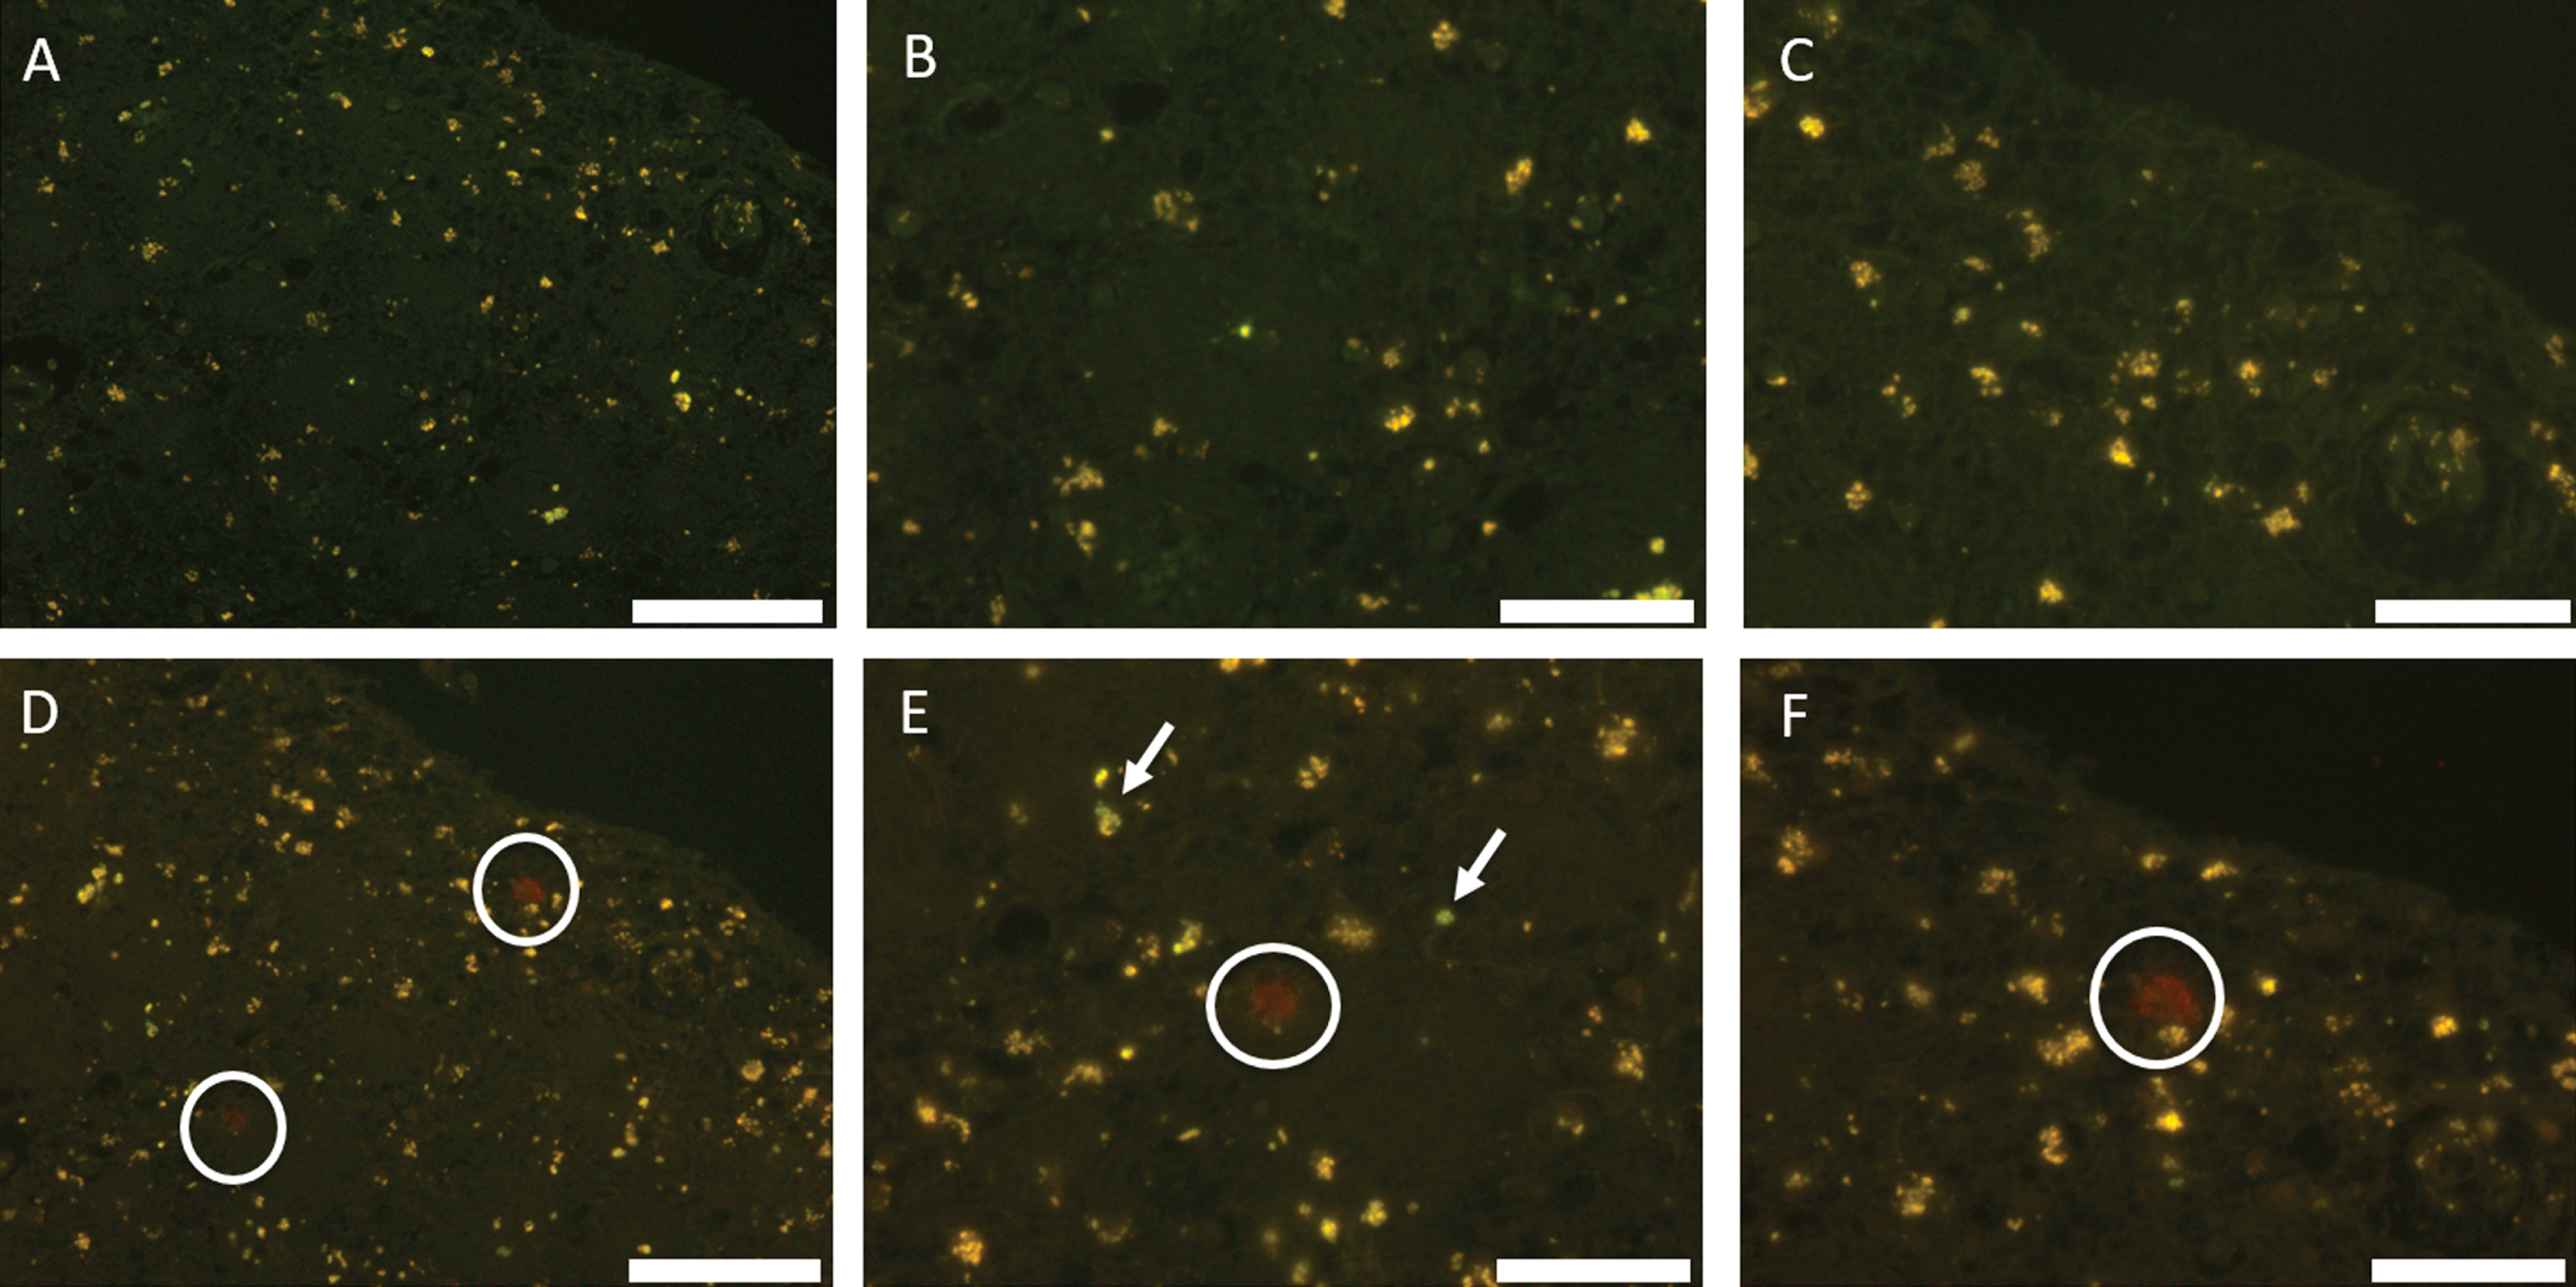
Fig.4
Autofluorescence (A, C) and fluorescence (B, D) images of temporal lobe stained with lumogallion. Deposits of aluminum showing strong positive fluorescence are circled. Scale bar is 100 μm (A, B) and 50 μm (C, D).
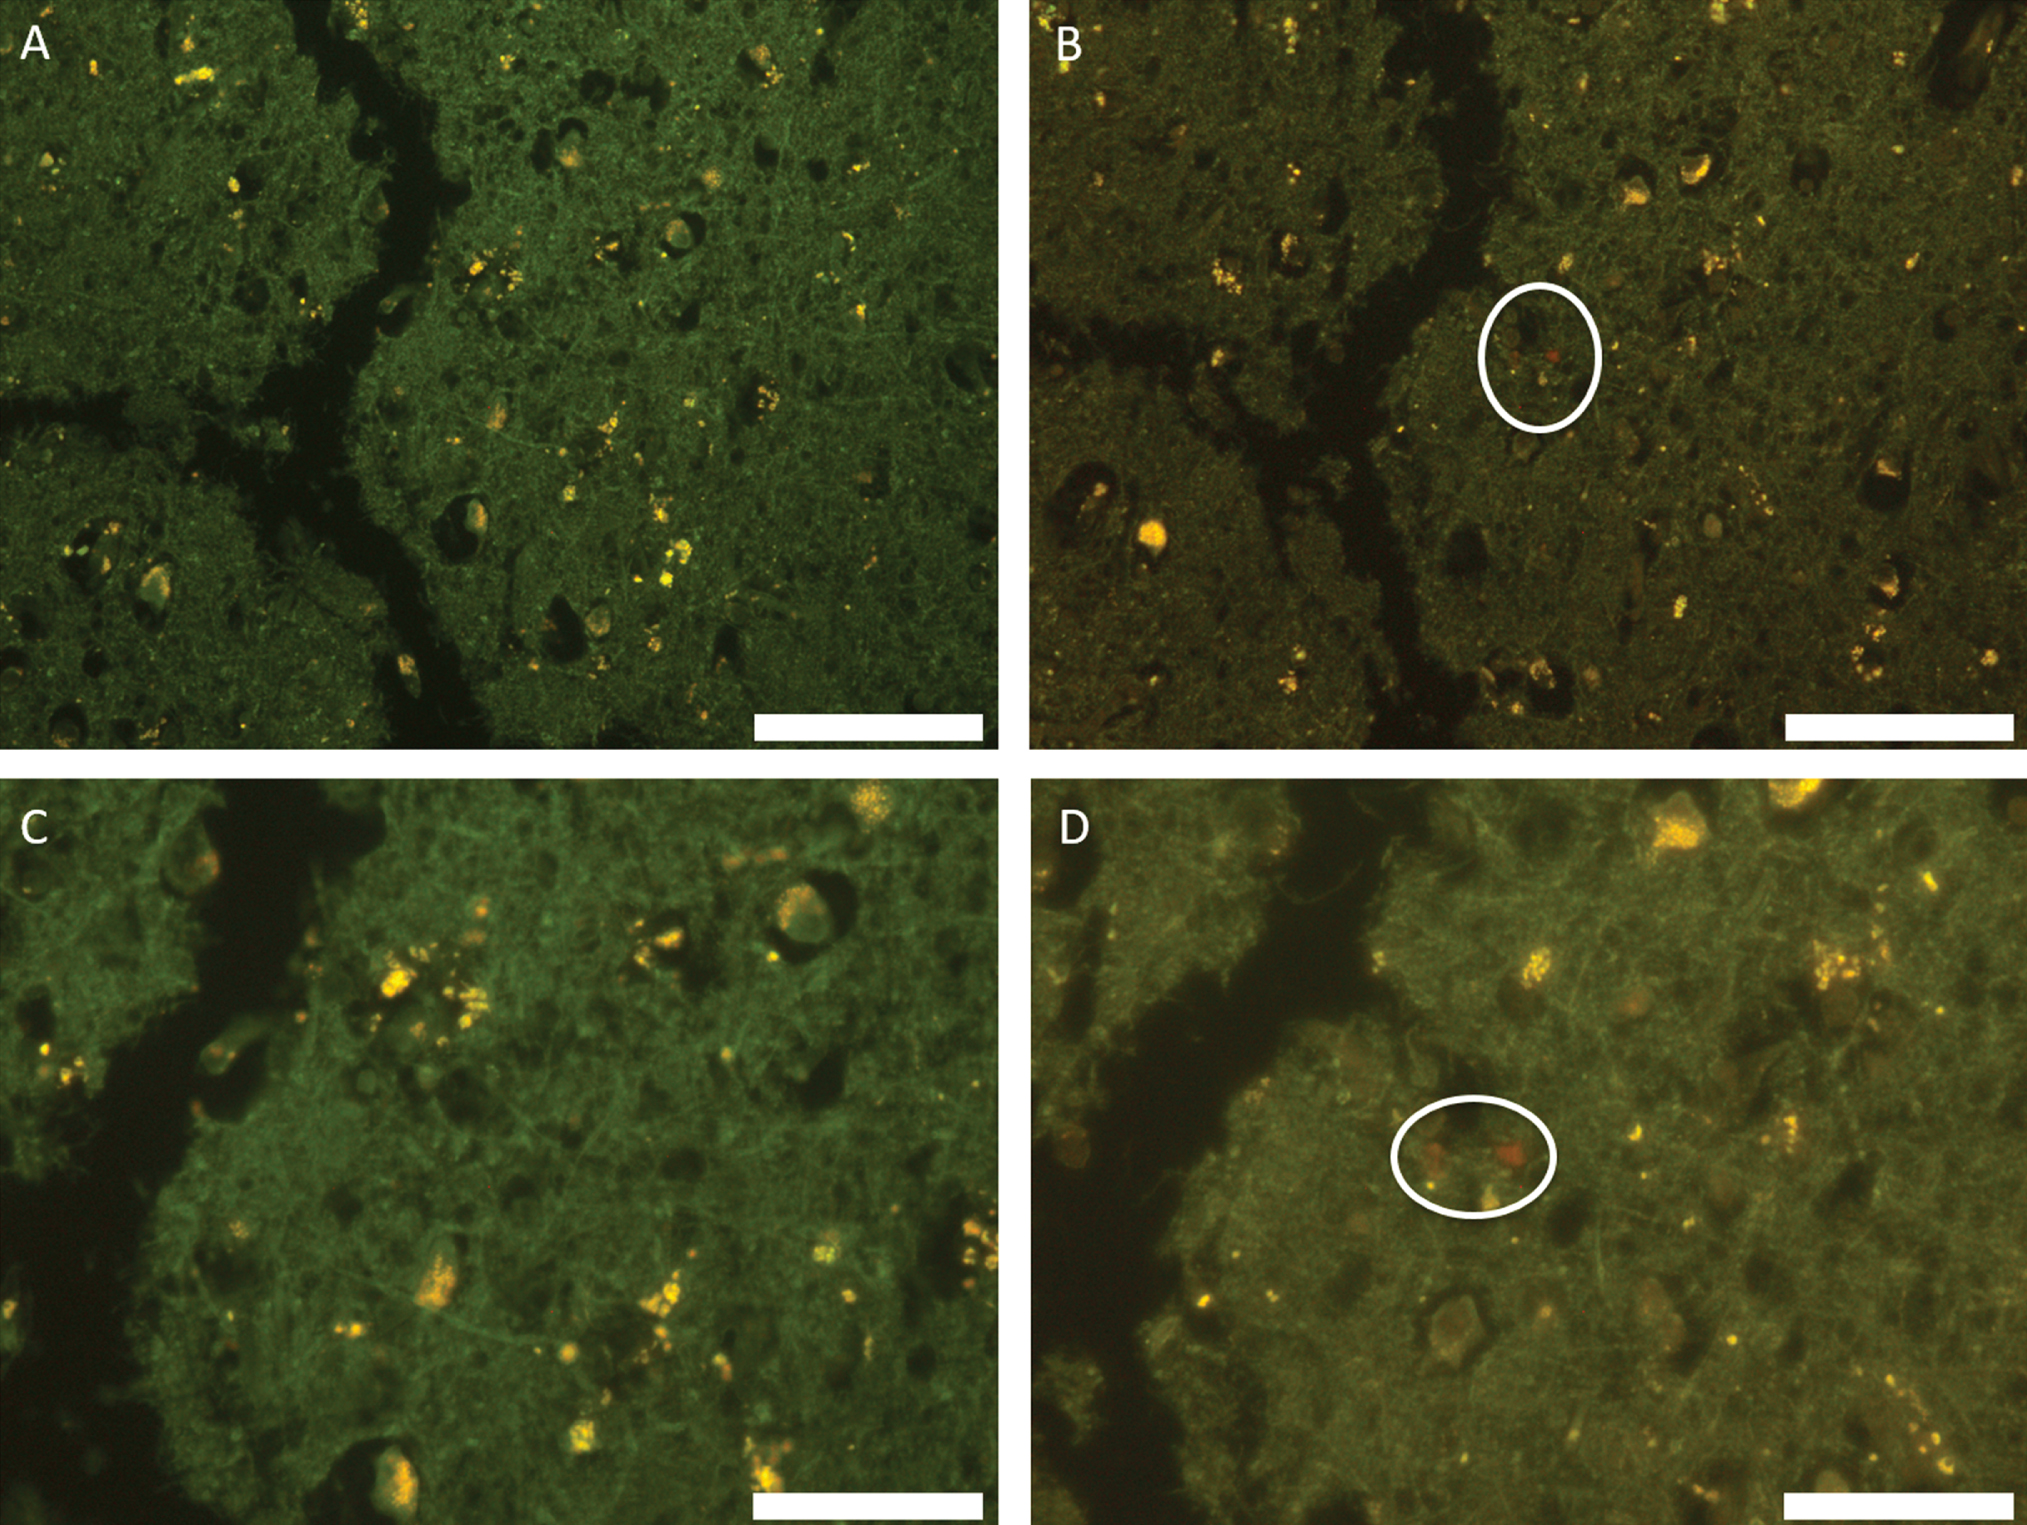
Table 1
The aluminum content of each tissue replicate from each brain region (μg/g dry wt.) with pathologically-concerning values highlighted in bold and pathologically-significant values highlighted in bold italics. Mean and SD are also given for each region for between 9 and 21 replicates
| Replicate | Temporal | Hippocampus | Occipital | Frontal | Parietal |
| 1 | 0.81 | 0.41 | 4.45 | 1.31 | 1.21 |
| 2 | 0.12 | 0.01 | 2.68 | 0.40 | 2.05 |
| 3 | 3.51 | 2.73 | 0.09 | 0.77 | 1.84 |
| 4 | 0.66 | 0.76 | 0.19 | 1.01 | 0.84 |
| 5 | 0.01 | 0.41 | 1.19 | 0.27 | 0.04 |
| 6 | 0.74 | 0.01 | 0.57 | 1.89 | 0.36 |
| 7 | 1.18 | 0.11 | 0.24 | 0.48 | 2.78 |
| 8 | 0.24 | 0.01 | 2.82 | 0.01 | 5.58 |
| 9 | 1.71 | 0.01 | 0.39 | 0.02 | 0.41 |
| 10 | 0.01 | 1.03 | 0.32 | 0.98 | |
| 11 | 0.27 | 0.27 | 0.01 | ||
| 12 | 0.72 | 0.26 | 0.01 | ||
| 13 | 2.79 | 0.28 | 1.23 | ||
| 14 | 4.00 | 0.14 | 0.93 | ||
| 15 | 0.58 | 0.39 | 0.29 | ||
| 16 | 1.56 | 0.20 | 0.34 | ||
| 17 | 2.16 | 0.69 | 2.62 | ||
| 18 | 3.73 | 0.43 | 0.31 | ||
| 19 | 2.16 | 0.20 | 3.91 | ||
| 20 | 1.23 | 3.38 | 1.33 | ||
| 21 | 3.86 | 1.03 | 0.79 | ||
| Mean | 1.00 | 0.45 | 1.75 | 0.66 | 1.33 |
| (SD) | (1.08) | (0.84) | (1.43) | (0.78) | (1.42) |


