
Mitochondrial Abnormalities and Synaptic Loss Underlie Memory Deficits Seen in Mouse Models of Obesity and Alzheimer’s Disease
Abstract
Obesity is associated with impaired memory in humans, and obesity induced by high-fat diets leads to cognitive deficits in rodents and in mouse models of Alzheimer’s disease (AD). However, it remains unclear how high-fat diets contribute to memory impairment. Therefore, we tested the effect of a high-fat diet on memory in male and female control non-transgenic (Non-Tg) and triple-transgenic AD (3xTgAD) mice and determined if a high-fat diet caused similar ultrastructural abnormalities to those observed in AD. Behavior was assessed in mice on control or high-fat diet at 4, 8, or 14 months of age and ultrastructural analysis at 8 months of age. A high-fat diet increased body weight, fat weight, and insulin levels with some differences in these metabolic responses observed between Non-Tg and 3xTgAD mice. In both sexes, high-fat feeding caused memory impairments in Non-Tg mice and accelerated memory deficits in 3xTgAD mice. In 3xTgAD mice, changes in hippocampal mitochondrial morphology were observed in capillaries and brain neuropil that were accompanied by a reduction in synapse number. A high-fat diet also caused mitochondria abnormalities and a reduction in synapse number in Non-Tg mice, but did not exacerbate the changes seen in 3xTgAD mice. Our data demonstrate that a high-fat diet affected memory in Non-Tg mice and produced similar impairments in mitochondrial morphology and synapse number comparable to those seen in AD mice, suggesting that the detrimental effects of a high-fat diet on memory might be due to changes in mitochondrial morphology leading to a reduction in synaptic number.
INTRODUCTION
Alzheimer’s disease (AD) is the most common cause of dementia in the elderly that is characterized by progressive and irreversible memory decline. Memory deficits are due to loss of synapses and neurons in brain regions involved in memory and learning such as the hippocampus [1]. One accepted model for AD pathogenesis is the amyloid cascade hypothesis [2, 3], although others exist including the mitochondrial cascade hypothesis [4]. According to the latter, mitochondrial dysfunction occurs early in AD pathology preceding amyloid-β (Aβ) deposition and plaque formation.
Mitochondria play a fundamental role in the generation of energy, through production of adenosine triphosphate (ATP), and are important in maintaining oxidative balance as they produce reactive oxygen species (ROS). Mitochondrial-induced oxidative stress is associated with alterations in mitochondria morphology, possibly due to changes in the dynamic processes of fusion and fission [5–7]. Mitochondria abundance is high in neurons, particularly at synapses, in order to supply the high-energy demands of these cells. As neurons are highly dependent on mitochondrial function, they are particularly sensitive to any disruption in mitochondrial dynamics. Mitochondria impairments have been linked to synaptic dysfunction [8, 9] and in neurodegenerative diseases [6]. Loss of synapses and synaptic connectivity is an early event of AD pathology with accumulation of Aβ in synapses being thought to cause synaptic damage and cognitive decline in AD possibly through an effect on mitochondria [10–12]. Indeed, abnormalities in mitochondrial structure and function (e.g., enhanced ROS production) have been described in both postmortem AD brains [13–16] and in transgenic mouse models of the disease [17–19]. Mitochondrial abnormalities are also reported in vascular endothelial cells in AD, which are likely to affect brain function given the highly metabolic nature of the cerebrovasculature [20–22].
Consumption of diets high in fat, such as western diets, is increasing worldwide and contributes to an overweight and obese population. Obesity, which is defined by an increase in adipose tissue, is associated with effects on cognitive function including impairment in memory [23–28]. Being obese is also considered a risk factor for developing dementia later in life, and increases the risk of AD [29–36]. Obese adults show changes in brain morphology, including brain atrophy in the white and grey matter in regions that mediate cognitive function [37, 38]. Experimental studies show that high-fat diets impair learning and memory in rodents [27, 39–45] and worsen memory deficits in mouse models of AD [46–49]. These data suggest a strong association between obesity and cognitive dysfunction. However, how high-fat diets affect memory in healthy animals or make it worse in AD models is not understood fully. Since mitochondrial function is vital for healthy synapses and normal cerebrovascular function and cognition, it is possible that obesity induces changes in mitochondria that results in memory impairments.
Therefore, the aim of this study was to evaluate the effect of a high-fat diet on memory in male and female control non-transgenic (Non-Tg) mice and in the triple-transgenic mouse model of AD (3xTgAD). Groups of male and female Non-Tg and 3xTgAD mice were placed on either a control or high-fat diet and memory was assessed in separate groups of animals at 4, 8, and 14 months of age. In order to determine the overall impact of a high-fat diet on health, several physiological and metabolic parameters were also assessed. To test the hypothesis that a high-fat diet results in ultrastructural abnormalities similar to those observed in AD, we also assessed endothelial and neuronal mitochondria number and morphology and, synaptic density using transmission electron microscopy (TEM) in the subiculum of the hippocampal formation and the cortex at 8 months of age before Aβ plaque pathology is observed [47]. As other alterations in cerebrovascular structure have been observed in AD including alterations in tight junctions, basement membrane thickening, and changes in vessel diameter, we also performed a detailed morphological analysis of the capillaryendothelium.
MATERIAL AND METHODS
Animals and diet
An in-house colony of male and female 3xTgAD mice, expressing mutant PS1M146V, APPSWE and TauP301L, and Non-Tg controls, on a C57BL6×129SV background, was established from breeding pairs originally supplied by Frank LaFerla (Irvine, CA, USA) [50]. Mice were kept in standard housing conditions (humidity 50–60%, temperature 21±1°C, 12:12 h light-dark cycle with lights on at 07:00 h) and given ad libitum access to food and water. After weaning, male and female littermates were housed separately and kept on standard rodent chow (BK001, Special Diets Services, UK) until 8 weeks of age. Groups of mice were then randomly allocated to either control (12% energy from fat, 5% fat content by weight, 0.78% saturated fatty acids, 58G7, Test Diets) or high-fat diet (60% energy from fat, 35% fat content by weight, 13% saturated fatty acids, 58G9, Test Diets) and maintained on their respective diets for 2 months (n = 9–12/group; 4 months of age) or 12 months (n = 8–11/group; 14 months of age). Body weight was assessed at baseline (before placement on diet), and then at 4, 8, and 14 months of age. Blood pressure (and heart rate) and behavior were also assessed at 4, 8, and 14 months of age. A separate group of 8-week-old Non-Tg and 3xTgAD male and female mice (n = 6-7/group) were fed on control or high-fat diet for 6 months (8 months of age) when brains were assessed for electron microscopy (EM). All animal experiments were carried out in accordance with the United Kingdom Animals (Scientific Procedures) Act 1986 and approved by the Home Office and the local Animal Ethical Review Group, University of Manchester.
Blood pressure
Systolic blood pressure and heart rate were assessed using a non-invasive blood pressure analyzer with a specific mouse tail cuff adapter (Model BP-2000-M-2, Visitech Systems, Inc., USA). One day prior to measurements, mice were habituated to the procedure for 5 min to reduce stress and anxiety. On the day of the assessment the animals were placed in the room and allowed to acclimatize for 10 min. A total of 20 readings of systolic blood pressure (mmHg) and heart rate (beats/minute, bpm) were taken and the average of the last 10 measurements calculated.
Behavior
Mice were subjected to novel smell recognition and Y-maze spontaneous alternation tests. To decrease anxiety, all animals were allowed to habituate to the test room for 30 min prior to behavioral tests. All experiments were performed between 09:00 h and 17:00 h in the same testing room. Each test was performed on a different day and the animal order was randomized between groups. To avoid distress and anxiety, behavioral tests were performed on separate days for male and female mice. All apparatus were cleaned between animals and tests with 70% ethanol. The subsequent analyses of all behavior data were performed blinded to genotype, gender, and diet.
Novel smell recognition test
To evaluate recognition memory, based on the innate tendency of the animal to spend more time examining a novel smell compared to a familiar one, the smell recognition test was used as described previously [47]. We have shown previously that 3xTgAD mice can detect smells as male mice demonstrated an increased exploration of urine from female 3xTgAD mice compared to water (data not shown). Briefly, all animals were allowed to habituate to a black opaque polycarbonate circular arena (diameter, 30 cm×height, 21 cm) for 5 min over 2 days. On the third day, mice were placed in the center of the arena and allowed to explore two identical scented balls for 10 min (phase 1). The scented balls (Chad Valley, UK) were filled with cotton wool and 0.5 ml of scent (orange, lemon, vanilla, almond, peppermint, or eucalyptus, Dr Oetker Ltd, UK) was distributed into the balls via small holes. Mice were then removed and one of the scented balls was replaced by a ball containing a novel scent. After a delay of 3 min, mice were placed back into the arena and allowed to explore for 4 min (phase 2). All experiments were recorded with a camera (Sanyo Xacti VPC-C4, SANYO Fisher, CA, USA) and MP4 video-clips were converted to an AVI format using Pazera MP4 to AVI converter 1.3 (Pazera-Software, Poland). The time (s) spent exploring the scented balls was calculated manually by observing each individual video. Exploration was defined as the amount of time that the animals spent with their nose within 2 cm in the direction of the smell. Mice were excluded if they failed to explore for at least 4 s and for some mice, the video did not record so their data are missing from the analyses. The final n numbers are indicated in the figures. The discrimination index was calculated using the following formula: (novel smell time-familiar smell time)/total exploration time.
Y-maze spontaneous alternation test
Short-term working memory was assessed using the Y-maze spontaneous alternation test. A black opaque Perspex Y-shaped maze with three arms (A, B, and C) was used and a visual cue was located at each end of the arm (arm dimensions; 15 cm×10 cm×10 cm). Each animal was placed into the maze facing the end of arm A and allowed to explore for 8 min. The number of arm entries (when the entire body of the animal was inside the arm space) made by each animal was recorded. Spontaneous alternation was defined as three consecutive entries in different arms (triplets) in a random order and the percentage number of alternations between arms was calculated as defined previously [47]. If mice did not perform greater than nine arm entries their data were excluded, and the final n numbers are indicated in the figures.
Tissue collection
At the end of the feeding period for the behavioral study, mice were terminally anesthetized with 3.5% isoflurane (30% O2 and 70% N2O), blood was taken from the heart using 3.8% sodium citrate as an anticoagulant and plasma obtained after centrifugation (1200 g, 10 min) was stored at –80°C until assay. To remove any remaining blood, animals were then perfused transcardially with 0.9% saline. Total gonadal white adipose tissue was dissected and weighed.
Glucose and insulin measurements
Non-fasting blood glucose was measured in samples of cardiac blood by an Accu-Chek Diabetes kit (Roche Diagnostics, Indianapolis, IN, USA). Insulin levels (non-fasting) were measured in plasma samples using an ultra-sensitive insulin mouse ELISA kit (Crystal Chem Inc., IL, USA) according to the manufacture’s protocol.
Electron microscopy
After 6 months on diet animals (at 8 months of age) were terminally anesthetized with 3.5% isoflurane (30% O2 and 70% N2O) and prepared for TEM. A brief transcardiac perfusion with 0.9% saline was performed to remove circulating blood followed by perfusion with fixative containing 2% paraformaldehyde and 2.5% glutaraldehyde in 0.1 M phosphate buffer (pH 7.4). Brains were then dissected and post-fixed in fresh fixative for 24 h at 4°C. Coronal sections (100 μm thick) were cut on a Leica VT1000 vibrating-blade vibrotome and, in the coronal section of interest, the subiculum of the hippocampal formation (termed hippocampus) and primary somatosensory cortex (termed cortex) were micro-dissected. Samples were washed in cacodylate buffer containing 2 mM calcium chloride and post-fixed for 1 h with reduced osmium (OsO4 1% and K4Fe(CN)6 1.5%), then incubated in 1% tannic acid in 0.1 M cacodylate buffer for 1 h and finally with 1% uranyl acetate in water overnight. Samples were dehydrated at room temperature with different grades of ethanol, from 20% to 100% for 5 min each, infiltrated with TAAB low viscosity resin (TAAB Laboratories Equipment, UK) and polymerized for 24 h at 60°C. Ultrathin sections (70 nm) were then cut with Reichert Jung Ultracut E ultramicrotome (Reichert Technologies Life Sciences, USA), mounted on Athene 200 mesh thin bar copper grids (Agar Scientific, UK) and visualized with a FEI Technai 12 Biotwin Transmission Electron Microscope (FEI, USA) using a Gatan Orius SC1000 camera (Gatan, USA).
Electron microscopy analyses
For each animal, micrographs of 10 random capillaries, identified by their size and lack of smooth muscle, were taken in both the hippocampus and cortex and measurements made using ImageJ software (NIH, USA). The number of mitochondria in the capillary endothelium of the hippocampus and cortex was counted and expressed as the average number of mitochondria per vessel. Mitochondrial length was determined by measuring the major length from one side to another. Healthy mitochondria were identified by their usual rounded shape with a dense matrix and the presence of cristae, and were variable in size ranging from 0.1 μm to 3 μm in length as previously described [51–53]. In the present study, the average length of mitochondria in control-fed Non-Tg mice was 0.5 μm, therefore mitochondria 0.5 μm or above in length were classified as elongated. The percentage of elongated mitochondria was then calculated. To assess overall vascular health, other endothelial measurements were assessed in the hippocampus and included basal lamina thickness (nm), vessel lumen diameter ( μm), vessel lumen roughness, % pericyte coverage, tight junction tortuosity, and number of endothelial vesicles per μm of vessel wall as previously described using ImageJ [54]. Briefly, basal lamina thickness was measured in three equidistant locations and an average taken; vessel lumen diameter was calculated by extrapolation from the area of the lumen; vessel lumen roughness was quantified by using the convex hull tool in ImageJ that estimates the ideal perimeter of the lumen if the vessel was perfectly smooth; pericyte coverage was calculated as the percentage of the lumen circumference that was covered by a pericyte cell body or process; tight junction tortuosity was used as a measure of tight junction complexity, and was calculated by the ratio of the length of the tight junction from the luminal side to the basal lamina side, to the distance measured by drawing a straight line directly from its start to its end [55], and the number of endothelial vesicles (caveolae) were counted in each capillary and data expressed as number of vesicles per μm of vessel wall.
For neuropil mitochondria and synaptic density, 10 micrographs were taken for each animal of the neuropil of the hippocampus and cortex and measurements made using ImageJ. Here, the landmarks used to identify the correct field of view in each section consisted of avoiding nuclei, blood vessels, areas of myelination, and increased dendritic density as previous described [56]. Using these guidelines the neuropil should be a synaptically dense region mostly composed by unmyelinated axons, dendrites,neurons, and glial cells. In each field of view (63 μm2), mitochondria number and length were determined as above and qualitative changes in mitochondrial structure were also recorded. The number of synapses was quantified, with synapses being identified as an electron dense postsynaptic density (visible by TEM) between a presynaptic neuron (containing a high density of synaptic vesicles) and the postsynaptic neuron.
All micrographs were analyzed in a random order and were blinded for genotype and diet. For each parameter, measurements from the 10 capillaries or fields of view (63 μm2 for neuropil) were averaged to give a mean for each animal and the group average obtained.
Statistical analyses
Body and fat weight, glucose, insulin, systolic blood pressure, and heart rate, and data from the EM studies were analyzed using a two-way analysis of variance (ANOVA) followed by Bonferroni’s post-hoc test using SPSS (IBM SPSS Statistics). For the smell recognition and Y-maze, data were analyzed with a 3-way ANOVA followed by Sidak-Holme corrected planned contrasts. Equal variance was assessed with the Levine’s test and normality of the residuals was evaluated with the Shapiro-Wilks test. Appropriate transformations were applied when necessary. All data are expressed as the mean±standard error of the mean (SEM). Statistical significance was taken when p < 0.05.
RESULTS
Physiological parameters
A high-fat diet led to a significant (p < 0.05–0.001) increase in body weight in male and female Non-Tg and 3xTgAD mice at 4, 8, and 14 months of age (Table 1; Main effect of diet: Females, 4 months, F(1,38) = 30.17; 8 months, F(1,28) = 80.83; 14 months F(1,27) = 62.88; Males, 4 months, F(1,40) = 118.67; 8 months, F(1,38) = 33.77; 14 months, F(1,38) = 91.53, p < 0.001 for all). At all ages male 3xTgAD mice gained significantly (p < 0.01) less weight on a high-fat diet compared to Non-Tg mice. Control fed 3xTgAD male mice gained 33% more weight by 4 months of age but 34–40% less by 8 and 14 months of age compared to Non-Tg mice. Increases in body weight due to high-fat diet were accompanied by a significant (p < 0.01–0.001) increase in gonadal fat in all mice at 4 and 14 months of age, with the exception of 14-month-old Non-Tg males (Table 1; Main effect of diet: Females, 4 months, F(1,27) = 15.80; 14 months, F(1,26) = 47.04; Males, 4 months, F(1,40) = 112.80; 14 months, F(1,38) = 83.91, p < 0.001 for all). No change in blood glucose levels was observed after high-fat feeding in either 4- or 14-month-old male or female Non-Tg or 3xTgAD mice (Table 1). At 4 months of age, plasma insulin levels were significantly (p < 0.05) increased in high-fat fed male Non-Tg mice by 80%, but no differences after a high-fat diet were observed in 4-month-old female Non-Tg mice or male or female 3xTgAD mice (Table 1; Main effect of diet in males, F(1,36) = 7.05, p < 0.05). At 14 months of age, a high-fat diet increased plasma insulin in both male and female Non-Tg mice by 196% and 94%, respectively (Table 1), but no significant effect was seen in male or female 3xTgAD mice (Table 1). This lack of response to a high-fat diet in 3xTgAD mice corresponded to a significant interaction effect between genotype and diet on insulin levels (Females, F(1,24) = 5.89, p < 0.05; Males, F(1,29) = 4.51, p < 0.05).
At all ages assessed in both sexes, there was no overall affect of diet or genotype on systolic blood pressure apart from a transient increase in 8-month-old high-fat fed 3xTgAD females when compared to high-fat fed Non-Tg mice (Table 1). At 4, 8, and 14 months of age, male and female 3xTgAD mice fed a control diet had a significantly (p < 0.05–0.001) lower heart rate than Non-Tg control mice (Table 1; Main effect of genotype: Females, 4 months, F(1,40) = 10.91, p < 0.01; 8 months, F(1,31) = 8.66, p < 0.01; 14 months, F(1,25) = 11.50, p < 0.01; Males, 4 months, F(1,34) = 47.30, p < 0.001; 8 months, F(1,34) = 45.91, p < 0.001, 14 months, F(1,31) = 10.51, p < 0.01), even prior to diet (at 2 months of age, data not shown). At some ages a high-fat diet significantly increased heart rate in male and female 3xTgAD mice when compared to control fed 3xTgAD mice (Main effect of diet: Females, 4 months, F(1,40) = 20.36, p < 0.001; 14 months, F(1,25) = 8.50 p < 0.01; Males, 4 months, F(1,34) = 4.67, p < 0.05; 8 months, F(1,34) = 10.37, p < 0.01). However, a high-fat diet had no affect on heart rate in Non-Tg mice apart from causing a transient increase in 4-month-old female Non-Tg mice.
A high-fat diet impaired memory in Non-Tg mice and advanced memory deficits in 3xTgAD mice
A high-fat diet appeared to accelerate memory deficits in 3xTgAD mice (Fig. 1). In the novel smell recognition test, in 4-month-old mice a significant reduction in performance was observed only in the 3xTgAD high fat-fed female (p < 0.05) and male (p < 0.01) mice when compared to high-fat fed Non-Tg mice (Fig. 1A). In contrast no significant reduction in performance was observed in either sex after high-fat feeding in Non-Tg mice compared to Non-Tg mice fed a control diet. This effect resulted in a significant interaction effect between genotype and diet on performance in this test (F(1,63) = 4.47, p < 0.05). At 8 months of age, both high-fat and control fed 3xTgAD mice performed significantly worse than Non-Tg mice (Fig. 1B). By 14 months of age, all 3xTgAD mice had completely lost the ability to perform the task resulting in significant pairwise comparisons and a significant main-effect of genotype on novel smell recognition performance (F(1,62) = 43.17, p < 0.001; Fig. 1C). At all ages, a high-fat diet had no effect on memory in Non-Tg mice of either sex when assessed in the novel smell recognition test. At 4 months of age, there were no significant effects of diet or genotype on Y-maze performance (Fig. 1D). Similar to findings with novel smell recognition, a high-fat diet caused an acceleration in cognitive deficits as at 8 months of age, high-fat fed 3xTgAD mice performed significantly (p < 0.05) fewer alternations when compared to control fed animals (Fig. 1E). By 14 months of age, a high-fat diet significantly reduced the performance in both female (p < 0.001) and male (p < 0.05) Non-Tg mice (Fig. 1F). This high-fat response seemed to preferentially affect Non-Tg mice, as there were no significant differences between diets within the 3xTgAD cohorts. This corresponded to a significant interaction effect between genotype and diet (F(1,58) = 16.02, p < 0.001). At 14 months of age, control fed female 3xTgAD also performed significantly worse in the Y-maze test when compared to control fed Non-Tgs.
High-fat diet had no impact on capillary structure in Non-Tg and 3xTgAD mice
None of the endothelial parameters measured were affected by 6 months of a high-fat diet or by genotype (Table 2) and no overt qualitative differences in capillary structure were observedeither.
In the same group of mice after 6 months, a high-fat diet led to an increase in body weight gain in 8-month-old Non-Tg and 3xTgAD mice (Body weight change - Non-Tg: control, 8.6±0.6 g versus high-fat, 26.0±2.5 g, p < 0.001; 3xTgAD: control, 8.6±1.6 g versus high-fat, 17.6±2.6 g, p < 0.01) but 3xTgAD mice gained significantly less weight on a high-fat diet than Non-Tg mice (% increase compared to control; 3xTgAD, 105% versus Non-Tg, 202%, p < 0.01) as seen previously.
Mitochondria length in the capillary endothelium is increased by a high-fat diet and in 3xTgAD mice
There were no changes in the number of mitochondria in the capillary endothelium of the hippocampus and cortex in any of the groups (Fig. 2A-B). However, in control-fed 3xTgAD mice, the percentage of elongated mitochondria was increased in the hippocampus (Fig. 2C, E) but not in the cortex (Fig. 2D), compared to control-fed Non-Tg animals. A high-fat diet also increased the number of elongated mitochondria in the endothelium of the hippocampus of Non-Tg mice (Fig. 2C, E) but had no effect in the cortex in Non-Tg or 3xTgAD mice(Fig. 2D).
Mitochondria morphology in the hippocampus is affected by a high-fat diet and in 3xTgAD mice
In the hippocampal neuropil of control fed Non-Tg mice, normal mitochondria were observed to be round in shape containing packed cristae and dense matrix (Fig. 3A). In contrast, 3xTgAD mice on either a control or high-fat diet showed hippocampal mitochondrial abnormalities including elongation with swollen and disorganized cristae (Fig. 3B and Fig. 5G), severe swollen cristae with less dense matrix (Fig. 3C, E), swollen mitochondria with severe loss of cristae and empty matrix (Fig. 3D) and focal loss of cristae with holes and empty spaces (Fig. 4C, D). Some ultrastructural abnormalities (focal loss of cristae with holes and empty spaces) in mitochondria in the hippocampus of Non-Tg mice fed a high-fat diet were also observed (Fig. 4A, B). Mitochondrial structural changes were not seen in the neuropil of the cortex of Non-Tg and 3xTgAD mice fed a high-fat diet or control fed 3xTgAD mice.
In Non-Tg mice, a high-fat diet reduced (17%) the number of mitochondrial in the neuropil of the hippocampus compared to control fed Non-Tg mice (Fig. 5A). A reduction in mitochondrial number (21%) was also observed in the hippocampus of 3xTgAD mice on a control diet versus Non-Tg control fed mice (Fig. 5A). There was no effect of genotype or diet on mitochondria number in the cortex (Fig. 5B).
As in the capillary endothelium, control fed 3xTgAD mice had a greater percentage of elongated mitochondria in the hippocampus compared to Non-Tg mice on the same diet (Fig. 5C, G), but no difference was observed in the cortex (Fig. 5D). A high-fat diet did not affect mitochondrial length in the neuropil of both Non-Tg and 3xTgAD mice in either brain region (Fig. 5C, D).
Synaptic density is reduced in the hippocampus after a high-fat diet and in 3xTgAD mice
A high-fat diet led to a reduction (19%) in the number of synapses in the hippocampus of Non-Tg mice (Fig. 5E, G). Fewer synapses (29%) were also detected in the hippocampus of control-fed 3xTgAD mice when compared to Non-Tg mice on the same diet. In the cortex, no difference in synaptic number was observed due to genotype or diet (Fig. 5F).
DISCUSSION
The present study assessed the effects of a high-fat diet on memory and the ultrastructure of brain capillaries and neuropil in Non-Tg control and 3xTgAD mice. A high-fat diet impaired memory in Non-Tg mice and advanced memory deficits in 3xTgAD mice. These impairments in memory in Non-Tg mice were associated with changes in mitochondria and synapses, as observed in control-fed 3xTgAD mice. Memory deficits in both genotypes were observed in male and female mice, and to our knowledge this is the first study to compare effects of a high-fat diet in male and female Non-Tg and 3xTgAD mice. The majority of previous work has assessed the effect of a high-fat diet for a relatively short period and in young rodents. Here the effects of high-fat feeding on cognition were characterized for longer periods and in mice up to 14 months of age. These current findings are consistent with mid-life obesity being a risk factor for AD [29–36]. However, as AD predominantly affects the elderly, it will be important to determine whether the negative impact of high-fat diet remains in older mice, especially as clinical evidence suggests that obesity can decrease the risk of AD in later life [30].
A detrimental effect of a high-fat diet on memory in male control Non-Tg mice in the Y-maze test has been reported previously [47] and the current findings confirm this effect in males with impairment also observed in female Non-Tg mice. High-fat fed male mice have been reported to show poorer learning performance and greater deficits than females [57], an effect not seen here or previously [58, 59]. However, Hwang and colleagues assessed memory using different behavioral tests to the present study. As the onset of negative effects of a high-fat diet on memory in male Non-Tg mice depends on the behavioral test used [47], a sex difference may have been seen if additional tests had been used here.
A high-fat diet worsens memory in both male [46, 47] and female 3xTgAD mice [46, 49]. Here we show that a high-fat diet advanced memory deficits in both male and female 3xTgAD mice. We did not assess the effect of a high-fat diet on AD pathology, as we have shown previously that the negative effect of high-fat diet on memory in 3xTgAD mice was not associated with increased pathology (Aβ plaques, oligomers, and tau) [47] including at ages assessed here (4–16 months of age). Thus it is unlikely that changes in classical pathological hallmarks of AD are involved in these effects on a high-fat diet on cognition seen here. We also observed that control-fed female 3xTgAD mice perform worse than male 3xTgAD mice, as females but not males had a deficit in the Y-maze test at 14 months of age. These results are in line with other studies demonstrating higher impairment in female 3xTgAD when compared with male 3xTgAD mice [60, 61], which might be due to exacerbated AD pathology in female mice [62, 63]. However, as AD pathology was not assessed in the present study, we are not able to conclude if such changes in behavior between male and female control-fed 3xTgAD mice are associated with differences in amyloid and/or tau.
A high-fat diet increased body and fat weight, and insulin levels in both male and female Non-Tg and 3xTgAD mice. However, differences in 3xTgAD versus Non-Tg mice were seen as 3xTgAD mice gained less body weight after a high-fat diet, even though male 3xTgAD mice had greater gonadal fat mass at 14 months of age. Differences in the metabolic response to a high-fat diet have been seen previously in 3xTgAD mice [47] and are likely due to their altered metabolic rate and activity [64, 65]. Furthermore, male 3xTgAD mice fed a control diet weighed less than Non-Tg mice, which is consistent with previous data showing that over time 3xTgAD mice weigh less and have higher metabolic rates [64]. Male and female 3xTgAD mice on a control diet also had a lower heart rate but no change in systolic blood pressure. To our knowledge this is the first study reporting a difference in heart rate in an AD mouse model. Bradycardia has been observed in patients with dementia [66]. As the sympathetic and parasympathetic nervous system are key regulators of blood pressure and heart rate, a change in autonomic function might be responsible for the slower heart rate seen here. In support, patients with Alzheimer’s disease are reported to have autonomic dysfunction [67, 68]. Plasma insulin increased after high-fat feeding in Non-Tg but not 3xTgAD mice. High peripheral levels of insulin after high-fat feeding can lead to insulin resistance, which has been associated with impaired memory [39, 69–71] and brain insulin resistance is observed in AD [72]. Insulin can play an important role in hippocampal-dependent memory processes and the hippocampus shows high levels of insulin receptor expression [73, 74]. Furthermore, diabetes (a common co-morbidity in obesity) is associated with insulin resistance and cognitive dysfunction [75]. Rodent models of diabetes also present with cognitive impairments that are associated with changes neuronal number, dendritic spine density and mitochondrial alterations [76–79]. It is possible therefore that deficits in hippocampal dependent memory observed here in Non-Tg mice may arise from insulin resistance/reduced insulin sensitivity induced by high-fat diet. Furthermore, even though plasma insulin did not change in 3xTgAD mice after a high-fat diet a change in insulin sensitivity may have been present. In support, a high-fat diet reduced insulin sensitivity in 3xTgAD mice and a single injection of insulin reversed the detrimental effect of high-fat diet on memory [49]. However, whether changes in insulin sensitivity are involved in the effects of a high-fat diet on memory or in 3xTgAD mice seen here remain to be determined as insulin sensitivity would need to be measured directly.
Although it is known that a high-fat diet and AD are associated with blood-brain barrier (BBB) impairment, such as increased BBB permeability, disruption of tight junction proteins, thickening of basement membrane, and altered vessel structure in animal models [80–83], our data showed no ultrastructural alterations in cerebral capillaries in response to a high-fat diet or in 3xTgAD mice. However, a high-fat diet caused mitochondrial elongation in capillary endothelium of Non-Tg mice, effects that were similar to those observed in control-fed 3xTgAD mice. Changes in the morphology of endothelial mitochondria in Non-Tg mice on a high-fat diet or in 3xTgAD mice were observed without an overall change in mitochondrial number. In contrast, loss of endothelial mitochondria have been reported to be associated with BBB dysfunction in AD [21, 84]. Enlargement of mitochondria may represent increased activity of these cells as a result of compensatory mechanisms against potential dysfunctional BBB, since increased density of enlarged mitochondria has been associated with BBB leakage [85]. This elongation of mitochondria could also be a protective way to maintain microvascular and neuronal integrity by trying to increase mitochondrial energy supply. Although it is known that vascular volume is reduced in 3xTgAD mice, no difference in the functional integrity of the BBB is observed [86, 87]. Such evidence could support our data showing no ultrastructural changes in the BBB of the hippocampus of 3xTgAD mice. However, as we did not assess the levels of proteins involved in BBB integrity, such as tight junction proteins, other BBB transporters, or BBB permeability, the effect of a high-fat diet on BBB function remains to be determined.
As in capillary endothelium, a high-fat diet affected mitochondrial morphology in the neuropil of Non-Tg mice. These effects of a high-fat diet were similar to those observed in 3xTgAD mice fed on a control diet. In contrast to the endothelium, the number of mitochondrial in the neuropil of the hippocampus was reduced in response to a high-fat diet in Non-Tg mice and in 3xTgAD mice fed a control diet. The numbers of neuronal mitochondria are reported to be reduced in diabetes [88], a common complication associated with both obesity and AD. In control fed 3xTgAD mice, this reduction in mitochondrial number was associated with an increase in the percentage of elongated mitochondria in the hippocampus, suggesting that in an AD mouse model not only the density but the morphology of mitochondria were affected, and that these effects are specific to the hippocampus. Mitochondria can undergo fission (division) and fusion, processes that can change mitochondrial morphology, number, and shape [89]. Tight regulation and control of such dynamic processes in mitochondria are essential for neuronal health, as an imbalance in these processes can lead to mitochondrial dysfunction and neuronal damage [5–7]. Some studies have demonstrated that in rodents, high-fat diets increase mitochondrial fusion and/or fission in neurons [90], white adipose tissue [91], and hepatic cells [92]. An elongated and tubular morphology, which is associated with mitochondrial fusion, has been suggested to be a protective mechanism in mitochondria to avoid degradation by autophagy, in order to maintain mitochondrial numbers under stress conditions [93]. In addition, an imbalance of mitochondrial dynamics in neurons, including changes in fission and fusion, have been shown to be early key factors in neurodegenerative disorders such as AD [7, 94–96]. Elongated mitochondria have also been observed in fibroblasts from AD patients [97]. However, in 3xTgAD mice, markers of mitochondrial fission in neurons are increased [95]. Therefore, our data supports that the balance of mitochondrial dynamics is affected by a high-fat diet and during AD progression, as the percentage of elongated mitochondria is altered. This suggests that changes in mitochondrial dynamics could possibly be due to an increase of fusion and/or a decrease of fission that are normally associated with an increase in mitochondrial length. Whether the changes in mitochondrial morphology after a high-fat diet and in AD seen here result in an impairment in function remains to be determined.
In addition to a reduction in number and change in mitochondrial length in the brain parenchyma, our data also show that after high-fat feeding and in 3xTgAD mice other more severe morphological changes in mitochondria were detected in the hippocampus, including enlarged, swollen, and/or absent cristae, and less dense or empty matrix. Such results are consistent with findings from other experimental studies where high-fat feeding leads to swollen mitochondria with reduced electron dense matrix and loss of cristae integrity in neurons and other tissues [98–101]. Such mitochondrial damage in response to a high-fat diet has been proposed to be due to oxidative stress and ROS production [98, 99]. Mitochondrial morphological abnormalities are also seen in AD mouse models [94, 102–104] including isolated mitochondria from 3xTgAD mice [102]. Here we show that morphological changes in 3xTgAD are specific to the hippocampus, in particular to the subiculum, which is one of the regions displaying the earliest severe pathology in AD patients. As extracellular Aβ plaques in the hippocampus of 3xTgAD mice are not detected until 12 months of age [47, 64], mitochondrial changes therefore precede plaque formation. Moreover, since we observe similar mitochondrial morphological changes in high-fat fed Non-Tg mice it is unlikely that Aβ plaque formation is the cause of the ultrastructural changes in mitochondria seen here.
Synapses are sites of high-energy demand associated with an abundance of mitochondria. Dysfunctional mitochondria would eventually be transported to synaptic terminals where they will produce low levels of ATP, causing detrimental effects on synapses that lead to synaptic degeneration [8, 9].Data in the present study showed that the number of synapses was reduced in 3xTgAD mice and that a high-fat diet caused a similar effect in Non-Tg mice. Synaptic damage is known to occur in AD, and in AD patients there is a decrease in the number of synapses [10–12, 105]. In addition, synaptic loss and changes in synaptic proteins have also been shown in AD animal models [106, 107], in vitro in Aβ-treated neurons [94], and after a high-fat diet in rodents [39, 108, 109]. Here we show that a high-fat diet decreased synaptic density in Non-Tg mice and that this effect is accompanied by a decrease in mitochondrial number in hippocampal neuropil, effects identical to those observed in control-fed 3xTgAD mice. Our findings therefore suggest that a change in mitochondrial morphology might lead to an imbalance in mitochondrial function that results in a decrease in synaptic number, potentially impairing cognition in 3xTgAD mice and after a high-fat diet in Non-Tg controls.
In conclusion, our study suggests that a high-fat diet can impair memory in control mice and advance memory deficits in an AD mouse model. A high-fat diet impaired mitochondria morphology and reduced the number of synapses in Non-Tg mice, similar to changes observed in the 3xTgAD mouse model of AD. These data therefore imply that these changes in the brain are likely to occur independently of amyloid (Aβ) dependent pathways and could be responsible for the detrimental effect of a high-fat diet on cognition.
ACKNOWLEDGMENTS
IM was a PhD student funded by “Fundacao para a Ciencia e a Tecnologia” (FCT), Portugal (Isaura Martins fellowship: SFRH/BD/73041/2010). We also acknowledge the Alzheimer’s Research UK Manchester and North West Network and the Alzheimer’s Society. We are also grateful to the Biological Services Facility at the University of Manchester for expert animal husbandry and Mrs. Samantha Forbes, Dr. Tobias Starborg, and Dr. Aleksandr Mironov of the Faculty of Life Sciences EM facility for their assistance and the Wellcome Trust for equipment grant support to the EM facility.
Authors’ disclosures available online (http://j-alz.com/manuscript-disclosures/16-0640r2).
REFERENCES
[1] | Scheltens P , Blennow K , Breteler MMB , de Strooper B , Frisoni GB , Salloway S , Van der Flier WM ((2016) ) Alzheimer’s disease. Lancet 388: , 505–517. |
[2] | Barage SH , Sonawane KD ((2015) ) Amyloid cascade hypothesis: Pathogenesis and therapeutic strategies in Alzheimer’s disease. Neuropeptides 52: , 1–18. |
[3] | Hardy J ((2009) ) The amyloid hypothesis for Alzheimer’s disease: A critical reappraisal. J Neurochem 110: , 1129–1134. |
[4] | Swerdlow RH , Burns JM , Khan SM ((2014) ) The Alzheimer’s disease mitochondrial cascade hypothesis: Progress and perspectives. Biochim Biophys Acta 1842: , 1219–1231. |
[5] | Cai Q , Tammineni P ((2016) ) Alterations in mitochondria quality control in Alzheimer’s disease. Front Cell Neurosci 10: , 24. |
[6] | Chen H , Chan DC ((2009) ) Mitochondrial dynamics–fusion, fission, movement, and mitophagy–in neurodegenerative diseases. Hum Mol Genet 18: , R169–R176. |
[7] | Itoh K , Nakamura K , Iijima M , Sesaki H ((2013) ) Mitochondrial dynamics in neurodegeneration. Trends Cell Biol 23: , 64–71. |
[8] | Li Z , Okamoto K-I , Hayashi Y , Sheng M ((2004) ) The importance of dendritic mitochondria in the morphogenesis and plasticity of spines and synapses. Cell 119: , 873–887. |
[9] | Verstreken P , Ly CV , Venken KJT , Koh T-W , Zhou Y , Bellen HJ ((2005) ) Synaptic mitochondria are critical for mobilization of reserve pool vesicles at Drosophila neuromuscular junctions. Neuron 47: , 365–378. |
[10] | Bayer TA , Wirths O ((2010) ) Intracellular accumulation of amyloid-beta - a predictor for synaptic dysfunction and neuron loss in Alzheimer’s disease. Front Aging Neurosci 2: , 1–10. |
[11] | Reddy PH , Beal MF ((2008) ) Amyloid beta, mitochondrial dysfunction and synaptic damage: Implications for cognitive decline in aging and Alzheimer’s disease. Trends Mol Med 14: , 45–53. |
[12] | Scheff SW , Price DA ((2003) ) Synaptic pathology in Alzheimer’s disease: A review of ultrastructural studies. Neurobiol Aging 24: , 1029–1046. |
[13] | Baloyannis SJ ((2006) ) Mitochondrial alterations in Alzheimer’s disease. J Alzheimers Dis 9: , 119–126. |
[14] | Devi L , Prabhu BM , Galati DF , Avadhani NG , Anandatheerthavarada HK ((2006) ) Accumulation of amyloid precursor protein in the mitochondrial import channels of human Alzheimer’s disease brain is associated with mitochondrial dysfunction. J Neurosci 26: , 9057–9068. |
[15] | Hirai K , Aliev G , Nunomura A , Fujioka H , Russell RL , Atwood CS , Johnson AB , Kress Y , Vinters HV , Tabaton M , Shimohama S , Cash AD , Siedlak SL , Harris PL , Jones PK , Petersen RB , Perry G , Smith MA ((2001) ) Mitochondrial abnormalities in Alzheimer’s disease. J Neurosci 21: , 3017–3023. |
[16] | Maurer I , Zierz S , Möller HJ ((2000) ) A selective defect of cytochrome c oxidase is present in brain of Alzheimer disease patients. Neurobiol Aging 21: , 455–462. |
[17] | Caspersen C , Wang N , Yao J , Sosunov A , Chen X , Lustbader JW , Xu HW , Stern D , McKhann G , Yan SD ((2005) ) Mitochondrial Abeta: A potential focal point for neuronal metabolic dysfunction in Alzheimer’s disease. FASEB J 19: , 2040–2041. |
[18] | Manczak M , Anekonda TS , Henson E , Park BS , Quinn J , Reddy PH ((2006) ) Mitochondria are a direct site of A beta accumulation in Alzheimer’s disease neurons: Implications for free radical generation and oxidative damage in disease progression. Hum Mol Genet 15: , 1437–1449. |
[19] | Reddy PH , McWeeney S , Park BS , Manczak M , Gutala RV , Partovi D , Jung Y , Yau V , Searles R , Mori M , Quinn J ((2004) ) Gene expression profiles of transcripts in amyloid precursor protein transgenic mice: Up-regulation of mitochondrial metabolism and apoptotic genes is an early cellular change in Alzheimer’s disease. Hum Mol Genet 13: , 1225–1240. |
[20] | Carvalho C , Correia SC , Perry G , Castellani RJ , Moreira PI ((2016) ) Cerebrovascular and mitochondrial abnormalities in Alzheimer’s disease: A brief overview. J Neural Transm (Vienna) 123: , 107–111. |
[21] | Claudio L ((1996) ) Ultrastructural features of the blood-brain barrier in biopsy tissue from Alzheimer’s disease patients. Acta Neuropathol 91: , 6–14. |
[22] | Correia SC , Santos RX , Cardoso S , Carvalho C , Candeias E , Duarte AI , Plácido AI , Santos MS , Moreira PI ((2012) ) Alzheimer disease as a vascular disorder: Where do mitochondria fit? Exp Gerontol 47: , 878–886. |
[23] | Bruce-Keller AJ , Keller JN , Morrison CD ((2009) ) Obesity and vulnerability of the CNS. Biochem Biophys Acta 1792: , 395–400. |
[24] | Elias MF , Elias PK , Sullivan LM , Wolf PA , D’Agostino RB ((2003) ) Lower cognitive function in the presence of obesity and hypertension: The Framingham heart study. Int J Obes Relat Metab Disord 27: , 260–268. |
[25] | Elias MF , Elias PK , Sullivan LM , Wolf PA , D’Agostino RB ((2005) ) Obesity, diabetes and cognitive deficit: The Framingham Heart Study. Neurobiol Aging 26: (Suppl 1), 11–16. |
[26] | Hassing LB , Dahl AK , Pedersen NL , Johansson B ((2010) ) Overweight in midlife is related to lower cognitive function 30 years later: A prospective study with longitudinal assessments. Dement Geriatr Cogn Disord 29: , 543–552. |
[27] | Kanoski SE , Davidson TL ((2011) ) Western diet consumption and cognitive impairment: Links to hippocampal dysfunction and obesity. Physiol Behav 103: , 59–68. |
[28] | Waldstein SR , Katzel LI ((2006) ) Interactive relations of central versus total obesity and blood pressure to cognitive function. Int J Obes (Lond) 30: , 201–207. |
[29] | Beydoun MA , Lhotsky A , Wang Y , Dal Forno G , An Y , Metter EJ , Ferrucci L , O’Brien R , Zonderman AB ((2008) ) Association of adiposity status and changes in early to mid-adulthood with incidence of Alzheimer’s disease. Am J Epidemiol 168: , 1179–1189. |
[30] | Fitzpatrick AL , Kuller LH , Lopez OL , Diehr P , O’Meara ES , Longstreth WT , Luchsinger JA ((2009) ) Midlife and late-life obesity and the risk of dementia: Cardiovascular health study. Arch Neurol 66: , 336–342. |
[31] | Gustafson DR ((2012) ) Adiposity and cognitive decline: Underlying mechanisms.S. J Alzheimers Dis 30: (Suppl 2), 97–112. |
[32] | Hassing LB , Dahl AK , Thorvaldsson V , Berg S , Gatz M , Pedersen NL , Johansson B ((2009) ) Overweight in midlife and risk of dementia: A 40-year follow-up study. Int J Obes Relat Metab Disord 33: , 893–898. |
[33] | Naderali EK , Ratcliffe SH , Dale MC ((2009) ) Obesity and Alzheimer’s disease: A link between body weight and cognitive function in old age. Am J Alzheimers Dis Other Demen 24: , 445–449. |
[34] | Whitmer RA , Gunderson EP , Barrett-Connor E , Quesenberry CP , Yaffe K ((2005) ) Obesity in middle age and future risk of dementia: A 27 year longitudinal population based study. BMJ 330: , 1–5. |
[35] | Whitmer RA , Gustafson DR , Barrett-Connor E , Haan MN , Gunderson EP , Yaffe K ((2008) ) Central obesity and increased risk of dementia more than three decades later. Neurology 71: , 1057–1064. |
[36] | Xu WL , Atti AR , Gatz M , Pedersen NL , Johansson B , Fratiglioni L ((2011) ) Midlife overweight and obesity increase late-life dementia risk: A population-based twin study. Neurology 76: , 1568–1574. |
[37] | Mueller K , Sacher J , Arelin K , Holiga S , Kratzsch J , Villringer A , Schroeter ML ((2012) ) Overweight and obesity are associated with neuronal injury in the human cerebellum and hippocampus in young adults: A combined MRI, serum marker and gene expression study. Transl Psychiatry 2: , e200. |
[38] | Raji CA , Ho AJ , Parikshak NN , Becker JT , Lopez OL , Kuller LH , Hua X , Leow AD , Toga AW , Thompson PM ((2010) ) Brain structure and obesity. Hum Brain Mapp 31: , 353–364. |
[39] | Arnold SE , Lucki I , Brookshire BR , Carlson GC , Browne CA , Kazi H , Bang S , Choi B-R , Chen Y , McMullen MF , Kim SF ((2014) ) High fat diet produces brain insulin resistance, synaptodendritic abnormalities and altered behavior in mice. Neurobiol Dis 67: , 79–87. |
[40] | Boitard C , Cavaroc A , Sauvant J , Aubert A , Castanon N , Layé S , Ferreira G ((2014) ) Impairment of hippocampal-dependent memory induced by juvenile high-fat diet intake is associated with enhanced hippocampal inflammation in rats. Brain Behav Immun 40: , 9–17. |
[41] | Heyward FD , Walton RG , Carle MS , Coleman MA , Garvey WT , Sweatt JD ((2012) ) Adult mice maintained on a high-fat diet exhibit object location memory deficits and reduced hippocampal SIRT1 gene expression. Neurobiol Learn Mem 98: , 25–32. |
[42] | Sobesky JL , Barrientos RM , De May HS , Thompson BM , Weber MD , Watkins LR , Maier SF ((2014) ) High-fat diet consumption disrupts memory and primes elevations in hippocampal IL-1β, an effect that can be prevented with dietary reversal or IL-1 receptor antagonism. Brain Behav Immun 42: , 22–32. |
[43] | Tucsek Z , Toth P , Tarantini S , Sosnowska D , Gautam T , Warrington JP , Giles CB , Wren JD , Koller A , Ballabh P , Sonntag WE , Ungvari Z , Csiszar A ((2014) ) Aging exacerbates obesity-induced cerebromicrovascular rarefaction, neurovascular uncoupling, and cognitive decline in mice. J Gerontol A Biol Sci Med Sci 69: , 1339–1352. |
[44] | Valladolid-Acebes I , Stucchi P , Cano V , Fernández-Alfonso MS , Merino B , Gil-Ortega M , Fole A , Morales L , Ruiz-Gayo M , Del Olmo N ((2011) ) High-fat diets impair spatial learning in the radial-arm maze in mice. Neurobiol Learn Mem 95: , 80–85. |
[45] | Valladolid-Acebes I , Fole A , Martín M , Morales L , Cano MV , Ruiz-Gayo M , Del Olmo N ((2013) ) Spatial memory impairment and changes in hippocampal morphology are triggered by high-fat diets in adolescent mice. Is there a role of leptin? Neurobiol Learn Mem 106: , 18–25. |
[46] | Barron AM , Rosario ER , Elteriefi R , Pike CJ ((2013) ) Sex-specific effects of high fat diet on indices of metabolic syndrome in 3xTg-AD mice: Implications for Alzheimer’s disease. PLoS One 8: , e78554. |
[47] | Knight EM , Martins IV , Gümüsgöz S , Allan SM , Lawrence CB ((2014) ) High-fat diet-induced memory impairment in triple-transgenic Alzheimer’s disease (3xTgAD) mice is independent of changes in amyloid and tau pathology. Neurobiol Aging 35: , 1821–1832. |
[48] | Maesako M , Uemura K , Kubota M , Kuzuya A , Sasaki K , Asada M , Watanabe K , Hayashida N , Ihara M , Ito H , Shimohama S , Kihara T , Kinoshita A ((2012) ) Environmental enrichment ameliorated high-fat diet-induced Aβ deposition and memory deficit in APP transgenic mice. Neurobiol Aging 33: , 1011.e11–23. |
[49] | Vandal M , White PJ , Tremblay C , St-Amour I , Chevrier G , Emond V , Lefrançois D , Virgili J , Planel E , Giguere Y , Marette A , Calon F ((2014) ) Insulin reverses the high-fat diet-induced increase in brain Aβ and improves memory in an animal model of Alzheimer disease. Diabetes 63: , 4291–4301. |
[50] | Oddo S , Caccamo A , Shepherd JD , Murphy MP , Golde TE , Kayed R , Metherate R , Mattson MP , Akbari Y , LaFerla FM ((2003) ) Triple-transgenic model of Alzheimer’s disease with plaques and tangles: Intracellular Abeta and synaptic dysfunction. Neuron 39: , 409–421. |
[51] | Rintoul GL , Filiano AJ , Brocard JB , Kress GJ , Reynolds IJ ((2003) ) Glutamate decreases mitochondrial size and movement in primary forebrain neurons. J Neurosci 23: , 7881–7888. |
[52] | Steenbergen R , Nanowski TS , Beigneux A , Kulinski A , Young SG , Vance JE ((2005) ) Disruption of the phosphatidylserine decarboxylase gene in mice causes embryonic lethality and mitochondrial defects. J Biol Chem 280: , 40032–40040. |
[53] | Cheng A , Wan R , Yang J-L , Kamimura N , Son TG , Ouyang X , Luo Y , Okun E , Mattson MP ((2012) ) Involvement of PGC-1α in the formation and maintenance of neuronal dendritic spines. Nat Commun 3: , 1–12. |
[54] | Haley MJ , Lawrence CB ((2016) ) The blood-brain barrier after stroke: Structural studies and the role of transcytotic vesicles. J Cereb Blood Flow Metab, doi: v |
[55] | Jackman K , Kahles T , Lane D , Garcia-Bonilla L , Abe T , Capone C , Hochrainer K , Voss H , Zhou P , Ding A , Anrather J , Iadecola C ((2013) ) Progranulin deficiency promotes post-ischemic blood-brain barrier disruption. J Neurosci 33: , 19579–19589. |
[56] | Sisková Z , Mahad DJ , Pudney C , Campbell G , Cadogan M , Asuni A , O’Connor V , Perry VH ((2010) ) Morphological and functional abnormalities in mitochondria associated with synaptic degeneration in prion disease. Am J Pathol 177: , 1411–1421. |
[57] | Hwang L-L , Wang C-H , Li T-L , Chang S-D , Lin L-C , Chen C-P , Chen C-T , Liang K-C , Ho I-K , Yang W-S , Chiou L-C ((2010) ) Sex differences in high-fat diet-induced obesity, metabolic alterations and learning, and synaptic plasticity deficits in mice. Obesity (Silver Spring) 18: , 463–469. |
[58] | Underwood EL , Thompson LT ((2016) ) A high-fat diet causes impairment in hippocampal memory and sex-dependent alterations in peripheral metabolism. Neural Plast 2016: , 1–10. |
[59] | Underwood EL , Thompson LT ((2016) ) High-fat diet impairs spatial memory and hippocampal intrinsic excitability and sex-dependently alters circulating insulin and hippocampal insulin sensitivity. Biol Sex Differ 7: , 9. |
[60] | Blázquez G , Cañete T , Tobeña A , Giménez-Llort L , Fernández-Teruel A ((2014) ) Cognitive and emotional profiles of aged Alzheimer’s disease (3xTgAD) mice: Effects of environmental enrichment and sexual dimorphism. Behav Brain Res 268: , 185–201. |
[61] | Clinton LK , Billings LM , Green KN , Caccamo A , Ngo J , Oddo S , McGaugh JL , LaFerla FM ((2007) ) Age-dependent sexual dimorphism in cognition and stress response in the 3xTg-AD mice. Neurobiol Dis 28: , 76–82. |
[62] | Hirata-Fukae C , Li H-F , Hoe H-S , Gray AJ , Minami SS , Hamada K , Niikura T , Hua F , Tsukagoshi-Nagai H , Horikoshi-Sakuraba Y , Mughal M , Rebeck GW , LaFerla FM , Mattson MP , Iwata N , Saido TC , Klein WL , Duff KE , Aisen PS , Matsuoka Y ((2008) ) Females exhibit more extensive amyloid, but not tau, pathology in an Alzheimer transgenic model. Brain Res 1216: , 92–103. |
[63] | Rodríguez JJ , Jones VC , Tabuchi M , Allan SM , Knight EM , LaFerla FM , Oddo S , Verkhratsky A ((2008) ) Impaired adult neurogenesis in the dentate gyrus of a triple transgenic mouse model of Alzheimer’s disease. PLoS One 3: , e2935. |
[64] | Knight EM , Verkhratsky A , Luckman SM , Allan SM , Lawrence CB ((2012) ) Hypermetabolism in a triple-transgenic mouse model of Alzheimer’s disease. Neurobiol Aging 33: , 187–193. |
[65] | Knight EM , Brown TM , Gümüsgöz S , Smith JC , Waters EJ , Allan SM , Lawrence CB ((2013) ) Age-related changes in core body temperature and activity in triple-transgenic Alzheimer’s disease (3xTgAD) mice. Dis Model Mech 6: , 160–170. |
[66] | Robles Bayón A , Gude Sampedro F , Torregrosa Quesada JM ((2014) ) Bradycardia in frontotemporal dementia. Neurologia 29: , 76–85. |
[67] | Femminella GD , Rengo G , Komici K , Iacotucci P , Petraglia L , Pagano G , de Lucia C , Canonico V , Bonaduce D , Leosco D , Ferrara N ((2014) ) Autonomic dysfunction in Alzheimer’s disease: Tools for assessment and review of the literature. J Alzheimers Dis 42: , 369–377. |
[68] | Jensen-Dahm C , Waldemar G , Staehelin Jensen T , Malmqvist L , Moeller MM , Andersen BB , Høgh P , Ballegaard M ((2015) ) Autonomic dysfunction in patients with mild to moderate Alzheimer’s disease. J Alzheimers Dis 47: , 681–689. |
[69] | McNay EC , Ong CT , McCrimmon RJ , Cresswell J , Bogan JS , Sherwin RS ((2010) ) Hippocampal memory processes are modulated by insulin and high-fat-induced insulin resistance. Neurobiol Learn Mem 93: , 546–553. |
[70] | McNeilly AD , Williamson R , Sutherland C , Balfour DJK , Stewart CA ((2011) ) High fat feeding promotes simultaneous decline in insulin sensitivity and cognitive performance in a delayed matching and non-matching to position task. Behav Brain Res 217: , 134–141. |
[71] | Stranahan AM , Norman ED , Lee K , Cutler RG , Telljohann RS , Egan JM , Mattson MP ((2008) ) Diet-induced insulin resistance impairs hippocampal synaptic plasticity and cognition in middle-aged rats. Hippocampus 18: , 1085–1088. |
[72] | Cholerton B , Baker LD , Craft S ((2013) ) Insulin, cognition, and dementia. Eur J Pharmacol 719: , 170–179. |
[73] | Stern SA , Chen DY , Alberini CM ((2014) ) The effect of insulin and insulin-like growth factors on hippocampus- and amygdala-dependent long-term memory formation. Learn Mem 21: , 556–563. |
[74] | Zhao W , Chen H , Xu H , Moore E , Meiri N , Quon MJ , Alkon DL ((1999) ) Brain insulin receptors and spatial memory. Correlated changes in gene expression, tyrosine phosphorylation, and signaling molecules in the hippocampus of water maze trained rats. J Biol Chem 274: , 34893–34902. |
[75] | Biessels GJ , Reagan LP ((2015) ) Hippocampal insulin resistance and cognitive dysfunction. Nat Rev Neurosci 16: , 660–671. |
[76] | Hussain S , Mansouri S , Sjöholm Å , Patrone C , Darsalia V ((2014) ) Evidence for cortical neuronal loss in male type 2 diabetic Goto-Kakizaki rats. J Alzheimers Dis 41: , 551–560. |
[77] | Moreira PI , Santos MS , Moreno AM , Seiça R , Oliveira CR ((2003) ) Increased vulnerability of brain mitochondria in diabetic (Goto-Kakizaki) rats with aging and amyloid-beta exposure. Diabetes 52: , 1449–1456. |
[78] | Li X-H , Xin X , Wang Y , Wu J-Z , Jin Z-D , Ma L-N , Nie C-J , Xiao X , Hu Y , Jin M-W ((2013) ) Pentamethylquercetin protects against diabetes-related cognitive deficits in diabetic Goto-Kakizaki rats. J Alzheimers Dis 34: , 755–767. |
[79] | Santos MS , Santos DL , Palmeira CM , Seiça R , Moreno AJ , Oliveira CR ((2001) ) Brain and liver mitochondria isolated from diabetic Goto-Kakizaki rats show different susceptibility to induced oxidative stress. Diabetes Metab Res Rev 17: , 223–230. |
[80] | Davidson TL , Monnot A , Neal AU , Martin AA , Horton JJ , Zheng W ((2012) ) The effects of a high-energy diet on hippocampal-dependent discrimination performance and blood–brain barrier integrity differ for diet-induced obese and diet-resistant rats. Physiol Behav 107: , 26–33. |
[81] | Freeman LR , Granholm A-CE ((2012) ) Vascular changes in rat hippocampus following a high saturated fat and cholesterol diet. J Cereb Blood Flow Metab 32: , 643–653. |
[82] | Ouyang S , Hsuchou H , Kastin AJ , Wang Y , Yu C , Pan W ((2014) ) Diet-induced obesity suppresses expression of many proteins at the blood-brain barrier. J Cereb Blood Flow Metab 34: , 43–51. |
[83] | Takeda S , Sato N , Morishita R ((2014) ) Systemic inflammation, blood-brain barrier vulnerability and cognitive/non-cognitive symptoms in Alzheimer disease: Relevance to pathogenesis and therapy. Front Aging Neurosci 6: , 171. |
[84] | Kalaria RN ((1996) ) Cerebral vessels in ageing and Alzheimer’s disease. Pharmacol Ther 72: , 193–214. |
[85] | Chen B , Friedman B , Cheng Q , Tsai P , Schim E , Kleinfeld D , Lyden PD ((2009) ) Severe blood-brain barrier disruption and surrounding tissue injury. Stroke 40: , e666–e674. |
[86] | Bourasset F , Ouellet M , Tremblay C , Julien C , Do TM , Oddo S , LaFerla F , Calon F ((2009) ) Reduction of the cerebrovascular volume in a transgenic mouse model of Alzheimer’s disease. Neuropharmacology 56: , 808–813. |
[87] | Do TM , Alata W , Dodacki A , Traversy M-T , Chacun H , Pradier L , Scherrmann J-M , Farinotti R , Calon F , Bourasset F ((2014) ) Altered cerebral vascular volumes and solute transport at the blood-brain barriers of two transgenic mouse models of Alzheimer’s disease. Neuropharmacology 81: , 311–317. |
[88] | Jing Y-H , Chen K-H , Kuo P-C , Pao C-C , Chen J-K ((2013) ) Neurodegeneration in streptozotocin-induced diabetic rats is attenuated by treatment with resveratrol. Neuroendocrinology 98: , 116–127. |
[89] | Cerveny KL , Tamura Y , Zhang Z , Jensen RE , Sesaki H ((2007) ) Regulation of mitochondrial fusion and division. Trends Cell Biol 17: , 563–569. |
[90] | Dietrich MO , Liu Z-W , Horvath TL ((2013) ) Mitochondrial dynamics controlled by mitofusins regulate Agrp neuronal activity and diet-induced obesity. Cell 155: , 188–199. |
[91] | Amengual-Cladera E , Lladó I , Proenza AM , Gianotti M ((2013) ) High-fat diet feeding induces a depot-dependent response on the pro-inflammatory state and mitochondrial function of gonadal white adipose tissue. Br J Nutr 109: , 413–424. |
[92] | Lionetti L , Mollica MP , Donizzetti I , Gifuni G , Sica R , Pignalosa A , Cavaliere G , Gaita M , De Filippo C , Zorzano A , Putti R ((2014) ) High-lard and high-fish-oil diets differ in their effects on function and dynamic behaviour of rat hepatic mitochondria. PLoS One 9: , e92753. |
[93] | Rambold AS , Kostelecky B , Elia N , Lippincott-Schwartz J ((2011) ) Tubular network formation protects mitochondria from autophagosomal degradation during nutrient starvation. Proc Natl Acad Sci U S A 108: , 10190–10195. |
[94] | Calkins MJ , Manczak M , Mao P , Shirendeb U , Reddy PH ((2011) ) Impaired mitochondrial biogenesis, defective axonal transport of mitochondria, abnormal mitochondrial dynamics and synaptic degeneration in a mouse model of Alzheimer’s disease. Hum Mol Genet 20: , 4515–4529. |
[95] | Manczak M , Reddy PH ((2012) ) Abnormal interaction between the mitochondrial fission protein Drp1 and hyperphosphorylated tau in Alzheimer’s disease neurons: Implications for mitochondrial dysfunction and neuronal damage. Hum Mol Genet 21: , 2538–2547. |
[96] | Wang X , Su B , Lee H-G , Li X , Perry G , Smith MA , Zhu X ((2009) ) Impaired balance of mitochondrial fission and fusion in Alzheimer’s disease. J Neurosci 29: , 9090–9103. |
[97] | Wang X , Su B , Fujioka H , Zhu X ((2008) ) Dynamin-like protein 1 reduction underlies mitochondrial morphology and distribution abnormalities in fibroblasts from sporadic Alzheimer’s disease patients. Am J Pathol 173: , 470–482. |
[98] | Bonnard C , Durand A , Peyrol S , Chanseaume E , Chauvin M-A , Morio B , Vidal H , Rieusset J ((2008) ) Mitochondrial dysfunction results from oxidative stress in the skeletal muscle of diet-induced insulin-resistant mice. J Clin Invest 118: , 789–800. |
[99] | Du Z , Yang Y , Hu Y , Sun Y , Zhang S , Peng W , Zhong Y , Huang X , Kong W ((2012) ) A long-term high-fat diet increases oxidative stress, mitochondrial damage and apoptosis in the inner ear of D-galactose-induced aging rats. Hear Res 287: , 15–24. |
[100] | Pipatpiboon N , Pratchayasakul W , Chattipakorn N , Chattipakorn SC ((2012) ) PPARγ agonist improves neuronal insulin receptor function in hippocampus and brain mitochondria function in rats with insulin resistance induced by long term high-fat diets. Endocrinology 153: , 329–338. |
[101] | Reddy SS , Shruthi K , Reddy VS , Raghu G , Suryanarayana P , Giridharan NV , Reddy GB ((2014) ) Altered ubiquitin-proteasome system leads to neuronal cell death in a spontaneous obese rat model. Biochim Biophys Acta 1840: , 2924–2934. |
[102] | Carvalho C , Cardoso S , Correia SC , Santos RX , Santos MS , Baldeiras I , Oliveira CR , Moreira PI ((2012) ) Metabolic alterations induced by sucrose intake and Alzheimer’s disease promote similar brain mitochondrial abnormalities. Diabetes 61: , 1234–1242. |
[103] | Trushina E , Nemutlu E , Zhang S , Christensen T , Camp J , Mesa J , Siddiqui A , Tamura Y , Sesaki H , Wengenack TM , Dzeja PP , Poduslo JF ((2012) ) Defects in mitochondrial dynamics and metabolomic signatures of evolving energetic stress in mouse models of familial Alzheimer’s disease. PLoS One 7: , e32737. |
[104] | Zou Y , Li Y , Yu W , Du Y , Shi R , Zhang M , Duan J , Deng Y , Tu Q , Dai R , Lü Y ((2013) ) Hypoxia-up-regulated mitochondrial movement regulator does not contribute to the APP/PS1 double transgenic mouse model of Alzheimer’s disease. Dement Geriatr Cogn Disord 36: , 137–145. |
[105] | Scheff SW , Price DA , Schmitt FA , Mufson EJ ((2006) ) Hippocampal synaptic loss in early Alzheimer’s disease and mild cognitive impairment. Neurobiol Aging 27: , 1372–1384. |
[106] | Alonso-Nanclares L , Merino-Serrais P , Gonzalez S , DeFelipe J ((2013) ) Synaptic changes in the dentate gyrus of APP/PS1 transgenic mice revealed by electron microscopy. J Neuropathol Exp Neurol 72: , 386–395. |
[107] | Zhang Z , Liu X , Schroeder JP , Chan C-B , Song M , Yu SP , Weinshenker D , Ye K ((2014) ) 7,8-dihydroxyflavone prevents synaptic loss and memory deficits in a mouse model of Alzheimer’s disease. Neuropsychopharmacology 39: , 638–650. |
[108] | Horvath TL , Sarman B , García-Cáceres C , Enriori PJ , Sotonyi P , Shanabrough M , Borok E , Argente J , Chowen JA , Perez-Tilve D , Pfluger PT , Brönneke HS , Levin BE , Diano S , Cowley MA , Tschöp MH ((2010) ) Synaptic input organization of the melanocortin system predicts diet-induced hypothalamic reactive gliosis and obesity. Proc Natl Acad Sci U S A 107: , 14875–14880. |
[109] | Bhat NR , Thirumangalakudi L ((2013) ) Increased tau phosphorylation and impaired brain insulin/IGF signaling in mice fed a high fat/high cholesterol diet. J Alzheimers Dis 36: , 781–789. |
Figures and Tables
Fig.1
A high-fat diet affects memory in Non-Tg and advances deficits in 3xTgAD mice. Separate groups of male and female Non-Tg control and 3xTgAD mice were maintained on a control or high-fat diet from 2 months of age. Memory was assessed by the novel smell recognition (A-C) and the Y-maze test (D-F) at 4 months of age (A, D), and in a separate group of mice at 8 (B, E) and 14 (C, F) months of age. Data are mean ± SEM, n = 6-12/group. *p < 0.05, ***p < 0.001 for a significant effect of high-fat diet compared to control fed mice of the same sex and genotype. #p < 0.05, # #p < 0.01 for a significant effect of 3xTgAD genotype compared to Non-Tg mice of the same sex and on the same diet. Data are analyzed with 3-way ANOVA followed by Sidak-Holme corrected planned contrasts.
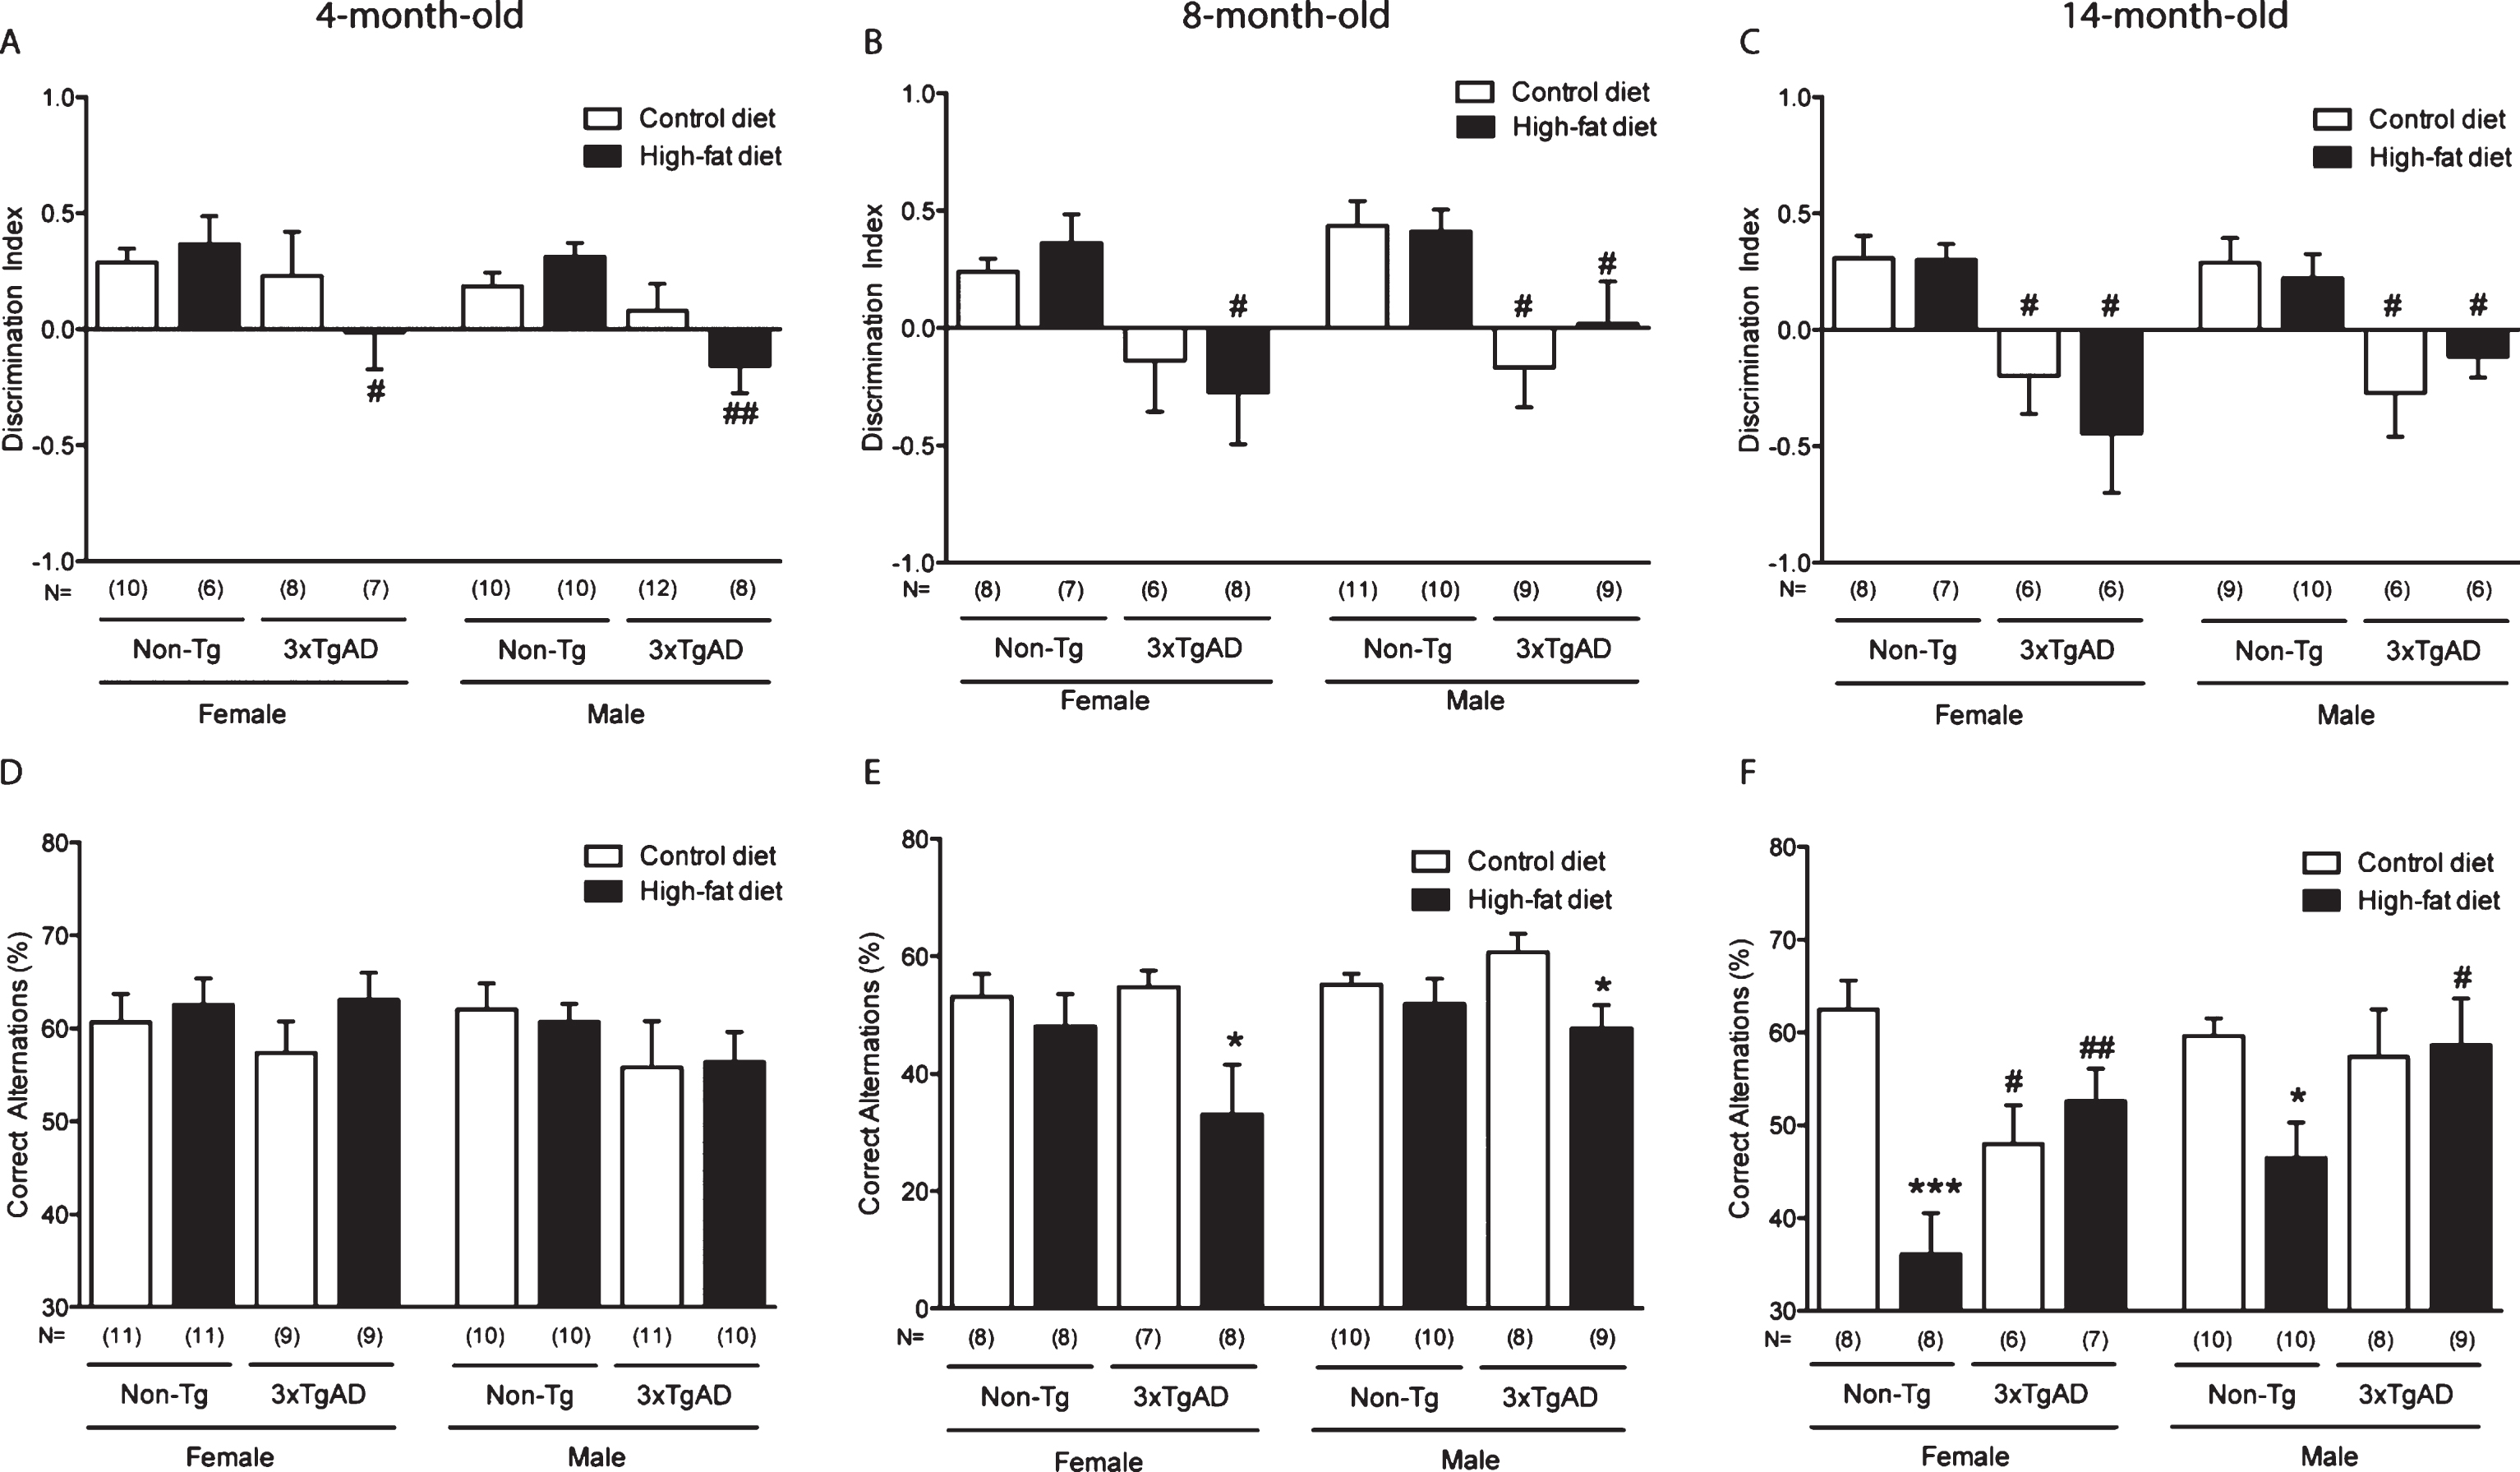
Fig.2
Mitochondrial length in hippocampal capillary endothelium is increased by a high-fat diet in Non-Tg control mice and in control fed 3xTgAD mice. Groups of Non-Tg and 3xTgAD mice were maintained on a control or high-fat diet from 2 months to 8 months of age and the number and length of endothelial mitochondria was measured in 10 random capillaries in the hippocampus (A, C) and cortex (B, D). The average number of mitochondria/capillary and the percentage of elongated mitochondria (defined as length > 0.5 μm) were calculated (A-D). Data are mean±SEM, n = 6-7/group (male and female). *p < 0.05; Two-way ANOVA with Bonferroni post hoc analysis. E) Electron micrographs illustrating the presence of mitochondria in the capillary endothelium in the hippocampus of Non-Tg and 3xTgAD mice fed a control or high-fat diet. High-fat fed Non-Tg and control and high-fat fed 3xTgAD mice presented with longer mitochondria compared to the normal endothelial mitochondria with round shape and form observed in control-fed Non-Tg mice. Dashed box represents the area of insert. Scale bars: 1 μm.
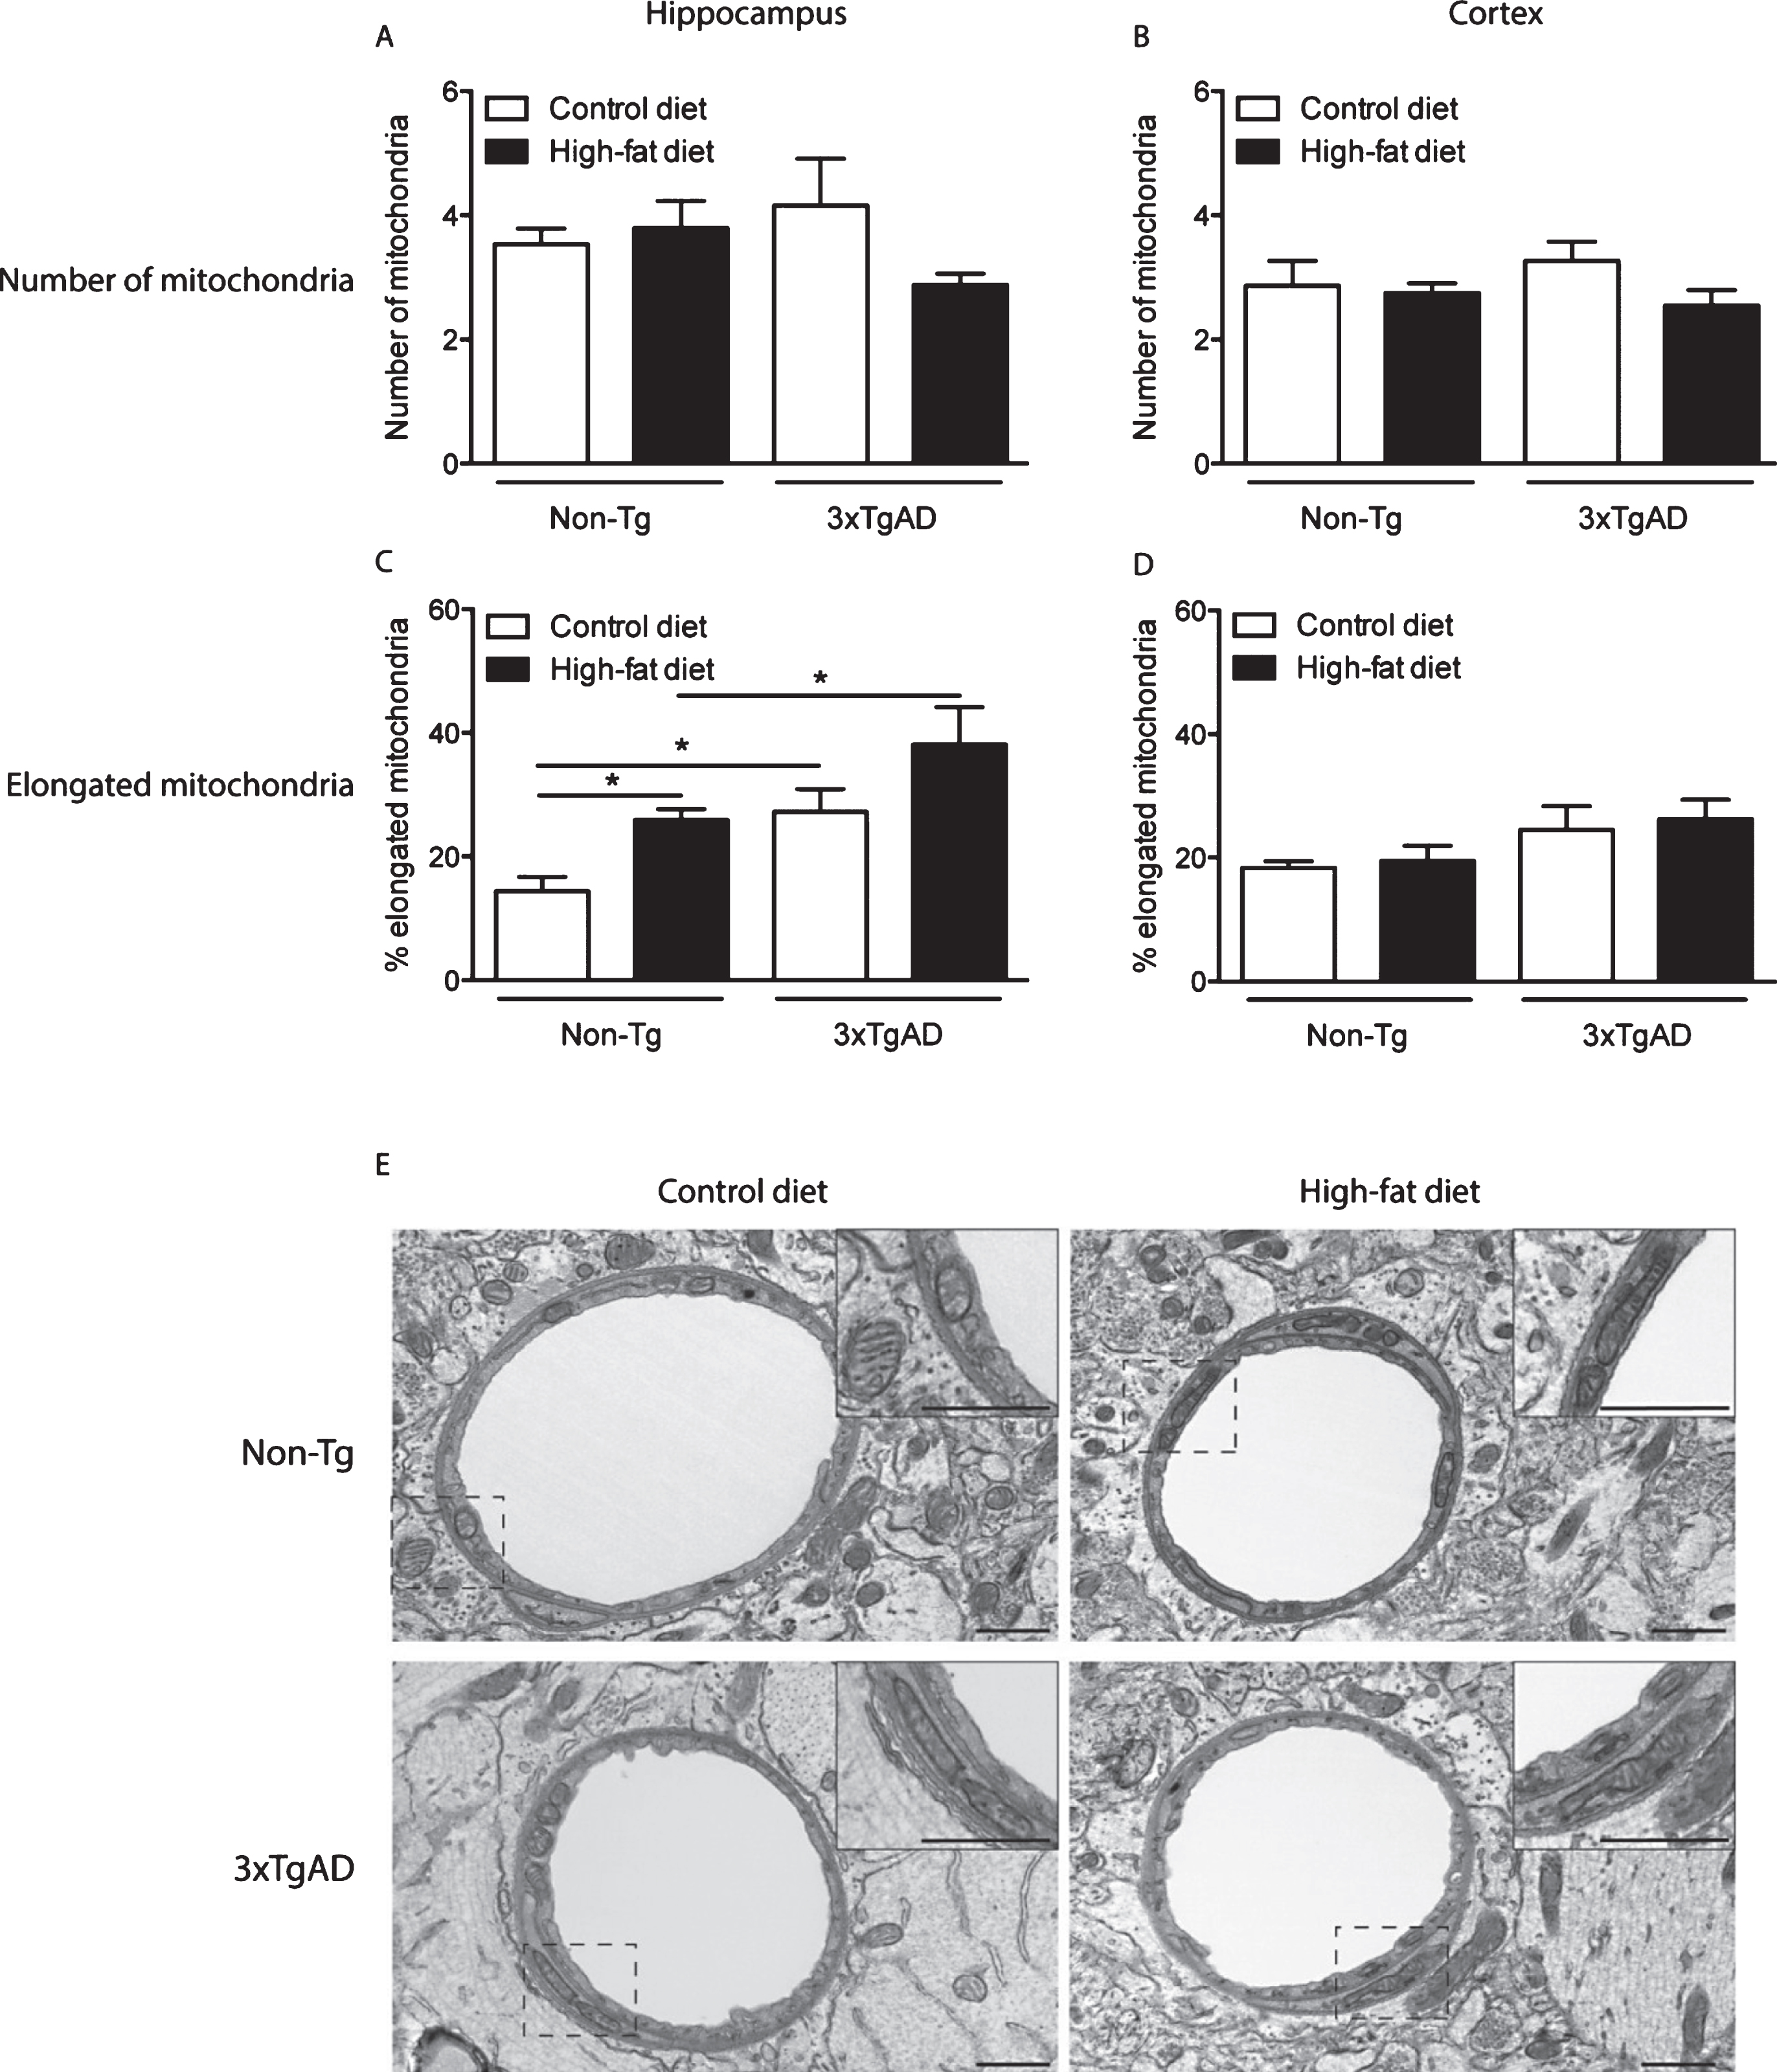
Fig.3
Mitochondrial abnormalities in the neuropil of the hippocampus of 3xTgAD mice fed on a control or high-fat diet. In the hippocampal neuropil of Non-Tg mice normal mitochondria were observed to be round in shape containing packed cristae and dense matrix (A). The following mitochondrial abnormalities were seen in 3xTgAD mice; elongated with swollen cristae (B), distorted and swollen cristae and with less dense matrix (C, E) and swollen with severe loss of cristae with an empty matrix (D). Scale bars: 0.5 μm.
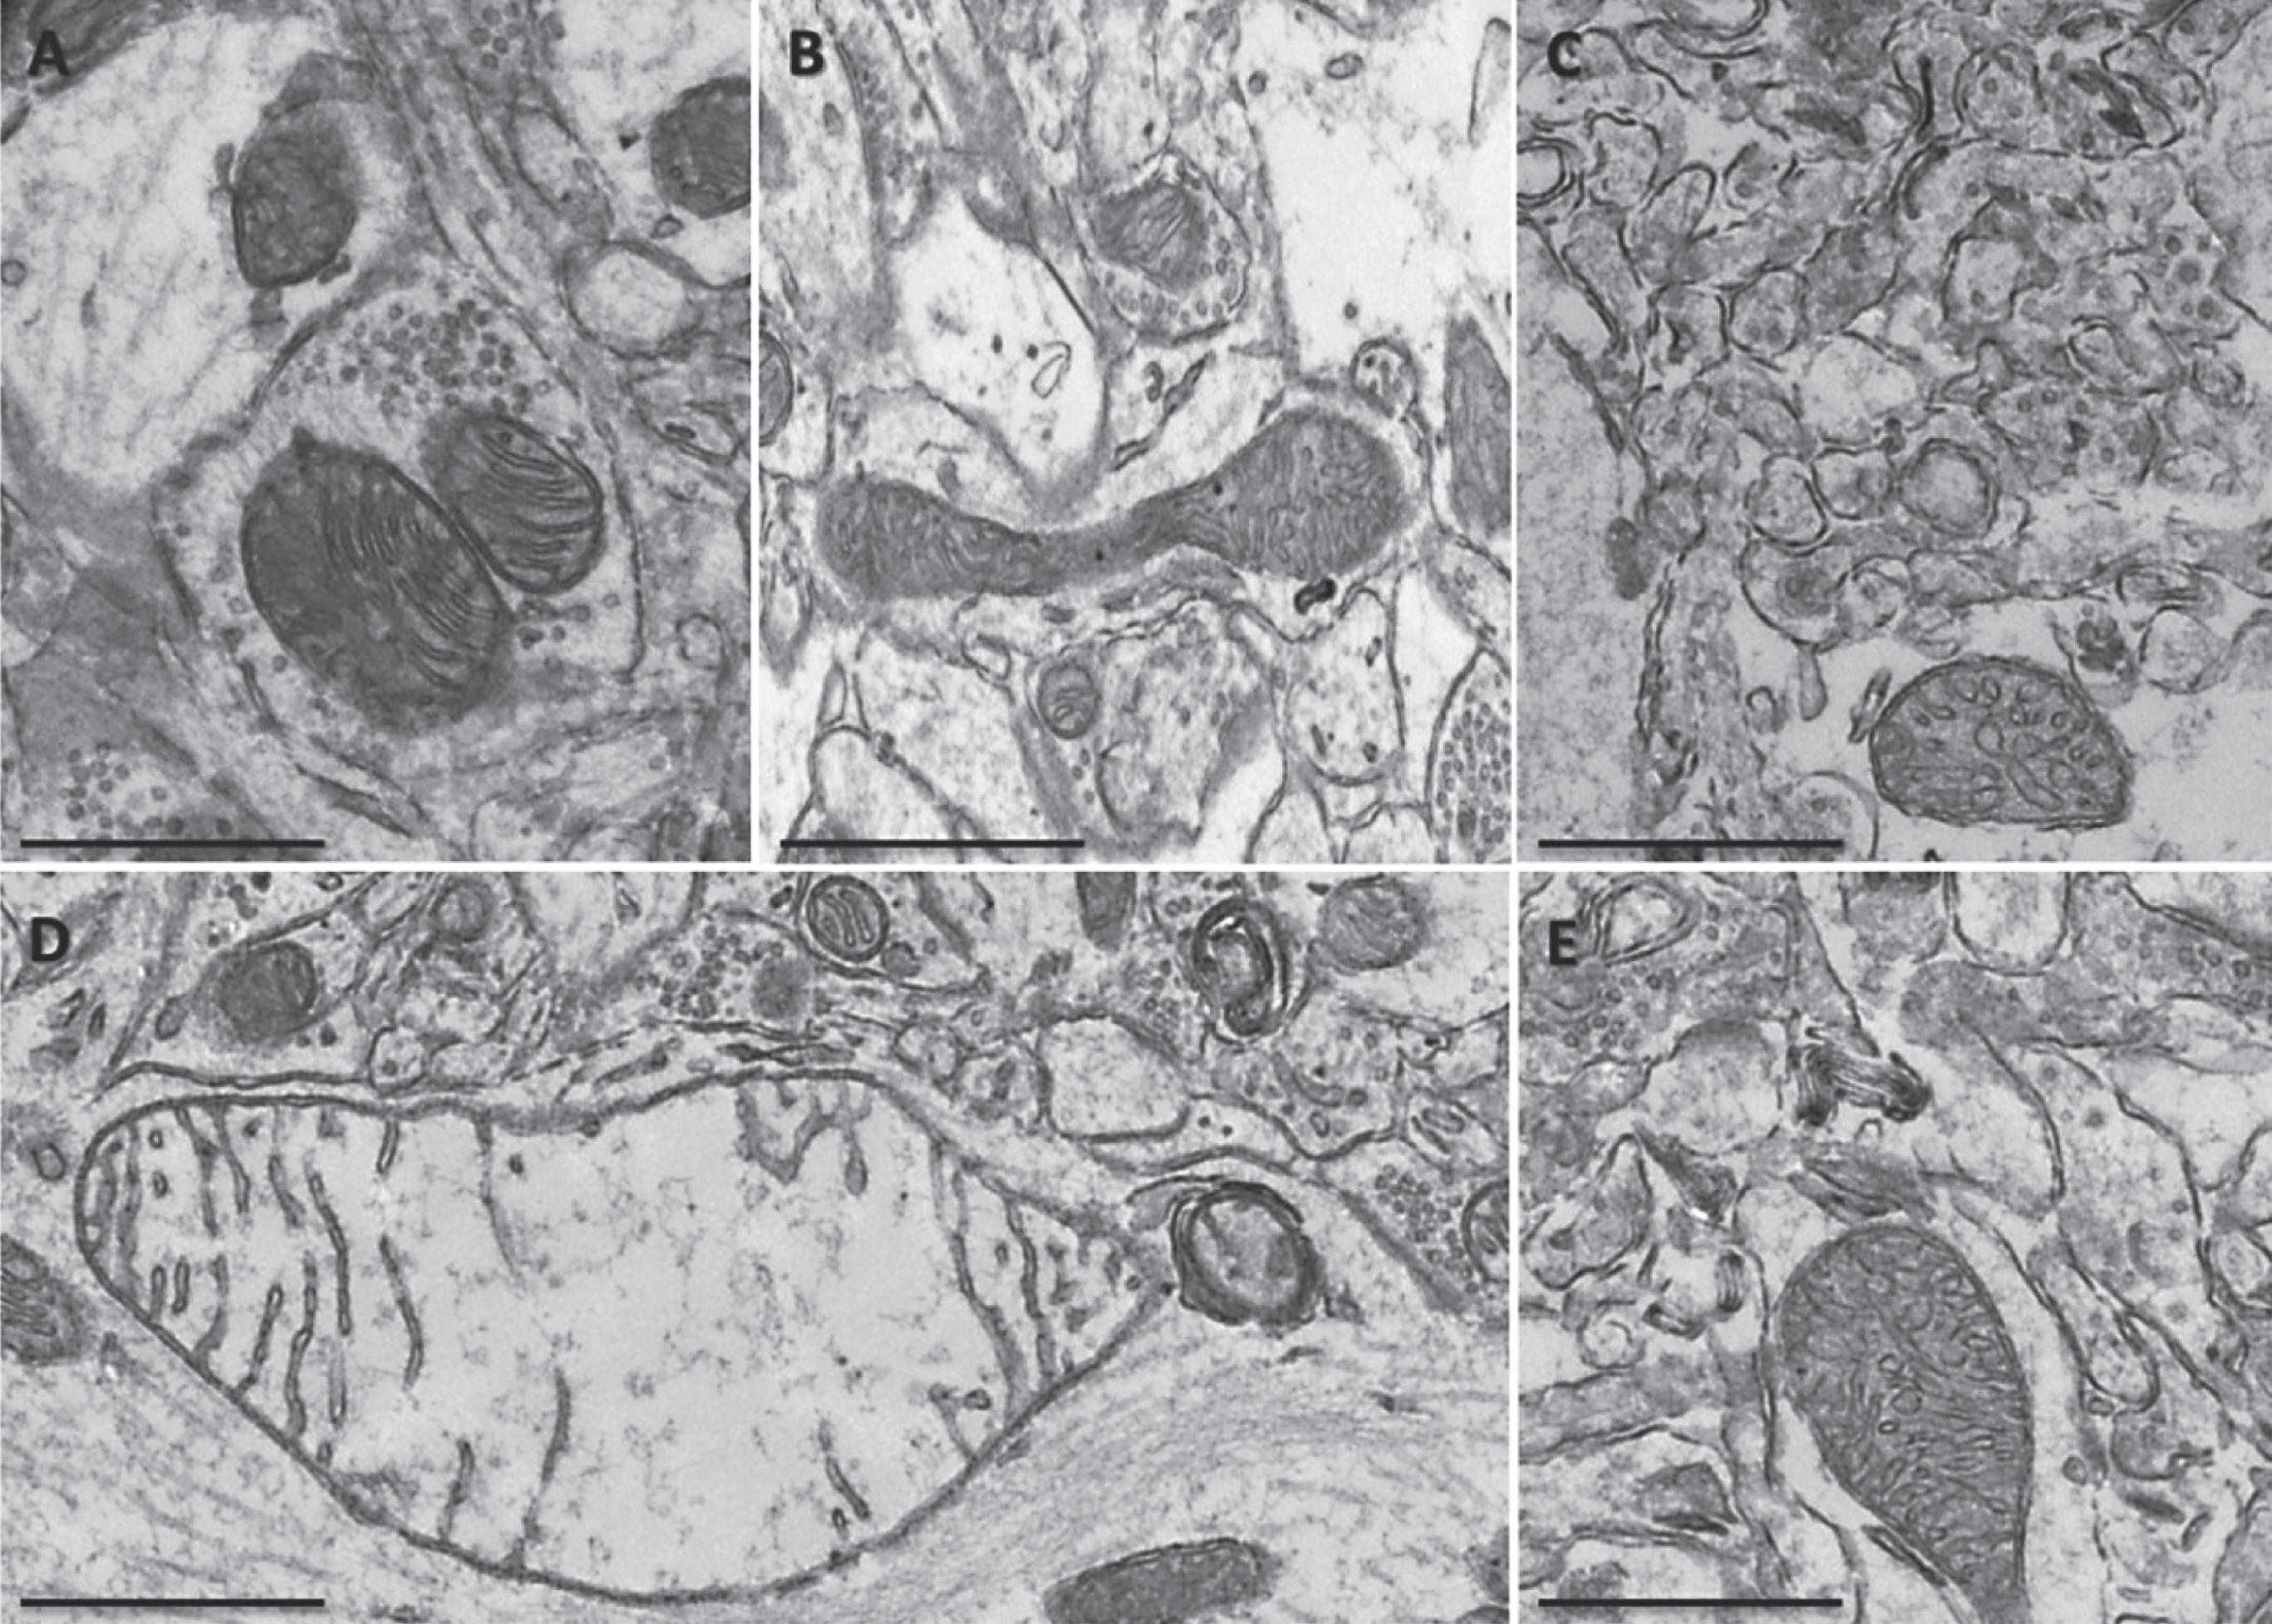
Fig.4
A high-fat diet affected mitochondrial morphology in the neuropil of the hippocampus of Non-Tg and 3xTgAD mice. A high-fat diet altered mitochondrial morphology in Non-Tg (A, B) and 3xTgAD mice (C, D). Mitochondria showed an absence of cristae, illustrated by holes and empty mitochondrial matrix (arrows). Scale bar: 0.5 μm.
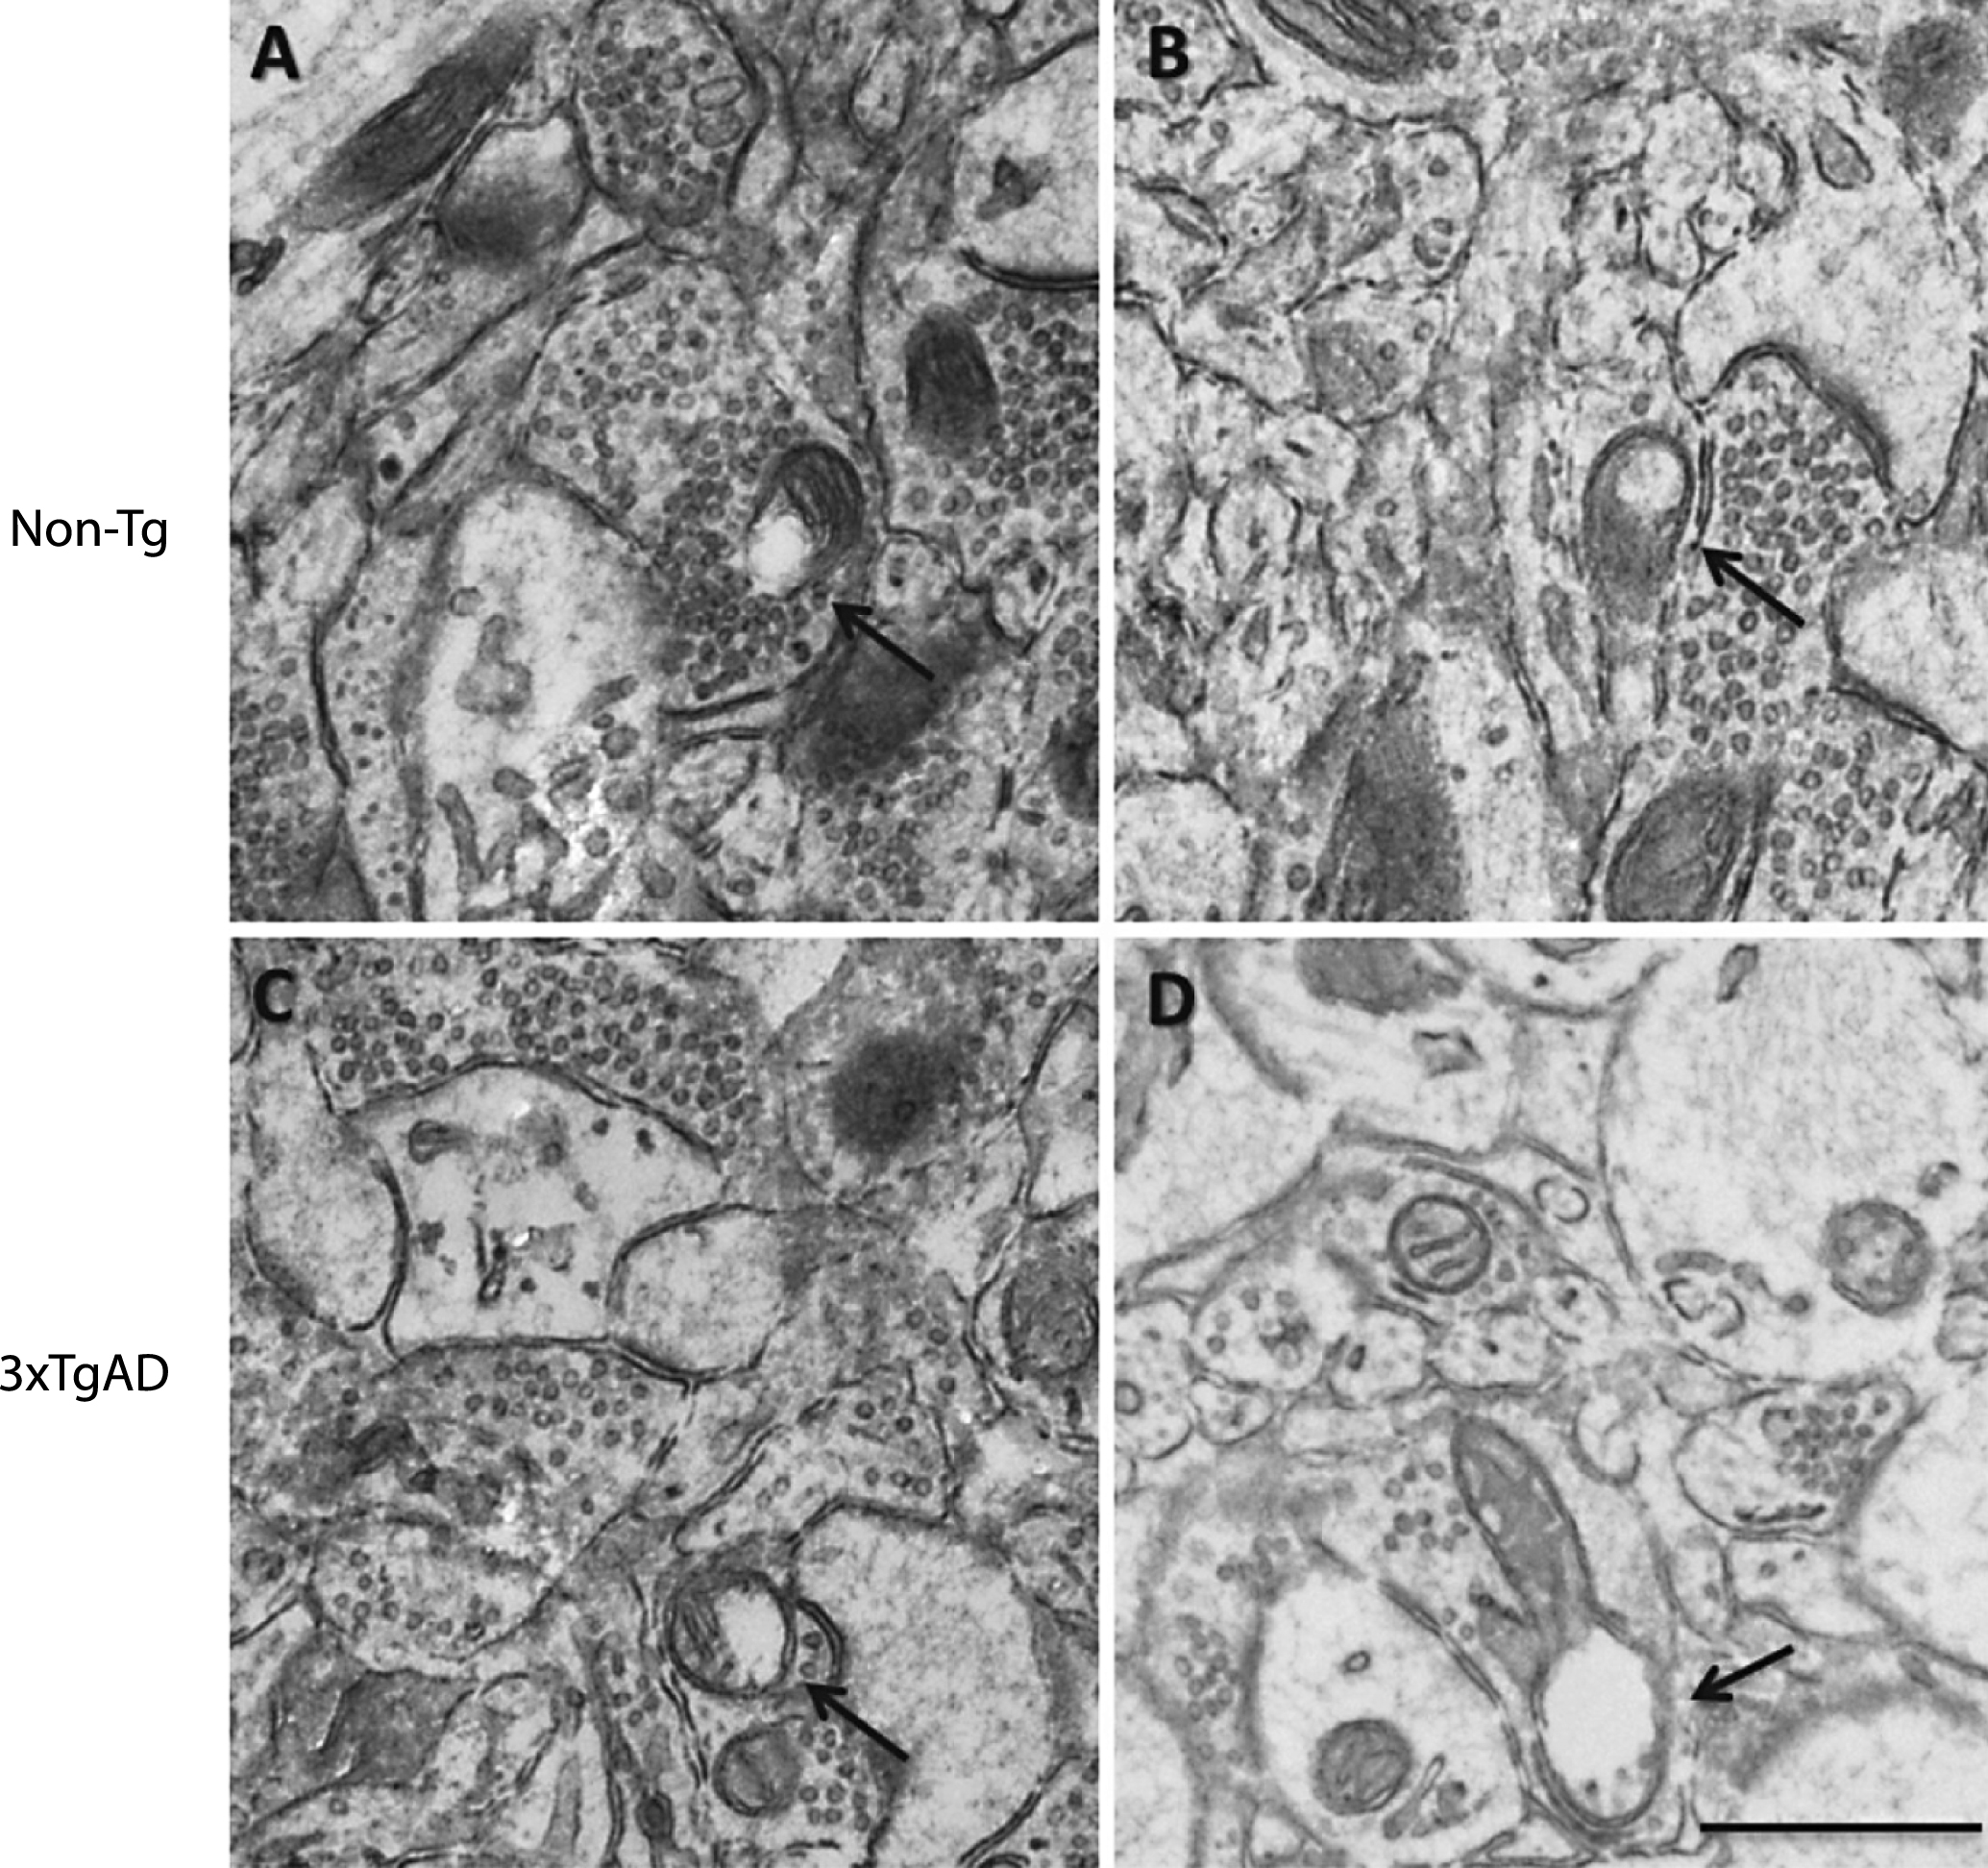
Fig.5
Changes in mitochondria and synapse number in the neuropil after a high-fat diet and in 3xTgAD mice. Groups of Non-Tg and 3xTgAD mice were maintained on a control or high-fat diet from 2 months to 8 months of age and the number and length of mitochondria and number of synapses were measured in the hippocampus (A, C, E) and cortex (B, D, F) in 10 different fields of view (63 μm2)/animal. The average number of mitochondria and synapses, and the percentage of elongated mitochondria (defined as length > 0.5 μm) were calculated (A-F). Data are mean±SEM, n = 6-7/group (male and female). *p < 0.05, **p < 0.01, ***p < 0.001; Two-way ANOVA with Bonferroni post hoc analysis. G) Electron micrographs illustrating the presence of mitochondria and synapses in the hippocampal neuropil of Non-Tg and 3xTgAD mice fed a control or high-fat diet. Control and high-fat fed 3xTgAD mice presented with longer mitochondria (arrowheads) compared to the normal mitochondria (arrows) with round shape and form observed in control-fed Non-Tg mice. Synapses are also illustrated (asterisks). Scale bar: 1 μm.
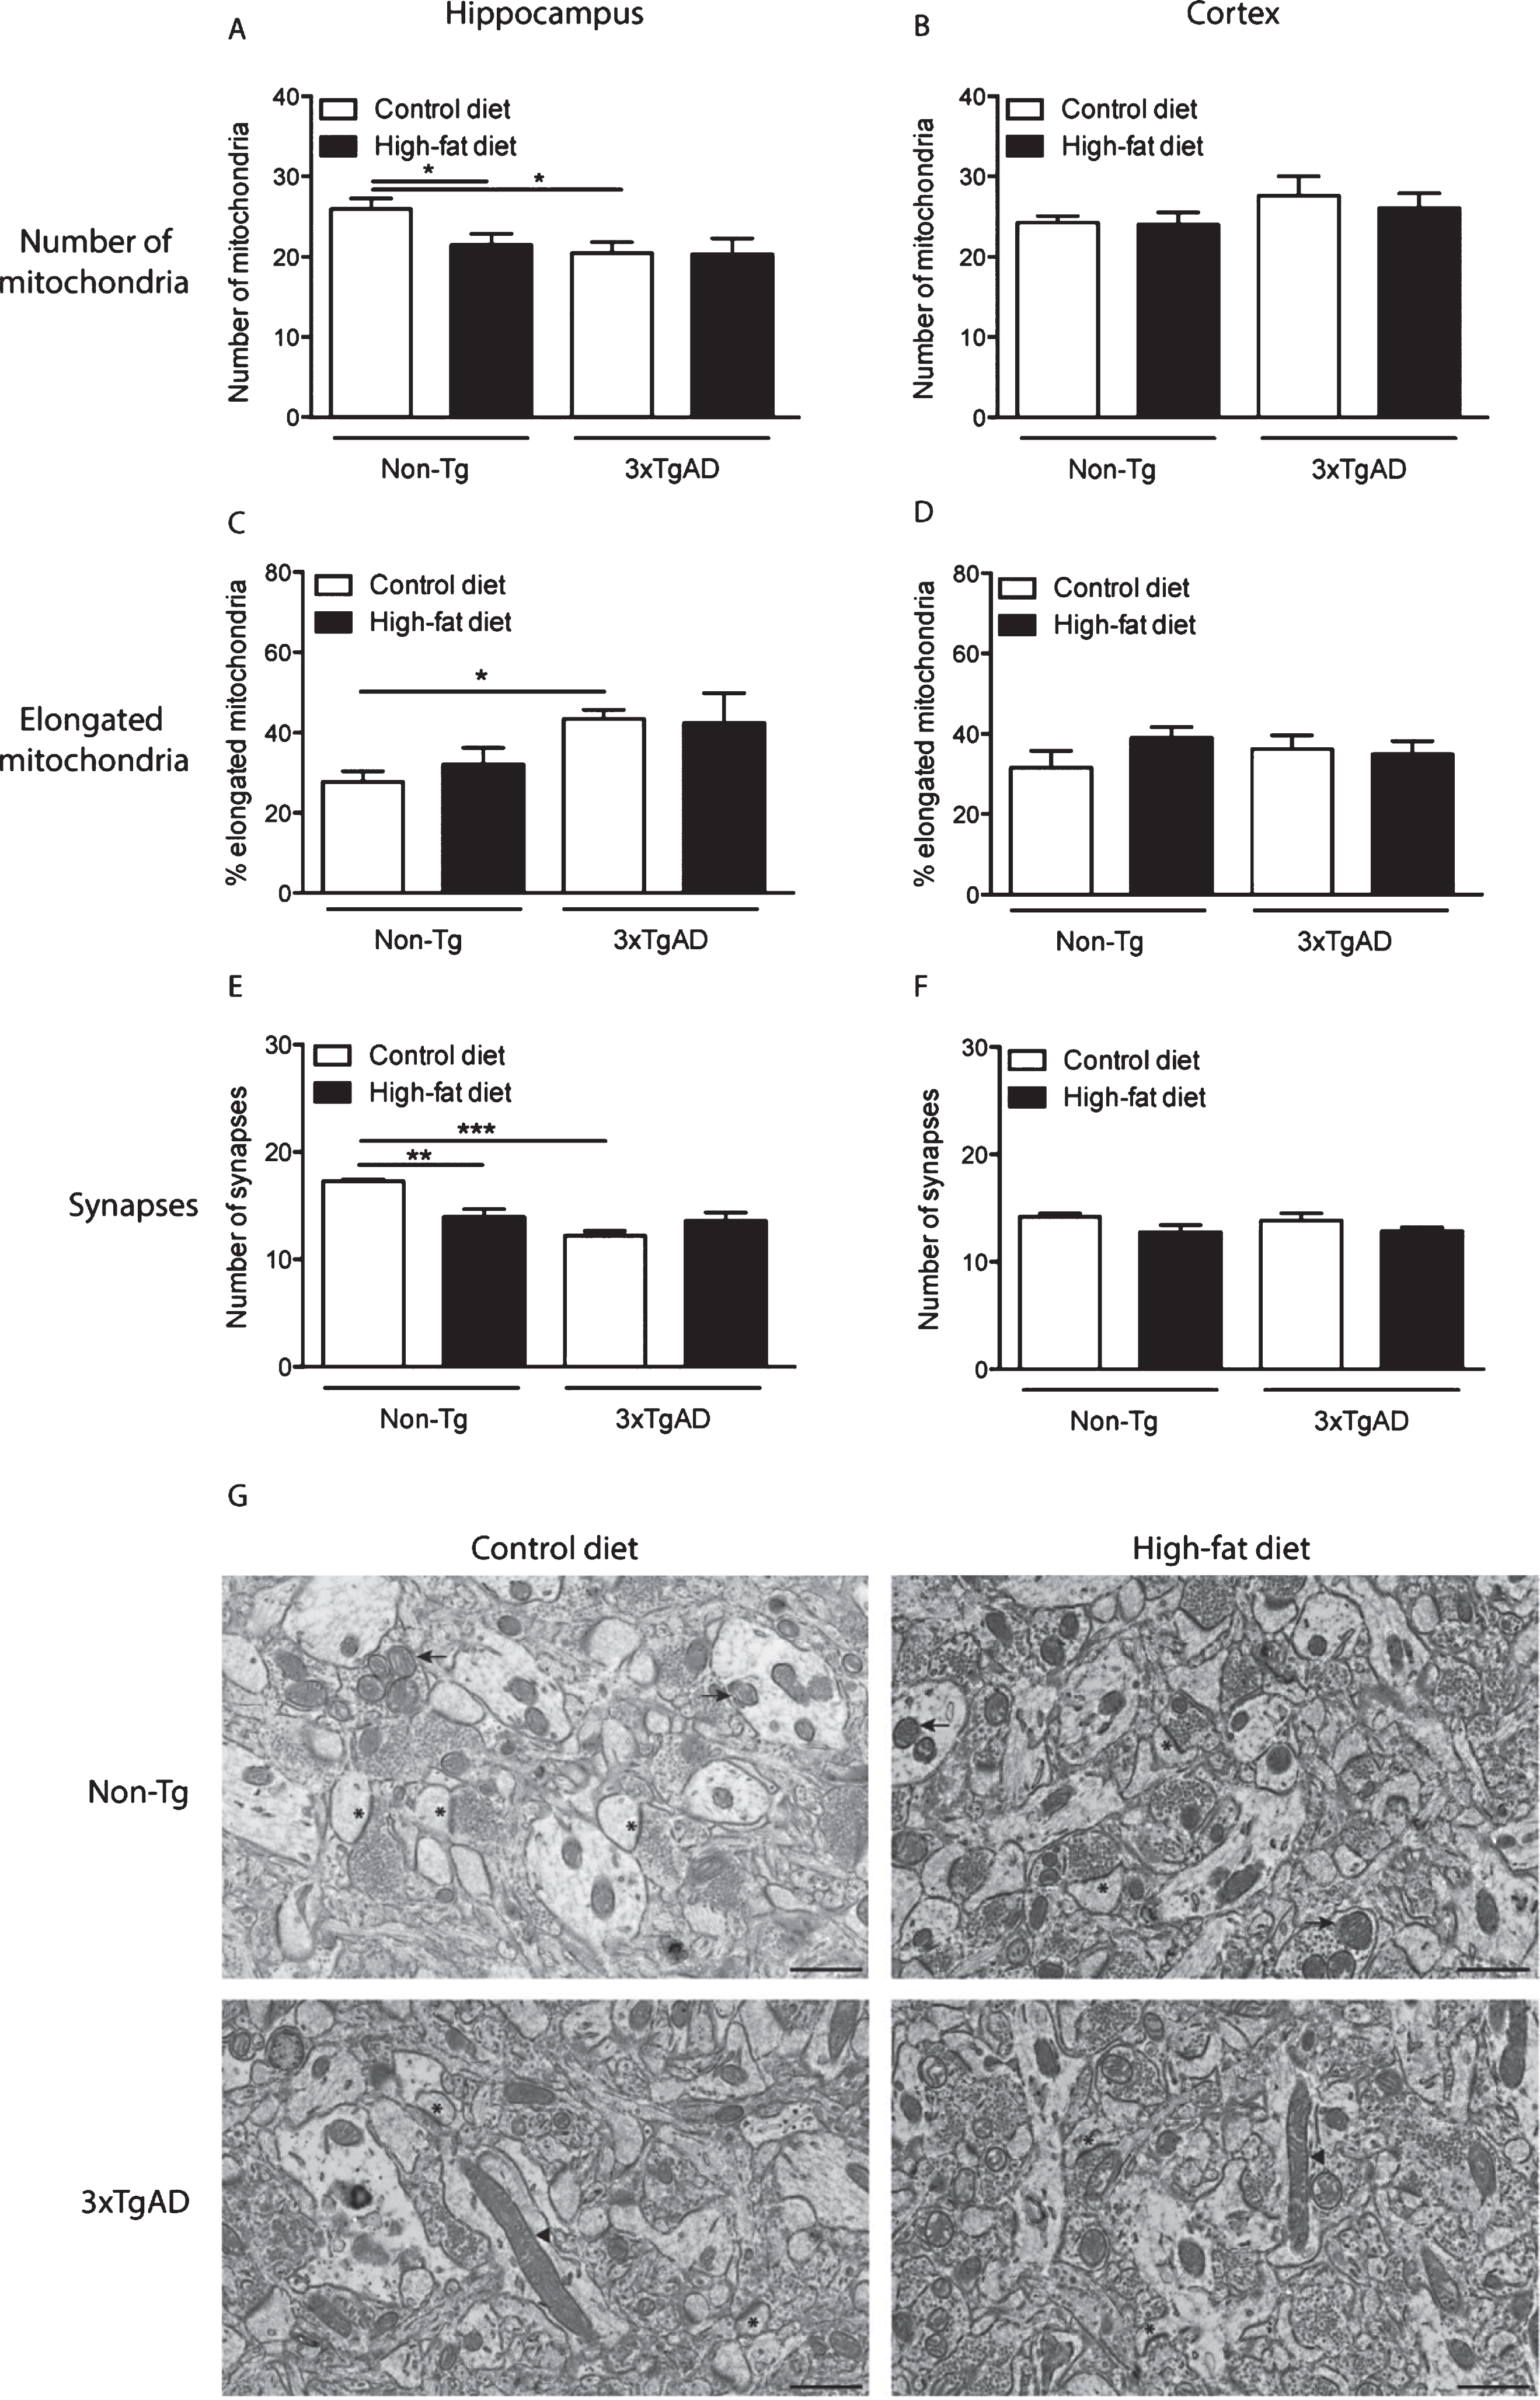
Table 1
The effect of a high-fat diet on physiological parameters in Non-Tg and 3xTgAD mice
| Female | Male | |||||||
| Non-Tg | 3xTgAD | Non-Tg | 3xTgAD | |||||
| Control | High-fat | Control | High-fat | Control | High-fat | Control | High-fat | |
| Body weight change (g) | ||||||||
| 4-month-old | 3.3±0.4 | 4.9±0.3** | 2.3±0.3# | 5.0±0.6** | 5.2±0.5 | 12.9±0.5*** | 6.9±0.4# | 9.9±0.5***/# # |
| 8-month-old | 11.0±0.7 | 27.1±1.9*** | 9.9±1.2 | 24.1±2.5** | 18.2±1.6 | 30.8±1.0*** | 11.0±2.4# | 20.5±2.3*/## |
| 14-month-old | 15.4±0.8 | 35.2±2.8*** | 12.2±1.3 | 27.3±3.2*** | 21.6±1.8 | 42.6±0.8*** | 14.3±2.5# | 31.6±2.4**/## |
| Fat (g) | ||||||||
| 4-month-old | 0.28±0.03 | 0.59±0.06* | 0.60±0.09# | 1.00±0.16**/## | 0.61±0.10 | 1.83±0.10*** | 0.48±0.03 | 1.02±0.09***/### |
| 14-month-old | 1.48±0.15 | 04.67±0.42*** | 1.14±0.22 | 4.96±0.97** | 1.56±0.09 | 1.39±0.07 | 1.05±0.22 | 3.93±0.18***/## |
| Glucose (mmol/l) | ||||||||
| 4-month-old | 7.9±0.7 | 8.2±0.4 | 9.2±0.9 | 9.2±0.9 | 8.9±0.7 | 10.1±0.4 | 9.1±0.6 | 10.7±0.6 |
| 14-month-old | 9.1±0.6 | 9.5±1.4 | 8.4±0.4 | 10.1±0.4 | 9.2±0.6 | 8.1±0.6 | 7.8±0.5 | 9.4±0.7 |
| Insulin (ng/ml) | ||||||||
| 4-month-old | 0.72±0.14 | 0.67±0.09 | 1.06±0.29 | 1.04±0.21 | 0.35±0.06 | 0.63±0.08* | 0.36±0.06 | 0.42±0.06 |
| 14-month-old | 0.36±0.06 | 0.70±0.09* | 0.28±0.05 | 0.44±0.07 | 0.71±0.12 | 0.02.10±0.35** | 0.92±0.16 | 1.27±0.31 |
| Systolic blood pressure (mmHg) | ||||||||
| 4-month-old | 111.4±7.1 | 113.2±3.8 | 104.8±3.6 | 105.4±2.4 | 112.5±3.7 | 104.2±1.9 | 111.0±3.8 | 114.0±3.8 |
| 8-month-old | 95.9±3.0 | 93.8±1.6 | 104.1±4.8 | 108.9±2.4### | 109.9±2.8 | 108.1±2.0 | 107.7±3.6 | 112.1±2.4 |
| 14-month-old | 96.3±2.3 | 96.5±3.0 | 102.4±6.1 | 97.3±3.7 | 107.0±2.5 | 112.1±2.0 | 111.0±3.6 | 112.9±2.1 |
| Heart rate (bpm) | ||||||||
| 4-month-old | 464.4±15.0 | 516.6±15.0* | 383.1±19.1## | 485.1±19.6** | 536.4±17.5 | 594.8±14.7 | 399.7±21.4### | 428.5±24.4## |
| 8-month-old | 577.3±13.4 | 612.5±13.0 | 498.9±26.2# | 553.9±35.9 | 546.6±17.8 | 597.7±21.6 | 389.4±16.7### | 472.5±24.2*/## |
| 14-month-old | 576.6±21.6 | 608.2±13.3 | 485.1±22.9# | 567.3±19.8* | 595.8±17.1 | 598.5±32.7 | 480.6±21.1# | 550.7±19.9* |
Non-Tg control and 3xTgAD mice were kept on a control or high-fat diet from 2 months of age until 4 months of age and a separate group of mice was assessed at 8 months and 14 months of age. Body weight change from baseline (before diet) was calculated and systolic blood pressure and heart rate were monitored in conscious mice. After mice were culled fat (gonadal) and blood glucose and plasma insulin were measured. Data are mean±SEM, n = 9-12/group for 4-month-old mice and n = 8-11/group for 14-month-old mice. *p < 0.05, **p < 0.01, ***p < 0.001 versus control fed mice of same genotype and sex; #p < 0.05, # #p < 0.01, # # #p < 0.001 versus Non-Tg on the same diet. Two-way ANOVA with Bonferroni post-hoc analysis.
Table 2
The effect of a high-fat diet on brain capillary structure in the hippocampus of Non-Tg and 3xTgAD mice
| Non-Tg | 3xTgAD | |||
| Control | High-fat | Control | High-fat | |
| Basal lamina thickness (nm) | 77.1±4.7 | 75.5±4.6 | 76.9±5.7 | 76.1±4.1 |
| Vessel lumen diameter (μm) | 3.2±0.4 | 3.6±0.3 | 3.4±0.3 | 3.2±0.5 |
| Vessel lumen roughness | 1.13±0.05 | 1.05±0.02 | 1.13±0.05 | 1.10±0.04 |
| Pericyte coverage (%) | 21.6±1.5 | 23.9±1.1 | 23.8±2.5 | 21.9±1.7 |
| Tight junction tortuosity | 1.15±0.04 | 1.22±0.08 | 1.34±0.09 | 1.14±0.03 |
| No. endothelial vesicles/μm of vessel wall | 4.3±0.5 | 3.6±0.5 | 4.7±0.7 | 4.8±0.8 |
Non-Tg control and 3xTgAD mice were kept on a control or high-fat diet from 2 months until 8 months of age. Capillary structure in the hippocampus was assessed by electron microscopy in 10 random capillaries/animal. Data are mean±SEM, n = 6-7/group.


