
Diverging Progression of Network Disruption and Atrophy in Alzheimer’s Disease and Semantic Dementia
Abstract
The progression of cognitive deficits in Alzheimer’s disease and semantic dementia is accompanied by grey matter atrophy and white matter deterioration. The impact of neuronal loss on the structural network connectivity in these dementia subtypes is, however, not well understood. In order to gain a more refined knowledge of the topological organization of white matter alterations in dementia, we used a network-based approach to analyze the brain’s structural connectivity network. Diffusion-weighted and anatomical MRI images of groups with eighteen Alzheimer’s disease and six semantic dementia patients, as well as twenty-one healthy controls were recorded to reconstruct individual connectivity networks. Additionally, voxel-based morphometry, using grey and white matter volume, served to relate atrophy to altered structural connectivity. The analyses showed that Alzheimer’s disease is characterized by decreased connectivity strength in various cortical regions. An overlap with grey matter loss was found only in the inferior frontal and superior temporal areas. In semantic dementia, significantly reduced network strength was found in the temporal lobes, which converged with grey and white matter atrophy. Therefore, this study demonstrated that the structural disconnection in early Alzheimer’s disease goes beyond grey matter atrophy and is independent of white matter volume loss, an observation that was not found in semantic dementia.
INTRODUCTION
Neuronal degeneration in cerebral grey matter (GM) accompanied by progressive cognitive decline has generally been designated as dementia [1]. Alzheimer’s disease (AD) is the most frequent form of dementia and is characterized by the accumulation of amyloid-β plaques and neurofibrillary tau protein tangles, which are associated with synaptic disruption and subsequent neuronal death. Classically, these biomarkers have been used to confirm the diagnosis of dementia postmortem. However, due to the increasing number of patients affected by AD and the related health care and socio-economic costs, the need for earlier diagnosis has increased and led to intense research effort towards identifying early markers and underlying mechanisms of AD [2].
Using newly available technologies, a large knowledge base has been acquired in the past couple of decades allowing earlier and more refined diagnosis [3]. For instance, it has been shown that AD is not only characterized by GM loss spreading from the hippocampal, entorhinal, and parietal brain areas, but also by white matter (WM) degeneration [4, 5]. Therefore, AD has been described as a disconnection syndrome [6, 7].
Compared to AD, semantic dementia (SD) is a far less frequently occurring subtype of dementia. Semantic dementia is described as the temporal-lobe variant of frontotemporal lobar degeneration or the fluent-type of primary progressive aphasia and has been less investigated compared to AD [8–10]. The exact mechanisms of its characteristic progression of GM and WM loss remain unclear [11].
Further, despite the extensive research on AD, the interplay of cognitive impairments, biomarkers of GM atrophy, reduced cerebrospinal fluid (CSF) amyloid-β levels, CSF-tau accumulation, and cortical hypoperfusion in AD is not fully understood. Although the combination of several biomarkers has recently led to improved predictive classification of individuals at risk of AD, the success rate needs to be further improved [12, 13]. With the aim of advancing our understanding of and ultimately achieving early diagnosis of AD, new emerging technologies are being used to investigate neuronal degeneration with approaches that go beyond, for example, behavioral symptomatology, GM atrophy, CSF parameters, and perfusion imaging. In particular, the connectome approach, based on the analysis of the structural connectivity network derived from diffusion-weighted (DWI) MRI images, has gained increasing attention. Previous studies using this approach have shown that in AD, the efficiency of communication between widely separated regions in the brain is decreased [14] and that the reduction is related to disease progression [15]. This disruption of the large-scale integrative structure is thought to affect high-level cognition mechanisms and is present, to a lesser extent, also in normal aging [16]. To our knowledge, the organizational properties of the cortical structural network, applying a graph theoretical approach, have not been studied in SD. Instead, measures of fractional anisotropy and diffusivity have shown alterations in the arcuate, uncinate, or superior and inferior longitudinal fasciculi [17–19]. The advantage of using graph theoretical analysis is that it provides information about alterations of WM connectivity, taking into account all brain areas of a given atlas. Hence, each brain region (i.e., node) is part of an entire network, while with fractional anisotropy and diffusivity, merely local alterations of WM connectivity are commonly reported.
In the current study, we used DWI and graph theory methods to investigate the organization of the structural connectome in AD and SD patients and compared the results to those of healthy controls (HC). Our analysis offers the first insight into the topology of the brain’s structural network in SD patients. Accordingly, no predictions of the outcome of the SD group were possible, due to a lack of preexisting findings. Moreover, the inclusion of the three participant groups allowed us to replicate previous findings on changes in global network metrics among AD patients and to verify the peculiarity of these changes in this dementia subtype. Thus, the AD group was expected to show a reduction in global efficiency as well as strength, while the characteristic path length was anticipated to be increased [14, 20, 21].
The investigation of global metrics was extended by testing for differences in local connectivity strength. Compared to previous studies, this analysis benefited from an increased resolution of the structural atlas, which allowed the detection of more refined patterns of connectivity alterations in patients. Since no previous study applied the same atlas to the same patient groups, more exact predictions— in addition to changes in the frontal, parietal, temporal, and occipital lobes in AD— were not possible [4, 21, 22]. Finally, novel insights were gained regarding the relationship of changes in connectivity and atrophy. In other words, the present study revealed for the first time the overlap of changes in GM and WM volumes together with measures of structural network connectivity alterations.
MATERIALS AND METHODS
Participants and MRI image acquisition
A total of 45 participants (21 HC, 18 AD, and 6 SD) were included in this study (Table 1). In a recent study, part of this sample’s anatomical MRI data had been published [23]. As can be seen in Table 1, the SD group consisted of only 6 patients. Low prevalence and patients’ lack of sufficient cognitive abilities to understand the study procedure were the main reasons for this limited sample size. Patients with AD were recruited during their treatment at the Memory Clinic of the Geriatric Department at Karolinska University Hospital in Huddinge, Sweden. Expert clinicians diagnosed the patients in accordance with criteria of the International Classification of Diseases (10th Revision). The standard clinical assessment included blood sample analyses, structural neuroimaging examinations, lumbar puncture, as well as neuropsychological testing.Furthermore, patients with AD were excluded in case of severe WM damage. Patients with SD were diagnosed according to the Neary criteria and were recruited from throughout Sweden [24]. Patients from both groups were only included if the Global Deterioration Scale was below 6 (i.e., moderate dementia or milder) and the Cornell Depression Scale was below 8. Healthy controls were recruited by advertisement. All participants had Swedish as native tongue and had normal or corrected to normal vision. Additionally, healthy participants and patients were excluded from the study if they suffered from any other medical or psychiatric diseases than their diagnosed dementia (e.g., previous neurological incidents, depression), took drug affecting the nervous system, or had magnetic implants such as pacemaker. Written informed consent was provided by all participants. The study complied with the Declaration of Helsinki and was approved by the Regional Ethics Committee of Stockholm, Sweden.
MRI scans were recorded on a 3 Tesla Siemens Magnetom Trio MR Scanner (Siemens AG, Erlangen, Germany). Anatomical T1-weighted images were obtained using a magnetization-prepared rapid acquisition gradient-echo (MPRAGE) sequence, which acquired 176 sagittal slices with an image resolution of 0.9×0.9×1.0 mm (TR = 1900 ms, TE = 2.57 ms, TI = 900 ms, flip angle = 9°, slice thickness = 1.0 mm; FOV = 230×230 mm2; matrix = 256×256, TA = 4:26 min). Diffusion-weighted images were acquired based on a spin-echo (SE-) echo-planar imaging (EPI) protocol with two 180° radio frequency (RF) pulses (TR = 5300 ms, TE = 91 ms, voxel size = 2.0×2.0×3.6 mm, matrix = 116×116, fieldof view = 232×232 mm2, 42 slices, slice thickness = 3.0 mm, gap thickness = 0.6 mm, pixel bandwidth = 1,658 Hz/pixel). Diffusion-sensitizing gradients were applied at a maximal b-value of 1,000 s/mm2 along 30 non-collinear directions, and an additional image was acquired with b-value = 0 s/mm2. Two repetitions were measured and averaged for the analysis.
Assessment of grey and white matter atrophy
To assess volume differences of GM and WM in the AD and SD groups, a voxel-based morphometry (VBM) was conducted. The Diffeomorphic Anatomical Registration through the Exponentiated Lie algebra toolbox was used for coregistration of the T1-weighted images to the normalized Montreal Neurological Institute template [25]. After normalization, the images were segmented into GM, WM, and CSF. The images were modulated in order to maintain the volumetric information in each voxel. Smoothing was performed using an 8-mm Gaussian kernel.
Structural connectivity assessment
Diffusion-weighted imaging is a noninvasive technique that can be used to derive WM microstructural properties and, in particular, to monitor WM deterioration [26–28]. Diffusion-weighted imaging also offers the opportunity to assess local WM tissue orientation, and this feature is exploited in tractography algorithms to reconstruct WM pathways that connect different brain regions [29, 30]. The combined analysis of high-resolution T1-weighted images and DWI allows in vivo mapping of the macro-scale architecture of cortical connectivity in the framework of networks. The anatomical map of connections is also denoted as the “connectome” [31, 32], and scalar metrics derived from computational network analysis can be used to quantitatively characterize its organization and were recently found to be useful in detecting alterations in diseased populations [16].
A network is given by a set of nodes connected by edges that can be undirected or directed and weighted or unweighted. It can be represented by the adjacency matrix A, in which each column/row is associated with a node, and the element Aij >0, if there exists an edge between node i and node j. In our analysis, the weighted individual networks representing brain structural connectivity were constructed as follows:
1. The automated parcellation of the T1-weighted images was performed in FreeSurfer (Athinoula A. Martinos Center for Biomedical Imaging, Harvard-MIT, Boston [http://surfer.nmr.mgh.harvard.edu]). The Destrieux atlas was used giving 148 cortical structures that were then used as regions of interest for fiber tracking [33]. Labels and names of the regions of interest can be found in Supplementary Table 1. Subsequently, T1-weighted images were co-registered to the first b0 image by means of the between modality coregistration methodology using information theory, and finally re-sampled to the b0 images space. The T1-b0 transformation was also applied to atlas image using nearest neighbor interpolation. The Normalized Mutual Information cost function was employed to estimate a 12-parameter (degree of freedom) affine transformation matrix to transform voxels from MRI to b0 space. SPM5 tools were used to perform non-linear registration.
2. Data from the two consecutive diffusion-weighted imaging sequences were concatenated. Motion and eddy currents correction of diffusion-weighted images was performed in the Functional Magnetic Resonance Imaging of the Brain FMRIB software library version 5.0 (FSL, [http://www.fmrib.ox.ac.uk/fsl], [34]). Probabilistic fiber tracking was performed in FSL according to Behrens, Woolrich et al. [35]. A separate connectivity map was created for each region of interest with seeds in each voxel of the region. Tracking parameters used were 5000 generated paths from each seed point, 0.5 mm step size, 500 mm maximum trace length and±80 degrees curvature threshold.
3. A network is given by a set of nodes connected by edges that can be undirected or directed, weighted or unweighted. It can be represented by the adjacency matrix A in which each column/row is associated to a node and the element Aij >0, if there exists an edge between node i and node j. The weighted individual networks representing brain structural connectivity were constructed as follows:
1) Each region of interest was a node.
2) An undirected edge aij between nodes i and j was established if the sum of the connectivity values between voxels of nodes i and j (or vice versa) was higher than the connectivity threshold.
3) Two weighting schemes were used. For the anatomical connectivity number (ACN) scheme a weight w(aij) equal to the total number of reconstructed fibers between region i and region j was assigned to each edge [36], while for the anatomical connectivity density (ACD) scheme an additional correction for the size of the nodes was applied.
Network metrics
In this section, the network metrics considered in our analysis are defined: degree, strength, clustering coefficient, characteristic path length, and efficiency. We denote W as the weighted adjacency matrix of the network and A as the binary connectivity matrix. In general, the notation w is used to indicate weighted network metrics (i.e., metrics computed using W). Properties characterizing the whole network organization are denoted as global, while local properties are specific for each node. The detailed definition used can be found in the Supplementary Methods and further interpretations can be found in Rubinov and Sporns [37].
Convergence of local connectivity changes and atrophy
With the aim of investigating to what extent connectivity alterations overlap with neuronal atrophy, an average atlas over all participants was created to merge the results of GM volume and local connectivity strength. First, all individual T1-weighted images were co-registered to the normalized Montreal Neurological Institute template in SPM8, and the same transformation was used for the individual atlases. Then, each voxel of the normalized space was associated with the most common label occurring across all the participants at that location. The statistical image containing all significant voxels of the VBM analysis (family-wise error corrected at p < 0.05) was overlapped to the average atlas obtained in order to determine regions affected by atrophy. More specifically, a region of interest was considered altered by atrophy if at least 1% of its volume, or more than 50 voxels, were included in the difference map.
Software description and statistical analysis
The preprocessing of the VBM with the T1-weighted images was run using the VBM8 toolbox (http://dbm.neuro.uni-jena.de/vbm) integrated in SPM8 (http://www.fil.ion.ucl.ac.uk/spm). For statistical VBM analysis, SnPM (version 13.1.03; http://warwick.ac.uk/snpm) was used in order to account for the relatively small sample sizes. To compute statistical images, six non-parametric regressions (three for GM and three for WM), with 5,000 permutations per test, were performed. Variance smoothing with 8-mm FWHM was applied, producing so-called pseudo T-values. In particular, masked (GM and WM, respectively) whole-brain images were fed into the regressions, and the statistical inference was performed at voxel-level with a family-wise error rate correction of p < 0.05. Age, gender, MMSE score, and the intracranial volume were included as variables of no interest to minimize possible confounding effects. Results of interest were the (pseudo-) T-statistics between HC and patients with AD as well as between HC and SD patients, yielding GM or WM volume reductions in the patient groups.
Graph metrics were computed using the Morpho-Connect toolbox [38] and subroutines of the BrainConnectivity toolbox (https://sites.google.com/site/bctnet/). For visualization of the lesions in the brain networks, BrainNet Viewer was used (http://www.nitrc.org/projects/bnv/, [39]). Global network metrics were compared using t-tests and a linear regression that included age and sex as covariates. For the analysis of local network metrics, non-parametric randomization tests were used including false discovery rate correction for multiple testing [40].
To analyze demographics and neuropsychological assessments, the non-parametric Kruskal-Wallis test in the SPSS software (version 23, IBM Corp., Armonk, NY, USA) was used. Post-hoc tests were performed using the non-parametric Mann-Whitney U-test. Likewise, the relationship between the global network metrics and the neuropsychological test scores was investigated with the non-parametric Spearman correlation coefficient. For all analyses, the corrected significance threshold was set at p < 0.05.
RESULTS
Demographics and neuropsychological assessment
Table 1 provides mean values and standard deviation as well as group statistics of the available demographic information and the neuropsychological assessment conducted with the participants. The non-parametric Kruskal-Wallis test did not yield any group differences of age, gender, total intracranial volume, or years of education. In contrast, all four neuropsychological assessments showed significant group differences. Post-hoc analysis confirmed that AD and SD patients had lower scores than HC in all tests (HC – AD: MMSE, U = 29, p < 0.001; BNT, U = 57, p < 0.001; AF, U = 35, p < 0.001; VF, U = 35, p < 0.001; HC – SD: MMSE, U = 1, p < 0.001; BNT, U = 0, p < 0.001; AF, U = 0, p < 0.001, VF, U = 9, p < 0.001). The two patient groups differed only in the BNT and AF (AD – SD: BNT, U = 0, p < 0.001; AF, U = 5, p < 0.01).
Neuronal atrophy
For this study, T-contrasts between HC and AD patients, as well as between HC and SD patients, were used to identify brain regions with significant GM and WM volume reductions. Therefore, results of six separate non-parametric voxel-wise volume comparisons are reported. Grey matter atrophy was found in the AD group, most extensively in the hippocampi and parahippocampal gyri of both hemispheres (Fig. 1). Additional areas with reduced volume were found in the right superior frontal sulcus as well as the right inferior precentral sulcus. Other affected clusters included the right superior temporal lobe and temporal pole (Supplementary Table 2). In the SD group, two large clusters were detected bilaterally, both spreading over the inferior and middle temporal lobe, temporal pole, parahippocampal gyrus, fusiform gyrus, and insula (Supplementary Table 2). There was a hemispherical asymmetry towards the left with an approximately 20% higher amount of significant voxels (Fig. 1). In Supplementary Table 2, GM differences between AD and SD are listed, showing lower volume in SD mainly in temporal lobes, accentuated in the left hemisphere. Focusing on the WM volumes, the AD group did not show any reduction in comparison with the HC group. In contrast, WM atrophy was found in SD (HC - SD) in the right temporal lobe (# of voxels = 494, pseudo-T = 7.74, p < 0.001). The comparison between the two patient groups (AD - SD) showed two clusters, one in the left temporal lobe (# of voxels = 148, pseudo-T = 6.76, p < 0.01), and the other in the right temporal lobe (# of voxels = 24, pseudo-T = 5.89, p < 0.05).
Structural connectivity alterations
Global network metrics were compared among the three groups. The ACN weighting scheme revealed that most of the metrics highlighted significant differences between HC and patients with AD as well as between HC and SD patients, and these differences were stable across different thresholds (Fig. 2 and Supplementary Tables 3 and 4). The metrics showing the most pronounced differences were density, efficiency, and characteristic path length. When the ACD weighting scheme was applied, the effects for density, efficiency, and characteristic path length persisted to a reduced extent (Supplementary Table 5). These effects remained significant after correction for age and sex (Supplementary Table 3). In summary, both patient groups showed a reduction in network density combined with a loss of integration in the network. No significant differences of global network metrics were found between the AD and SD group.
The local network strength was compared over all nodes for the anatomical connectivity number weighting scheme. In order to reduce the number of comparisons, only the regions that showed significance for the ACN weighting scheme were tested for the ACD networks. Consistent with the results of the global network metrics, ACD results showed a loss of strength in different nodes. Changes in the SD group are more focused in the temporal lobe, while changes in the AD group are more distributed. Differences of network strength between AD and SD could be localized mainly in left temporal nodes. The complete list of significant nodes for the ACN networks is reported in Supplementary Table 6. The analysis of the ACD networks showed a reduction in the number of significant changes. In particular, for SD patients, only a few nodes of the temporal lobe showed significant changes, while for AD patients, significant changes persisted in some parietal and frontal regions (Supplementary Table 7). The only node that differed between AD and SD was found in the left polar plane of the superior temporal gyrus.
Relation of global metrics and cognitive scores
The Spearman’s rank correlation revealed moderate yet significant correlations of global metrics with the four neuropsychological test results included in the analysis. Table 2 lists all significant correlation indices and p values.
Convergence of abnormal connectivity with neuronal atrophy
Figure 3 shows the overlap of atrophy and the strength of altered cortical connectivity in the patient groups. For AD patients compared with HC, changes in connectivity strength were largely distributed also in regions distant to the focus of atrophy. Only a few regions showed a reduction in both GM volume and connectivity strength: two nodes of the right frontal gyrus, and one in the left temporal superior sulcus, and left angular parietal gyrus. When SD was compared with HC, a larger overlap of changes in connectivity and atrophy was found. Moreover, additional changes in connectivity appeared to be spatially close to the focus of the atrophy in the temporal lobe. The comparison between AD and SD revealed lower connectivity strength in SD merely in nodes of the left anterior temporal lobe that showed also a more severe atrophy than AD. Note that, due to the larger variability in the definition of the sub-cortical regions [41], only cortical regions are included in the network and therefore, the hippocampus and amygdala regions are not shown in Fig. 3, although they did exhibit atrophy.
DISCUSSION
By measuring the regional brain volume of GM and WM as well as structural connectivity concomitantly in the same study participants, the present study identified a specific pattern of atrophy and changes in structural connectivity strength among AD and SD patients. The following are the key results. First, local network disruption in AD extended beyond the atrophied brain regions. Second, WM volume was not decreased in the early AD group and did not appear to be related to WM disruption. Third, reduced network strength in patients with SD was localized proximate to GM and WM atrophy, all found mainly in the temporal lobes. Fourth, the global network metrics were correlated with neuropsychological test scores on the Mini-Mental State Examination and assessments of word fluency.
Neuronal atrophy analysis
In order to shed light on the particular course of WM disconnection and neuronal degeneration in dementia, the stage of the disease should be considered. In a longitudinal study, McDonald et al. [42] found that atrophy rates in patients with prodromal and early AD vary substantially and depend on the cortical region and the severity of the impairment.
Furthermore, there is evidence that medial temporal atrophy occurs before the clinical diagnosis of AD [43]. During the early stage of AD, accelerated atrophy can be localized in the temporal, frontal, cingulate, and occipital regions [42]. Thus, we compared these findings to GM loss in the patients with AD in our current study and observed an atrophy pattern that clearly matched the classification of an early stage of AD. In particular, the core of GM volume reduction was found in both anterior medial temporal lobes involving the hippocampus and parahippocampus. Additional areas (e.g., middle and inferior frontal regions as well as the left angular and cingulate gyrus) exhibited reduced volume. For the SD group, the localization pattern of the GM volume loss can be clearly distinguished from the one of the AD group, a finding that replicates previous reports [44, 45]. Clearly, neuronal atrophy was found to spread from the temporal poles over the lateral and medial temporal regions bilaterally toward the fusiform gyri, with a lateralization to the left. In addition, the insular areas were affected in the patients with SD. In other words, while GM atrophy was more locally restricted to the temporal lobes in SD, patients with AD showed a more extended distribution of volume reduction over the cortex. Hence, our GM volumetric analysis results are comparable to those published previously [46–49].
Since AD is characterized as a disconnection syndrome, it would be expected to show WM atrophy, especially proximate to hippocampal or entorhinal areas as a recent review article suggested [6]. This was, however, not the case in our AD group. One very probable reason for this outcome is the early disease stage, as mentioned earlier. Accordingly, the neuronal degeneration would have not affected WM volume yet, but WM connectivity certainly was affected. Another possible reason could be WM volume reductions in these brain regions in healthy older adults, depending on their risk of converting to AD, as observed by Stoub et al. [50]. This measure was not available for the HC group in our study, and, there is a possibility that reduced WM volume in the temporal lobes in the HC group might have obscured such findings in our AD group. Nevertheless, our analysis showed that the AD group did not exhibit progressive WM degeneration compared to the HC group. Then again, this was the case for the SD group, who showed WM volume reductions in the right temporal lobe.
Connectivity analysis
Our analysis of global cortical network metrics revealed a common pattern for AD and SD patients; there was a loss of density and efficiency, together with an increase in the characteristic path length. An additional correction for age and sex was included in our analysis to ensure that these changes were not due to group differences in age and sex, which could have had a confounding effect [51]. The results on the AD network organization are consistent with the literature on the topic [14, 15, 20]. Previously, this combination of changes has been associated with a loss of integration in the network and reduced efficiency in communication between distant regions. Such a disruption of long-range connections is thought to underlie the high-level cognitive impairments seen in AD patients [16].
The consistency of these results across different studies, including also studies quantifying the structural connectivity assessed with cortical thickness, indicates that the global network metrics may be a valuable biomarker of dementia in the future. Two results support this possibility. On the one hand, we showed moderate yet significant correlations between neuropsychological test scores and several network metrics. A similar result was found previously among patients with mild cognitive impairment, using the Mini-Mental State Examination score, which indicates that this correlation of network topology with functional outcome can be also detected at early stages of cognitive decline [52]. On the other hand, Daianu et al. [15] showed that the changes in the network density, efficiency, and path length increase together with disease progression. Together, the results of the global network metrics analysis highlight the link between disease severity and the network organization.
However, while the differences between HC and patients were clear, as well as consistent with previous studies, no significant difference was found in the direct comparison of the global network metrics between the two dementia subtypes. This suggests that to gain insight into the underlying mechanisms and identify a biomarker specific to each dementia subtype, it is necessary to investigate the local pattern of changes in the network organization. Indeed, the analysis of the local network strength showed two different patterns for AD and SD.
On the one hand, in the AD group, distributed changes were observed, indicating a connectivity loss in a large number of regions in the frontal, occipital, parietal, and temporal cortex. This pattern reflects a relatively global loss of connectivity strength that does not appear to be strictly related to the pattern of GM atrophy. Previous DWI studies on AD patients identified a disruption of WM specifically in tracts like the corpus callosum, superior and inferior longitudinal fasciculus, and cingulum bundle [4, 22]. These large bundles connect the occipital, frontal, parietal, and temporal lobes as well as the parahippocampal and cingulate regions, hence making these results consistent with the widespread loss of connectivity in our study. Additionally, Daianu et al. [21] tested the local degree of a selection of regions of the network core and demonstrated a significant loss of connections in several regions of the frontal, temporal, and parietal lobe.
On the other hand, the pattern of changes in the SD group largely overlapped the atrophied regions of GM. Specifically, reduced connectivity strength was found in a large number of temporal regions in the circular insular cortex as well as in the parahippocampal gyrus. Overall, the analysis of local connectivity strength provided a major outcome that may be useful for future studies: our analysis of local network metrics adds specificity to distinguish between the different dementia subtypes. In this matter, it would be interesting to combine different network metrics in a classification algorithm to detect regions and indices that are more sensitive to the specificity of each subtype. In addition, our results suggest that it is possible to select a subset of regions to further explore the differences between the two dementia subtypes (e.g., left anterior temporal lobe); future studies should provide more detailed descriptions of the connections that allow detection of thechanges.
Local convergence of connectivity and GM loss
One of the aims of our paper was to shed light on the relationship between the loss of GM and WM and structural connectivity changes. The observation was that the connectivity analysis obtains additional information compared to that provided by the WM volume analysis. That is, only SD patients showed a local reduction in WM volume in the temporal lobe, while wider connectivity changes were found in both SD and AD patient populations. A possible explanation may be a higher sensitivity of diffusion analyses, compared to structural MRI, for detecting changes in WM integrity [53].
In our analysis, the focus was mostly set on the cortical regions and hence on the GM volume loss. The alteration patterns in local connectivity strength appeared to be different not only in terms of the regions affected, but also in the proximity and overlap with the GM atrophied regions. As mentioned before, in AD alterations of connectivity strength were spread over regions distant from the focus of atrophy, while in SD, the connectivity changes appeared to be more strictly related to the GM loss.
A critical point in the analysis of brain structural networks is the selection of the connection weights (see also limitations section). In our study, we selected the streamline count, and it can be argued that this particular weight may be affected by the volume of the regions [54]. Therefore, we also performed the analysis with a correction for the region of interest size (see Supplementary Methods). This correction should have the effect of reducing differences due to GM volume between the two groups. The results with the modified weighting scheme showed that changes were reduced, especially for AD, but persisted in a number of regions. Hence, this additional analysis supports the hypothesis that changes in connectivity are not a mere consequence of GM atrophy. Previous studies found that, especially in the early stages of AD, WM disruption can have a course partially independent from GM atrophy, while, at a later stage, more congruence is found between GM atrophy and WM disruption [4, 55]. Because our patients showed a pattern of atrophy consistent with an early stage of AD, it is possible that the regions showing lower connectivity will be affected by atrophy at a later stage.
Limitations
There are some methodological limitations to the current work related to the general framework of connectome analyses. In the literature, criticism of the analysis of brain structural networks mostly relates to two major points: the capability of current tractography methods to reliably reconstruct the network and the difficulty of defining a meaningful weight for the connections [56, 57]. In our analysis, we decided to construct the networks using methods that are commonly used in the literature, and, in order to verify the robustness of our results, we repeated the analyses for different connectivity thresholds and two weighting schemes. Nonetheless, both weighting schemes that we investigated were related to the number of reconstructed streamlines in tractography. This number is only indirectly related to axon density, myelination, and conduction velocity, and this should be kept in mind in the interpretation of the connection strength used in our analysis. The recent development of more complex diffusion models or the use of multimodal approaches will allow more meaningful measures of axonal density in future studies[58–60].
Finally, the size of our SD group was relatively small, and this limited the statistical power of our analyses. Consequentially, the significant effects of the SD group might have been overestimated and need replication by an independent, ideally larger sample of patients with SD. Nonetheless, the consistency between the connectivity results, the atrophy, and the symptomatology suggested that the results are valuable for further studies.
CONCLUSION
The finding that the patients with AD had aberrant connectivity spread over the cortex matched the observation that they showed several cognitive deficits in, for example, episodic memory, semantic memory, executive functions, and attention. On the other hand, the reduced connectivity strength in the SD group was restricted to their temporal lobes. This finding could be related to the symptomatology of SD, which exclusively affects semantic memory, commonly characterized as a temporal lobe function. Therefore, one can assume that the course of SD is not comparable to that of AD, and this study demonstrates that the progression of SD is determined not only by GM atrophy localization and distinct symptomatology, but also by the topology of the structural network. Moreover, our approach of relating structural connectivity alterations to neuronal atrophy helped contribute crucial insights as to the course of AD, which must be considered in future studies. In general, this study supports the hypothesis that AD can be characterized as a disconnection syndrome, and shows that it involves more than GM or WM atrophy and affects WM structural integrity as well.
ACKNOWLEDGMENTS
The authors thank Raffaella Crinelli for her contribution during data acquisition and Lester Melie-Garcia for his contribution in creation of the connectivity analysis pipeline. This study was supported by the Swedish Alzheimerfonden and the Swiss Synapsis Foundation.
Authors’ disclosures available online (http://j-alz.com/manuscript-disclosures/16-0571r2).
Appendices
The supplementary material is available in the electronic version of this article: http://dx.doi.org/10.3233/JAD-160571.
REFERENCES
[1] | McConathy J , Sheline YI ((2015) ) Imaging biomarkers associated with cognitive decline: A review. Biol Psychiatry 77: , 685–692. |
[2] | Brookmeyer R , Johnson E , Ziegler-Graham K , Arrighi HM ((2007) ) Forecasting the global burden of Alzheimer’s disease. Alzheimers Dement 3: , 186–191. |
[3] | McKhann GM , Knopman DS , Chertkow H , Hyman BT , Jack CR Jr , Kawas CH , Klunk WE , Koroshetz WJ , Manly JJ , Mayeux R , Mohs RC , Morris JC , Rossor MN , Scheltens P , Carrillo MC , Thies B , Weintraub S , Phelps CH ((2011) ) The diagnosis of dementia due to Alzheimer’s disease: Recommendations from the National Institute on Aging-Alzheimer’s Association workgroups on diagnostic guidelines for Alzheimer’s disease. Alzheimers Dement 7: , 263–269. |
[4] | Agosta F , Pievani M , Sala S , Geroldi C , Galluzzi S , Frisoni GB , Filippi M ((2011) ) White matter damage in Alzheimer disease and its relationship to gray matter atrophy. Radiology 258: , 853–863. |
[5] | Acosta-Cabronero J , Williams GB , Pengas G , Nestor PJ ((2010) ) Absolute diffusivities define the landscape of white matter degeneration in Alzheimer’s disease. Brain 133: , 529–539. |
[6] | Li JP , Pan PL , Huang R , Shang HF ((2012) ) A meta-analysis of voxel-based morphometry studies of white matter volume alterations in Alzheimer’s disease. Neurosci Biobehav Rev 36: , 757–763. |
[7] | Villain N , Fouquet M , Baron JC , Mezenge F , Landeau B , de La Sayette V , Viader F , Eustache F , Desgranges B , Chetelat G ((2010) ) Sequential relationships between grey matter and white matter atrophy and brain metabolic abnormalities in early Alzheimer’s disease. Brain 133: , 3301–3314. |
[8] | Hodges JR ((2001) ) Frontotemporal dementia (Pick’s disease): Clinical features and assessment. Neurology 56: , S6–S10. |
[9] | Gorno-Tempini ML , Hillis AE , Weintraub S , Kertesz A , Mendez M , Cappa SF , Ogar JM , Rohrer JD , Black S , Boeve BF , Manes F , Dronkers NF , Vandenberghe R , Rascovsky K , Patterson K , Miller BL , Knopman DS , Hodges JR , Mesulam MM , Grossman M ((2011) ) Classification of primary progressive aphasia and its variants. Neurology 76: , 1006–1014. |
[10] | Adlam AL , Patterson K , Rogers TT , Nestor PJ , Salmond CH , Acosta-Cabronero J , Hodges JR ((2006) ) Semantic dementia and fluent primary progressive aphasia: Two sides of the same coin? Brain 129: , 3066–3080. |
[11] | Agosta F , Scola E , Canu E , Marcone A , Magnani G , Sarro L , Copetti M , Caso F , Cerami C , Comi G , Cappa SF , Falini A , Filippi M ((2012) ) White matter damage in frontotemporal lobar degeneration spectrum. Cereb Cortex 22: , 2705–2714. |
[12] | Vos SJ , Verhey F , Frolich L , Kornhuber J , Wiltfang J , Maier W , Peters O , Ruther E , Nobili F , Morbelli S , Frisoni GB , Drzezga A , Didic M , van Berckel BN , Simmons A , Soininen H , Kloszewska I , Mecocci P , Tsolaki M , Vellas B , Lovestone S , Muscio C , Herukka SK , Salmon E , Bastin C , Wallin A , Nordlund A , de Mendonca A , Silva D , Santana I , Lemos R , Engelborghs S , Van der Mussele S , Alzheimer’s Disease Neuroimaging Initiative, Freund-Levi Y , Wallin AK , Hampel H , van der Flier W , Scheltens P , Visser PJ ((2015) ) Prevalence and prognosis of Alzheimer’s disease at the mild cognitive impairment stage. Brain 138: , 1327–1338. |
[13] | Schott JM , Petersen RC ((2015) ) New criteria for Alzheimer’s disease: Which, when and why? Brain 138: , 1134–1137. |
[14] | Lo CY , Wang PN , Chou KH , Wang J , He Y , Lin CP ((2010) ) Diffusion tensor tractography reveals abnormal topological organization in structural cortical networks in Alzheimer’s disease. J Neurosci 30: , 16876–16885. |
[15] | Daianu M , Jahanshad N , Nir TM , Toga AW , Jack CR Jr , Weiner MW , Thompson PM , Alzheimer’s Disease Neuroimaging Initiative ((2013) ) Breakdown of brain connectivity between normal aging and Alzheimer’s disease: A structural k-core network analysis. Brain Connect 3: , 407–422. |
[16] | Griffa A , Baumann PS , Thiran JP , Hagmann P ((2013) ) Structural connectomics in brain diseases. Neuroimage 80: , 515–526. |
[17] | Agosta F , Henry RG , Migliaccio R , Neuhaus J , Miller BL , Dronkers NF , Brambati SM , Filippi M , Ogar JM , Wilson SM , Gorno-Tempini ML ((2010) ) Language networks in semantic dementia. Brain 133: , 286–299. |
[18] | Galantucci S , Tartaglia MC , Wilson SM , Henry ML , Filippi M , Agosta F , Dronkers NF , Henry RG , Ogar JM , Miller BL , Gorno-Tempini ML ((2011) ) White matter damage in primary progressive aphasias: A diffusion tensor tractography study. Brain 134: , 3011–3029. |
[19] | Mahoney CJ , Malone IB , Ridgway GR , Buckley AH , Downey LE , Golden HL , Ryan NS , Ourselin S , Schott JM , Rossor MN , Fox NC , Warren JD ((2013) ) White matter tract signatures of the progressive aphasias. Neurobiol Aging 34: , 1687–1699. |
[20] | Yao Z , Zhang Y , Lin L , Zhou Y , Xu C , Jiang T ((2010) ) Abnormal cortical networks in mild cognitive impairment and Alzheimer’s disease. PLoS Comput Biol 6: , e1001006. |
[21] | Daianu M , Dennis EL , Jahanshad N , Nir TM , Toga AW , Jack CR Jr , Weiner MW , Thompson PM , the Alzheimer’s Disease Neuroimaging Initiative ((2013) ) Alzheimer’s disease disrupts rich club organization in brain connectivity networks. Proc IEEE Int Symp Biomed Imaging 2013: , 266–269. |
[22] | Xie T , He Y ((2011) ) Mapping the Alzheimer’s brain with connectomics. Front Psychiatry 2: , 77. |
[23] | Grieder M , Crinelli RM , Jann K , Federspiel A , Wirth M , Koenig T , Stein M , Wahlund LO , Dierks T ((2013) ) Correlation between topographic N400 anomalies and reduced cerebral blood flow in the anterior temporal lobes of patients with dementia. J Alzheimers Dis 36: , 711–731. |
[24] | Neary D , Snowden JS , Gustafson L , Passant U , Stuss D , Black S , Freedman M , Kertesz A , Robert PH , Albert M , Boone K , Miller BL , Cummings J , Benson DF ((1998) ) Frontotemporal lobar degeneration: A consensus on clinical diagnostic criteria. Neurology 51: , 1546–1554. |
[25] | Ashburner J ((2007) ) A fast diffeomorphic image registration algorithm. Neuroimage 38: , 95–113. |
[26] | Beaulieu C ((2002) ) The basis of anisotropic water diffusion in the nervous system - a technical review. NMR Biomed 15: , 435–455. |
[27] | Le Bihan D , Johansen-Berg H ((2012) ) Diffusion MRI at 25: Exploring brain tissue structure and function. Neuroimage 61: , 324–341. |
[28] | Basser PJ , Mattiello J , LeBihan D ((1994) ) MR diffusion tensor spectroscopy and imaging. Biophys J 66: , 259–267. |
[29] | Jones DK , Simmons A , Williams SC , Horsfield MA ((1999) ) Non-invasive assessment of axonal fiber connectivity in the human brain via diffusion tensor MRI. Magn Reson Med 42: , 37–41. |
[30] | Mori S , Crain BJ , Chacko VP , van Zijl PC ((1999) ) Three-dimensional tracking of axonal projections in the brain by magnetic resonance imaging. Ann Neurol 45: , 265–269. |
[31] | Sporns O , Tononi G , Kotter R ((2005) ) The human connectome: A structural description of the human brain. PLoS Comput Biol 1: , e42. |
[32] | Hagmann P , Cammoun L , Gigandet X , Meuli R , Honey CJ , Wedeen VJ , Sporns O ((2008) ) Mapping the structural core of human cerebral cortex. PLoS Biol 6: , e159. |
[33] | Fischl B , van der Kouwe A , Destrieux C , Halgren E , Segonne F , Salat DH , Busa E , Seidman LJ , Goldstein J , Kennedy D , Caviness V , Makris N , Rosen B , Dale AM ((2004) ) Automatically parcellating the human cerebral cortex. Cereb Cortex 14: , 11–22. |
[34] | Smith SM , Jenkinson M , Woolrich MW , Beckmann CF , Behrens TE , Johansen-Berg H , Bannister PR , De Luca M , Drobnjak I , Flitney DE , Niazy RK , Saunders J , Vickers J , Zhang Y , De Stefano N , Brady JM , Matthews PM ((2004) ) Advances in functional and structural MR image analysis and implementation as FSL. Neuroimage 23: (Suppl 1), S208–S219. |
[35] | Behrens TE , Woolrich MW , Jenkinson M , Johansen-Berg H , Nunes RG , Clare S , Matthews PM , Brady JM , Smith SM ((2003) ) Characterization and propagation of uncertainty in diffusion-weighted MR imaging. Magn Reson Med 50: , 1077–1088. |
[36] | Iturria-Medina Y , Canales-Rodriguez EJ , Melie-Garcia L , Valdes-Hernandez PA , Martinez-Montes E , Aleman-Gomez Y , Sanchez-Bornot JM ((2007) ) Characterizing brain anatomical connections using diffusion weighted MRI and graph theory. Neuroimage 36: , 645–660. |
[37] | Rubinov M , Sporns O ((2010) ) Complex network measures of brain connectivity: Uses and interpretations. Neuroimage 52: , 1059–1069. |
[38] | Melie-García L , Sanabria-Diaz G , Iturria-Medina Y , Alemán-Gómez Y ((2010) ) MorphoConnect: Toolbox for studying structural brain networks using morphometric descriptors. Paper presented at the 16th Annual Meeting of the Organization for Human Brain Mapping, Barcelona, Spain. |
[39] | Xia M , Wang J , He Y ((2013) ) BrainNet Viewer: A network visualization tool for human brain connectomics. PLoS One 8: , e68910. |
[40] | Benjamini Y , Drai D , Elmer G , Kafkafi N , Golani I ((2001) ) Controlling the false discovery rate in behavior genetics research. Behav Brain Res 125: , 279–284. |
[41] | Gong G , He Y , Concha L , Lebel C , Gross DW , Evans AC , Beaulieu C ((2009) ) Mapping anatomical connectivity patterns of human cerebral cortex using in vivo diffusion tensor imaging tractography. Cereb Cortex 19: , 524–536. |
[42] | McDonald CR , McEvoy LK , Gharapetian L , Fennema-Notestine C , Hagler DJ Jr , Holland D , Koyama A , Brewer JB , Dale AM , Alzheimer’s Disease Neuroimaging Initiative ((2009) ) Regional rates of neocortical atrophy from normal aging to early Alzheimer disease. Neurology 73: , 457–465. |
[43] | Leung KK , Bartlett JW , Barnes J , Manning EN , Ourselin S , Fox NC , Alzheimer’s Disease Neuroimaging Initiative ((2013) ) Cerebral atrophy in mild cognitive impairment and Alzheimer disease: Rates and acceleration. Neurology 80: , 648–654. |
[44] | Galton CJ , Patterson K , Graham K , Lambon-Ralph MA , Williams G , Antoun N , Sahakian BJ , Hodges JR ((2001) ) Differing patterns of temporal atrophy in Alzheimer’s disease and semantic dementia. Neurology 57: , 216–225. |
[45] | Schroeter ML , Neumann J ((2011) ) Combined imaging markers dissociate Alzheimer’s disease and frontotemporal lobar degeneration - an ALE meta-analysis. Front Aging Neurosci 3: , 10. |
[46] | Rami L , Gomez-Anson B , Monte GC , Bosch B , Sanchez-Valle R , Molinuevo JL ((2009) ) Voxel based morphometry features and follow-up of amnestic patients at high risk for Alzheimer’s disease conversion. Int J Geriatr Psychiatry 24: , 875–884. |
[47] | Rosen HJ , Gorno-Tempini ML , Goldman WP , Perry RJ , Schuff N , Weiner M , Feiwell R , Kramer JH , Miller BL ((2002) ) Patterns of brain atrophy in frontotemporal dementia and semantic dementia. Neurology 58: , 198–208. |
[48] | Acosta-Cabronero J , Patterson K , Fryer TD , Hodges JR , Pengas G , Williams GB , Nestor PJ ((2011) ) Atrophy, hypometabolism and white matter abnormalities in semantic dementia tell a coherent story. Brain 134: , 2025–2035. |
[49] | Yang J , Pan P , Song W , Shang HF ((2012) ) Quantitative meta-analysis of gray matter abnormalities in semantic dementia. J Alzheimers Dis 31: , 827–833. |
[50] | Stoub TR , deToledo-Morrell L , Dickerson BC ((2014) ) Parahippocampal white matter volume predicts Alzheimer’s disease risk in cognitively normal old adults. Neurobiol Aging 35: , 1855–1861. |
[51] | Gong G , Rosa-Neto P , Carbonell F , Chen ZJ , He Y , Evans AC ((2009) ) Age- and gender-related differences in the cortical anatomical network. J Neurosci 29: , 15684–15693. |
[52] | Shu N , Liang Y , Li H , Zhang J , Li X , Wang L , He Y , Wang Y , Zhang Z ((2012) ) Disrupted topological organization in white matter structural networks in amnestic mild cognitive impairment: Relationship to subtype. Radiology 265: , 518–527. |
[53] | Kuceyeski A , Zhang Y , Raj A ((2012) ) Linking white matter integrity loss to associated cortical regions using structural connectivity information in Alzheimer’s disease and fronto-temporal dementia: The Loss in Connectivity (LoCo) score. Neuroimage 61: , 1311–1323. |
[54] | van den Heuvel MP , Sporns O ((2011) ) Rich-club organization of the human connectome. J Neurosci 31: , 15775–15786. |
[55] | Reid AT , Evans AC ((2013) ) Structural networks in Alzheimer’s disease. Eur Neuropsychopharmacol 23: , 63–77. |
[56] | Fornito A , Zalesky A , Breakspear M ((2013) ) Graph analysis of the human connectome: Promise, progress, and pitfalls. Neuroimage 80: , 426–444. |
[57] | Jones DK , Knosche TR , Turner R ((2013) ) White matter integrity, fiber count, and other fallacies: The do’s and don’ts of diffusion MRI. Neuroimage 73: , 239–254. |
[58] | Daducci A , Dal Palu A , Lemkaddem A , Thiran JP ((2015) ) COMMIT: Convex optimization modeling for microstructure informed tractography. IEEE Trans Med Imaging 34: , 246–257. |
[59] | Zhang H , Hubbard PL , Parker GJM , Alexander DC ((2011) ) Axon diameter mapping in the presence of orientation dispersion with diffusion MRI. Neuroimage 56: , 1301–1315. |
[60] | Assaf Y , Alexander DC , Jones DK , Bizzi A , Behrens TE , Clark CA , Cohen Y , Dyrby TB , Huppi PS , Knoesche TR , Lebihan D , Parker GJ , Poupon C , CONNECT consortium, Anaby D , Anwander A , Bar L , Barazany D , Blumenfeld-Katzir T , De-Santis S , Duclap D , Figini M , Fischi E , Guevara P , Hubbard P , Hofstetter S , Jbabdi S , Kunz N , Lazeyras F , Lebois A , Liptrot MG , Lundell H , Mangin JF , Dominguez DM , Morozov D , Schreiber J , Seunarine K , Nava S , Poupon C , Riffert T , Sasson E , Schmitt B , Shemesh N , Sotiropoulos SN , Tavor I , Zhang HG , Zhou FL ((2013) ) The CONNECT project: Combining macro- and micro-structure. Neuroimage 80: , 273–282. |
Figures and Tables
Fig.1
Orange shaded areas visualize grey matter volume reductions (p < 0.05 family-wise error rate corrected) of Alzheimer’s disease and semantic dementia groups compared to healthy controls. S, superior; P, posterior; L, left; I, inferior; A, anterior; R, right.
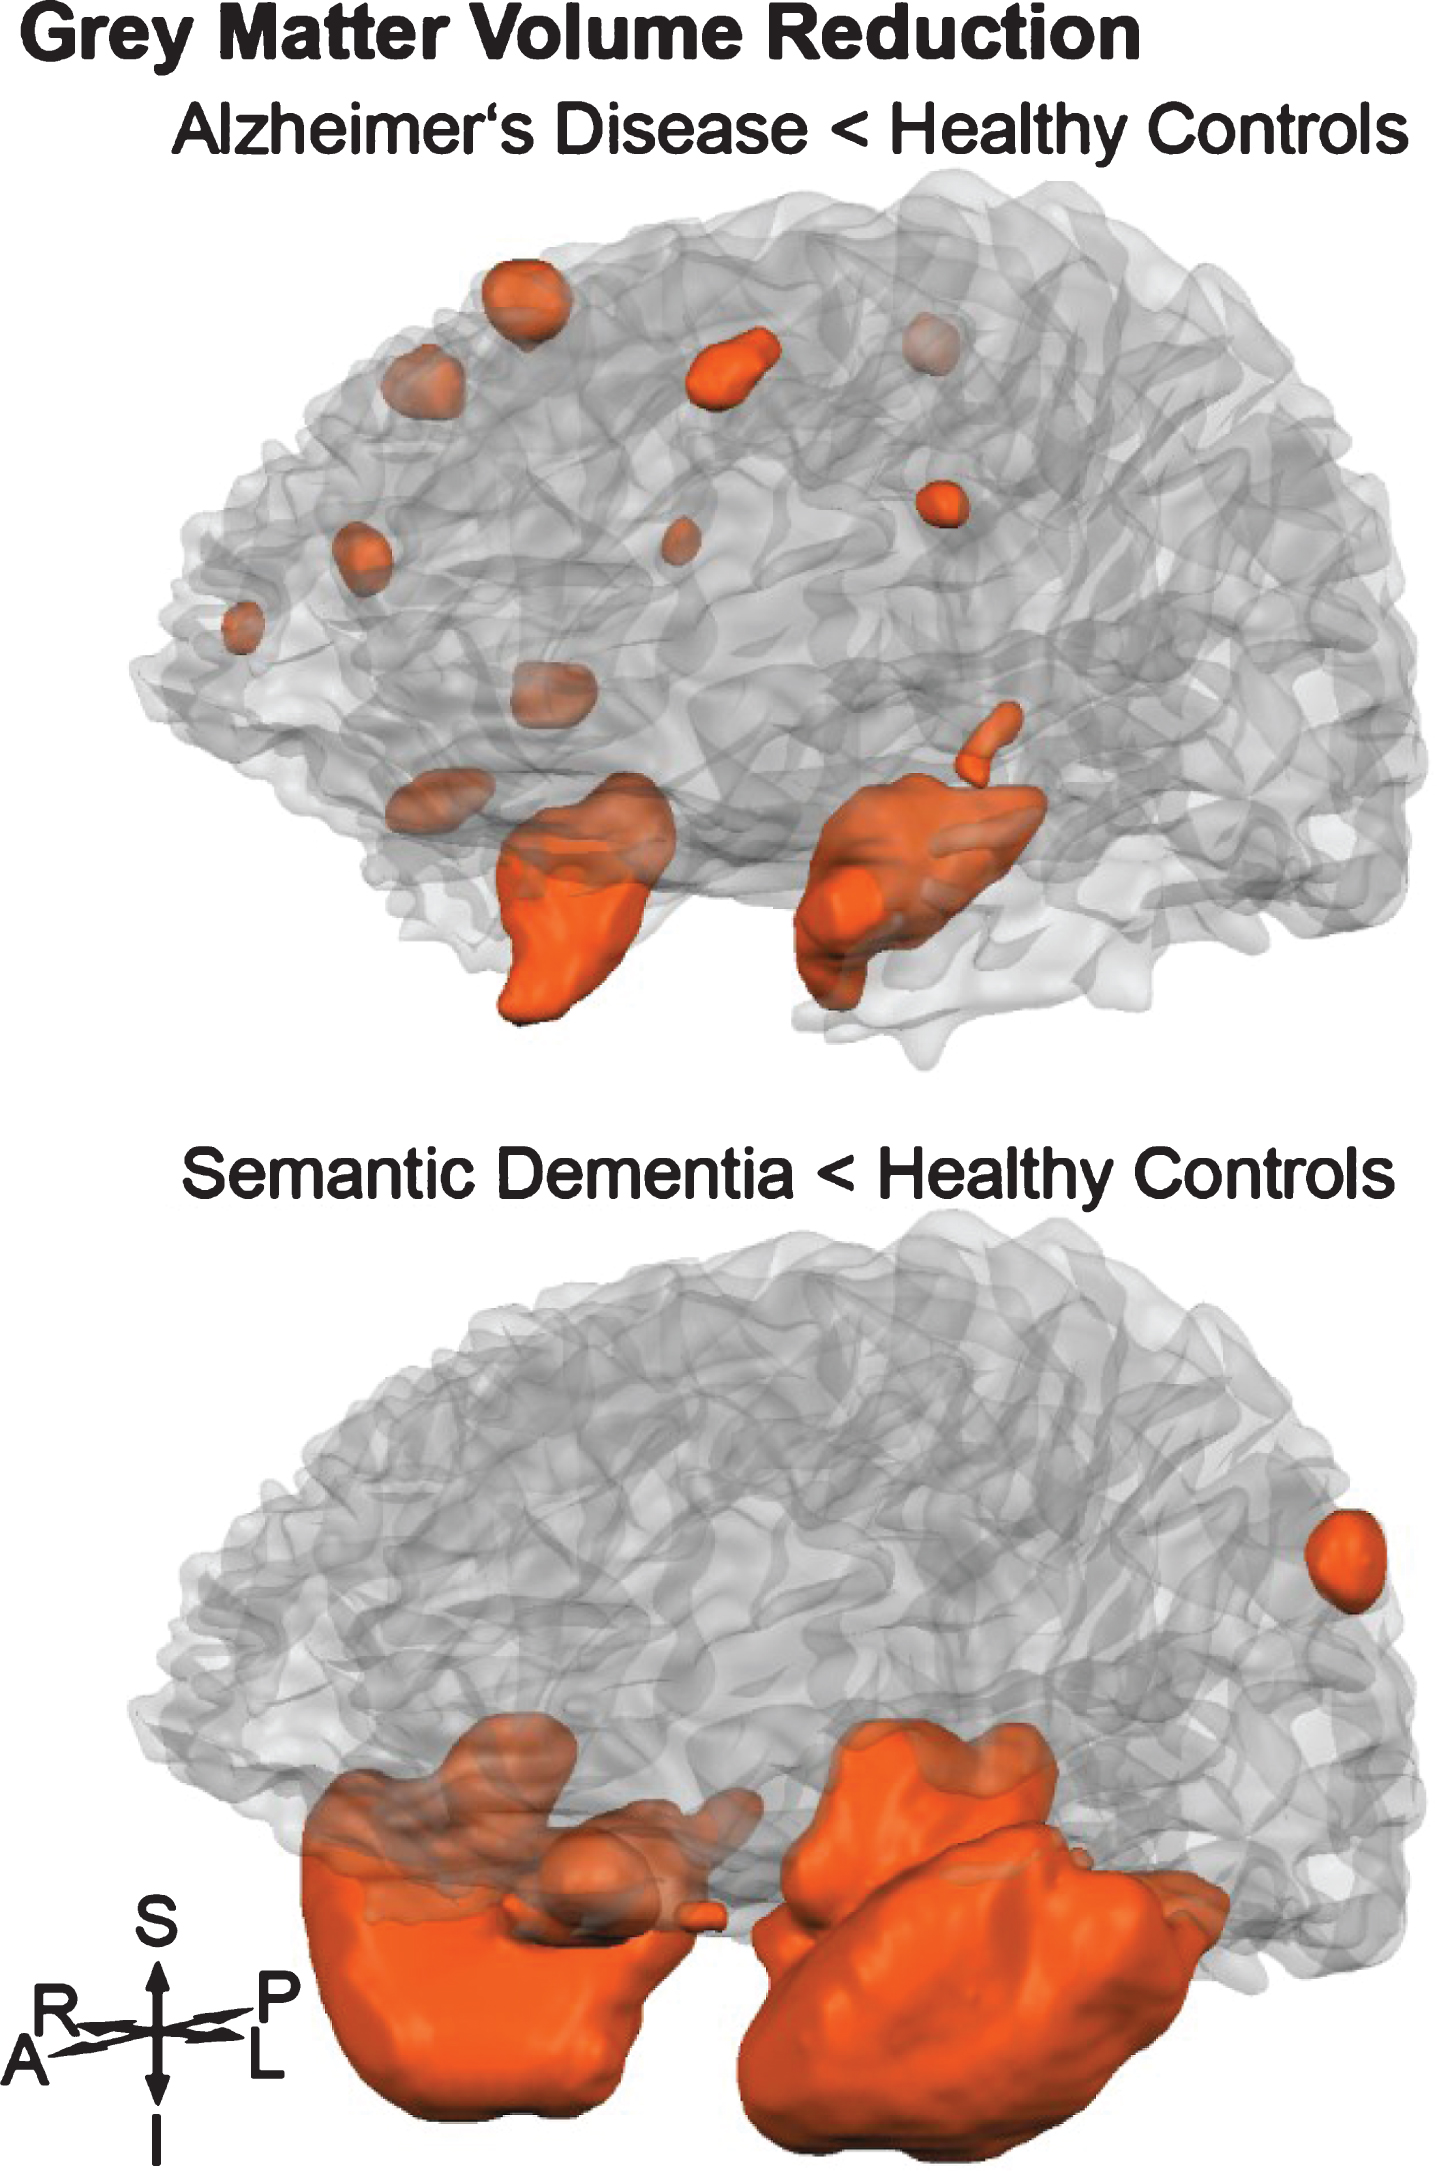
Fig.2
Boxplots of the global network metrics for healthy control (HC), Alzheimer’s disease (AD), and semantic dementia (SD) groups. Metrics were computed based on networks with ACN weighting scheme and a connectivity threshold of 2000.
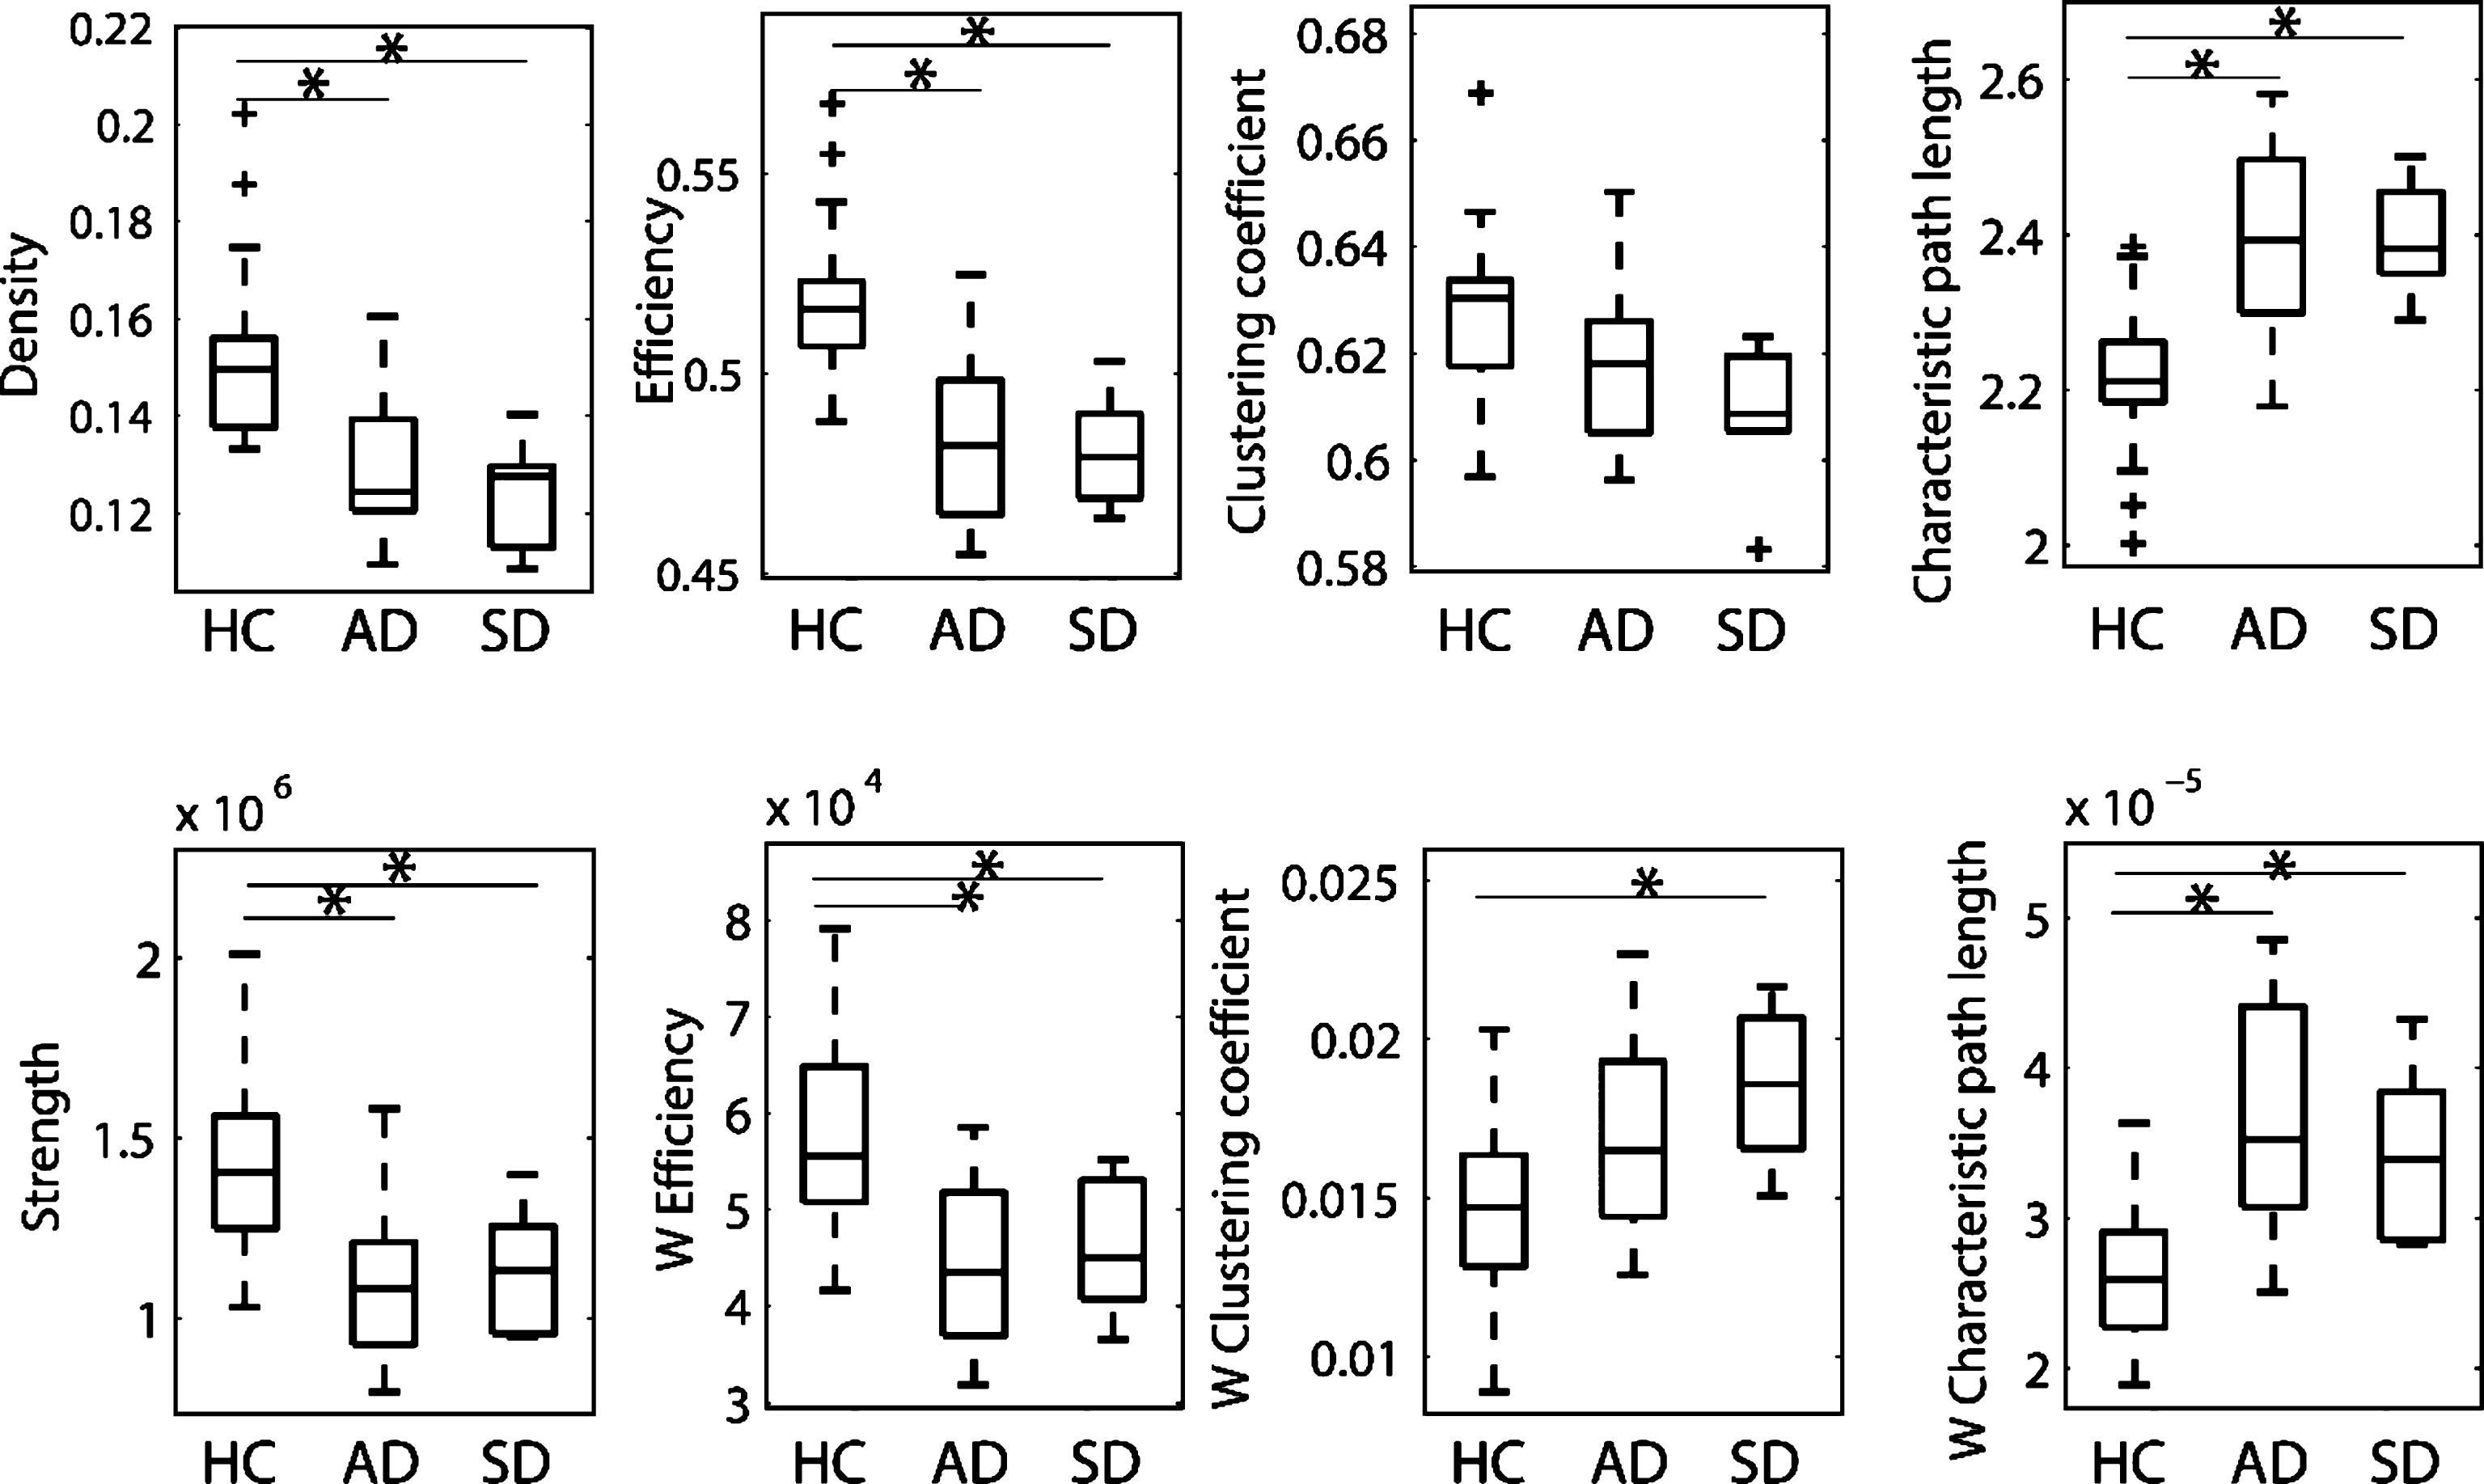
Fig.3
Visualization of the local differences in the cortical networks of healthy controls versus Alzheimer’s disease (top row) and healthy controls versus semantic dementia (bottom row). Colored nodes indicate significant differences in connectivity strength (green nodes), grey matter volume (blue nodes, significant difference in at least 50 voxels and >1% of the region), or both (red nodes).
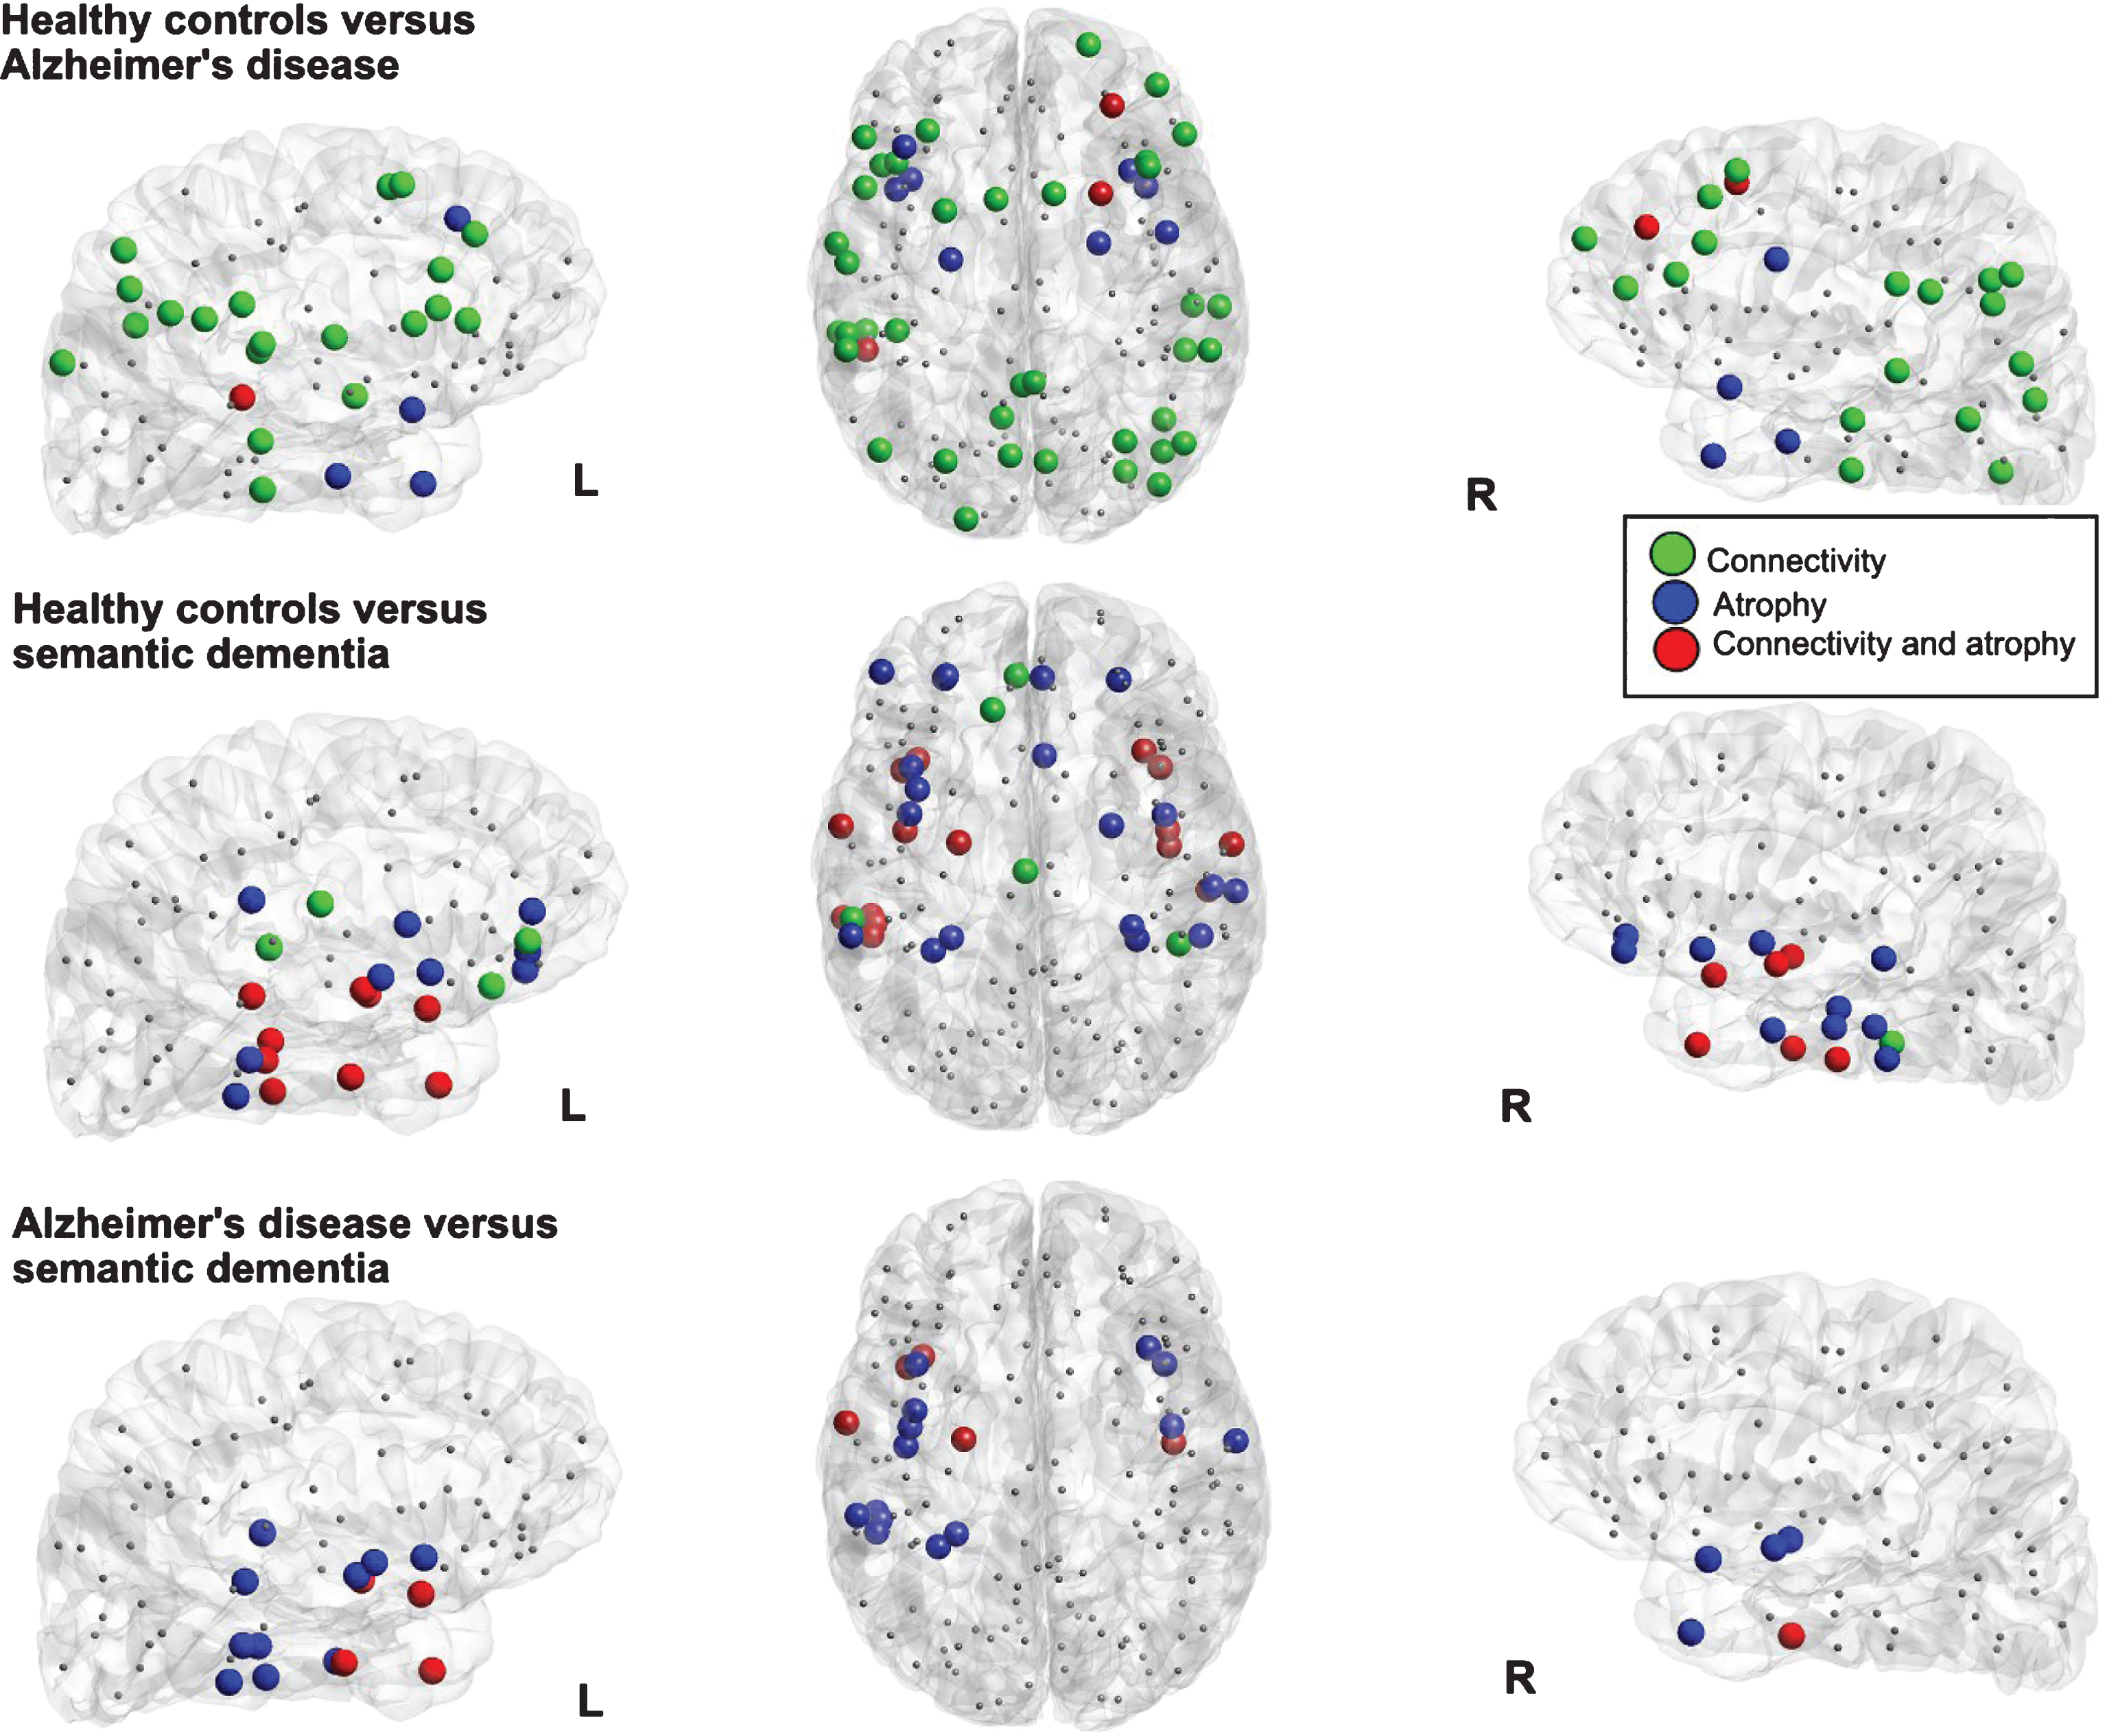
Table 1
Participant group descriptive statistics
| Healthy controls | Alzheimer’s Disease | Semantic Dementia | chi-square | df | p value | |
| Demographics | Group stats | |||||
| Participants [n] | 21 | 18 | 6 | |||
| Age [years] | 69.8 (3.2) | 68.1 (9.3) | 65.3 (3.6) | 4.3 | 2 | n.s. |
| Women [n] (%) | 15 (71) | 10 (56) | 3 (50) | 1.4 | 2 | n.s. |
| Total intracranial volume [ml] | 1424 (146) | 1415 (163) | 1420 (174) | 0.14 | 2 | n.s. |
| Education [years] | 13.8 (2.8) | 13.2 (2.8) | 14.2 (2.9) | 0.33 | 2 | n.s. |
| Neuropsychological assessment | ||||||
| MMSE [points] | 28.7 (0.9) | 24.4 (4.5) | 21.5 (6.1) | 27.2 | 2 | <0.001 |
| BNT [points] | 53.9 (3.8) | 46.0 (6.6) | 8.2 (7.3) | 25.7 | 2 | <0.001 |
| AF [word count] | 24.2 (6.2) | 14.1 (3.9) | 4.7 (4.5) | 28.6 | 2 | <0.001 |
| VF [word count] | 21.6 (5.5) | 11.8 (5.2) | 9.0 (5.9) | 23.1 | 2 | <0.001 |
Scores are mean (SD), except for number of participants and number of women. MMSE, Mini-Mental State Examination; BNT, Boston Naming Test; AF, animal fluency; VF, verb fluency; n.s., not significant.
Table 2
Spearman correlation coefficients of global metrics (ACN weighting scheme with a connectivity threshold of 2000) with neuropsychological test scores
| MMSE | BNT | Animal fluency | Verb fluency | |
| Global density | 0.43 (0.002)* | 0.40 (0.003)* | 0.52 (<0.001)* | 0.44 (0.001)* |
| Global strengthw | 0.36 (0.007) | 0.30 (0.021) | 0.50 (<0.001)* | 0.40 (0.003)* |
| Clustering coefficient | 0.31 (0.020) | n.s. | 0.42 (0.002)* | n.s. |
| Clustering coefficientw | n.s. | –0.28 (0.32) | –0.43 (0.002)* | –0.36 (0.007) |
| Characteristic path length | –0.41 (0.002)* | –0.46 (0.001)* | –0.50 (<0.001)* | –0.46 (0.001)* |
| Characteristic path lengthw | –0.41 (0.003)* | –0.36 (0.007) | –0.55 (<0.001)* | –0.48 (<0.001)* |
| Global efficiency | 0.41 (0.003)* | 0.47 (0.001)* | 0.53 (<0.001)* | 0.47 (0.001)* |
| Global efficiencyw | 0.39 (0.004)* | 0.34 (0.011) | 0.53 (<0.001)* | 0.46 (0.001)* |
False discovery rate-corrected significant p-values (p < 0.006) marked with asterisk. MMSE, Mini-Mental State Examination; BNT, Boston Naming Task; w, weighted; n.s., not significant.


