
Validation of Immunoassay-Based Tools for the Comprehensive Quantification of Aβ40 and Aβ42 Peptides in Plasma
Abstract
Recent advances in neuroimaging and cerebrospinal fluid (CSF) biomarker assays have provided evidence of a long preclinical stage of Alzheimer’s disease (AD). This period is being increasingly targeted for secondary prevention trials of new therapies. In this context, the interest of a noninvasive, cost-effective amyloid-β (Aβ) blood-based test does not need to be overstated. Nevertheless, a thorough validation of these bioanalytical methods should be performed as a prerequisite for confident interpretation of clinical results. The aim of this study was to validate ELISA sandwich colorimetric ABtest40 and ABtest42 for the quantification of Aβ40 and Aβ42 in human plasma. The validation parameters assessed included precision, accuracy, sensitivity, specificity, recovery, and dilution linearity. ABtest40 and ABtest42 proved to be specific for their target peptide using Aβ peptides with sequence similar to the target. Mean relative error in the quantification was found to be below 7.5% for both assays, with high intra-assay, inter-assay, and inter-batch precision (CV <9.0% on average). Sensitivity was assessed by determination of the limit of quantification fulfilling precision and accuracy criteria; it was established at 7.60 pg/ml and 3.60 pg/ml for ABtest40 and ABtest42, respectively. Plasma dilution linearity was demonstrated in PBS; however, dilution in a proprietary formulated buffer significantly increased the recovery of both Aβ40 and Aβ42 masked by matrix interactions, allowing a more comprehensive assessment of the free and total peptide levels in the plasma. In conclusion, both assays were successfully validated as tools for the quantification Aβ40 and Aβ42 in plasma.
INTRODUCTION
Alzheimer’s disease (AD) is a neurodegenerative disorder characterized by the extracellular deposition of amyloid-β (Aβ) in cerebral Aβ plaques and the formation of intracellular neurofibrillary tangles in the brain [1]. A definite diagnosis of AD, which currently affects 46.8 million people worldwide [2], can only be established by postmortem evaluation of these two pathological hallmarks of the disease [3]. Nevertheless, recent advances in neuroimaging and cerebrospinal fluid (CSF) biomarker assays have led to a new paradigm for the disease and have provided tools to identify the disease in vivo. The new paradigm considers a long preclinical stage during which AD pathologies are developing prior to the onset of clinical symptoms [4–6]. This preclinical period is being increasingly targeted for secondary prevention clinical trials of new therapies aimed to delay or avoid the apparition of incapacitating dementia symptoms. Since, by definition, preclinical AD cannot be detected by clinical measures, biomarkers are needed to identify individuals in this important stage of the disease in order to enrich cohorts for clinical trials with people at increased risk of developing the disease and eventually, when disease-modifying drugs become available, for management of patient treatment. Among them, Aβ biomarkers, measured either by increased accumulation of Aβ peptides in brain or Aβ42 reduction in CSF, have demonstrated their utility as preclinical biomarkers of AD [7–14].
Aβ species are also measurable in peripheral blood and mounting evidence shows that plasma Aβ peptide levels are associated with the risk of disease progression, brain Aβ levels, or other markers of neurodegeneration such as structural brain atrophy determined by MRI [15–20]. Nevertheless, the strength of this association remains to be definitively established, which will determine the potential utility of Aβ blood-based assays with regard to the diagnosis of AD.
The advantages of a blood-based test as a cost-effective non-invasive tool for clinical trial enrichment and population screening do not need to be stressed [21]. In fact, it has been proposed that blood-based methods could serve as the first step in a multistep diagnostic process [22]. With this in mind, together with special attention to pre-assay aspects, a thorough validation of the bioanalytical method should be performed to define performance characteristics as a prerequisite for confident interpretation of clinical results.
The quantification of these peptides at the low level in which they are found in plasma and the notorious difficultly associated with their handling could explain contradictory results to date and some past controversies. The hydrophobic nature of Aβ peptides makes them difficult to analyze due to their propensity to bind with plasma proteins such as albumin, α2-macroglobulin, lipoproteins, or transthyretin [23–26]. These interactions are likely to cause epitope masking, preventing the Aβ peptides from being detected in an immunoassay. These physicochemical features of Aβ are related to other sources of variability in their determination, attributable to differences in pre-analytical and analytical procedures [27–30].
The present study reports the validation results of two specific tools, ABtest40 and ABtest42, developed by Araclon Biotech Ltd. for the quantification of both free and total Aβ40 and Aβ42 in plasma. The free Aβ in plasma (FP) fraction corresponds to the amount of those peptides that are readily available for immunoassay detection. Total Aβ in plasma (TP) refers to the amount of these peptides that can be measured after pre-treating the plasma sample with a formulated buffer that breaks the interactions of the peptide with other plasma components (mostly proteins), which could be masking up to 50% of the peptide in the sample [31]. To the extent possible, regulatory guidelines for validation of bioanalytical methods [32, 33] were followed to conduct experimental designs and a priori establish acceptance criteria, as well as other recommendation papers focused on this specific field [34].
MATERIAL AND METHODS
Assay description and procedure
ABtest40 and ABtest42 (Araclon Biotech Ltd. Zaragoza, Spain) are two colorimetric tests based in the sandwich enzyme-linked immunosorbent assay (ELISA) technique as described elsewhere [31]. Briefly, a monoclonal antibody (1F3, Araclon Biotech) specific to the N-terminal fragment of Aβ and immobilized in a microplate well, reacts with Aβ species during an overnight incubation at 2–8°C. Dilution of both standards and samples is always performed in Sample/Standard Diluent. After a 5-cycle washing step to remove any non-specific binding, the immobilized peptides are detected by the addition of a biotinylated polyclonal antibody, also developed by Araclon Biotech, specific of the C-terminal end of either Aβ40 (pAB002) or Aβ42 (pAB031). The detection reaction is carried out during 1 h at room temperature and shaking (30 rpm 3D orbital shaking). After repeating the washing step, a streptavidin-HRP amplification reaction takes place (1 h, room temperature, shaking), followed by a washing cycle and a colorimetric reaction during 30 min in the dark with a chromogen substrate, TMB. Analyte concentration is proportional to optical density at 450 nm.
The pair of antibodies implied in each assay are developed and produced by Araclon Biotech. Polyclonal antibodies are purified by antigen-affinity chromatography using the same Aβ fragment inoculated to the rabbits. The monoclonal antibody is purified by class-specific affinity using protein-G columns. Each production batch is subjected to an exhaustive quality control, including specificity and sensitivity evaluation to ensure lot-to-lot consistency, especially relevant when using polyclonal antibodies. The stock of polyclonal antibody in the kit is supplied at a batch-to-batch adjusted concentration to keep inter-lot consistency.
The validation experiments were performed using human plasma samples obtained from the Aragón Tissue and Blood Bank (Zaragoza, Spain) in accordance with the Helsinki Declaration of 1975.
Assay calibration
The standard calibration curve was prepared from synthetic Aβ1 - 40 and Aβ1 - 42 peptides (Araclon Biotech Ltd.). The amino acid sequence of both peptides matches that from the complete corresponding human peptide. The synthesis of both complete Aβ species was carried out using Fmoc solid phase in an automatic synthesizer (Applied Biosystems Inc., Foster City, CA, USA) and released from the resin by a cleavage process. The Aβ peptides were purified by HPLC and their sequence was confirmed by mass spectrometry (MALDI-TOF), ensuring in the process, the purity and identity of the specific Aβ peptide.
ABtest calibrators are prepared after a disaggregation procedure and resuspension of controlled-weight lyophilized aliquots to 1 mg/ml in NH4OH 0.1%. A first dilution step is carried out in guanidine hydrochloride 6M to a concentration of 200 μg/ml, followed by serial dilutions in Sample/Standard Diluent to obtain the calibrator stock provided with the kit. Quality control procedures, including mass spectrometry, HPLC and ELISA, are applied in-process and after batch releasing, to ensure batch to batch consistency. Each calibrator batch needs to fulfill quality control criteria of accuracy (less than 10% signal deviation at the maximum of quantification range) with regard to three independent reference stocks of the corresponding peptide. Additionally, ABtest calibrators must meet requirements of back-calculated concentration accuracy (less than 20% bias at each calibration point, regarding the theoretical concentration), as well as goodness of fit in a routine calibration curve procedure.
Calibrators for ABtest40 and ABtest42 were diluted 1/100 in Sample/Standard Diluent. Then, serial dilutions were carried out to obtain the 7 levels of concentration of the standard curve, reducing half the concentration in each step. In each assay, a calibration curve was assayed in duplicate and plotted using a 4-parameter logistic regression with a 1/y weighting variable, using the Gen5 software (BioTek Instruments, Inc., Winooski, VT, USA).
To validate the dynamic range of the assay that goes from 3.125 to 200 pg/ml for both ABtest, each standard level should meet precision and accuracy criteria. The coefficients of variation (CV) of the calibrator duplicates should be≤20%, except for the lowest calibrator for which CV≤25% is accepted. Back-calculated concentrations for calibrators should be±20% of the theoretical for acceptance (±25% for the lowest standard). To assess the suitability of the calibration method, 6 runs of the standard curve were prepared independently in each assay from different aliquots of the same calibrator batch, both with ABtest40 and ABtest42.
Analytical specificity
The specificity of both assays was evaluated by analyzing different Aβ peptides with a sequence similar to the target peptide. Serially truncated sequences of Aβ, both in C- and N-terminal, were assayed at the highest concentration of the dynamic range of the test (200 pg/ml). Investigation of the specificity in N-terminal was performed in ABtest40 (same results were expected for ABtest42 since they share the same capture antibody) with Aβ2 - 40, Aβ3 - 40, [Pyr3]Aβ3 - 40, Aβ4 - 40, Aβ11 - 40, and murine Aβ1 - 40 (AnaSpec, Inc., Fremont, CA, USA). Specificity in C-terminal was evaluated with the truncated species Aβ1 - 37 (Bachem, Budendorf, Switzerland), Aβ1 - 38 (Araclon Biotech Ltd., Zaragoza, Spain) and Aβ1 - 43 (AnaSpec), besides Aβ40 or Aβ42 depending on the ABtest used.
Specificity was established as the percentage of cross reactivity of the truncated species regarding the target Aβ peptide signal.
Limit of quantification
The limit of quantification (LoQ) of both ABtest assays was established following the guidelines included in the Clinical & Laboratory Standards Institute (CLSI) guidelines [35]. First, the limit of blank (LoB) was estimated by repeated determination of four plasma samples without Aβ40 or Aβ42 using three different batches of ABtest40 and ABtest42, in three runs with six replicates per assay. The depletion of plasma was carried out after incubation of the samples in a solid phase conjugated with 1F3, the specific anti N-terminal Aβ antibody. The apparent concentration of Aβ40 or Aβ42 in these Aβ depleted samples was determined for each replicate and the concentration corresponding to the LoB was established following the procedure proposed by CLSI [35].
Following this, the limit of detection (LoD) of ABtest40 and ABtest42 was estimated by analyzing four samples with a concentration of Aβ40 or Aβ42 close to the LoB previously established. Quantification of these samples was repeated in three different assays including six replicates in each run. This experimental design was performed with three different batches of ABtest40 and ABtest42 and LoD was determined following the guidelines proposed in EP17-A2 report [35]
Finally, the limit of quantification (LoQ) of the assay was established as the lowest Aβ40 or Aβ42 concentration above the LoD which can be determined with precision and accuracy. In this sense, samples with progressively increased concentration of Aβ40 or Aβ42 from LoD were assayed in 44 replicates with two batches of ABtest40 or ABtest42, respectively. The lowest concentration that meets the criteria of precision (CV≤ 25%) and accuracy (RE≤ 25%) was established as the LoQ of the assay.
Precision
To evaluate precision, five plasma samples with Aβ40 or Aβ42 levels covering the whole dynamic range of the assay were prepared so that reproducibility was guaranteed independent of the Aβ concentration. When it was not possible to find natural samples at a particular concentration level, they were partially depleted as previously described or artificially enriched with the corresponding synthetic peptide by spiking Aβ40 or Aβ42.
Precision of ABtest40 and ABtest42 was assessed at different levels. Intra and inter-assay reproducibility was examined by quantifying the same five samples as replicates (n = 6) in the same run and in six different and independent runs, both with ABtest40 and ABtest42. Inter-batch precision was assessed comparing the concentration obtained in each of these five samples with three different batches of ABtest40 or ABtest42, in three independent runs.
Precision was determined by calculating the CV of the different measurements of the same sample carried out in the same run, among different runs and among different ABtest batches. The acceptance criterion was established as a CV≤20%, with the exception of the sample close to the lower limit of quantification (LLOQ) of the assay where a CV≤25% is allowed.
Accuracy
ABtest40 and ABtest42 accuracy was also evaluated in the whole dynamic range of the assay with the same five samples described in precision assessment. Firstly, the Aβ40 and Aβ42 theoretical concentration in these samples was determined by repeated quantification including all the factors that could affect the assay: six replicates of each sample in four independent runs with two different batches of either ABtest40 or ABtest42 (total quantifications of each sample = 48).
Once the theoretical concentration of Aβ40 and Aβ42 was determined, the accuracy assessment implied the quantification of these five samples with a different batch of ABtest40 or ABtest42 in six different runs with six replicates of each sample per run (n = 36). The accuracy was established in terms of the relative error (RE), i.e., the percentage of the difference between an observed concentration and the theoretical concentration divided by the theoretical concentration. Mean RE was calculated for each concentration level (taking the absolute values) and the acceptance limit established at RE≤20% (except LLOQ, where RE≤25%).
Analyte spike recovery
The effect of the plasma matrix in the recovery of synthetic Aβ peptides was investigated. Aβ1 - 40 and Aβ1 - 42 standards were added to undiluted plasma and to plasma after three-fold dilution in Sample/Standard Diluent, which is the dilution usually carried out for analysis. To study the recovery in the whole range of the assay, three Aβ40 and Aβ42 concentrations (150 pg/ml, 75 pg/ml, and 20 pg/ml) were added to three different plasma samples and repeated in three different runs. The volume of Aβ peptides added to the samples never exceeded 5% of the final sample volume, in order to minimize matrix alteration while keeping pipetting accuracy in the procedure. Samples were assayed with ABtest within 30 min after spiking. Every step was carried out at room temperature.
The matrix effect in these samples was evaluated by calculating the percentage of recovery of the known concentration of Aβ added, as an average of the three individuals and assays.
Dilution linearity
Five different plasma samples were serially diluted three, six, and nine times either in the assay’s Sample/Standard Diluent or in a saline buffer as PBS, in parallel with both buffers and always in duplicate. The linearity of the association was assessed graphically by plotting either the signal or concentration obtained versus the inverse of the corresponding dilution factor.
Statistical treatment
The parameters studied in each validation step were included as summary descriptive statistics where the mean and range estimates were calculated.
Descriptive statistics included the calculation of mean, range, standard deviation (SD), CV, RE, and percentage of recovery.
RESULTS
The main results obtained in the validation assays of ABtest40 and ABtest42 are summarized in Table 1, both for ABtest40 and ABtest42.
Assay calibration
The calibration range was selected taking into account the expected levels of Aβ40 and Aβ42 in plasma. A quantification range from 3.125 pg/ml to 200 pg/ml was evaluated to accomplish the precision and accuracy goals. All the calibration levels fulfilled the acceptance criteria previously established with a mean RE of 4.5% for ABtest40 and 2.9% for ABtest42. On average, the variability (CV) of all the concentration replicates of the calibration curve was 5.2% and 4.2% for ABtest40 and ABtest42, respectively. The RE and CV values obtained at each calibrator level in the six runs performed are summarized in Supplementary Table 1.
Analytical specificity
The anti-Aβ N-terminal antibody, shared by ABtest40 and ABtest42, did not show any significant (lower than 4%) cross reactivity with Aβ species starting at amino acid 4 and subsequent amino acids or with murine Aβ (see Supplementary Table 2). The antibody 1F3 is reactive to Aβ peptides containing at least amino acid 3 of the Aβ sequence, even when it is modified as with the pyroglutamate in [Pyr3]Aβ3 - 40, i.e., it is reactive 100% to Aβ1 - 40, and above 96% for Aβ2 - 40, Aβ3 - 40, and [Pyr3]Aβ3 - 40.
ABtest40 was completely specific for the target Aβ40 peptide with cross reactivity of similar species (Aβ1 - 37, Aβ1 - 38, Aβ1 - 42, and Aβ1 - 43) below 2% in all cases. Similarly, ABtest42 showed high specificity for Aβ42, without recognizing Aβ1 - 37, Aβ1 - 38, Aβ1 - 40, or Aβ1 - 43; the signal percentage of these species regarding the target Aβ42 was below 5% in all cases (results shown in Supplementary Table 2).
Limit of quantification
After determining the LoD (see Supplementary Table 3), the lowest concentration empirically tested for precision and accuracy was 7.60 pg/ml for ABtest40 and 3.60 pg/ml for ABtest42. Both concentrations proved to be accurate (RE of 3.4% for ABtest40 and 16.8% for ABtest42) and precise (CV of 21.6% for ABtest40 and 18.1% for ABtest42), confirmed in one run with 44 replicates, using two different batches of each ABtest (see Supplementary Table 4). Therefore, the limit of quantification was established in 7.60 pg/ml for ABtest40 and 3.60 pg/ml for ABtest42.
Precision
For a given plasma sample, the variability between concentrations determined in the same assay, in different assays and with different ABtest batches was always below 15% (Fig. 1). Both ABtest40 and ABtest42 demonstrated good reproducibility when analyzing samples in the same assay with a mean CV of 5.8% for ABtest40 and 5.4% for ABtest42. The inter-assay variability was found to be 7.7% and 7.5%, respectively, for ABtest40 and ABtest42, as an average of the five concentration levels studied. The same five samples were analyzed in parallel with three different ABtest batches, with a mean CV of 4.8% for Aβ40 and 8.8% for Aβ42 quantification (Supplementary Figure 1).
Accuracy
Accuracy was evaluated in each concentration level by the relative difference between each determination carried out (n = 36 for each concentration level) and the theoretical concentration of Aβ40 or Aβ42 previously determined for each sample. In Fig. 2, the RE obtained for each determination is plotted regarding each concentration level. Mean RE values are summarized in Supplementary Table 5, with an average accuracy for ABtest40 of 7.2% and 7.1% for ABtest42.
Analyte spike recovery
The mean recovery percentage of Aβ spiked in undiluted plasma was 60.4% for Aβ40 and 63.6% for Aβ42, whereas it rose up to 94.0–95.0% for both Aβ40 and Aβ42 peptides from the three-fold dilution of plasma in Sample/Standard Diluent. Recovery was constant for the different concentration levels added to the samples, and did not differ significantly among different individuals (n = 3, see Supplementary Table 6).
Dilution linearity
The signal obtained after serially diluting a plasma sample in PBS follows a linear tendency to decline (Fig. 3). In contrast, the dilution of the same samples in Sample/Standard Diluent provided a nonlinear association since the signal drop, especially with a 3-fold dilution, was smaller than expected for a linear association and comparing to the PBS dilution (Fig. 3A, B). Consequently, the maximum Aβ concentration measured in each of the 5 samples assayed was obtained when they were diluted 1/3 in Sample/Standard Diluent (Fig. 3C, D). See further information in Supplementary Table 7.
DISCUSSION
The ELISA technique is frequently used for measurement of low-abundance biomarkers. However, the quality of ELISA methods varies, which may introduce both systematic and random errors. The aim of this study was to assess the performance of ABtest40 and ABtest42 in terms of specificity, sensitivity, precision, and accuracy, including an evaluation of the matrix effect and a validation of the calibration method. Regarding the later, a 4-parameter weighted logistic regression demonstrated good precision and accuracy in the whole dynamic range of the assay, allowing a non-biased quantification from the sample signal obtained.
The specificity tests confirmed the complete lack of recognition of Aβ42 by ABtest40 and of Aβ40 by ABtest42, which guarantees that only the target Aβ form is being recognized in each case. Moreover, no other C-terminal truncated Aβ peptides, either shorter or longer than the specific Aβ, produced any signal in the test, providing robustness to the quantification. This may be relevant given the promising value as an AD biomarker of the ratio Aβ42/40 suggested in previous studies [15–18]. Specificity in N-terminal, shared by ABtest40 and ABtest42, showed that at least the presence of amino acid 3 (glutamic), even modified as pyro-glutamic, is needed for the recognition of Aβ. Therefore, ABtest40 and ABtest42 are reactive for the full-length Aβ1 - 40/42 as well as the N-terminal truncated forms Aβ2 - 40/42, Aβ3 - 40/42, and [Pyr3]Aβ3 - 40/42, and do not recognize further truncated species in N-terminal. Hence, the final Aβ concentration provided by these tests will include the aforementioned forms of the Aβ peptide. The recognition of the cycled form of Aβ3 - x could be of potential interest since there is some evidence showing this species as an important part of the pathological process of AD implied in aggregation processes [36, 37]. A remarkably higher signal for the Aβ form Aβ3 - 40 compared to the other specific peptides was observed. Although remarkable, this finding has limited relevance concerning the specificity of the capture antibody and most probably is not due to a higher reactivity to this Aβ species. In our opinion, this could be explained by differences in the concentration accuracy from commercial peptides since, in some cases, the counterion effect is not reflected in the amount of peptide declared. On the other hand, ABtest40 and ABtest42 are species specific and do not recognize the murine form of Aβ, which could be useful for possible use in studies with transgenic mice.
Sensitivity was evaluated following an exigent procedure in sequential and confirmatory steps, to ensure that the lowest concentration, which can be reliably quantified with ABtest40 and ABtest42, truly corresponds to that obtained empirically in this study. The lowest Aβ concentration that can be quantified with precision and accuracy was 7.60 pg/ml for Aβ40 and 3.60 pg/ml for Aβ42. Both limits of quantification are adequate for the existing levels of Aβ inplasma.
Precision and accuracy were thoroughly assessed with five samples spanning the dynamic range of the assay. Regarding the precision results, variability was always far below the standard acceptance criteria, for each concentration level and for intra and inter-assay as well as inter-batch determinations, with a mean global precision of 6.1% for ABtest40 and 7.2% for ABtest42. Although these precision levels are more than acceptable and similar to other Aβ quantification methods more experienced in clinical practice application, as CSF analysis [38], it is still a key point affecting robustness of the measurements. Considering the significant lower levels of Aβ in plasma regarding CSF, precision is even a more critical feature for a blood-based test.
Concerning accuracy evaluation, only one in 36 Aβ40 determinations was out of the acceptance range (32.0% RE in LLOQ). For ABtest42, 3 determinations at LLOQ showed a RE above 25% (26.6%, 30.5%, and 35.2%). For the other four concentration levels as a whole, a RE slightly over 20% was found in five cases, but below 28% in all cases. Apart from these unusual biased determinations, both ABtest40 and ABtest42 showed good accuracy in quantification, being that the average relative error obtained was about 7%. Consequently, precision and accuracy in the quantification of Aβ40 and Aβ42 were confirmed to be within the a priori established acceptance criteria along the whole dynamic range of the assay and in accordance with other tests results [39–43].
Recovery tests demonstrated a matrix effect in the plasma sample that was preventing ABtest40 and ABtest42 from quantifying 40–45% of the peptide present in the untreated sample, as shown by a recovery limited to a 60–65% of the Aβ40 and Aβ42 added to the undiluted plasma sample. Nevertheless, the adequate dilution (1/3) of the plasma sample in an appropriate buffer (Sample/Standard Diluent) increased recovery to more than 90%, demonstrating a substantial removal of the interference in the plasma matrix. The 3-fold dilution was selected from previous results evaluating a whole range of dilution factors as it provided the best recovery results. Interestingly, linearity assays corroborate this effect by the Sample/Standard Diluent observed in the recovery evaluation. Thus, serial dilution of neat plasma in a standard saline buffer such as PBS yielded a linear association of signal regarding the dilution carried out. However, the parallel dilution of the same plasma samples in Sample/Standard Diluent produced a signal drop unexpectedly much smaller than that caused by PBS dilution, especially at a 3-fold dilution (Fig. 3). As a consequence, the 3-fold dilution of plasma in Sample/Standard Diluent provided the maximum Aβ that can be quantified both with ABtest40 and ABtest42, giving a determination with biological meaning itself as the total amount of Aβ present in the sample that can be determined in this immunoassay. Other assays developed for the quantification of Aβ species in plasma dilute the plasma matrix in detergent based diluents [44], even finding a maximum signal at 1/3 dilution of plasma [42]. However, many publications dealing with Aβ blood-based test do not report any pre-dilution of the plasma samples [15, 45, 46], which should be considered an important factor to be standardized and taken into account for a comprehensive quantification of Aβ in plasma.
These results support the hypothesis that the formulated Sample/Standard Diluent has a specific and active influence over the interactions of Aβ with other plasma components that are well described in the bibliography [23–26, 47]. Thus, the dilution in Sample/Standard Diluent goes beyond what is expected for the dilution of a biological matrix, as can be seen compared to PBS; its specific formulation is releasing Aβ previously bound to plasma components and not accessible for its quantification by ELISA in the undiluted sample. Consequently, quantification of Aβ in an undiluted plasma matrix includes only the peptide that is directly accessible to be measured (or that is not interacting with masking components) whereas assaying the plasma sample diluted 1/3 in Sample/Standard Diluent allows for the determination of the total quantifiable Aβ after recovering the peptide masked by these interactions.
Blood-based tests for the diagnosis of AD are still in a discovery phase and in these initial stages a more comprehensive assessment of the concentration and distribution of Aβ in the plasma may afford an incremental benefit compared with single snapshot determinations, which are affected by the complex interaction of Aβ peptides with the individuals’ plasma matrix. Previous results in pilot studies support the idea that this comprehensive approach might help to develop blood-based tests into useful tools for the screening of people at increased risk of developing AD and warrant additional research in this area [48–50].
ABtest40 and ABtest42 have proved to be robust and reliable tools for quantification of Aβ40 and Aβ42 in plasma and this study provides important information about the quantitative performance expected from them which is relevant as there is an urgent need for an early and easily accessible AD biomarker and many studies have been carried out to explore the association between plasma Aβ and AD, although with contradictory results [16, 43, 46, 51–57]. We believe that part of this controversy could be due to the lack of standardization and validation of the plasma Aβ determination, which raises numerous issues that may impact upon the reproducibility of results. Diverse assay methodologies, antibodies produced under different conditions and/or from different sources and varied detection techniques can result in different outcomes and performance (see Supplementary Table 8). The variation in detectable levels of Aβ could also likely be produced by the use of different diluents and/or dilution factor in the assay [42]. Together with these analytical-phase factors, the importance of standardizing pre-analytical factors such as sample collection procedures, sample storage and pre-assay preparation for reliable and reproducible AD biomarker measurements has been highlighted previously [27, 29, 58–60]. The aforementioned issues reinforce the reason why a validation of any quantitative tool is mandatory.
The limitations of this validation study comprise the lack of stability assessment of samples (both long-term stability and freeze-thaw cycles effect) and of some kit’s components. It is also important to evaluate the reproducibility of the quantification in different laboratories, since it has been shown to be a critical aspect in the evaluation of other Aβ assays [29]. In agreement with this and to keep under control this important source of variability, ABtest is currently being provided as a service by a reference laboratory. Additionally, no clinical data have been included in this work; the clinical utility of ABtest is already under evaluation in independent studies with well-defined cohorts, and the corresponding manuscripts are in preparation. Besides these aspects, other sample-related potential factors that could affect Aβ determination, such as creatinine or total protein levels, should be evaluated to confirm the robustness of the test in clinical settings.
In conclusion, ABtest40 and ABtest42 have proven to be specific, sensitive, precise and accurate enough to quantify Aβ40 and Aβ42 at the levels existing in plasma. This validation gives reliability to any quantification with ABtest in a clinical trial environment, which brings to light its capabilities as a cost-effective tool for the determination of potential AD biomarkers in plasma. So far, Aβ40 and Aβ42 determinations in plasma, although of great scientific interest, have not been validated as a diagnostic tool in clinical settings. Hence, the next step should be the evaluation of the clinical utility of these measurements to validate the intended use of ABtest. Regarding this objective, several studies in consolidated and well-characterized populations are already being carried out.
ACKNOWLEDGMENTS
This work has been financed by Araclon Biotech Ltd. All the authors are full time employees at Araclon Biotech Ltd.
Authors’ disclosures available online (http://j-alz.com/manuscript-disclosures/16-0325r2).
Appendices
The supplementary material is available in the electronic version of this article: http://dx.doi.org/10.3233/JAD-160325.
REFERENCES
[1] | Selkoe DJ ((1991) ) The molecular pathology of Alzheimer’s disease. Neuron 6: , 487–498. |
[2] | ((2015) ) Alzheimer’s disease facts and figures. Alzheimers Dement 11: , 332–384. |
[3] | Montine TJ , Phelps CH , Beach TG , Bigio EH , Cairns NJ , Dickson DW , Duyckaerts C , Frosch MP , Masliah E , Mirra SS , Nelson PT , Schneider JA , Thal DR , Trojanowski JQ , Vinters HV , Hyman BT ((2012) ) National Institute on Aging-Alzheimer’s Association guidelines for the neuropathologic assessment of Alzheimer’s disease: A practical approach. Acta Neuropathol 123: , 1–11. |
[4] | Jack CR Jr , Knopman DS , Jagust WJ , Shaw LM , Aisen PS , Weiner MW , Petersen RC , Trojanowski JQ ((2010) ) Hypothetical model of dynamic biomarkers of the Alzheimer’s pathological cascade. Lancet Neurol 9: , 119–128. |
[5] | Villemagne VL , Burnham S , Bourgeat P , Brown B , Ellis KA , Salvado O , Szoeke C , Macaulay SL , Martins R , Maruff P , Ames D , Rowe CC , Masters CL ((2013) ) Amyloid beta deposition, neurodegeneration, and cognitive decline in sporadic Alzheimer’s disease: A prospective cohort study. Lancet Neurol 12: , 357–367. |
[6] | Sperling RA , Aisen PS , Beckett LA , Bennett DA , Craft S , Fagan AM , Iwatsubo T , Jack CR Jr , Kaye J , Montine TJ , Park DC , Reiman EM , Rowe CC , Siemers E , Stern Y , Yaffe K , Carrillo MC , Thies B , Morrison-Bogorad M , Wagster MV , Phelps CH ((2011) ) Toward defining the preclinical stages of Alzheimer’s disease: Recommendations from the National Institute on Aging-Alzheimer’s Association workgroups on diagnostic guidelines for Alzheimer’s disease. Alzheimers Dement 7: , 280–292. |
[7] | Hampel H , Burger K , Teipel SJ , Bokde AL , Zetterberg H , Blennow K ((2008) ) Core candidate neumical and imaging biomarkers of Alzheimer’s disease. Alzheimers Dement 4: , 38–48 roche. |
[8] | Shaw LM , Korecka M , Clark CM , Lee VM , Trojanowski JQ ((2007) ) Biomarkers of neurodegeneration for diagnosis and monitoring therapeutics. Nat Rev Drug Discov 6: , 295–303. |
[9] | Zhang S , Smailagic N , Hyde C , Noel-Storr AH , Takwoingi Y , McShane R , Feng J ((2014) ) (11)C-PIB-PET for the early diagnosis of Alzheimer’s disease dementia and other dementias in people with mild cognitive impairment (MCI). Cochrane Database Syst Rev 2014: , CD010386. |
[10] | Blennow K , Dubois B , Fagan AM , Lewczuk P , de Leon MJ , Hampel H ((2015) ) Clinical utility of cerebrospinal fluid biomarkers in the diagnosis of early Alzheimer’s disease. Alzheimers Dement 11: , 58–69. |
[11] | Bouwman FH , Schoonenboom NS , Verwey NA , van Elk EJ , Kok A , Blankenstein MA , Scheltens P , van der Flier WM ((2009) ) CSF biomarker levels in early and late onset Alzheimer’s disease. Neurobiol Aging 30: , 1895–1901. |
[12] | Blennow K ((2004) ) Cerebrospinal fluid protein biomarkers for Alzheimer’s disease. NeuroRx 1: , 213–225. |
[13] | Anoop A , Singh PK , Jacob RS , Maji SK ((2010) ) CSF biomarkers for Alzheimer’s disease diagnosis. Int J Alzheimers Dis 2010: , pii: 606802. |
[14] | Fagan AM , Perrin RJ ((2012) ) Upcoming candidate cerebrospinal fluid biomarkers of Alzheimer’s disease. Biomark Med 6: , 455–476. |
[15] | van OM , Hofman A , Soares HD , Koudstaal PJ , Breteler MM ((2006) ) Plasma Abeta(1-40) and Abeta(1-42) and the risk of dementia: A prospective case-cohort study. Lancet Neurol 5: , 655–660. |
[16] | Koyama A , Okereke OI , Yang T , Blacker D , Selkoe DJ , Grodstein F ((2012) ) Plasma amyloid-beta as a predictor of dementia and cognitive decline: A systematic review and meta-analysis. Arch Neurol 69: , 824–831. |
[17] | Chouraki V , Beiser A , Younkin L , Preis SR , Weinstein G , Hansson O , Skoog I , Lambert JC , Au R , Launer L , Wolf PA , Younkin S , Seshadri S ((2015) ) Plasma amyloid-beta and risk of Alzheimer’s disease in the Framingham Heart Study. Alzheimers Dement 11: , 249–257. |
[18] | Kaffashian S , Tzourio C , Soumare A , Dufouil C , Mazoyer B , Schraen-Maschke S , Buee L , Debette S ((2015) ) Association of plasma beta-amyloid with MRI markers of structural brain aging the 3-City Dijon study. Neurobiol Aging 36: , 2663–2670. |
[19] | Roberts KF , Elbert DL , Kasten TP , Patterson BW , Sigurdson WC , Connors RE , Ovod V , Munsell LY , Mawuenyega KG , Miller-Thomas MM , Moran CJ , Cross DT III , Derdeyn CP , Bateman RJ ((2014) ) Amyloid-beta efflux from the central nervous system into the plasma. Ann Neurol 76: , 837–844. |
[20] | Rembach A , Watt AD , Wilson WJ , Villemagne VL , Burnham SC , Ellis KA , Maruff P , Ames D , Rowe CC , Macaulay SL , Bush AI , Martins RN , Masters CL , Doecke JD ((2014) ) Plasma amyloid-beta levels are significantly associated with a transition toward Alzheimer’s disease as measured by cognitive decline and change in neocortical amyloid burden. J Alzheimers Dis 40: , 95–104. |
[21] | Toledo JB , Shaw LM , Trojanowski JQ ((2013) ) Plasma amyloid beta measurements - a desired but elusive Alzheimer’s disease biomarker. Alzheimers Res Ther 5: , 8. |
[22] | Schneider P , Hampel H , Buerger K ((2009) ) Biological marker candidates of Alzheimer’s disease in blood, plasma, and serum. CNS Neurosci Ther 15: , 358–374. |
[23] | Kuo YM , Emmerling MR , Lampert HC , Hempelman SR , Kokjohn TA , Woods AS , Cotter RJ , Roher AE ((1999) ) High levels of circulating Abeta42 are sequestered by plasma proteins in Alzheimer’s disease. Biochem Biophys Res Commun 257: , 787–791. |
[24] | Costa M , Ortiz AM , Jorquera JI ((2012) ) Therapeutic albumin binding to remove amyloid-beta. J Alzheimers Dis 29: , 159–170. |
[25] | Sagare AP , Deane R , Zetterberg H , Wallin A , Blennow K , Zlokovic BV ((2011) ) Impaired lipoprotein receptor-mediated peripheral binding of plasma amyloid-beta is an early biomarker for mild cognitive impairment preceding Alzheimer’s disease. J Alzheimers Dis 24: , 25–34. |
[26] | Biere AL , Ostaszewski B , Stimson ER , Hyman BT , Maggio JE , Selkoe DJ ((1996) ) Amyloid beta-peptide is transported on lipoproteins and albumin in human plasma. J Biol Chem 271: , 32916–32922. |
[27] | Watt AD , Perez KA , Rembach AR , Masters CL , Villemagne VL , Barnham KJ ((2012) ) Variability in blood-based amyloid-beta assays: The need for consensus on pre-analytical processing. J Alzheimers Dis 30: , 323–336. |
[28] | Leitao MJ , Baldeiras I , Herukka SK , Pikkarainen M , Leinonen V , Simonsen AH , Perret-Liaudet A , Fourier A , Quadrio I , Veiga PM , de Oliveira CR ((2015) ) Chasing the effects of pre-analytical confounders - a multicenter study on CSF-AD biomarkers. Front Neurol 6: , 153. |
[29] | Bjerke M , Portelius E , Minthon L , Wallin A , Anckarsater H , Anckarsater R , Andreasen N , Zetterberg H , Andreasson U , Blennow K ((2010) ) Confounding factors influencing amyloid Beta concentration in cerebrospinal fluid. Int J Alzheimers Dis 2010: , pii: 986310. |
[30] | Toombs J , Paterson RW , Lunn MP , Nicholas JM , Fox NC , Chapman MD , Schott JM , Zetterberg H ((2013) ) Identification of an important potential confound in CSF AD studies: Aliquot volume. Clin Chem Lab Med 51: , 2311–2317. |
[31] | Pesini P , Perez-Grijalba V , Monleon I , Boada M , Tarraga L , Martinez-Lage P , San-Jose I , Sarasa M ((2012) ) Reliable measurements of the beta-amyloid pool in blood could help in the early diagnosis of AD. Int J Alzheimers Dis 2012: , 604141. doi: 10.1155/2012/604141 |
[32] | U.S. Department of Health and Human Services Food and Drug Administration Center for Drug Evaluation and Research (CDER) Center for Veterinary Medicine (CVM) ((2013) ) Guidance for Industry. Bionalytical Method Validation. |
[33] | European medicines agency ((2015) ) Guideline on bionalytical method validation. |
[34] | Andreasson U , Perret-Liaudet A , van Waalwijk van Doorn LJ , Blennow K , Chiasserini D , Engelborghs S , Fladby T , Genc S , Kruse N , Kuiperij HB , Kulic L , Lewczuk P , Mollenhauer B , Mroczko B , Parnetti L , Vanmechelen E , Verbeek MM , Winblad B , Zetterberg H , Koel-Simmelink M , Teunissen CE ((2015) ) A practical guide to immunoassay method validation. Front Neurol 6: , 179. |
[35] | Pierson-Perry JF , Vacks JE , Durham AP , Fischer C , Guenbrunner C , Hillyard D , Kondratovich MV , Ladwig P , Middleberg RA ((2012) ) EP17-A2: Evaluation of detection capability for clinical laboratory measurement procedures; Approved guideline-Second edition. Clinical Standards Laboratory Institute 32: (8). |
[36] | D’Arrigo C , Tabaton M , Perico A ((2009) ) N-terminal truncated pyroglutamyl beta amyloid peptide Abetapy3-42 shows a faster aggregation kinetics than the full-length Abeta1-42. Biopolymers 91: , 861–873. |
[37] | Wittnam JL , Portelius E , Zetterberg H , Gustavsson MK , Schilling S , Koch B , Demuth HU , Blennow K , Wirths O , Bayer TA ((2012) ) Pyroglutamate A(beta) aggravates behavioral deficits in 5XFAD mice. J Biol Chem 287: , 8154–8162. |
[38] | Lachno DR , Evert BA , Maloney K , Willis BA , Talbot JA , Vandijck M , Dean RA ((2014) ) Validation and clinical utility of ELISA methods for quantification of amyloid-beta peptides in cerebrospinal fluid specimens from Alzheimer’s disease studies. J Alzheimers Dis 45: , 527–542. |
[39] | Lachno DR , Emerson JK , Vanderstichele H , Gonzales C , Martenyi F , Konrad RJ , Talbot JA , Lowe SL , Oefinger PE , Dean RA ((2012) ) Validation of a multiplex assay for simultaneous quantification of amyloid-beta peptide species in human plasma with utility for measurements in studies of Alzheimer’s disease therapeutics. J Alzheimers Dis 32: , 905–918. |
[40] | Lachno DR , Evert BA , Vanderstichele H , Robertson M , Demattos RB , Konrad RJ , Talbot JA , Racke MM , Dean RA ((2013) ) Validation of assays for measurement of amyloid-beta peptides in cerebrospinal fluid and plasma specimens from patients with Alzheimer’s disease treated with solanezumab. J Alzheimers Dis 34: , 897–910. |
[41] | Lewczuk P , Kornhuber J , Vanmechelen E , Peters O , Heuser I , Maier W , Jessen F , Burger K , Hampel H , Frolich L , Henn F , Falkai P , Ruther E , Jahn H , Luckhaus C , Perneczky R , Schmidtke K , Schroder J , Kessler H , Pantel J , Gertz HJ , Vanderstichele H , De MG , Shapiro F , Wolf S , Bibl M , Wiltfang J ((2010) ) Amyloid beta peptides in plasma in early diagnosis of Alzheimer’s disease: A multicenter study with multiplexing. Exp Neurol 223: , 366–370. |
[42] | Hansson O , Zetterberg H , Vanmechelen E , Vanderstichele H , Andreasson U , Londos E , Wallin A , Minthon L , Blennow K ((2010) ) Evaluation of plasma Abeta(40) and Abeta(42) as predictors of conversion to Alzheimer’s disease in patients with mild cognitive impairment. Neurobiol Aging 31: , 357–367. |
[43] | Yaffe K , Weston A , Graff-Radford NR , Satterfield S , Simonsick EM , Younkin SG , Younkin LH , Kuller L , Ayonayon HN , Ding J , Harris TB ((2011) ) Association of plasma beta-amyloid level and cognitive reserve with subsequent cognitive decline. JAMA 305: , 261–266. |
[44] | Blennow K , De MG , Hansson O , Minthon L , Wallin A , Zetterberg H , Lewczuk P , Vanderstichele H , Vanmechelen E , Kornhuber J , Wiltfang J , Heuser I , Maier W , Luckhaus C , Ruther E , Hull M , Jahn H , Gertz HJ , Frolich L , Hampel H , Pernetzki R ((2009) ) Evolution of Abeta42 and Abeta40 levels and Abeta42/Abeta40 ratio in plasma during progression of Alzheimer’s disease: A multicenter assessment. J Nutr Health Aging 13: , 205–208. |
[45] | Seppala TT , Herukka SK , Hanninen T , Tervo S , Hallikainen M , Soininen H , Pirttila T ((2010) ) Plasma Abeta42 and Abeta40 as markers of cognitive change in follow-up: A prospective, longitudinal, population-based cohort study. J Neurol Neurosurg Psychiatry 81: , 1123–1127. |
[46] | Graff-Radford NR , Crook JE , Lucas J , Boeve BF , Knopman DS , Ivnik RJ , Smith GE , Younkin LH , Petersen RC , Younkin SG ((2007) ) Association of low plasma Abeta42/Abeta40 ratios with increased imminent risk for mild cognitive impairment and Alzheimer disease. Arch Neurol 64: , 354–362. |
[47] | Deane R , Bell RD , Sagare A , Zlokovic BV ((2009) ) Clearance of amyloid-beta peptide across the blood-brain barrier: Implication for therapies in Alzheimer’s disease. CNS Neurol Disord Drug Targets 8: , 16–30. |
[48] | Perez-Grijalba V , Pesini P , Monleon I , Boada M , Tarraga L , Ruiz-Laza A , Martinez-Lage P , San-Jose I , Sarasa M ((2013) ) Several direct and calculated biomarkers from the amyloid-beta pool in blood are associated with an increased likelihood of suffering from mild cognitive impairment. J Alzheimers Dis 36: , 211–219. |
[49] | Pesini P , Perez-Grijalba V , Fandos N , Olmos S , Bossa M , Masters CL , Villemagne VL , Doecke JD , Fowler CJ , Rembach A , Sarasa M , The AIBL, Research Group ((2015) ) Assessment of plasma AB markers to estimate dichotomic amyloid PET among cognitively healthy people. J Prev Alzheimers Dis 2: , 280–281. |
[50] | Fagan AM , Perez-Grijalba V , Fandos N , Pesini P , Olmos S , Bossa M , Sarasa M , The ACS, Research Group ((2015) ) Longitudinal plasma biomarker changes in middle-aged individuals at risk for Alzheimer disease. J Prev Alzheimers Dis 2: , 304–305. |
[51] | Gabelle A , Richard F , Gutierrez LA , Schraen S , Delva F , Rouaud O , Buee L , Dartigues JF , Touchon J , Lambert JC , Berr C ((2013) ) Plasma amyloid-beta levels and prognosis in incident dementia cases of the 3-City Study. J Alzheimers Dis 33: , 381–391. |
[52] | Hansson O , Stomrud E , Vanmechelen E , Ostling S , Gustafson DR , Zetterberg H , Blennow K , Skoog I ((2012) ) Evaluation of plasma Abeta as predictor of Alzheimer’s disease in older individuals without dementia: A population-based study. J Alzheimers Dis 28: , 231–238. |
[53] | Toledo JB , Vanderstichele H , Figurski M , Aisen PS , Petersen RC , Weiner MW , Jack CR Jr , Jagust W , Decarli C , Toga AW , Toledo E , Xie SX , Lee VM , Trojanowski JQ , Shaw LM ((2011) ) Factors affecting Abeta plasma levels and their utility as biomarkers in ADNI. Acta Neuropathol 122: , 401–413. |
[54] | Schupf N , Zigman WB , Tang MX , Pang D , Mayeux R , Mehta P , Silverman W ((2010) ) Change in plasma Ass peptides and onset of dementia in adults with Down syndrome. Neurology 75: , 1639–1644. |
[55] | Lui JK , Laws SM , Li QX , Villemagne VL , Ames D , Brown B , Bush AI , De RK , Dromey J , Ellis KA , Faux NG , Foster J , Fowler C , Gupta V , Hudson P , Laughton K , Masters CL , Pertile K , Rembach A , Rimajova M , Rodrigues M , Rowe CC , Rumble R , Szoeke C , Taddei K , Taddei T , Trounson B , Ward V , Martins RN , Research AIBL Group ((2010) ) Plasma amyloid-beta as a biomarker in Alzheimer’s disease: The AIBL study of aging. J Alzheimers Dis 20: , 1233–1242. |
[56] | Sundelof J , Giedraitis V , Irizarry MC , Sundstrom J , Ingelsson E , Ronnemaa E , Arnlov J , Gunnarsson MD , Hyman BT , Basun H , Ingelsson M , Lannfelt L , Kilander L ((2008) ) Plasma beta amyloid and the risk of Alzheimer disease and dementia in elderly men: A prospective, population-based cohort study. Arch Neurol 65: , 256–263. |
[57] | Mayeux R , Honig LS , Tang MX , Manly J , Stern Y , Schupf N , Mehta PD ((2003) ) Plasma A[beta]40 and A[beta]42 and Alzheimer’s disease: Relation to age, mortality, and risk. Neurology 61: , 1185–1190. |
[58] | Lachno DR , Vanderstichele H , De GG , Kostanjevecki V , De MG , Siemers ER , Willey MB , Bourdage JS , Konrad RJ , Dean RA ((2009) ) The influence of matrix type, diurnal rhythm and sample collection and processing on the measurement of plasma beta-amyloid isoforms using the INNO-BIA plasma Abeta forms multiplex assay. J Nutr Health Aging 13: , 220–225. |
[59] | Mattsson N , Zetterberg H , Blennow K ((2010) ) Lessons from multicenter studies on CSF biomarkers for Alzheimer’s disease. Int J Alzheimers Dis 2010: , pii: 610613. |
[60] | Vanderstichele H , Bibl M , Engelborghs S , Le BN , Lewczuk P , Molinuevo JL , Parnetti L , Perret-Liaudet A , Shaw LM , Teunissen C , Wouters D , Blennow K ((2012) ) Standardization of preanalytical aspects of cerebrospinal fluid biomarker testing for Alzheimer’s disease diagnosis: A consensus paper from the Alzheimer’s Biomarkers Standardization Initiative. Alzheimers Dement 8: , 65–73. |
Figures and Tables
Fig.1
Precision parameters for ABtest40 and ABtest42. Intra-assay (A), inter-assay (B), and inter-batch (C) mean variability for each concentration level studied. CV, coefficient of variation. LLOQ (concentration close to the lower limit of quantification of the dynamic range of the assay): 16.09 pg/ml Aβ40, 18.84 pg/ml Aβ42. LOW: 30.01 pg/ml Aβ40, 26.89 pg/ml Aβ42. MID (middle concentration): 53.44 pg/ml Aβ40, 55.96 pg/ml Aβ42. HIGH: 113.55 pg/ml Aβ40, 89.16 pg/ml Aβ42. ULOQ (concentration close to the upper limit of quantification of the dynamic range): 191.91 pg/ml Aβ40, 162.35 pg/ml Aβ42.
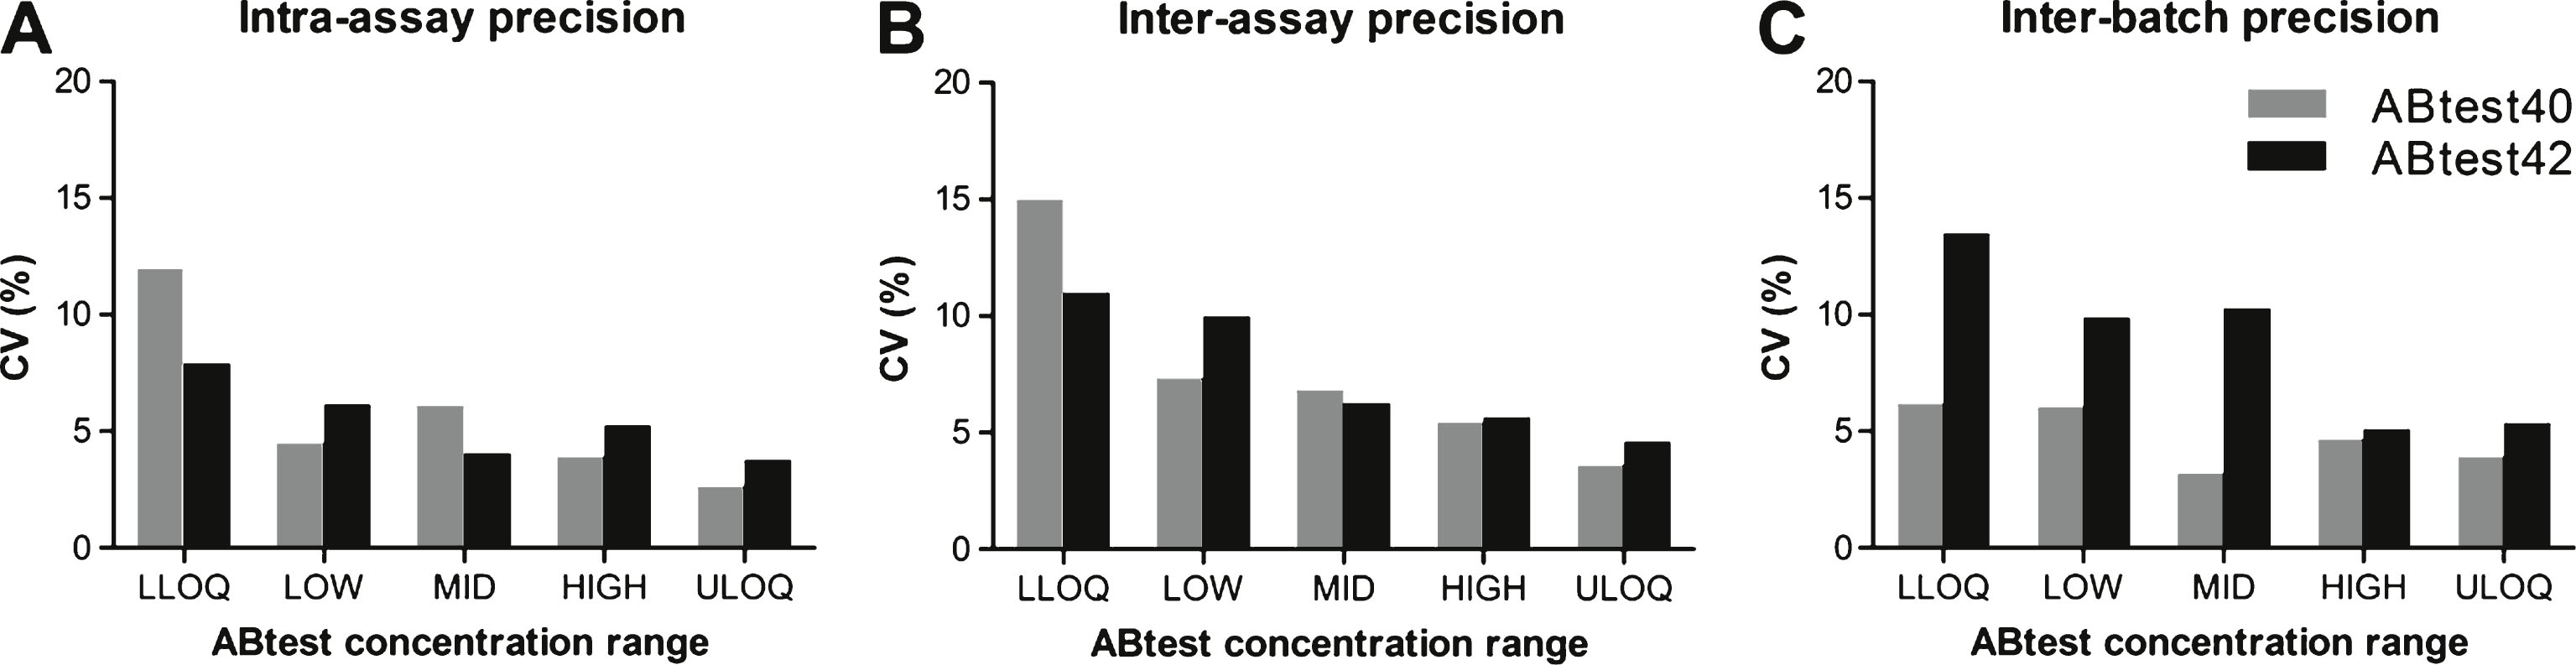
Fig.2
Accuracy in the quantification with ABtest40 and ABtest42. Each point represents the relative error (RE) in percentage in each of the 36 determinations carried out at each concentration level regarding the theoretical concentration of the plasma sample. LLOQ: concentration close to the lower limit of quantification of the dynamic range of the assay. MID: middle concentration. ULOQ: concentration close to the upper limit of quantification of the dynamic range.
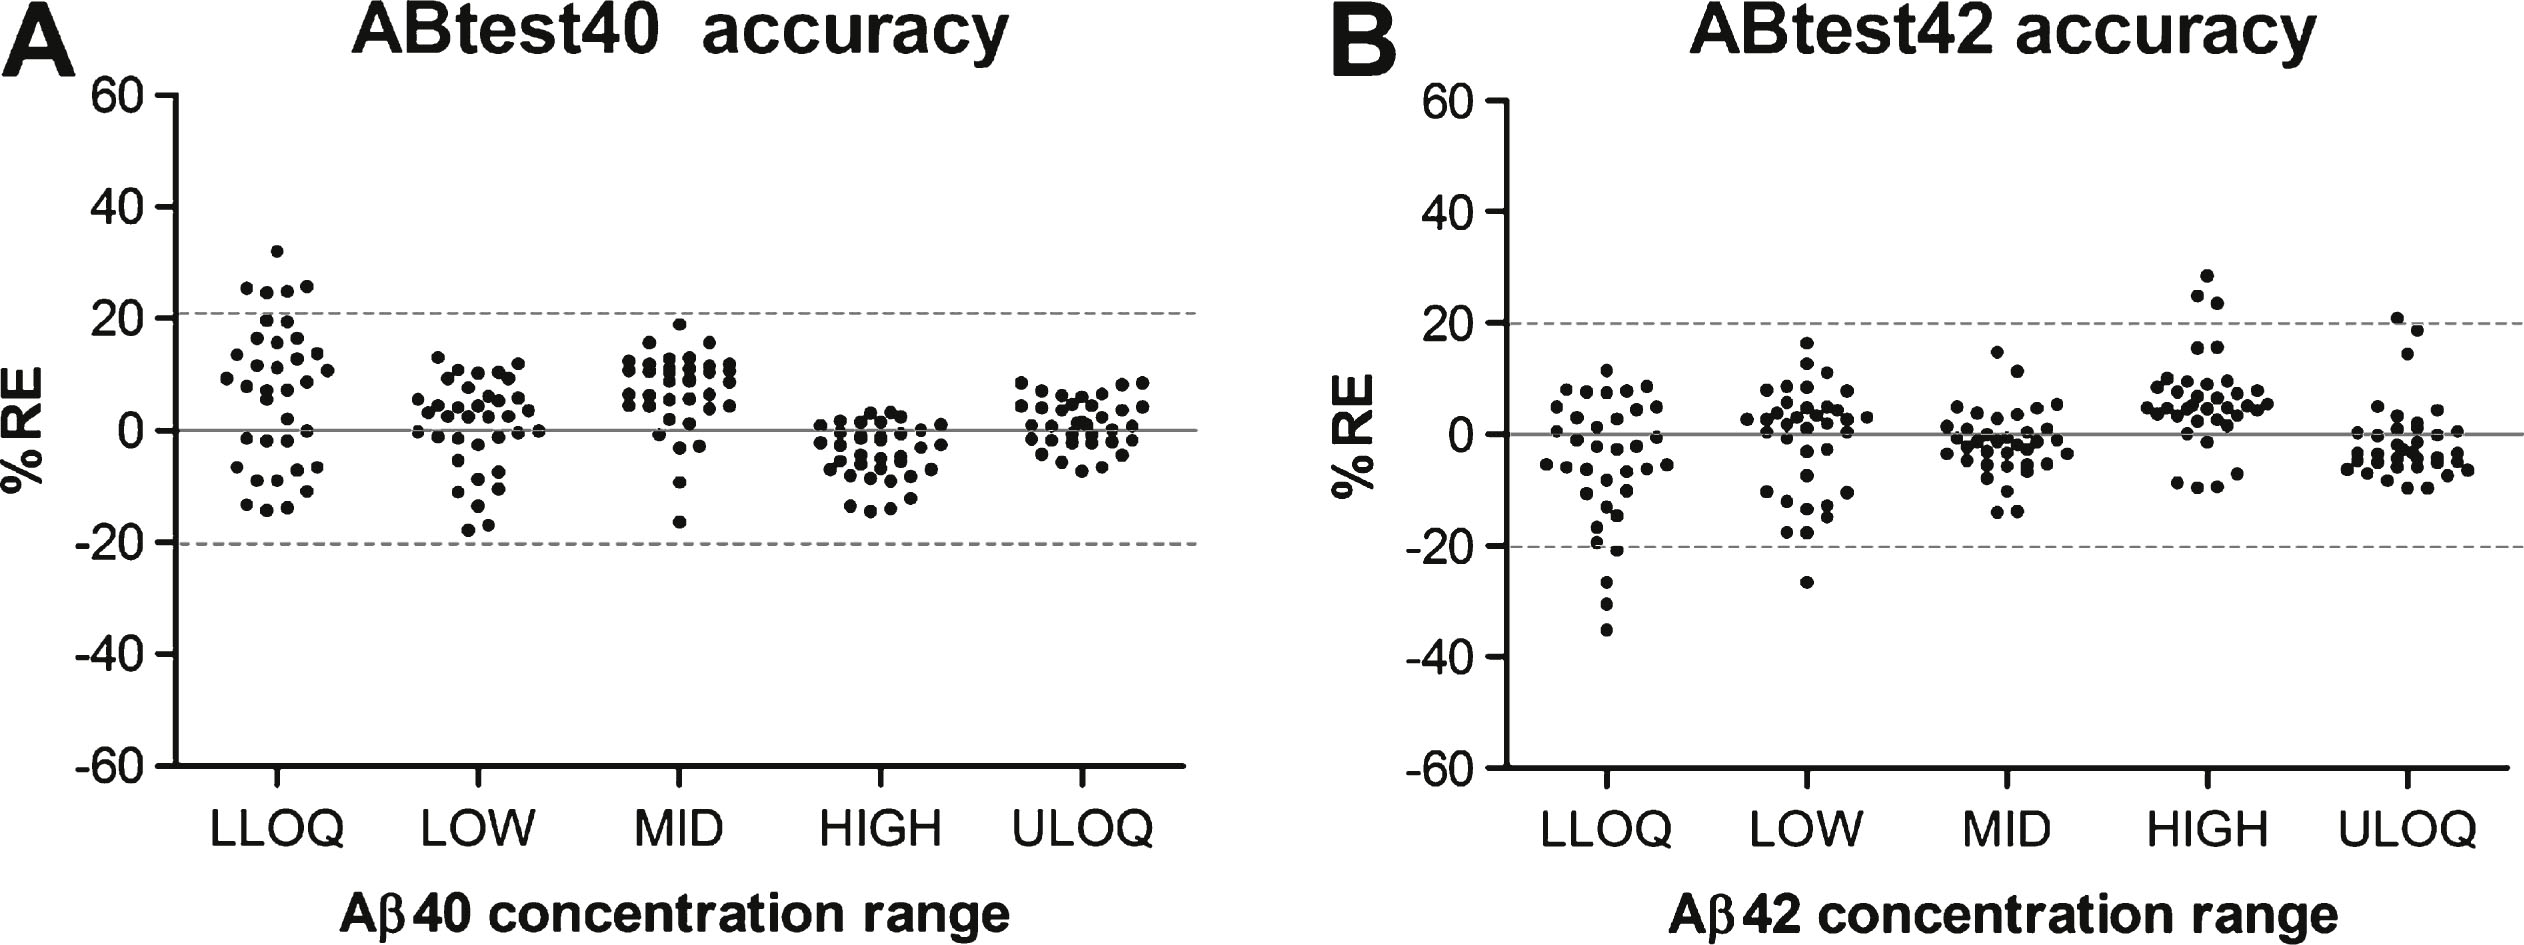
Fig.3
Dilution linearity of ABtest40 and ABtest42. Linearity was evaluated by three-, six- and nine-fold serial dilution from five undiluted plasma samples, either in a standard saline buffer as PBS or in Sample/Standard Diluent. Panels A and B represent the association of the signal obtained with respect to the dilution performed for Aβ40 and Aβ42, respectively. Panels C and D show the association of the corrected concentration (after applying the corresponding dilution factor) obtained with regard to dilution, for Aβ40 and Aβ42, respectively. Each point represents the mean response or concentration obtained for the five samples. Bars represent the standard mean error.
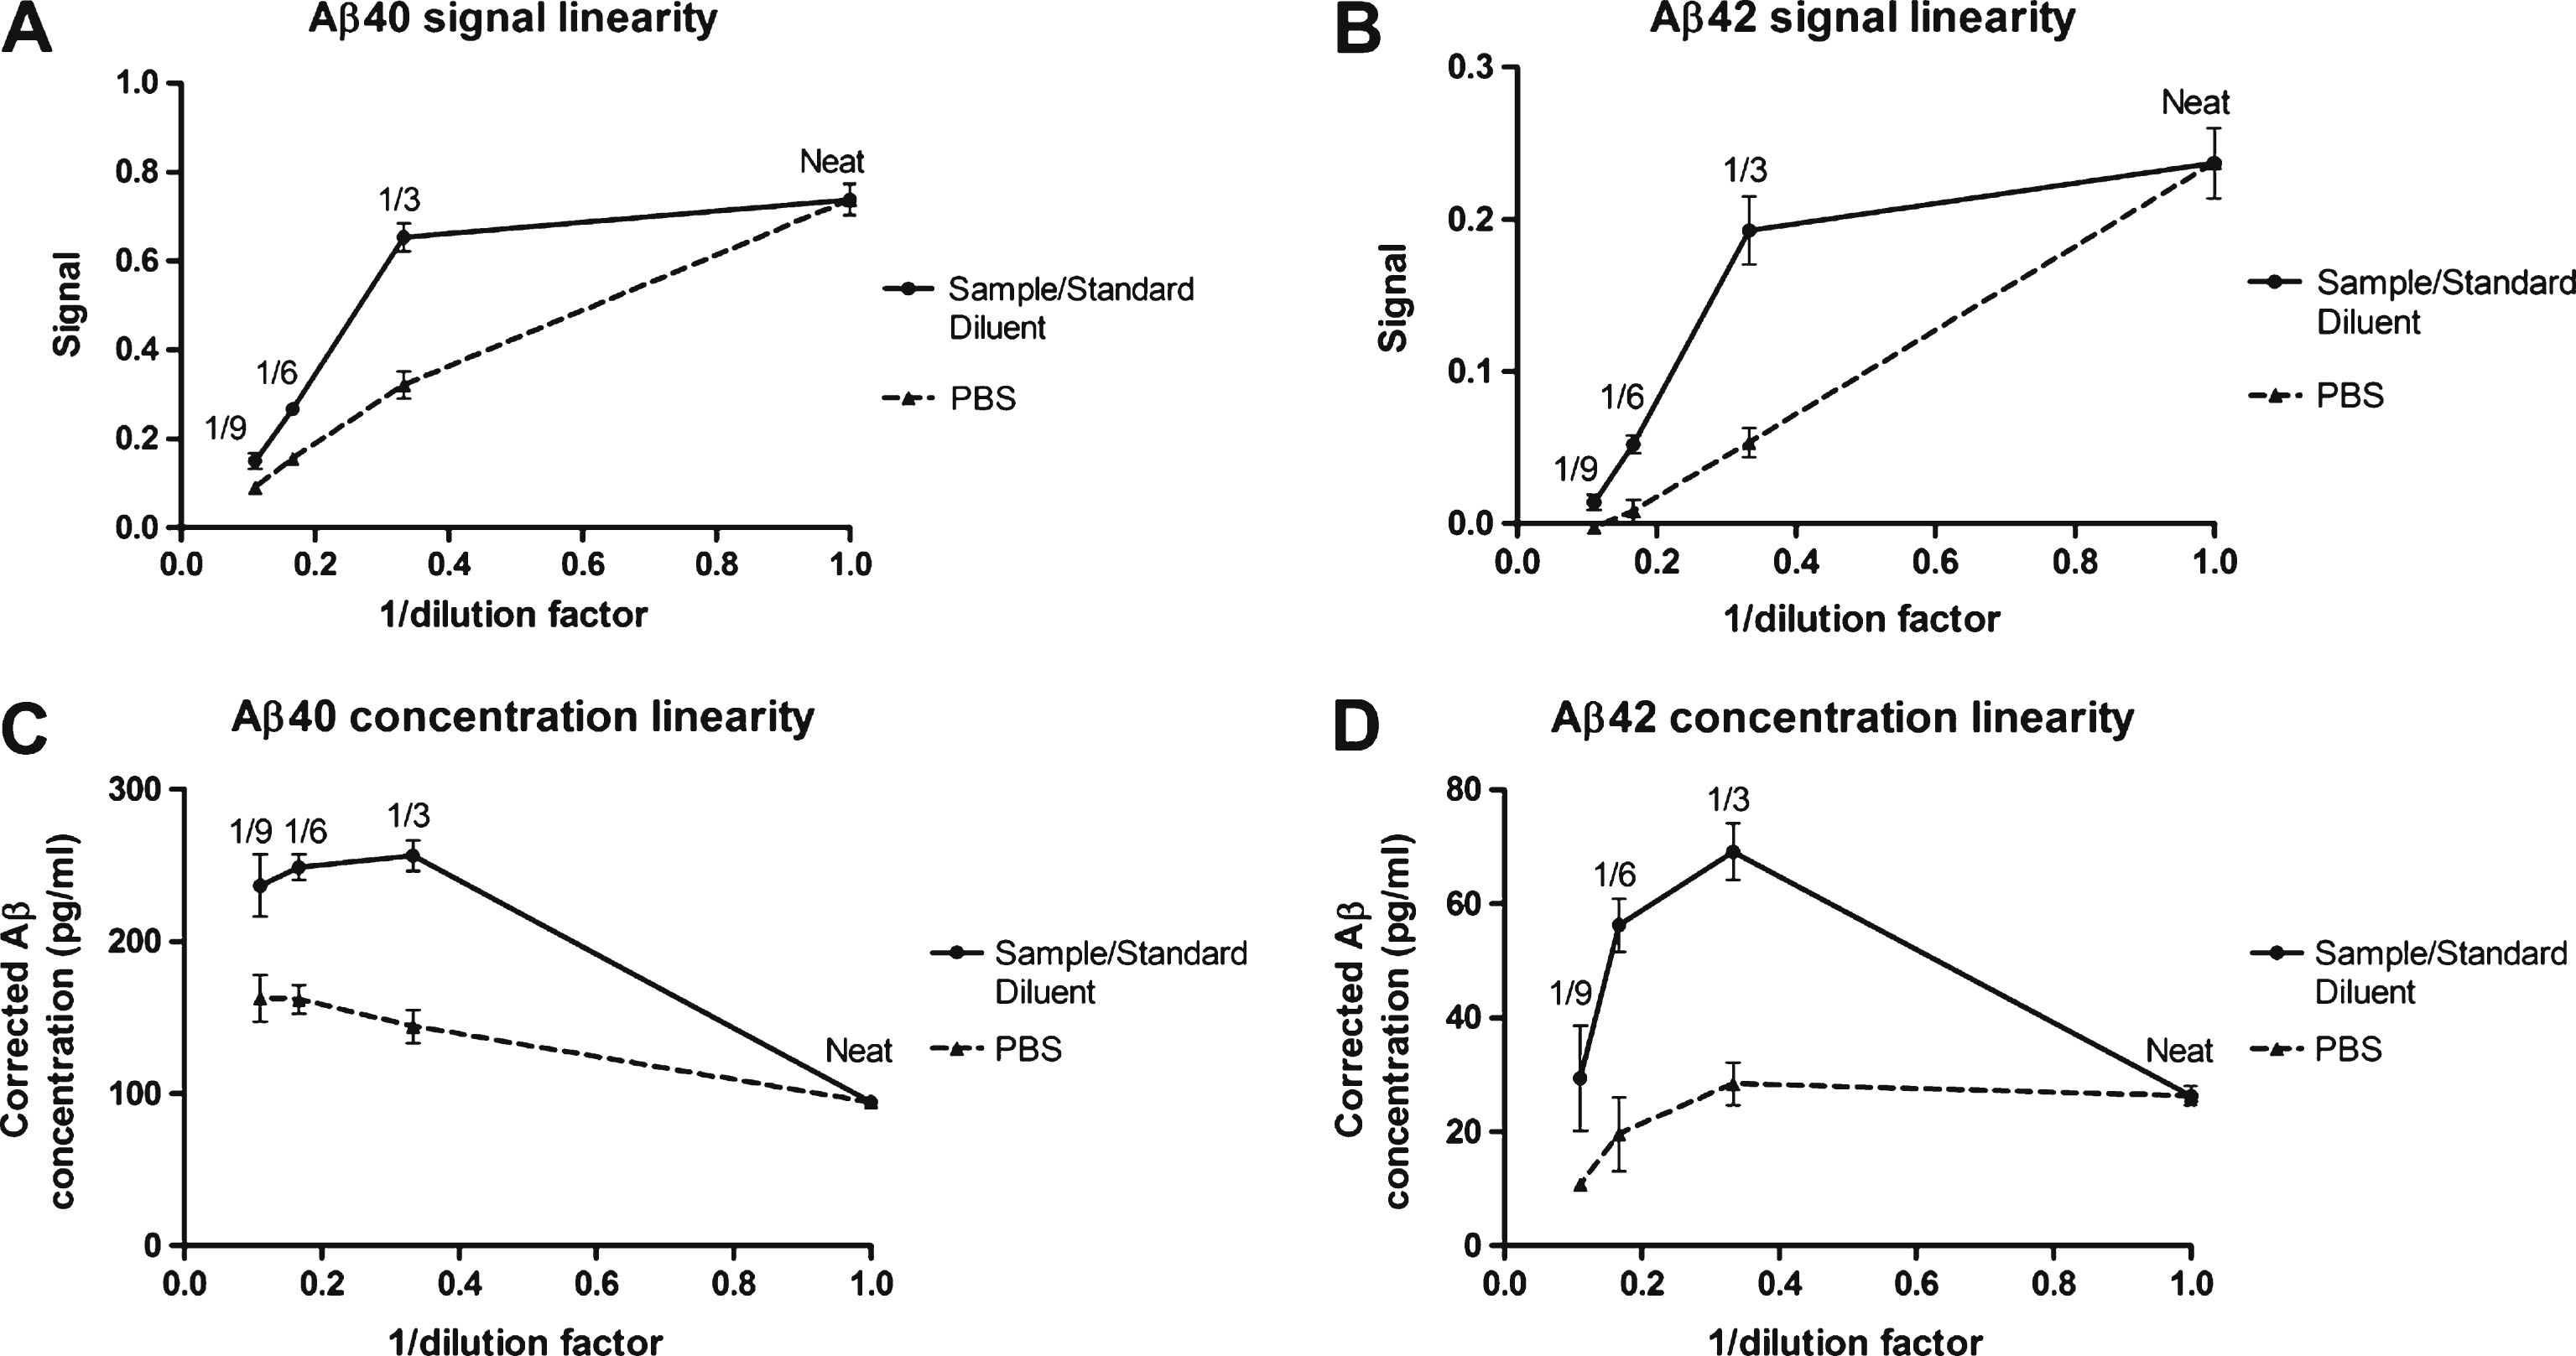
Table 1
Summary of validation results for ABtest40 and ABtest42 quantification of Aβ40 and Aβ42 in plasma
| Validation parameter | ABtest40 | ABtest42 | |||
| Mean | Range | Mean | Range | ||
| Calibration | Quantification range (pg/ml) | 3.125 to 200 pg/ml | 3.125 to 200 pg/ml | ||
| Accuracy, RE (%) | 4.5 | –17.2 to 12.4 | 2.9 | –12.4 to 8.4 | |
| Precision, CV (%) | 5.2 | 0.5 to 11.7 | 4.2 | 0.2 to 19.7 | |
| Precision | Intra-assay, CV (%) | 5.8 | 3.9 to 12.0 | 5.4 | 3.8 to 7.9 |
| Inter-assay, CV (%) | 7.7 | 3.6 to 15.0 | 7.5 | 4.6 to 11.0 | |
| Inter-batch, CV (%) | 4.8 | 3.2 to 6.2 | 8.8 | 5.1 to 13.5 | |
| Accuracy | 7.2 | –17.8 to 32.1 | 7.1 | –35.2 to 28.4 | |
| Spike recovery | Undiluted plasma, recovery (%) | 60.4 | 39.9 to 82.7 | 63.6 | 53.6 to 85.4 |
| Diluted plasma, recovery (%) | 96.0 | 82.1 to 122.0 | 94.9 | 81.9 to 125.2 | |
| Specificity | Cross-reactivity (%) | 0.0 to 1.4% | 0.8 to 4.1% | ||
| Sensitivity | Limit of quantification (pg/ml) | 7.60 | 3.60 | ||
RE, relative error; CV, coefficient of variation. The calibration method was evaluated in terms of accuracy (with the back-calculated calibrator concentration) and precision of the calibrator duplicates.

