
Gene Expression of Quaking in Sporadic Alzheimer’s Disease Patients is Both Upregulated and Related to Expression Levels of Genes Involved in Amyloid Plaque and Neurofibrillary Tangle Formation
Abstract
Quaking (QKI) is a gene exclusively expressed within glial cells. QKI has previously been implicated in various neurological disorders and diseases, including Alzheimer’s disease (AD), a condition for which increasing evidence suggests a central role of glia cells. The objective of the present study was to investigate the expression levels of QKI and three QKI isoforms (QKI5, QKI6, and QKI7) in AD. Genes that have previously been related to the ontogeny and progression of AD, specifically APP, PSEN1, PSEN2, and MAPT, were also investigated. A real-time PCR assay of 123 samples from human postmortem sporadic AD patients and control brains was performed. The expression values were analyzed with an analysis of covariance model and subsequent multiple regressions to explore the possibility of related expression values between QKI, QKI isoforms, and AD-related genes. Further, the sequences of AD-related genes were analyzed for the presence of QKI binding domains. QKI and all measured QKI isoforms were found to be significantly upregulated in AD samples, relative to control samples. However, APP, PSEN1, PSEN2, and MAPT were not found to be significantly different. QKI and QKI isoforms were found to be predictive for the variance of APP, PSEN1, PSEN2, and MAPT, and putative QKI binding sites suggests an interaction with QKI. Overall, these results implicate a possible role of QKI in AD, although the exact mechanism by which this occurs remains to be uncovered.
INTRODUCTION
Alzheimer’s disease (AD) is an incurable neurodegenerative disorder, affecting 6% of the population over the age of 65 and a total of 35 million patients in the world as of 2010 [1]. Pathologically, it is primarily characterized by the appearance of both amyloid-β (Aβ) aggregates and neurofibrillary tangles (NFT), accompanied by a progressive loss of neurons in the cortex. Two primary forms of AD are known: familiar (fAD, or early-onset), and sporadic (sAD, or late-onset), the latter of which comprises 95–99% of all AD cases [2, 3]. fAD is an autosomal dominant inherited form of the disease that most often results from mutations in one of the three genes amyloid precursor protein (APP) [4, 5], presenilin 1 (PSEN1) [6], and presenilin 2 (PSEN2) [7]. Despite the high heritability rates for sAD (79%) [8], robust genetic components underlying the emergence of sAD have remained elusive. Although the etiology of sAD and fAD differs, both forms of AD share the same clinical picture, although fAD has an earlier age of onset.
In addition to neurons, glia cells have a central role in brain physiology in health and disease, by maintaining homeostasis in the brain. In AD, several glial cell processes are affected. Astrocytes and microglia mediate chronic neuroinflammation and oxidative stress, contributing to the AD pathogenesis [9]. In addition, activation of both astrocytes and microglia has been linked with the formation of Aβ aggregates [10, 11]. An important glial protein, myelin basic protein (MBP), integral to myelin formation by oligodendrocytes and Schwann cells, has been colocalized with Aβ in human AD brain and was increased in AD brains possibly by axonal damage [12]. Moreover, MBP has been shown to interfere with Aβ fibrillation [13–15]. Glial fibrillary acid protein (GFAP), a protein essential for astrogliosis, is also found to be upregulated in human AD brain tissue [16–18]. In postmortem brains of sAD patients, oligodendrocyte-linked myelin deficits have been observed [19]. More recently, alterations in myelination and oligodendrocyte status have been documented, even prior to tau and Aβ pathology, and have been discussed as an early therapeutic target [20, 21].
In a microarray screening of human hippocampal postmortem brain tissue from sAD patients and control samples, a gene exclusively expressed in glia cells, quaking (QKI) was among a group of differentially expressed genes, increasing in accordance with AD severity [22]. In addition to sAD, QKI has also been associated with other neurological diseases such as schizophrenia [23, 24], glioblastoma, and ataxia (reviewed by Chenard et al. [25]). QKI is a glial cell-expressed RNA binding protein [26] and a member of the STAR (Signal Transduction and Activation of RNA) protein family. Animal studies have shown that QKI modulates splicing, export, and stability of RNA, as well as mRNA processing [27]. Five isoforms of QKI have been identified, QKI5, QKI6, QKI6B, QKI7, and QKI7B [28], with each transcript differing in their C-terminal amino acids [29]. QKI5 is located in the nucleus, while QKI6 and QKI7 are primarily found in the cytoplasm [25, 29]. Early studies have identified a role for QKI in myelin formation [30] which occurs by promoting oligodendroglia differentiation [31], regulating the expression of MBP [32], GFAP [33] and the splicing of myelin-associated glycoprotein (MAG) [34]. Recently, we showed that QKI is not only expressed in human oligodendroglia cells but also in astrocytes, indicating an involvement in regulating glia cell function [33]. Thus, QKI could be of particular interest for studying diseases associated with glia cell and myelin dysfunction, including neurodegenerative diseases such as AD.
In this study, we aimed to further examine different isoforms of QKI in relation to sAD by quantifying gene expressions in the frontal cortex of human postmortem samples, followed by a linear regression to examine the relationship between QKI and other genes associated with the pathological hallmarks of sAD, i.e., APP, PSEN1, PSEN2, and MAPT.
MATERIALS AND METHODS
Postmortem brain tissue samples
Postmortem human brain samples (n = 123) were provided by the Maudsley Brain Bank (Department of Neuropathology, Institute of Psychiatry, King’s College, London, United Kingdom). The samples consisted of tissue from the frontal cortex, specifically Brodmann areas 8 and 9. In the cohort, 62 samples were taken from patients diagnosed with sAD (consisting of 31 females and 31 males) and 61 from individuals without any psychiatric disorder (consisting of 30 females and 31 males). All patients were CERAD-positive.
RNA and mRNA purification
Each autopsy sample was divided into 50–100 mg of tissue and homogenized in 2 ml of TRIzol reagent (Life Technologies) using an Ultra-Turrax T25 basic homogenizer (IKA Laboratory Equipment). The samples were stored at –70°C prior to use. RNA extraction from the homogenized sample was performed by phenol-chloroform extraction. The mRNA was subsequently isolated with magnetic beads (PolyATtract mRNA Isolation Systems, Promega), as described previously [35]. The total quantity of RNA and mRNA was measured with RiboGreen, RNA Quantification Reagent kit (Molecular Probes). The samples were concentrated using Microcon-30kDa Centrifugal Filter (Millipore Corporation). RNA quality was assessed by gel electrophoresis.
Real-time RT-PCR
Two replicate mRNA samples (10 μg RNA per sample) were reverse transcribed from each of the 123 individuals (SuperScript Reverse Transcriptase, Life Technologies). The cDNA from each sample was individually placed into a single well of an optical 96-well reaction plate (Applied Biosystems), and was subsequently diluted at a ratio of 1:20. Replica plates were produced, dried, and then stored at 4°C. A set of three 96-well plates (sample sets) were used for each gene measurement, covering the total duplicates of 62 sAD patients and 61 controls, a standard curve and negative control samples.
For each well of cDNA in the 96-well replica plates, 16 μl of TaqMan Universal master mix (Thermo Fisher Scientific) was added to each cDNA sample dissolved in 4 μl RNase-free water. Gene expression measurements (Applied Biosystems 7500 Real-Time PCR System, Thermo Fisher Scientific) were conducted according to standard protocol: 50°C for 2 min (Uracil-N-glycosylase incubation) and 95°C for 10 min (AmpliTaq Gold Activation), followed by 40 cycles of 95°C for 15 s and 60°C for 1 min. Expression data were collected from the ABI 7500 software, in which expression for each gene was quantified using a standard curve. Primers and probes for APP (Hs00169098_m1), PSEN1 (Hs00240518_m1), PSEN2 (Hs00240982_m1), and MAPT (Hs00213491_m1) were ordered from Applied Biosystems as Assay-on-Demand (TaqMan Gene Expression Assay, Thermo Fisher Scientific), while primers for the control genes beta-actin (ACTB), glyceraldehyde-3-phosphate dehydrogenase (GAPDH), and QKI pan (primers detecting all QKI isoforms), QKI5, QKI5 and QKI7 were designed in Primer Express Software (Thermo Fisher Scientific). Gene specific primer sets were as follows for ACTB, 5’-GAGCTACGAGCTGCCTGACG -3’ and 5’-GTAGTTTCGTGGATGCCACAGGACT-3’; GAPDH, 5’-AGCTCACTGGATGGCCTT-3’ and 5’-TTCTAGACGGCAGGTCAGGTC-3’; QKI pan, 5’-GCACCTACAGAGATGCCAACATTA-3’ and 5’-CTGGGCTGTTGCTGCAAGA-3’; QKI5, 5’-AATCCTTGAGTATCCTATTGAACCTAGT-3’ and 5’-GCATATCGTGCCTTCGAACTTT-3’; QKI6, 5’-AGCTACATCAATCCTTGAGTATCCTATTG-3’ and 5’-TAGCCTTTCGTTGGGAAAGC-3’; QKI7, 5’-GCTACATCAATCCTTGAGTATCCTATTG-3’ and 5’-CAGGCATGACTGGCATTTCA-3’.
Statistical analysis
In total, 246 sample measurements were made from all three plates. There were 7, 27, 10, and 7 missing data points for QKI pan, QKI5, QKI6, and QKI7, respectively. As the data collection was performed with duplicates, few samples were missing entirely (3 sAD and 2 Control samples from QKI5 measurements, and 1 sAD sample from QKI7). Additionally, we implemented an expectation-maximization algorithm to model the missing data points, as it has been shown that non-detects in qPCR data are not likely to be missing at random, and that conventional approaches to handling non-detects can lead to bias [36]. The missing data values were thus inferred from a likelihood of values, given the distribution of the data. The algorithm produced iterative steps of expectations of the missing values, and produced a maximum likelihood estimate of the underlying data. This was performed until convergence, and the data were accepted. The data were then base-10 log-transformed before further analysis.
An analysis of covariance (ANCOVA) model was used to determine if the detected mRNA expression for QKI pan, QKI5, QKI6, and QKI7 was significantly related to (or affected by) the status of the brain sample. The model included the factors of disease status (i.e., AD or control), sex, qPCR plate, and the covariates of age at death, time postmortem, and the geometric mean of mRNA levels of ACTB and GAPDH (reference genes). Estimated marginal means from the model were used in the calculation of fold change differences. The mRNA level of genes associated with the emergence of AD were also measured and tested with the model, specifically measurements of APP (of which the data has previously been shown by our group [37]), PSEN1, PSEN2, associated with fAD [36]; and MAPT, associated with sAD [33]. Residuals were normally distributed, as assessed by the Shapiro-Wilks test and visual inspection of Q-Q plots. There was independence of errors, examined with the Durbin-Watson test. There was homogeneity of regression slopes, as the interaction term was not significant. Bonferroni corrections were applied to counteract multiple testings.
A multiple linear regression was used to determine if changes in the expression of APP, PSEN1, PSEN2, or MAPT could be predicted by variation of total QKI or QKI isoforms. As each QKI isoform was highly correlated with the QKI pan probe (r > 0.69, for both QKI5 and QKI6, r > 0.85 for QKI7), each was regressed onto QKI pan to form the residual expression, to provide the differences between each isoform and the general QKI expression level. The residuals are orthogonal to QKI, and represent relative differences to general QKI levels. These values are therefore more indicative of each individual isoform’s expression. The multiple linear regression was firstly fitted with the geometric mean of the reference gene values, to account for the general mRNA expression within the sample. Following this, the total QKI pan values were entered into the model, and each of the three isoform residuals were entered as explanatory variables in separate equations.
In addition, a correlation-based Principal Component Analysis (PCA) was performed on the gene expression values of APP, PSEN1, and PSEN2, reducing the data of these three genes to a single component [38]. A single component was formed due to the close alignment of variance predicted by QKI and QKI isoforms (see Table 1), and their shared involvement in parts of the Aβ pathway. The principal component also accounted for 94% of the variance of the data from these three genes, which is highly representative of the shared gene expression. The component (PC1) was used as above, in a linear regression with each QKI isoform residual. The PC1 data were first regressed onto the geometric mean of the reference gene values, to largely remove the influence of general mRNA expression, and the subsequent residuals from this were used as normalized values. The data were also split into control and sAD patients to explore the specificity of the AD gene outcome for each group in relation to the QKI isoforms. The data therefore show the predictive value of each QKI isoform to a sAD-related gene value, within the context of disease state (i.e., sAD or control). All statistical tests were performed using IBM SPSS version 21 [39].
Quaking response element detection
QKI is known to selectively bind to sequences harboring a QKI Response Element (QRE); at which point RNA splicing, export stabilizing, and mRNA processing are proposed to occur. Galarneau and Richard [40] defined a probability matrix of the QRE, which we used in searching the known RefSeq RNA transcript variant sequences of APP, PSEN1, PSEN2, and MAPT (accession numbers are shown in Supplementary Table 1). Sequences were first retrieved from GenBank and searched via the FUZZNUC tool (EMBOSS 6.5.0 [41]). The sequences were then searched for the QRE as defined by Galarneau and Richard [40], consisting of the nucleotides NACUAAY-N1–20-UAAY (where N refers to any nucleotide, and Y refers to cytosine or thymine), with mismatches that were verified with the matrix and other potential QREs identified previously [40].
RESULTS
Gene expression of QKI and QKI isoforms is upregulated in sAD
Gene expression levels of total QKI pan as well as its isoforms QKI5, QKI6, and QKI7 were measured in 62 postmortem brain samples from sAD patients and compared to 61 control samples (Fig. 1). In sAD, QKI and QKI isoforms were significantly upregulated. APP did not show any significant differences (p = 0.394), and while PSEN1 showed a tendency to upregulation, this did not reach significance (p = 0.054). Additionally, PSEN2 (p = 0.475), and MAPT (p = 0.144) expression values were not found to be significant, relative to control samples (Fig. 2). Analysis after Bonferroni corrections showed that QKI pan was significantly different (p < 0.005) with a 1.14-fold upregulation, QKI5 (p < 0.05) with a 1.08-fold upregulation, QKI6 (p < 0.05) with a 1.08-fold upregulation and QKI7 (p < 0.0005) with a 1.08-fold upregulation (all fold differences based on estimated marginal means from the ANCOVA model).
QKI expression is not correlated with increased age in either AD or control samples
As age is the main risk factor for sAD, we decided to investigate whether the expression of QKI pan and its isoforms differed across sample age. Within the ANCOVA model above, age was not found to be a significant predictor of gene expression for QKI pan or any of the QKI isoforms (data not shown). This held true within both groupings of sAD and control samples, across replicate PCR plate, and across the sex of the sample.
Association of QKI and QKI isoforms with AD-associated genes
The main pathological hallmarks of both fAD and sAD are the presence of Aβ plaques and NFT. Aβ plaques have been associated with mutations in APP, PSEN1, and PSEN2, and tauopathy to MAPT [43]. When we evaluated these genes in human postmortem brain samples, no alterations in gene expression were found for APP (as previously shown by Emilsson et al. [37]), PSEN1, PSEN2, or MAPT. To evaluate whether QKI and QKItranscripts are predictive of the variation of APP, PSEN1, PSEN2, and MAPT, we implemented a multiple linear regression. The AD-related gene expression was entered as dependent variables, while QKI pan probe expression and each QKI isoform was entered as an independent variable. We found that the expression level of QKI pan was the greatest predictor of AD-related gene expression (Table 1), significant for all genes, and accounting for between 23% and 36% of the variation. As each isoform was the second independent variable in the multiple linear regression, any further variation explained by the isoforms is in addition to the variation explained by QKI pan. QKI5 was a significant predictor of the expression of all AD related genes, accounting for 2–6% of variation. QKI6 was a significant predictor of APP, PSEN1, and PSEN2, and accounted for 3–4% of the variation. No significant relation was found with MAPT and QKI6. QKI7 was also predictive of APP, PSEN1, and PSEN2, accounting for 3–5% of expression, but was not predictive of MAPT (Table 1).
A PCA was also performed in order to examine the co-varying expression of the three AD-associated genes involved in the amyloid pathway. The principal component accounted for 94% of the variance of APP, PSEN1, and PSEN2. This principle component was, following normalization to the geometric mean of the reference genes, used in a multiple linear regression as above, with QKI pan and QKI isoforms. QKI pan (Fig. 3) and all QKI isoforms were significant predictors of the PC1 variance (Table 1).
Subsequently, we extended our investigation and split the data according to sample status (sAD or ctrl) and repeated the multiple regression as before. QKI pan appeared to be a stronger predictor of PC1 within control samples (Supplementary Table 2). No striking differences emerged for the QKI isoforms, although QKI5 and QKI7 appeared to predict more variance of PSEN2 within control samples, similar to QKI pan.
APP, PSEN1, and MAPT harbor a putative QRE
We investigated if any of the AD-related genes in this study contained QREs. The QRE is the location at which RNA splicing, export, stabilizing, and mRNA processing are proposed to occur upon QKI binding. A QRE site was found within all ten transcript variants of APP, transcript variant two of PSEN1, and all eight transcript variants of MAPT (Fig. 4). These sequences are based on either the identified consensus sequence or a sequence with partial nucleotide differences that were previously confirmed [40].
In APP the QRE was found within the 17th exon, and consisted of 5’-AATTAATCCACACATCAGTAAT -3’ for all 10 transcripts. This sequence has partial, yet validated, differences to the consensus sequence NACUAAY-N1–20-UAAY (where N refers to any nucleotide, and Y refers to cytosine or thymine). The first underlined segment refers to the core QRE sequence and the second to the half-site [40]. The QRE in PSEN1 was found to be 5’-TACTAATGACAAT-3’, with the first four nucleotides residing in exon 3, and the remaining residing in exon 4. The core sequence is identical to the consensus sequence, although the half-site shows a single nucleotide difference. Galarneau and Richard [40] have previously shown that variations within the half-site are tolerable and may not even be necessary for QKI binding in some cases. The QRE in MAPT consisted of 5’-TAATTGGTTAATCACTTAA-3’ for all transcript variants and was found in the 3’UTR. The first underlined segment refers to the half-site, and the second to the core QRE sequence. As with APP, this sequence has partial, yet previously validated differences to the consensus sequence. There has not yet been a quantification of the proportion of QREs within the human genome, yet previous research would suggest a prevalence of around 5–6% in mice using the less conservative QRE sequence, in which certain mismatches are tolerable (this figure is around 4% in mice using only the identified consensus) [40].
DISCUSSION
In this study, we investigated the association of sAD with the expression of the QKI gene and three of its isoforms, QKI5, QKI6, and QKI7, in postmortem AD brain samples from the prefrontal cortex. The expression level of QKI was able to explain a large part of the variation of genes known for theirinvolvement in the pathological hallmarks of sAD, i.e., APP, PSEN1, PSEN2, and MAPT.
Consistent with previous findings from Gómez Ravetti et al. [22], the QKI gene expression was upregulated in postmortem sAD brain samples from the prefrontal cortex. Furthermore, the QKI isoforms QKI5, QKI6, and QKI7 were all upregulated in sAD samples. Gómez Ravetti et al. [22] also showed that QKI expression increases with the severity of AD status. While analysis from Feng et al. [44] suggests that QKI may have expression differences in early, but not late stages of AD. Unfortunately, we did not have any data on the disease severity, or time of onset, in our patient material; therefore, we were not able to investigate these factors in relation to gene expression. However, in our analysis, QKI and QKI isoform upregulation was not significantly associated with differences in age. We therefore suggest that QKI upregulation in AD is not age-dependent and could indeed be a molecular biomarker of AD, as previously suggested [22].
It is known that QKI is exclusively expressed in glial cells in the mature brain [26]; therefore, any potential effects of upregulated QKI on sAD progression must occur via an altered glial cell environment or function. With identified gene expression in astrocytes, oligodendrocytes, and Schwann cells, QKI alterations could affect both synaptic function[45, 46] and myelin maintenance [21].
AD progression has been suggested to switch astrocytes from a neuroprotective state to reactive gliosis [47], preventing axonal outgrowth [47] and reducing neuronal inhibition [48]. Such defective inhibition is linked to the destabilization of neuronal networks in response to Aβ [49]. Astrocytes have been shown to accumulate toxic Aβ, and subsequent lysis of the astrocytes containing Aβ can cause the deposition of Aβ plaques [50], which could further destabilize neuronal networks. Additionally, reactive astrogliosis has been linked to disrupted synaptic connectivity in a mouse strain carrying the human form of apolipoprotein E4, a protein linked to sAD [51]. It has also been shown that GFAP, a gene regulated by QKI [33], and associated with astrocytic activation, is upregulated in AD [16–18, 52, 53]. Both astrocytic density and expression levels of GFAP correspond to Braak stage severity [54], which suggests a link between astrocytosis and AD severity [55].
In relation to myelin and AD, it has been shown that disturbed myelination is associated with AD [19, 56]. As oligodendrocytes are primarily responsible for myelination, their cell death would affectneuronal myelination maintenance [57, 58]. Aβ has been found in abundance within the white matter of AD patients [59, 60] and is found to be toxic to oligodendrocytes [61]. QKI upregulation could therefore represent a compensatory reaction to Aβ toxicity in oligodendrocytes.
In addition to the upregulation of QKI and QKI isoforms in postmortem AD human brain samples, we also found that these expression values were associated with genes (APP, PSEN1, PSEN2, and MAPT) related to the pathological hallmarks of AD [19]. PSEN1 and PSEN2 are part of the gamma secretase complex that cleaves AβPP and ultimately gives rise to the formation of Aβ plaques. MAPT encodes for the tau protein which, once phosphorylated, contributes to the formation of NFT. Analysis of samples separated by disease status revealed that the association appeared more pronounced in control samples (Supplementary Table 2). Genetic dysregulation upon disease emergence has previously been found for a large number of genes within AD samples [44], which could suggest that the lower amount of variance of AD-related gene expression predicted by QKI in sAD samples is a result of dysregulation brought on by AD pathology. In contrast, the variance of AD-related genes predicted by QKI in control samples could reflect normal regulation of these genes. So far, very little is known about the functions of the different QKI isoforms. It is therefore unclear whether the upregulation of QKI and its isoforms in sAD contributes to the emergence of the disease, if this is a secondary effect due to other causative mechanisms, or some combination thereof.
The gene expression data of the AD-related genes follow the trend of previously published findings, but in general, published expression data from human studies have shown varying results depending on splice variants examined, methods of measurement, and brain regions studied, so it is challenging to compare our data with previous reports. From previous studies of APP mRNA expression in human brain, the results have been inconclusive. Tanaka et al. analyzed several brain regions and found that in the frontal cortex, two of the three APP splice variants analyzed were upregulated in AD patient brains, while no differences were found in other regions [62]. Golde et al. showed that APP splice variants in AD brains were elevated in the frontal white matter [63], but the data varied in the frontal grey matter [63]. In our study, PSEN1 was not found to be significantly different in AD samples; however, elevated PSEN1 mRNA levels in the superior frontal gyrus of AD patients has been found by Borghi et al. [64]. Johnston and coworkers, on the other hand, failed to find differences in PSEN1 expression in mid-temporal or superior frontal cortices from AD and control patients [65], and Isoe-Wada et al. detected reduced PSEN1 mRNA in the frontotemporal lobe of AD patients [66]. We did not find a significant difference in the expression of PSEN2 while another study has shown downregulation in hippocampus, frontal cortex, and basal forebrain in AD brains [67]. While our results are therefore not indicative of any significant expression differences of APP, PSEN1, PSEN2, or MAPT in AD patients, this is not unexpected given inconsistent findings from priorstudies.
As QKI can regulate transcripts containing a QRE [40], it is suggested that QKI upregulation could contribute to the emergence of sAD through interaction with APP, PSEN1, and MAPT, all of which harbor a putative QRE (Fig. 4). Previous in vitro findings from our group showed that QKI7 likely regulates the transcript expression of GFAP via the QRE [33]. The association of QKI and QKI isoforms with AD-related genes may therefore represent a regulatory involvement. It has also been shown that QKI7 can induce apoptosis of oligodendrocytes [68]. Mouse studies with abnormal QK and knocked-out p53 showed that both genes were important for the maintenance and survival of neurons [69]. These findings indicate a role of QKI in cell apoptosis in both glial cells and neurons, central to AD pathology [70, 71]. However, any connection between QKI expression and AD-related genes is currently speculative. Further research examining potential interactions could clarify whether or not the aforementioned processes are involved in AD pathogenesis.
Additionally, there has not yet been a comprehensive search of the prevalence of potential QRE sites within the human genome. However, of the approximately 25,000 genes within mice, 955 are found to contain a QRE site [40], putting the proportion of QRE sites within the genome at around 4%. This proportion is increased with the inclusion of sequences with slight differences to the identified consensus sequence, to a total of 1,433 genes [40]. This is equivalent to around 5–6% of genes containing QREs. While this is of course data from mice, it perhaps offers the best glimpse currently available at the prevalence of QRE sites.
It is however also possible that QKI upregulation is not directly linked to sAD emergence, but is rather a secondary effect. QKI has been shown to be directly regulated by p53 [72]. p53, most commonly known for its role in cancer progression, is activated in response to DNA damage [73] (such as the result of oxidative stress [74]), and can ultimately trigger apoptosis [75]. Based on this, our finding that the expression of QKI and its isoforms are upregulated in sAD could be explained by increased stress-induced p53 regulation. Additionally, as astrocytic activation is a well-documented response to many CNS injuries, including Alzheimer’s disease [22], the increase in QKI and QKI isoforms could represent a secondary process as a result of glial alteration.
In conclusion, we have found an upregulation of QKI and its isoforms (QKI5, QKI6 and QKI7) in sAD patients compared to controls. This finding is consistent with previous research [22]. We could also conclude that this upregulation is age-independent and that four AD-related genes, APP, PSEN1, PSEN2, and MAPT, were associated with the variance of QKI and QKI isoforms. Additionally, APP, PSEN1, and MAPT harbor a putative QRE site, suggesting a mechanism for regulation by QKI. How expression differences of QKI affect glial cell homeostasis and neuronal function in sAD is expected to be the result of complex genetic and proteomic alterations, which will require further deciphering through existing QKI animal models, including zebrafish and rodents [30, 76]. Our findings therefore provide a basis for further investigation into the mechanisms underlying the role of QKI in sAD formation and progression.
ACKNOWLEDGMENTS
We thank Dr. Peter Saetre for help with statistics. This project was supported by Göran Gustavsson’s Foundation, The Brain Foundation, Torsten Söderberg’s Foundation, The Swedish Alzheimer association, The Swedish Society of Medicine, Mobility of Regional Excellence (MORE) program by Region Västra Götaland, the People Programme (Marie Curie Actions) of the European Union’s Seventh Framework Programme (FP7/2007-2013) under REA grant agreement no. 608743, Magnus Bergvall’s Foundation, Gun and Bertil Stone’s Foundation and the Lars Hierta Memorial Foundation.
Authors’ disclosures available online (http://j-alz.com/manuscript-disclosures/16-0160r2).
Appendices
The supplementary material is available in the electronic version of this article: http://dx.doi.org/10.3233/JAD-160160.
REFERENCES
[1] | Querfurth HW , LaFerla FM ((2010) ) Alzheimer’s disease. N Engl J Med 362: , 329–344. |
[2] | Acosta-Baena N , Sepulveda-Falla D , Lopera-Gomez CM , Jaramillo-Elorza MC , Moreno S , Aguirre-Acevedo DC , Saldarriaga A , Lopera F ((2011) ) Pre-dementia clinical stages in presenilin 1 E280A familial early-onset Alzheimer’s disease: A retrospective cohort study. Lancet Neurol 10: , 213–220. |
[3] | Ridge PG , Ebbert MT , Kauwe JS ((2013) ) Genetics of Alzheimer’s disease. Biomed Res Int 2013: , 254954. |
[4] | Goldgaber D , Lerman MI , McBride OW , Saffiotti U , Gajdusek DC ((1987) ) Characterization and chromosomal localization of a cDNA encoding brain amyloid of Alzheimer’s disease. Science 235: , 877–880. |
[5] | Tanzi RE , Gusella JF , Watkins PC , Bruns GA , St George-Hyslop P , Van Keuren ML , Patterson D , Pagan S , Kurnit DM , Neve RL ((1987) ) Amyloid beta protein gene: cDNA, mRNA distribution, and genetic linkage near the Alzheimer locus. Science 235: , 880–884. |
[6] | Sherrington R , Rogaev EI , Liang Y , Rogaeva EA , Levesque G , Ikeda M , Chi H , Lin C , Li G , Holman K , Tsuda T , Mar L , Foncin JF , Bruni AC , Montesi MP , Sorbi S , Rainero I , Pinessi L , Nee L , Chumakov I , Pollen D , Brookes A , Sanseau P , Polinsky RJ , Wasco W , Da Silva HA , Haines JL , Perkicak-Vance MA , Tanzi RE , Roses AD , Fraser PE , Rommens JM , St George-Hyslop PH ((1995) ) Cloning of a gene bearing missense mutations in early-onset familial Alzheimer’s disease. Nature 375: , 754–760. |
[7] | Levy-Lahad E , Wasco W , Poorkaj P , Romano DM , Oshima J , Pettingell WH , Yu CE , Jondro PD , Schmidt SD , Wang K , Crowley AC , Ying-Hui F , Guenette SY , Galas D , Nemens E , Wijsman EM , Bird TD , Schellenberg GD , Tanzi RE ((1995) ) Candidate gene for the chromosome 1 familial Alzheimer’s disease locus. Science 269: , 973–977. |
[8] | Gatz M , Reynolds CA , Fratiglioni L , Johansson B , Mortimer JA , Berg S , Fiske A , Pedersen NL ((2006) ) Role of genes and environments for explaining Alzheimer disease. Arch Gen Psychiatry 63: , 168–174. |
[9] | Agostinho P , Cunha RA , Oliveira C ((2010) ) Neuroinflammation, oxidative stress and the pathogenesis of Alzheimer’s disease. Curr Pharm Des 16: , 2766–2778. |
[10] | Hickman SE , Allison EK , El Khoury J ((2008) ) Microglial dysfunction and defective beta-amyloid clearance pathways in aging Alzheimer’s disease mice. J Neurosci 28: , 8354–8360. |
[11] | Orre M , Kamphuis W , Osborn LM , Jansen AH , Kooijman L , Bossers K , Hol EM ((2014) ) Isolation of glia from Alzheimer’s mice reveals inflammation and dysfunction. Neurobiol Aging 35: , 2746–2760. |
[12] | Zhan X , Jickling GC , Ander BP , Stamova B , Liu D , Kao PF , Zelin MA , Jin LW , DeCarli C , Sharp FR ((2015) ) Myelin basic protein associates with AbetaPP, Abeta1-42, and amyloid plaques in cortex of Alzheimer’s disease brain. J Alzheimers Dis 44: , 1213–1229 . |
[13] | Hoos MD , Ahmed M , Smith SO , Van Nostrand WE ((2007) ) Inhibition of familial cerebral amyloid angiopathy mutant amyloid beta-protein fibril assembly by myelin basic protein. J Biol Chem 282: , 9952–9961. |
[14] | Hoos MD , Ahmed M , Smith SO , Van Nostrand WE ((2009) ) Myelin basic protein binds to and inhibits the fibrillar assembly of Abeta42 in vitro. Biochemistry 48: , 4720–4727. |
[15] | Liao MC , Hoos MD , Aucoin D , Ahmed M , Davis J , Smith SO , Van Nostrand WE ((2010) ) N-terminal domain of myelin basic protein inhibits amyloid beta-protein fibril assembly. J Biol Chem 285: , 35590–35598 . |
[16] | Kamphuis W , Middeldorp J , Kooijman L , Sluijs JA , Kooi EJ , Moeton M , Freriks M , Mizee MR , Hol EM ((2014) ) Glial fibrillary acidic protein isoform expression in plaque related astrogliosis in Alzheimer’s disease. Neurobiol Aging 35: , 492–510. |
[17] | Robinson CA , Clark AW , Parhad IM , Fung TS , Bou SS ((1994) ) Gene expression in Alzheimer neocortex as a function of age and pathologic severity. Neurobiol Aging 15: , 681–690. |
[18] | Overmyer M , Helisalmi S , Soininen H , Laakso M , Riekkinen P Sr , Alafuzoff I ((1999) ) Astrogliosis and the ApoE genotype. an immunohistochemical study of postmortem human brain tissue. Dement Geriatr Cogn Disord 10: , 252–257. |
[19] | Bartzokis G , Cummings JL , Sultzer D , Henderson VW , Nuechterlein KH , Mintz J ((2003) ) White matter structural integrity in healthy aging adults and patients with Alzheimer disease: A magnetic resonance imaging study. Arch Neurol 60: , 393–398. |
[20] | Cai Z , Xiao M ((2016) ) Oligodendrocytes and Alzheimer’s disease. Int J Neurosci 126: , 97–104. |
[21] | Desai MK , Mastrangelo MA , Ryan DA , Sudol KL , Narrow WC , Bowers WJ ((2010) ) Early oligodendrocyte/myelin pathology in Alzheimer’s disease mice constitutes a novel therapeutic target. Am J Pathol 177: , 1422–1435. |
[22] | Gómez Ravetti M , Rosso OA , Berretta R , Moscato P ((2010) ) Uncovering molecular biomarkers that correlate cognitive decline with the changes of hippocampus’ gene expression profiles in Alzheimer’s disease. PLoS One 5: , e10153. |
[23] | Aberg K , Saetre P , Jareborg N , Jazin E ((2006) ) Human QKI, a potential regulator of mRNA expression of human oligodendrocyte-related genes involved in schizophrenia. Proc Natl Acad Sci U S A 103: , 7482–7487. |
[24] | Aberg K , Saetre P , Lindholm E , Ekholm B , Pettersson U , Adolfsson R , Jazin E ((2006) ) Human QKI, a new candidate gene for schizophrenia involved in myelination. Am J Med Genet B Neuropsychiatr Genet 141b 84–90. |
[25] | Chenard CA , Richard S ((2008) ) New implications for the QUAKING RNA binding protein in human disease. J Neurosci Res 86: , 233–242. |
[26] | Hardy RJ , Loushin CL , Friedrich VL Jr , Chen Q , Ebersole TA , Lazzarini RA , Artzt K ((1996) ) Neural cell type-specific expression of QKI proteins is altered in quakingviable mutant mice. J Neurosci 16: , 7941–7949. |
[27] | Wang Y , Vogel G , Yu Z , Richard S ((2013) ) The QKI-5 and QKI-6 RNA binding proteins regulate the expression of microRNA 7 in glial cells. Mol Cell Biol 33: , 1233–1243. |
[28] | Li ZZ , Kondo T , Murata T , Ebersole TA , Nishi T , Tada K , Ushio Y , Yamamura K , Abe K ((2002) ) Expression of Hqk encoding a KH RNA binding protein is altered in human glioma. Jpn J Cancer Res 93: , 167–177. |
[29] | Ebersole TA , Chen Q , Justice MJ , Artzt K ((1996) ) The quaking gene product necessary in embryogenesis and myelination combines features of RNA binding and signal transduction proteins. Nat Genet 12: , 260–265. |
[30] | Sidman RL , Dickie MM , Appel SH ((1964) ) Mutant mice (quaking and jimpy) with deficient myelination in the central nervous system. Science 144: , 309–311. |
[31] | Chen Y , Tian D , Ku L , Osterhout DJ , Feng Y ((2007) ) The selective RNA-binding protein quaking I (QKI) is necessary and sufficient for promoting oligodendroglia differentiation. J Biol Chem 282: , 23553–23560. |
[32] | Wu JI , Reed RB , Grabowski PJ , Artzt K ((2002) ) Function of quaking in myelination: Regulation of alternative splicing. Proc Natl Acad Sci U S A 99: , 4233–4238. |
[33] | Radomska KJ , Halvardson J , Reinius B , Lindholm Carlstrom E , Emilsson L , Feuk L , Jazin E ((2013) ) RNA-binding protein QKI regulates Glial fibrillary acidic protein expression in human astrocytes. Hum Mol Genet 22: , 1373–1382. |
[34] | Zhao L , Mandler MD , Yi H , Feng Y ((2010) ) Quaking I controls a unique cytoplasmic pathway that regulates alternative splicing of myelin-associated glycoprotein. Proc Natl Acad Sci U S A 107: , 19061–19066. |
[35] | Castensson A , Emilsson L , Preece P , Jazin EE ((2000) ) High-resolution quantification of specific mRNA levels in human brain autopsies and biopsies. Genome Res 10: , 1219–1229. |
[36] | McCall MN , McMurray HR , Land H , Almudevar A ((2014) ) On non-detects in qPCR data. Bioinformatics 30: , 2310–2316. |
[37] | Emilsson L , Saetre P , Jazin E ((2006) ) Alzheimer’s disease: mRNA expression profiles of multiple patients show alterations of genes involved with calcium signaling. Neurobiol Dis 21: , 618–625. |
[38] | Medina M , Dotti CG ((2003) ) RIPped out by presenilin-dependent gamma-secretase. Cell Signal 15: , 829–841. |
[39] | IBM Corp. ((2013) ) IBM SPSS Statistics for Windows, Version 22.0. |
[40] | Galarneau A , Richard S ((2005) ) Target RNA motif and target mRNAs of the Quaking STAR protein. Nat Struct Mol Biol 12: , 691–698. |
[41] | Rice P , Longden I , Bleasby A ((2000) ) EMBOSS: The European Molecular Biology Open Software Suite. Trends Genet 16: , 276–277. |
[42] | Scheuner D , Eckman C , Jensen M , Song X , Citron M , Suzuki N , Bird TD , Hardy J , Hutton M , Kukull W , Larson E , Levy-Lahad E , Viitanen M , Peskind E , Poorkaj P , Schellenberg G , Tanzi R , Wasco W , Lannfelt L , Selkoe D , Younkin S ((1996) ) Secreted amyloid beta-protein similar to that in the senile plaques of Alzheimer’s disease is increased in vivo by the presenilin 1 and 2 and APP mutations linked to familial Alzheimer’s disease. Nat Med 2: , 864–870. |
[43] | Ishihara T , Hong M , Zhang B , Nakagawa Y , Lee MK , Trojanowski JQ , Lee VM ((1999) ) Age-dependent emergence and progression of a tauopathy in transgenic mice overexpressing the shortest human tau isoform. Neuron 24: , 751–762. |
[44] | Feng X , Bai Z , Wang J , Xie B , Sun J , Han G , Song F , Crack PJ , Duan Y , Lei H ((2014) ) Robust gene dysregulation in Alzheimer’s disease brains. J Alzheimers Dis 41: , 587–597. |
[45] | Garwood CJ , Pooler AM , Atherton J , Hanger DP , Noble W ((2011) ) Astrocytes are important mediators of Abeta-induced neurotoxicity and tau phosphorylation in primary culture. Cell Death Dis 2: , e167. |
[46] | Kang J , Jiang L , Goldman SA , Nedergaard M ((1998) ) Astrocyte-mediated potentiation of inhibitory synaptic transmission. Nat Neurosci 1: , 683–692. |
[47] | Canning DR , McKeon RJ , DeWitt DA , Perry G , Wujek JR , Frederickson RC , Silver J ((1993) ) beta-Amyloid of Alzheimer’s disease induces reactive gliosis that inhibits axonal outgrowth. Exp Neurol 124: , 289–298. |
[48] | Ortinski PI , Dong J , Mungenast A , Yue C , Takano H , Watson DJ , Haydon PG , Coulter DA ((2010) ) Selective induction of astrocytic gliosis generates deficits in neuronal inhibition. Nat Neurosci 13: , 584–591. |
[49] | Palop JJ , Mucke L ((2010) ) Amyloid-beta-induced neuronal dysfunction in Alzheimer’s disease: From synapses toward neural networks. Nat Neurosci 13: , 812–818. |
[50] | Nagele RG , D’Andrea MR , Lee H , Venkataraman V , Wang HY ((2003) ) Astrocytes accumulate A beta 42 and give rise to astrocytic amyloid plaques in Alzheimer disease brains. Brain Res 971: , 197–209. |
[51] | Zhong N , Scearce-Levie K , Ramaswamy G , Weisgraber KH ((2008) ) Apolipoprotein E4 domain interaction: Synaptic and cognitive deficits in mice. Alzheimers Dement 4: , 179–192. |
[52] | Beach TG , McGeer EG ((1988) ) Lamina-specific arrangement of astrocytic gliosis and senile plaques in Alzheimer’s disease visual cortex. Brain Res 463: , 357–361. |
[53] | Hanzel DK , Trojanowski JQ , Johnston RF , Loring JF ((1999) ) High-throughput quantitative histological analysis of Alzheimer’s disease pathology using a confocal digital microscanner. Nat Biotechnol 17: , 53–57. |
[54] | Wharton SB , O’Callaghan JP , Savva GM , Nicoll JA , Matthews F , Simpson JE , Forster G , Shaw PJ , Brayne C , Ince PG , Cognitive FunctionMRC,AgeingNeuropathology Study, Group ((2009) ) Population variation in glial fibrillary acidic protein levels in brain ageing: Relationship to Alzheimer-type pathology and dementia. Dement Geriatr Cogn Disord 27: , 465–473. |
[55] | Steele ML , Robinson SR ((2012) ) Reactive astrocytes give neurons less support: Implications for Alzheimer’s disease. Neurobiol Aging 33: , 423 e421–413. |
[56] | Bartzokis G , Lu PH , Mintz J ((2007) ) Human brain myelination and amyloid beta deposition in Alzheimer’s disease. Alzheimers Dement 3: , 122–125. |
[57] | Koenning M , Jackson S , Hay CM , Faux C , Kilpatrick TJ , Willingham M , Emery B ((2012) ) Myelin gene regulatory factor is required for maintenance of myelin and mature oligodendrocyte identity in the adult CNS. J Neurosci 32: , 12528–12542. |
[58] | Coman I , Barbin G , Charles P , Zalc B , Lubetzki C ((2005) ) Axonal signals in central nervous system myelination, demyelination and remyelination. J Neurol Sci 233: , 67–71. |
[59] | Roher AE , Weiss N , Kokjohn TA , Kuo YM , Kalback W , Anthony J , Watson D , Luehrs DC , Sue L , Walker D , Emmerling M , Goux W , Beach T ((2002) ) Increased A beta peptides and reduced cholesterol and myelin proteins characterize white matter degeneration in Alzheimer’s disease. Biochemistry 41: , 11080–11090. |
[60] | Wisniewski HM , Bancher C , Barcikowska M , Wen GY , Currie J ((1989) ) Spectrum of morphological appearance of amyloid deposits in Alzheimer’s disease. Acta Neuropathol 78: , 337–347 . |
[61] | Roth AD , Ramirez G , Alarcon R , Von Bernhardi R ((2005) ) Oligodendrocytes damage in Alzheimer’s disease: Beta amyloid toxicity and inflammation. Biol Res 38: , 381–387. |
[62] | Tanaka S , Shiojiri S , Takahashi Y , Kitaguchi N , Ito H , Kameyama M , Kimura J , Nakamura S , Ueda K ((1989) ) Tissue-specific expression of three types of beta-protein precursor mRNA: Enhancement of protease inhibitor-harboring types in Alzheimer’s disease brain. Biochem Biophys Res Commun 165: , 1406–1414. |
[63] | Golde TE , Estus S , Usiak M , Younkin LH , Younkin SG ((1990) ) Expression of beta amyloid protein precursor mRNAs: Recognition of a novel alternatively spliced form and quantitation in Alzheimer’s disease using PCR. Neuron 4: , 253–267. |
[64] | Borghi R , Piccini A , Barini E , Cirmena G , Guglielmotto M , Tamagno E , Fornaro M , Perry G , Smith MA , Garuti A , Tabaton M ((2010) ) Upregulation of presenilin 1 in brains of sporadic, late-onset Alzheimer’s disease. J Alzheimers Dis 22: , 771–775. |
[65] | Johnston JA , Froelich S , Lannfelt L , Cowburn RF ((1996) ) Quantification of presenilin-1 mRNA in Alzheimer’sdisease brains. FEBS Lett 394: , 279–284. |
[66] | Isoe-Wada K , Urakami K , Wakutani Y , Adachi Y , Arai H , Sasaki H , Nakashima K ((1999) ) Alteration in brain presenilin-1 mRNA expression in sporadic Alzheimer’sdisease. Eur J Neurol 6: , 163–167. |
[67] | McMillan PJ , Leverenz JB , Dorsa DM ((2000) ) Specific downregulation of presenilin 2 gene expression is prominent during early stages of sporadic late-onset Alzheimer’s disease. Brain Res Mol Brain Res 78: , 138–145. |
[68] | Pilotte J , Larocque D , Richard S ((2001) ) Nuclear translocation controlled by alternatively spliced isoforms inactivates the QUAKING apoptotic inducer. Genes Dev 15: , 845–858. |
[69] | Gavino C , Richard S ((2011) ) Loss of p53 in quaking viable mice leads to Purkinje cell defects and reduced survival. Sci Rep 1: , 84. |
[70] | Smale G , Nichols NR , Brady DR , Finch CE , Horton WE Jr ((1995) ) Evidence for apoptotic cell death in Alzheimer’s disease. Exp Neurol 133: , 225–230. |
[71] | Popescu BO , Ankarcrona M ((2004) ) Mechanisms of cell death in Alzheimer’s disease: Role of presenilins. J Alzheimers Dis 6: , 123–128. |
[72] | Chen AJ , Paik JH , Zhang H , Shukla SA , Mortensen R , Hu J , Ying H , Hu B , Hurt J , Farny N , Dong C , Xiao Y , Wang YA , Silver PA , Chin L , Vasudevan S , Depinho RA ((2012) ) STAR RNA-binding protein Quaking suppresses cancer via stabilization of specific miRNA. Genes Dev 26: , 1459–1472. |
[73] | Levine AJ , Momand J , Finlay CA ((1991) ) The p53 tumour suppressor gene. Nature 351: , 453–456. |
[74] | Chao C , Saito S , Kang J , Anderson CW , Appella E , Xu Y ((2000) ) p53 transcriptional activity is essential for p53-dependent apoptosis following DNA damage. EMBO J 19: , 4967–4975. |
[75] | Gambino V , De Michele G , Venezia O , Migliaccio P , Dall’Olio V , Bernard L , Minardi SP , Della Fazia MA , Bartoli D , Servillo G , Alcalay M , Luzi L , Giorgio M , Scrable H , Pelicci PG , Migliaccio E ((2013) ) Oxidative stress activates a specific p53 transcriptional response that regulates cellular senescence and aging. Aging Cell 12: , 435–445. |
[76] | Radomska KJ , Sager J , Farnsworth B , Tellgren-Roth A , Tuveri G , Peuckert C , Kettunen P , Jazin E , Emilsson LS ((2016) ) Characterization and expression of the zebrafish qki paralogs. PLoS One 11: , e0146155. |
Figures and Tables
Fig.1
Scatterplots of gene expression values. sAD samples are shown in filled circles with solid line of best fit. Control samples are shown in open circles, with dashed line of best fit. Y-axis shows the target gene expression value. X-axis shows the geometric means of the reference genes (ACTB and GAPDH). All values are log10.
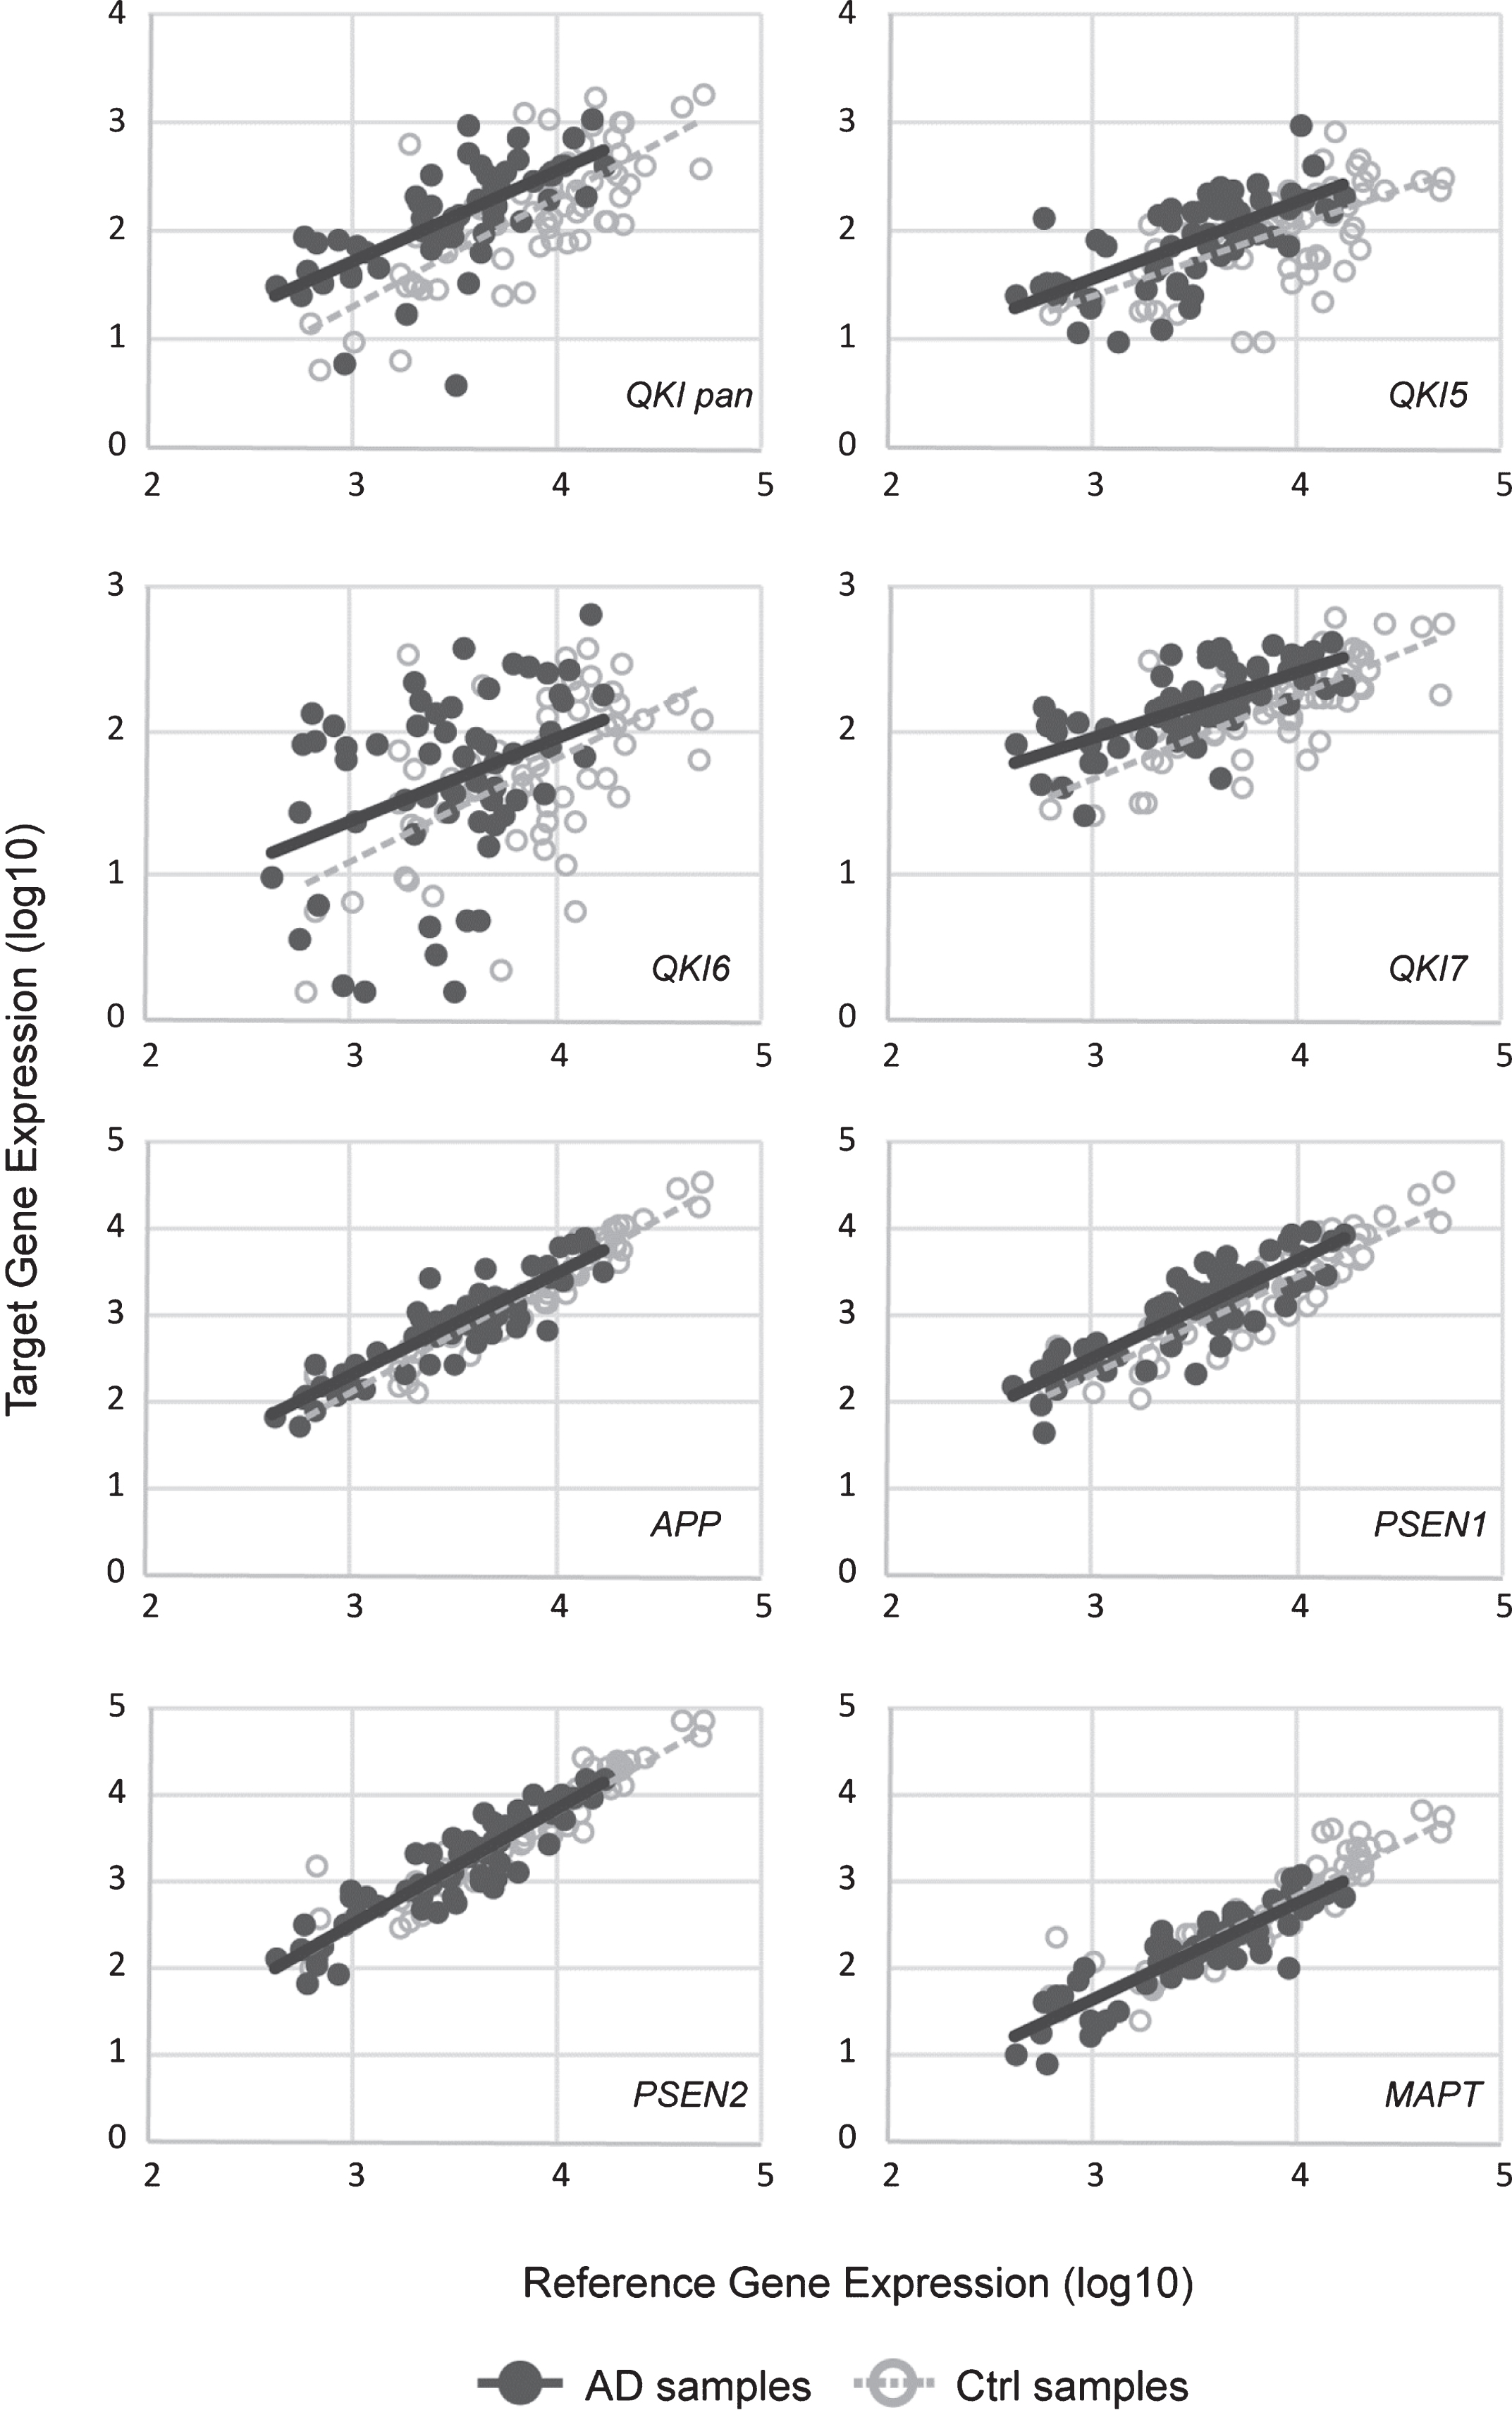
Fig.2
Upregulated gene expression of QKI, and QKI isoforms in sAD postmortem brain samples. mRNA expression values (log10) are shown for QKI pan, QKI isoforms (QKI5, QKI6, QKI7) and AD associated genes (APP, PSEN1, PSEN2, MAPT), relative to control samples (zero line on the x-axis). Error bars indicate standard error and asterisks indicate significance level obtained from ANCOVA model (*p < 0.05; **p < 0.01; ***p < 0.001).
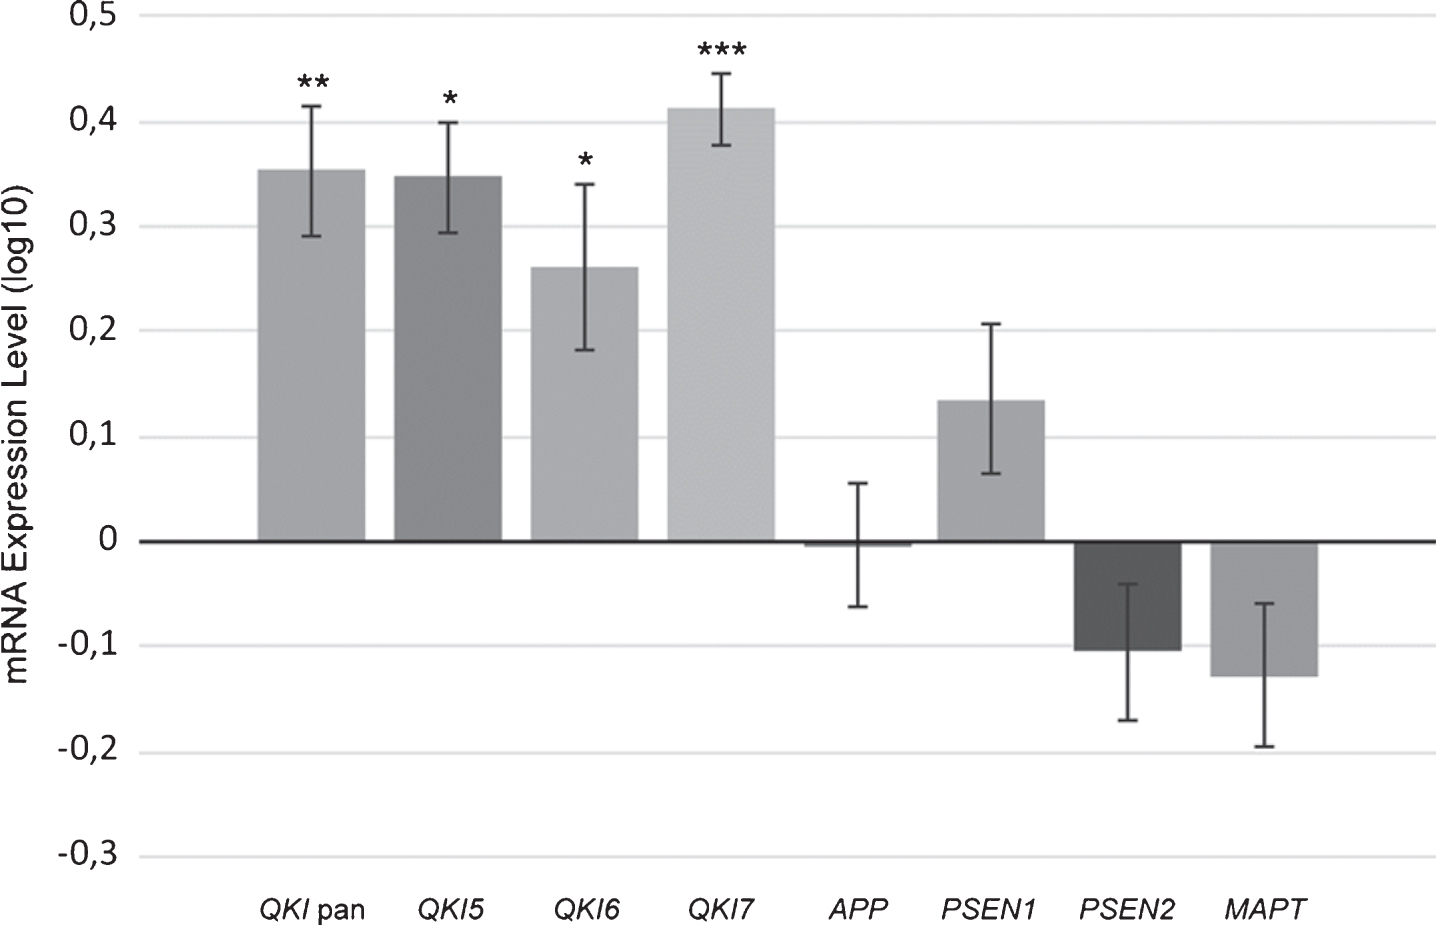
Fig.3
Scatterplot showing principal component (PC1) values of APP, PSEN1, and PSEN2 gene expression, with values of PC1 predicted from QKI pan (standardized regression values). sAD samples are shown in filled circles with solid line of best fit. Control samples are shown in open circles, with dashed line of best fit. The distance between the circles and the line of best fit is representative of model accuracy, with shorter distances equating to a better fit.
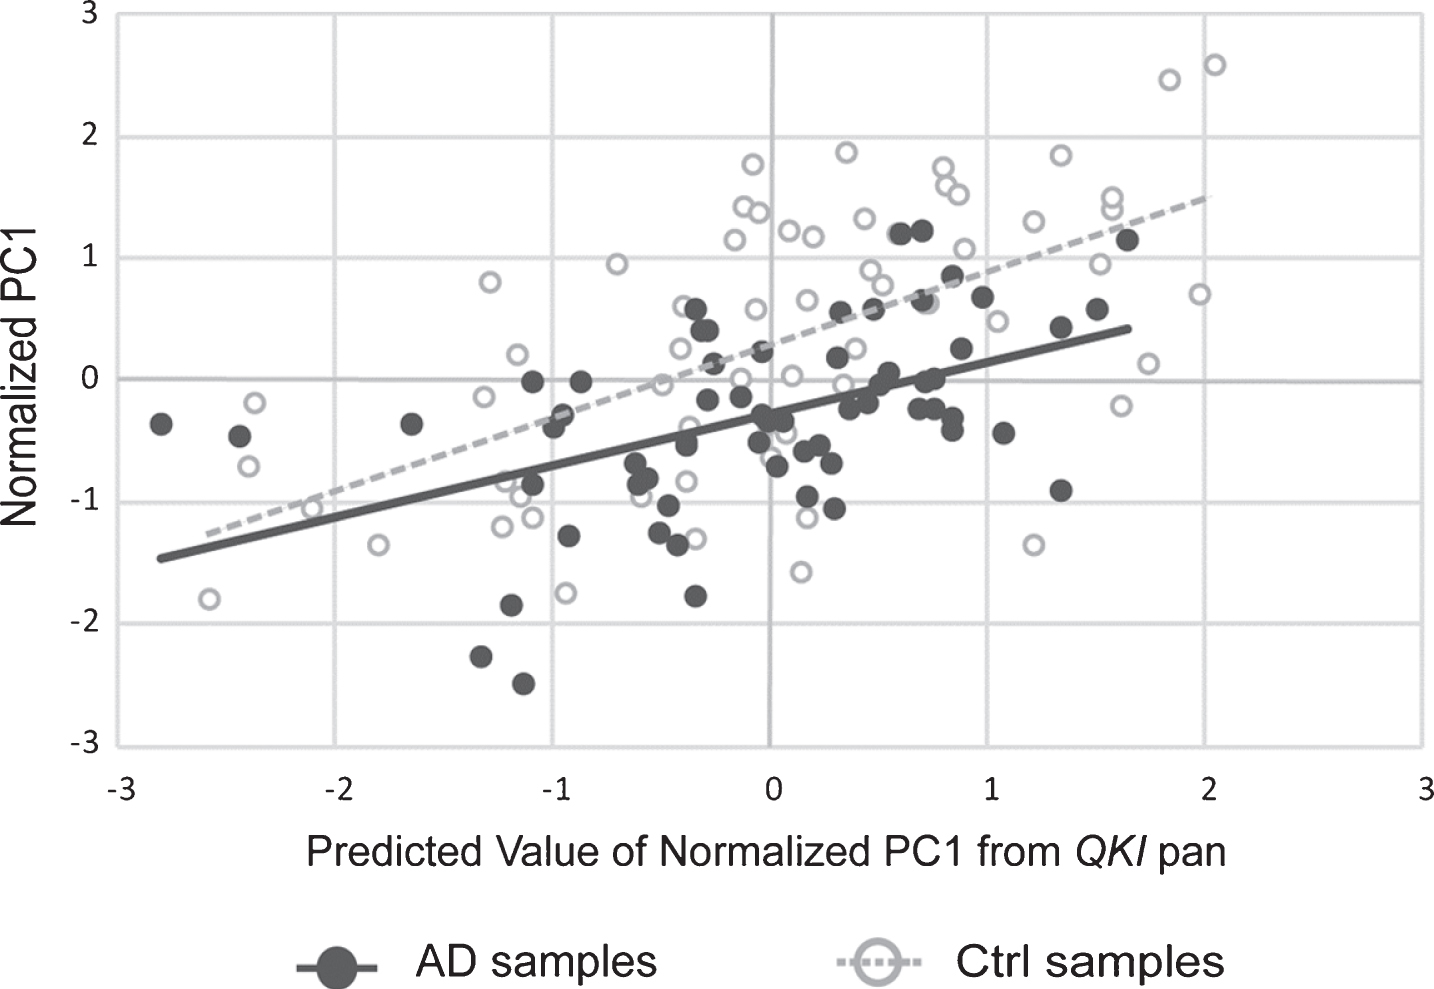
Fig.4
QRE (Quaking Response Element) shown within RNA sequences of APP, PSEN1, and MAPT. Numbers denote position within transcript variant 1 for each gene. For APP and PSEN1, the core QRE sequence and the half-site are shown as the first (from 5’ to 3’) and second underlined segment, respectively. The half-site is shown as the first (from 5’ to 3’) underlined segment for MAPT, and the second segment shows the core QRE sequence. Asterisks indicate that the sequence has a partial difference to the previously identified consensus sequence.
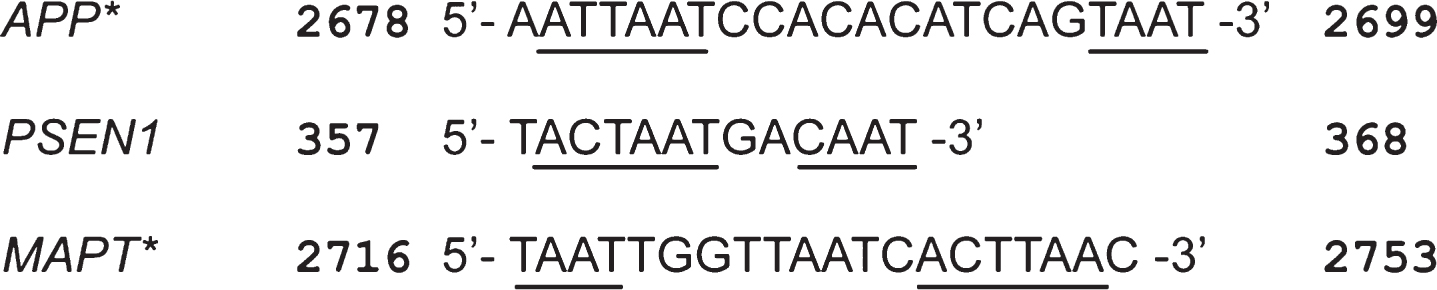
Table 1
Variation of expression levels for each AD-related gene explained by QKI pan, and additional variation explained by QKI5, QKI6, and QKI7 expression. Variation is listed as percentages. *p < 0.05, **p < 0.01, ***p < 0.001, ****p < 0.0001 and ns denote that p values were not significant
| Gene name | QKI pan | QKI5 | QKI6 | QKI7 |
| APP | 32%**** | 3%** | 4%*** | 5%*** |
| PSEN1 | 36%**** | 2%* | 3%** | 4%*** |
| PSEN2 | 24%**** | 4%** | 4%** | 3%* |
| MAPT | 23%**** | 6%*** | 1% ns | 2% ns |
| PC1 | 32%**** | 3%** | 4%** | 4%** |


