
Effect of Anserine/Carnosine Supplementation on Verbal Episodic Memory in Elderly People
Abstract
Our goal in this study was to determine whether or not anserine/carnosine supplementation (ACS) is capable of preserving cognitive function of elderly people. In a double-blind randomized controlled trial, volunteers were randomly assigned to an ACS or placebo group at a 1:1 ratio. The ACS group took 1.0 g of an anserine/carnosine (3:1) formula daily for 3 months. Participants were evaluated by psychological tests before and after the 3-month supplementation period. Thirty-nine healthy elderly volunteers (60–78 years old) completed the follow-up tests. Among the tests, delayed recall verbal memory assessed by the Wechsler Memory Scale-Logical Memory showed significant preservation in the ACS group, compared to the placebo group (p = 0.0128). Blood analysis revealed a decreased secretion of inflammatory cytokines, including CCL-2 and IL-8, in the ACS group. MRI analysis using arterial spin labeling showed a suppression in the age-related decline in brain blood flow in the posterior cingulate cortex area in the ACS group, compared to the placebo group (p = 0.0248). In another randomized controlled trial, delayed recall verbal memory showed significant preservation in the ACS group, compared to the placebo group (p = 0.0202). These results collectively suggest that ACS may preserve verbal episodic memory and brain perfusion in elderly people, although further study is needed.
INTRODUCTION
The number of people worldwide living with dementia is estimated to be 47 million in 2015, and Alzheimer’s disease (AD) is the most common form of dementia [1]. Diagnosis and intervention at early stages of dementia may greatly reduce the number of individuals suffering from AD. The onset of its symptoms typically begins with a subtle decline in memory and progresses to global deterioration. Lifestyle improvements, including increased intellectual and physical activity, and nutritional improvement [2–4], that decelerate this process may delay or prevent the onset of AD. Among them, dietary improvements can help decelerate a decline in memory and may prevent AD [4, 5]. Here, we investigated the effects of dietary supplementation with anserine (beta-alanyl-1-methyl-L-histidine) and carnosine (beta-alanyl-L-histidine), functional dipeptides from animal meat, which also referred to as imidazole-containing dipeptides, on healthy elderly people.
Carnosine is an endogenous dipeptide consisting of beta-alanine and histidine, present in the milimolar range in skeletal muscle and in the hundred-micromolar range in the vertebrate brain [6]. Carnosine has many biochemical functions, including buffering, metal ion chelating, antioxidant, and anti-glycation activities, and a wide variety of physiological functions, mainly in excitable cells, including skeletal, cardiac, and smooth muscle cells, and nerve cells [6, 7]. We previously reported that carnosine supplementation prevents memory deficit in a transgenic AD mouse model fed a high-fat diet [8]. These mice show an increased expression of RAGE (receptor for advanced glycation end product) in blood vessels, which is inhibited by carnosine supplementation, suggesting that carnosine suppresses microvascular brain damage in this mouse model [8].
Carnosine is cleaved by carnosinase to beta-alanine and histidine. In rodents, serum carnosinase activity is low, so carnosine administration elevates the plasma carnosine level. However, in humans, high serum carnosinase activity limits the biomedical effectiveness of carnosine supplementation. Anserine is a natural carnosine derivative that is not cleaved by carnosinase. Anserine (beta-alanyl-1-methyl-L-histidine) is a methylated form of carnosine that is present at high levels in the breast skeletal muscle of chicken. Owing to their identical chemical structures, except for anserine’s methylation, anserine and carnosine have equivalent reported physiological functions [6]. At present, anserine alone is not commercially available, but we could obtain an anserine/carnosine mixture prepared from chicken meat. In a clinical study, Szcześniak et al. [9] suggested that anserine and carnosine supplementation (ACS) has beneficial effects on physical capacity and cognitive functioning in elderly people.
In this study, we examined the effect of ACS on the preservation and/or improvement of a subtle memory decline in elderly people. We recruited elderly volunteers (≥60 years old) in the Tokyo area and evaluated the effects of ACS in a double-blind pilot randomized controlled trial (RCT). To this end, we evaluated the participants’ verbal episodic memory function by the use of the Wechsler Memory Scale-Logical Memory (WMS-R LM) [10, 11]. In addition, normal aging is associated with diminished brain perfusion measured as cerebral blood flow, and a study using a perfusion MRI method, arterial spin labeling (ASL), showed a clear age-dependent decrease in blood flow, most noticeably in the posterior cingulate cortex (PCC) region [12]. Therefore, to elucidate the effect of ACS, we also examined the participants’ brain perfusion.
MATERIALS AND METHODS
Participants
Sixty-nine healthy participants (41–78 years of age) were recruited from June 2012 to November 2013 from the Tokyo metropolitan area (Supplementary Table 1). The participants were required to visit the study site twice, 3 months apart. Written informed consent was obtained from all participants. Subjects with the following indications were excluded from the study: 1) individuals with a neuropsychiatric disorder or head injury; 2) individuals with a local lesion, such as a brain tumor or cerebral infarction, which could affect cognitive function; and 3) individuals with metal or electrical implants or claustrophobia that could prevent MRI scanning. The accepted participants were randomized to the ACS or placebo group. RCT-consistent assignment to the ACS or placebo group was determined by age and gender and performed by Imepro Inc. (Tokyo, Japan). All clinical and coordinating personnel and participants were blinded to the group assignments for the duration of the study. The study was approved by the Ethics Committees of the University of Tokyo and of the National Center of Neurology and Psychiatry, in 2012. The present report is of an age-restricted (≥60 years old) sub-analysis from this healthy volunteer study, and used the data from 39 elderly volunteers (≥60 years old) who completed the study (Table 1).
In another RCT, healthy participants (60–80 years of age) were recruited from April 2014 to August 2014 from the Tokyo metropolitan area. The participants were required to visit the study site twice, 6 months apart. Written informed consent was obtained from all participants as above mentioned. The accepted participants were randomized to the ACS or placebo group.
Testing formulae
The test formula was a powder containing anserine and carnosine (3:1) derived from chicken meat, provided by NH Foods Ltd., Japan. Participants in the ACS group received twice-daily doses of the imidazole dipeptide formula (500 mg/dose). The safety of this formula was previously verified by two independent studies [13, 14]. The placebo formula contained an equivalent amount of essential amino acids as in the test formula (43 mg/day L-lysine) and 150 mg/day L-histidine, because the enzymatic digestion of carnosine (250 mg/day) generates L-histidine (150 mg/day) and beta-alanine. Both treatments were granular solids taken orally over a 3-month period.
Inventory of food intake during the 3-month test period
A dietary survey was conducted using a semi-quantitative method as reported elsewhere [15]. At the time of follow-up, the participants filled out a self-administered questionnaire on the frequency of animal meat (chicken, pork, and beef) and fish meat (red meat fish represented by tuna, white fish by salmon, blue-back fish by mackerel, and eel) intake over the previous 3 months. In Japan, this three-item fish consumption inquiry is most popular, and salmon is classified into white fish even though its meat color is pink. The representative fish in each category was based on the national consumption survey. The average anserine and carnosine concentrations in these animal and fish meats were obtained from Boldyrev et al. [6], and dietary intake was estimated from the responses to the questionnaire.
Cognitive testing
The following cognitive evaluation tools and self-reported questionnaires were used to assess the effects of ACS on cognitive function, mental status, and general health: 1) the Japanese version of the Wechsler Memory Scale-Revised Logical Memory immediate recall (WMS-LM1) and delayed recall (WMS-LM2) tests [10, 11], and 2) the Japanese version of a cognitive subscale of the Alzheimer’s Disease Assessment Scale (ADAScog) [17]. Mood and subjective states were assessed by the Japanese version of the Beck Depression Inventory (BDI) [18, 19]. In addition, mental and physical functional well-being was assessed by the Medical Outcomes Study, 36-item Short Form (SF-36) [20, 21]. The Mental Health Component Summary (MCS) score and Physical Health Component Summary (PCS) score were calculated, with higher scores indicating better functioning. The cognitive and psychological tests were performed under double-blind conditions. A Mini-Mental State Examination (MMSE) was also conducted, to assess baseline cognitive function [22].
Blood sampling and immunoassays
The concentrations of 27 cytokines in serum samples collected from the volunteers at the baseline and during the follow-up test were measured by a Luminex-based multiplex beads array assay using the Bio-Plex Pro Human Cytokine Group I 27-plex panel (Bio-Rad Laboratories, Inc; Hercules, CA, USA), according to the manufacturer’s instructions. The cytokine panel included interleukin (IL)-1β, IL-1Rα, IL-2, IL-4, IL-5, IL-6, IL-7, IL-8 (CXCL8), IL-9, IL-10, IL-12, IL-13, IL-17, CCL-2 (MCP-1), CCL-3 (MIP-1α), CCL-4 (MIP-1β), CCL-5 (RANTES), CCL-11 (Eotaxin), CXCL10 (IP-10), FGF-basic, G-CSF, GM-CSF, IFN-γ, PDGF-bb, TNF-α, and VEGF. Cytokine levels below the lower limit of detection were reported as the mid-point between the lowest concentration measured and zero, as reported elsewhere [23]. IL-15 was omitted from further analysis because it was beneath the detection limit in all cases. The false discovery rate method (FDR) [24] was used to correct for multiple comparisons for cytokines. P-values less than 0.01 were considered significant.
Microarray analysis
Peripheral blood mononuclear cells (PBMCs) from volunteers were used for total RNA extraction. The total RNA quality was assessed using the Agilent system according to the manufacturer’s protocol. We eliminated one RNA sample from the Active group from further analysis. The total RNA was reverse transcribed to synthesize the first-strand cDNA, followed by second-strand synthesis. Double-stranded cDNAs were used to synthesize biotin-labeled complementary mRNA (cRNA). The cRNA samples from the volunteers were hybridized onto a Whole Human Genome oligo DNA Microarray Ver2.0 (Agilent Technologies, Inc., CA, USA), as described elsewhere [25]. The rawsignal intensities and Flags for each probe were calculated from the hybridization intensities (gProcessedSignal) and spot information (gIsSaturated, etc.), according to the procedures recommended by Agilent. The raw signal intensities of 120 samples were normalized by the quantile algorithm in the ‘preprocessCore’ library package [26] in the Bioconductor software [27]. The log fold-change of each selected probe in paired samples was calculated, and Student’s t-test was applied using the MeV software [28]. The criteria for significantly different gene expressions was p < 0.01.
Acquisition of human MRI data and MRI data analysis
MRI analyses were performed with a 3 T scanner (Siemens, MAGNETOM Verio 3.0T), using a 32-channel phased array head coil. MRI data of the study participants were collected at two time points: prior to and after supplementation. During MRI scanning, headgear and earplugs were used to limit head motion and reduce scanner noise. For each participant, 3D T1-weighted magnetization-prepared rapid gradient echo (MPRAGE) images were collected, using the following parameters: TR = 1900 ms, TE = 2.52 ms, TI = 90 ms, flip angle = 9°, field of view (FoV) = 256×256 mm, acquisition matrix = 256×256, slice thickness = 1.0 mm, slice gap = 0 mm, slice number = 192 [29]. The 3D pulsed ASL (pASL) perfusion images were collected by turbo gradient spin echo using the following parameters: TR = 5000 ms, TE = 38.8 ms, TI = 2350 ms, flip angle = 180°, FoV = 192×192 mm, acquisition matrix = 64×64, slice thickness = 3.0 mm, slice gap = 1.5 mm, slice number = 40, bolus duration = 700 ms. The 3D pASL data calculated from the MRI data collected before and after supplementation were analyzed using the statistical parametric mapping 12 (SPM12) system. The data were spatially normalized to the MNI coordinates using the DARTEL method [30], and then smoothed with a full width parameter at half-maximal resolution of 12 mm×12 mm×12 mm for 3D pASL as reported before [12]. To compare the perfusion changes that occurred over the 3-month supplementation period between the ACS and placebo groups, these spatially normalized with the 3D T1-weighted image (WI) data and smoothed pASL data were subjected to a two-way intra-subject analysis assessing the time and group interaction.
For additional MRI examinations, diffusion MRI, resting-state (rs) fMRI, and T2-FLAIR data were obtained from the participants. The diffusion tensor images were collected by EPI-diffusion with the following parameters: TR = 14100 ms, TE = 81 ms, flip angle = 90°, FoV = 224×224 mm, acquisition matrix = 114×114, slice thickness = 2.0 mm, slice number = 75, axes = 30, b-factor = 0 and 1000 s/mm2. The rsfMRI scans were acquired using a gradient-echo echo-planar sequence with repetition time TR = 3000 ms; echo time TE = 30 ms; flip angle 80°; with 48 axial slices; 3.3-mm slice thickness with no gap; each slice consisted of 64×64 voxels, resulting in a 3.30×3.31×3.31 voxel dimension. T2-fluid-attenuated inversion-recovery (FLAIR) scans were acquired with a repetition time TR = 11000 ms; echo time TE = 94 ms; inversion time TI = 2800 ms; with 20 axial slices; FoV = 198×220 mm, and were used to confirm that there were no neurological or inflammatory disorders (e.g., multiple sclerosis).
RESULTS
Participants
This analysis used the data from elderly (≥60 years of age) volunteers who completed the study. The subjects were randomly assigned to the ACS and placebo groups. As shown in Fig. 1, thirty-nine elderly participants completed both the baseline and follow-up tests. The group characteristics are summarized in Table 1. The two groups did not differ significantly with respect to age, gender, body mass index, education, or MMSE score, although there was a slight age difference between the two groups due to random drop-out. The baseline MMSE score of all of the participants was greater than 23.
The purpose of this study was to test the effect of anserine/carnosine supplementation, but these dipeptides are also obtained from the diet. To estimate daily intake from the diet, we estimated the anserine+carnosine intake from animal and fish meats using a 7-item meat intake frequency questionnaire (Fig. 2 and Table 2). There was no statistical difference in the daily anserine/carnosine intake from the diet between the two groups. Taking the dietary intake into account, the ACS group took in approximately 3 times more anserine/carnosine than the placebo group.
Cognitive tests
To evaluate cognitive function at baseline and follow-up, we performed two neuropsychological tests (Table 3). For the WMS-LM2 test, used to assess the delayed recall of verbal memory, we used two different stories (story A and story B) for the baseline and follow-up tests, respectively. Data were analyzed using a two-way repeated ANOVA (Time [baseline or follow-up]×Variant [ACS or placebo]). The interaction Time×Variant was significant before (F[1,37] = 9.067, p = 0.0047; Fig. 3) and after adjusting for age (F[1] = 6.8588, p = 0.0128). There was an effect of time (F[1,37] = 15.29, p = 0.0001), but not of variant (F[1,37] = 0.2621, p = 0.61). After a Bonferroni post-hoc test, we observed a significant decrease in the score for the placebo group (DF[37], t[4.958], p < 0.0001), but not for the ACS group (DF[37], t[0.6281], p > 0.9999). In the WMS-LM1 test, used to assess the immediate recall of verbal memory, we did not see any difference between the two groups: the interaction Time×Variant was not significant (F[1,37] = 0.7871, p = 0.3807).
In the ADAScog test, the interaction Time×Variant was not significant (F[1,37] = 0.5000, p = 0.4839). There was no effect of time (F[1,37] = 0.2280, p = 0.6358) or of variant (F[1,37] = 0.005572, p = 0.9409). In the BDI test, the interaction Time×Variant was not significant (F[1,37] = 1.641, p = 0.2082). There was an effect of time (F[1,37] = 9.337, p = 0.0042), but not variant (F[1,37] = 0.005905, p = 0.8093). After the Bonferroni post-hoc test, we observed a significant decrease in the score in the ACS group (DF[37], t[3.028], p = 0.0089), but not in the placebo group (DF[37], t[1.271], p = 0.4231). In the MCS score from SF-36, the interaction Time×Variant was not significant (F[1,37] = 1.024, p = 0.3182). There was no effect of time (F[1,37] = 0.9854, p = 0.3273) or variant (F[1,37] = 1.234, p = 0.2737). In the PCS score from SF-36, the interaction Time×Variant was not significant (F[1,37] = 0.4426, p = 0.5100). There was no effect of time (F[1,37] = 0.02027, p = 0.8876) or variant (F[1,37] = 0.01733, p = 0.8960).
Cytokine and microarray analysis
Among 26 cytokines tested, three (CCL-2 (MCP-1), IL-8, and IL-5) showed significant decrease (FDR; p < 0.01) in the sera from ACS volunteers at thefollow-up (Fig. 4), and no cytokine was increased at the follow-up. In the placebo group, no significant changes were detected in any cytokines between the baseline and follow-up time points. All data (mean±SD) for the baseline and follow-up time points for the two groups are shown in Supplementary Table 2.
We performed a microarray analysis of the blood samples obtained from volunteers at the baseline and follow-up time points. For the analysis, we focused on the genes categorized as encoding ‘inflammatory related genes including soluble factors such as chemokines and cytokines’, which would be expected to affect nerve cells or cerebrovascular cells. Supplementary Figure 1 shows the changes in expression of ‘inflammatory related’ genes by microarray analysis, even if the significance level was below the multiple correction level. We also examined the gene expression levels for the 26 cytokines analyzed above, to evaluate changes between the baseline and follow-up time points in each patient, but we did not detect any significant differences in their gene expression levels in PBMCs (data not shown).
MRI analysis
Participants were evaluated by a perfusion MRI method, pulsed arterial spin labeling (pASL). To assess longitudinal brain perfusion changes induced by the supplementation, we compared 3D pASL data between the ACS and placebo groups, using the baseline and follow-up test data. Whole brain pASL data analysis revealed a tendency for brain perfusion preservation at the PCC area in the ACS group (Fig. 5), whereas the inverse calculation did not reveal any findings. By using a PCC ROI offered by the toolbox wfu_pickatlas in the SPM software, we observed a significant preservation of brain perfusion in the ACS group (p = 0.0228; Fig. 6), after adjusting for age (F[1] = 5.5051, p = 0.0248).
Another set of RCT
To confirm whether ACS would preserve verbal memory in elderly people, we recruited healthy participants (60–80 years of age) and tested the WMS-LM2 test at the baseline and the 6-month follow-up. The group characteristics are summarized in Table 4. The two groups did not differ significantly with respect to age, gender, body mass index, education, or MMSE score. For the WMS-LM2 test, we used story A for the baseline and the follow-up tests. Data were analyzed using a two-way repeated ANOVA (Time [baseline or 6-month follow-up]×Variant [ACS or placebo]). The interaction Time×Variant was significant before (F[1,82] = 5.509, p = 0.0213; Fig. 7), and afteradjusting for age (F[1] = 5.6125, p = 0.0202).
DISCUSSION
In this study, we detected a significant preservation of verbal episodic memory function in healthy elderly people treated with an anserine/carnosine supplement in the two separate tests. Using a WMS-LM test to evaluate cognitive function [11, 31], we obtained significant results in the delayed recall (WMS-LM2) test, but not in the immediate recall (WMS-LM1) test, suggesting that ACS may have a beneficial effect on verbal memory registration, but not on short-term working verbal memory. We also applied a set of psychological tests and health questionnaires, including the ADAScog, BDI, and SF-36 (both mental and physiological domains), to evaluate the effect of ACS on the cognitive and mental functions of the elderlyvolunteers, as we expected we did not detect any significant differences between the ACS and placebo groups. We assessed the effect of the supplementation on cognitive function using the data from all of the volunteers (age 41–78 years), but we did not detect any significant differences between the ACS and placebo group (data not shown).
Given that the delayed-recall tests of verbal memory, such as the WMS-LM delayed recall (WMS-LM2) test or the free and cue selective reminding test (FCSRT) [32–34], are considered a sensitive battery for detecting a cognitive decline of elderly people, our findings indicate that ACS may inhibit a cognitive decline, as detected by the verbal memory test. In line with our data, Szcześniak et al. [9] also suggested that ACS inhibits the decline in delayed recall, but not immediate recall, of memory in elderly people, as assessed using the STMS test [32].
To evaluate brain perfusion, especially in the PCC region, where an age-dependent decline in perfusion is reported to occur [12, 35, 36], we used a perfusion MRI method, 3D-pulsed ASL, with a FAIR labeling scheme [37] and a post-label delay time of 2350 ms. With this long delay time, capillary components rather than artery components contribute to the signal, according to the model proposed by Li et al. [38].
Given this background, we examined the level of inflammatory cytokines in serum, which may reflect atherosclerotic changes in the body’s cardiovascular system. We detected significant decreases in theconcentrations of IL8 and CCL2 in the ACS group after supplementation, in agreement with our previous finding that carnosine treatment decreases the production of IL8 in TNF-treated cells [39]. CCL2 is upregulated during inflammation and can disrupt the integrity of the brain-blood barrier [40]. Our microarray analysis of the blood cells from the volunteers did not reveal any decline in the gene expression levels of inflammatory cytokines, suggesting that the decrease in the blood concentration of IL8 and CCL2 may have resulted from regulation at the cardiovascular cells, such as endothelial cells or smooth muscle cells, rather than at the blood cells.
To explore alternative scenarios for the effect of ACS on verbal episodic memory learning as assessed by the WMS-LM2 delayed recall, we performed a number of MRI scans, including VBM and DTI. Although previous studies showed a correlation of the verbal episodic memory score with a decline in hippocampal volume [41, 42] or with white matter microstructural change [43], we did not observe any significant difference in these brain structures between the two groups. Taken together, it is reasonable to speculate that ACS has a preservative effect against a cognitive decline through its ability to suppress neurovascular damage.
How ACS suppresses neurovascular damage and maintains brain blood flow is still unknown. In humans, the concentration of carnosine and its derivatives, such as anserine, is high in muscle tissues, in the milimolar range [6, 44, 45]. In our immunoassay, we detected a decrease in the serum concentration of inflammatory cytokines, but we did not detect a change in their gene expression level in PBMCs, suggesting that the difference emerged, not from blood cells, but from cardiovascular cells, such as pericytes. Recently, Zlokovic and his colleagues elegantly demonstrated the role of brain blood vessel pericytes in enabling brain micro-capillaries to maintain brain blood flow and suggested that pericyte degeneration contributes to the etiology of AD [46, 47]. It can be speculated that ingested anserine and carnosine are taken up by the pericytes of brain microcapillaries, where they inhibit degenerative cellular changes; however, further studies are required to determine the precise mechanisms by which ACS affects brain function.
Our study has various limitations. The sample size was limited, and represented an age-based subgroup analysis from a larger original group that included data from younger subjects. To confirm main effect of ACS on verbal memory, we added an interim data from another RCT in this communication. In this study, we used a mixture of anserine and carnosine from chicken meat extract, which also contained a small amount of creatinine that induced a transient increase in the blood creatinine level. Anserine and carnosine were also ingested through the subjects’ normal diet. In this study, we tried to estimate the participants’ dietary intake of anserine and carnosine by using a questionnaire. Although the survey results indicated that the anserine and carnosine consumption from the diet was equivalent between the ACS and placebo groups in our study, a better method is needed to estimate their levels more accurately.
ACKNOWLEDGMENTS
This study was supported by the Scientific Technique Research Promotion Program for Agriculture, Forestry, Fisheries and Food Industry (Grant# 25012A), from the Ministry of Agriculture, Forestry, and Fishery (MAFF), the government of Japan, and by a Grant-in-Aid for Scientific Research on Innovative Areas (Memory Dynamism), from the Japan Society for the Promotion of Science. The authors thank the CRC Company, Imepro Inc. (Tokyo, Japan) for assigning the study groups and NH Foods Ltd. (Osaka, Japan) for preparing the anserine/carnosine supplement and placebos.
Authors’ disclosures available online (http://j-alz.com/manuscript-disclosures/15-0767r1).
Appendices
The supplementary material is available in the electronic version of this article: http://dx.doi.org/10.3233/JAD-150767.
REFERENCES
[1] | Baumgart M , Snyder HM , Carrillo MC , Fazio S , Kim H , Johns H ((2015) ) Summary of the evidence on modifiable risk factors for cognitive decline and dementia: A population-based perspective. Alzheimers Dement 11: , 718–726. |
[2] | Lindenberger U ((2014) ) Human cognitive aging: Corriger la fortune?. Science 346: , 572–578. |
[3] | Gutchess A ((2014) ) Plasticity of the aging brain: New directions in cognitive neuroscience. Science 346: , 579–582. |
[4] | Cooper JK ((2014) ) Nutrition and the brain: What advice should we give?. Neurobiol Aging (Suppl 2) 35: , S79–S83. |
[5] | Farías GA , Guzmán-Martínez L , Delgado C , Maccioni RB ((2014) ) Nutraceuticals: A novel concept in prevention and treatment of Alzheimer’s disease and related disorders. J Alzheimers Dis 42: , 357–367. |
[6] | Boldyrev AA , Aldini G , Derave W ((2013) ) Physiology and pathophysiology of carnosine. Physiol Rev 93: , 1803–1845. |
[7] | Hipkiss AR ((2007) ) Could carnosine or related structures suppress Alzheimer’s disease?. J Alzheimers Dis 11: , 229–240. |
[8] | Herculano B , Tamura M , Ohba A , Shimatani M , Kutsuna N , Hisatsune T ((2013) ) β-alanyl-L-histidine rescues cognitive deficits caused by feeding a high fat diet in a transgenic mouse model of Alzheimer’s disease. J Alzheimers Dis 33: , 983–997. |
[9] | Szcześniak D , Budzeń S , Kopeć W , Rymaszewska J ((2014) ) Anserine and carnosine supplementation in the elderly: Effects on cognitive functioning and physical capacity. Arch Gerontol Geriatr 59: , 485–490. |
[10] | Sugishita M ((2001) ) Wechsler Memory Scale-Revised (Japanese), Nihon Bunka Kagakusha, Tokyo. |
[11] | Kawano N , Awata S , Ijuin M , Iwamoto K , Ozaki N ((2013) ) Necessity of normative data on the Japanese version of the Wechsler Memory Scale-Revised Logical Memory subtest for old-old people. Geriatr Gerontol Int 13: , 726–730. |
[12] | Liu Y , Zhu X , Feinberg D , Guenther M , Gregori J , Weiner MW , Schuff N ((2012) ) Arterial spin labeling MRI study of age and gender effects on brain perfusion hemodynamics. Magn Reson Med 68: , 912–922. |
[13] | Aoyagi S , Sugino T , Kajimoto Y , Nishitani M ((2008) ) Safety of long-term administration of CBEX-Dr-containing drink of healthy people. Jpn Pharmacol Ther 36: , 213–224. |
[14] | Aoyagi S , Sugino T , Kajimoto Y , Nishitani M ((2008) ) Safety of excess administration of CBEX-Dr-containing drink of healthy people. Jpn Pharmacol Ther 36: , 225–235. |
[15] | Kiyohara Y , Shinohara A , Kato I , Shirota T , Kubo M , Tanizaki Y , Fujishima M , Iida M ((2003) ) Dietary factors and development of impaired glucose tolerance and diabetes in a general Japanese population: The Hisayama Study. J Epidemiology 13: , 251–258. |
[16] | Homma A , Fukuzawa K , Tsukada Y , Ishii T , Hasegawa K , Mohs RC ((1992) ) Development of a Japanese version of Alzheimer’s disease Assessment Scale (ADAS). Jpn J Geriatr Psychiatry 3: , 647–655. |
[17] | Mohs RC , Rosen WG , Davis KL ((1983) ) The Alzheimer’sDisease Assessment Scale: An instrument for assessing treatment efficacy. Psychopharmacol Bull 19: , 448–450. |
[18] | Beck AT , Steer RA , Brown GK ((1996) ) Manual for the Beck Depression Inventory, 2nd Ed., Pearson, Texas. |
[19] | Kojima M , Furukawa TA ((2003) ) Japanese manual of the Beck Depression Inventory, 2nd ed., Nihon Bunka Kagakusha, Tokyo. |
[20] | Ware JE , Sherbourne CD ((1992) ) The MOS 36-item short-form health survey (SF-36). I. Conceptual framework and item selection. Med Care 30: , 474–483. |
[21] | Lu Y , Nyunt MS , Gwee X , Feng L , Feng L , Kua EH , Kumar R , Ng TP ((2012) ) Life event stress and chronic obstructive pulmonary disease (COPD): Associations with mental well-being and quality of life in a population-based study. BMJ Open 2: , e001674. |
[22] | Uchida K , Shan L , Suzuki H , Tabuse Y , Nishimura Y , Hirokawa Y , Mizukami K , Akatsu H , Meno K , Asada T ((2015) ) Amyloid-β sequester proteins as blood-based biomarkers of cognitive decline. Alzheimers Dement (Amst) 1: , 270–280. |
[23] | Archary D , Liebenberg LJ , Werner L , Tulsi S , Majola N , Naicker N , Dlamini S , Hope TJ , Samsunder N , Abdool Karim SS , Morris L , Passmore JA , Garrett NJ ((2015) ) Randomized cross-sectional study to compare HIV-1 specific antibody and cytokine concentrations in female genital secretions obtained by menstrual cup and cervicovaginal lavage. PLoS One 10: , e0131906. |
[24] | Benjamini Y , Hochberg Y ((1995) ) Controlling false discovery rate: A practical and powerful approach to multiple testing. J R Statist Soc ser B 57: , 289–300. |
[25] | da Conceicao VN , Dyer WB , Gandhi K , Gupta P , Saksena NK ((2014) ) Genome-wide analysis of primary peripheral blood mononuclear cells from HIV + patients-pre-and post- HAART show immune activation and inflammation the main drivers of host gene expression. Mol Cell Ther 2: , 11. |
[26] | Bolstad BM , Irizarry RA , Astrand M , Speed TP ((2003) ) A comparison of normalization methods for high density oligonucleotide array data based on variance and bias. Bioinformatics 19: , 185–193. |
[27] | Gentleman RC , Carey VJ , Bates DM , Bolstad B , Dettling M , Dudoit S , Ellis B , Gautier L , Ge Y , Gentry J , Hornik K , Hothorn T , Huber W , Iacus S , Irizarry R , Leisch F , Li C , Maechler M , Rossini AJ , Sawitzki G , Smith C , Smyth G , Tierney L , Yang JY , Zhang J ((2004) ) Bioconductor: Open software development for computational biology and bioinformatics. Genome Biol 5: , R80. |
[28] | Saeed AI , Sharov V , White J , Li J , Liang W , Bhagabati N , Braisted J , Klapa M , Currier T , Thiagarajan M , Sturn A , Snuffin M , Rezantsev A , Popov D , Ryltsov A , Kostukovich E , Borisovsky I , Liu Z , Vinsavich A , Trush V , Quackenbush J ((2003) ) TM4: A free, open-source system for microarray data management and analysis. BioTechniques 34: , 374–378. |
[29] | Matsuda H ((2013) ) Voxel-based morphometry of brain MRI in normal aging and Alzheimer’s disease. Aging Dis 4: , 29–37. |
[30] | Ashburner J ((2007) ) A fast diffeomorphic image registration algorithm. Neuroimage 38: , 95–113. |
[31] | Goto M , Abe O , Miyati T , Yoshikawa T , Hayashi N , Takao H , Inano S , Kabasawa H , Mori H , Kunimatsu A , Aoki S , Ino K , Iida K , Yano K , Ohtomo K ((2011) ) Entorhinal cortex volume measured with 3T MRI is positively correlated with the Wechsler Memory Scale-Revised logical/verbal memory score for healthy subjects. Neuroradiology 53: , 617–622. |
[32] | Lonie JA , Tierney KM , Ebmeier KP ((2009) ) Screening for mild cognitive impairment: A systematic review. Int J Geriatr Psychiatry 24: , 902–915. |
[33] | Grober E , Sanders AE , Hall C , Lipton RB ((2010) ) Free and cued selective reminding identifies very mild dementia in primary care. Alzheimer Dis Assoc Disord 24: , 284–290. |
[34] | Derby CA , Burns LC , Wang C , Katz MJ , Zimmerman ME , L’italien G , Guo Z , Berman RM , Lipton RB ((2013) ) Screening for predementia AD: Time-dependent operating characteristics of episodic memory tests. Neurology 80: , 1307–1314. |
[35] | Liu Y , Zeng X , Wang Z , Zhang N , Fan D , Yuan H ((2015) ) Different post label delay cerebral blood flow measurements in patients with Alzheimer’s disease using 3D arterial spin labeling. Magn Reson Imaging 33: , 1019–1025. |
[36] | Xekardaki A , Rodriguez C , Montandon M-L , Toma S , Tombeur E , Herrmann FR , Zekry D , Lovblad KO , Barkhof F , Giannakopoulos P , Haller S ((2015) ) Arterial spin labeling may contribute to the prediction of cognitive deterioration in healthy elderly individuals. Radiology 274: , 490–499. |
[37] | Kim SG , Tsekos NV , Ashe J ((1997) ) Multi-slice perfusion-based functional MRI using the FAIR technique: Comparison of CBF and BOLD effects. NMR Biomed 10: , 191–196. |
[38] | Li KL , Zhu X , Hylton N , Jahng GH , Weiner MW , Schuff N ((2005) ) Four-phase single-capillary stepwise model for kinetics in arterial spin labeling MRI. Magn Reson Med 53: , 511–518. |
[39] | Son DO , Satsu H , Kiso Y , Totsuka M , Shimizu M ((2008) ) Inhibitory effect of carnosine on interleukin-8 production in intestinal epithelial cells through translational regulation. Cytokine 42: , 265–276. |
[40] | Yao Y , Tsirka SE ((2014) ) Monocyte chemoattractant protein-1 and the blood–brain barrier. Cell Mol Life Sci 71: , 683–697. |
[41] | Zimmerman ME , Pan JW , Hetherington HP , Katz MJ , Verghese J , Buschke H , Derby CA , Lipton RB ((2008) ) Hippocampal neurochemistry, neuromorphometry, andverbal memory in nondemented older adults. Neurology 70: , 1594–1600. |
[42] | Travis SG , Huang Y , Fujiwara E , Radomski A , Olsen F , Carter R , Seres P , Malykhin NV ((2014) ) High field structural MRI reveals specific episodic memory correlates in the subfields of the hippocampus. Neuropsychologia 53: , 233–245. |
[43] | McDonald CR , Leyden KM , Hagler DJ , Kucukboyaci NE , Kemmotsu N , Tecoma ES , Iragui VJ ((2014) ) White matter microstructure complements morphometry for predicting verbal memory in epilepsy. Cortex 58: , 139–150. |
[44] | Crush KG ((1970) ) Carnosine and related substances in animal tissues. Comp Biochem Physiol 34: , 3–30. |
[45] | Suzuki T , Hirano T , Suyama M ((1987) ) Free imidazole compounds in white and dark muscles of migratory marine fish. Comp Biochem Physiol B 87: , 615–619. |
[46] | Bell RD , Winkler EA , Singh I , Sagare AP , Deane R , Wu Z , Holtzman DM , Betsholtz C , Armulik A , Sallstrom J , Berk BC , Zlokovic BV ((2012) ) Apolipoprotein E controls cerebrovascular integrity via cyclophilin A. Nature 485: , 512–516. |
[47] | Montagne A , Barnes SR , Sweeney MD , Halliday MR , Sagare AP , Zhao Z , Toga AW , Jacobs RE , Liu CY , Amezcua L , Harrington MG , Chui HC , Law M , Zlokovic BV ((2015) ) Blood-brain barrier breakdown in the aging human hippocampus. Neuron 85: , 296–302. |
Figures and Tables
Fig.1
Flow diagram showing the number of elderly participants (≥60 years old) during the study. 1st test: baseline. 2nd test: 3 months after supplementation.
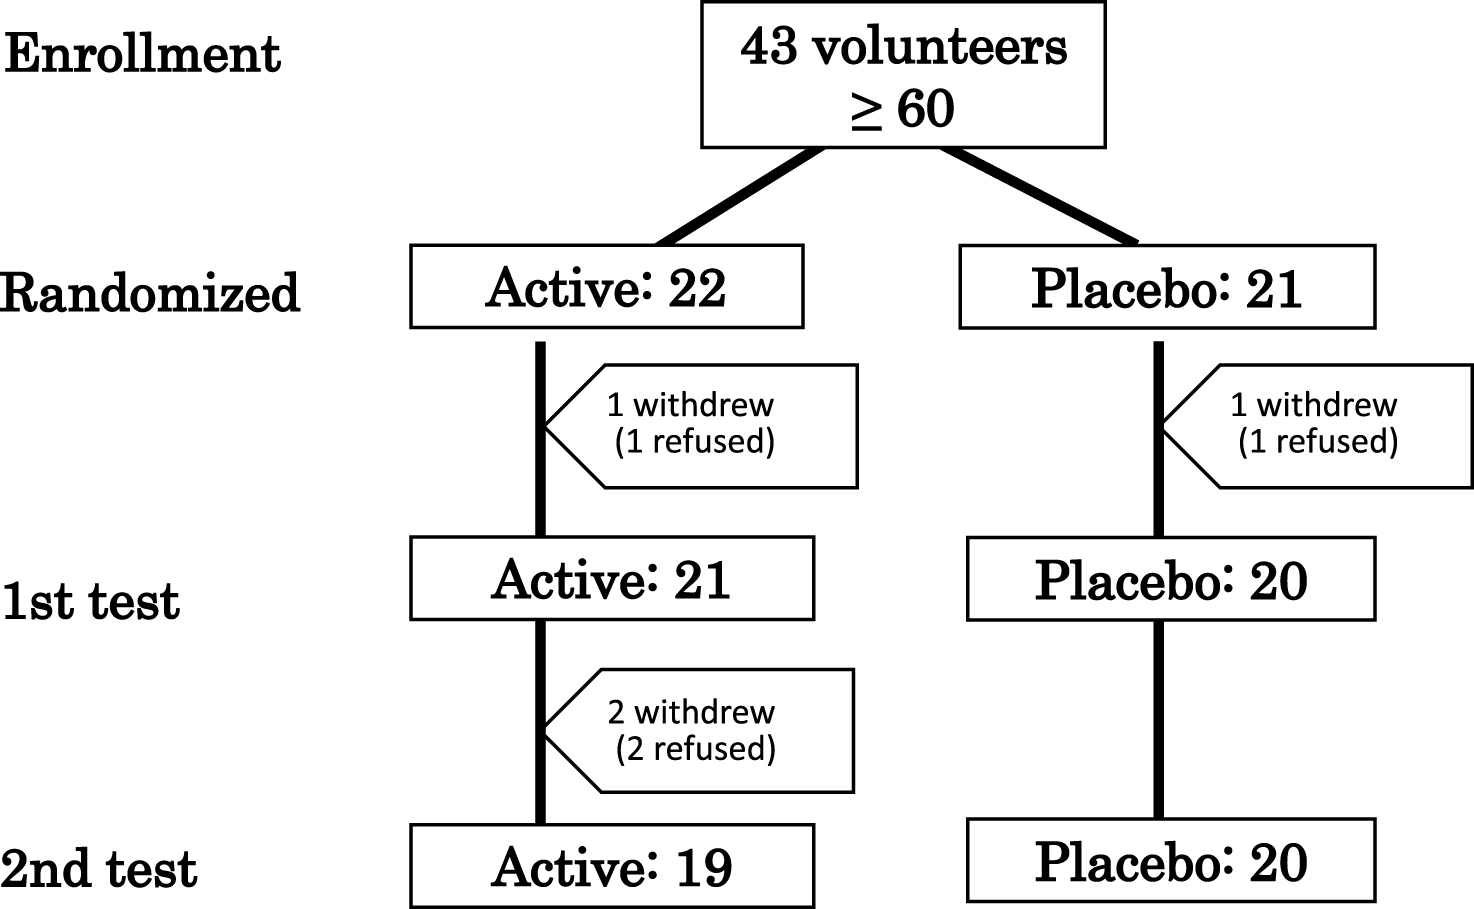
Fig.2
Chemical structures of anserine and carnosine. Anserine (β-Alanyl-L-Methyl-Histidine) and carnosine (β-Alanyl-L-Histidine) are sometimes called as imidazole-containing dipeptides.
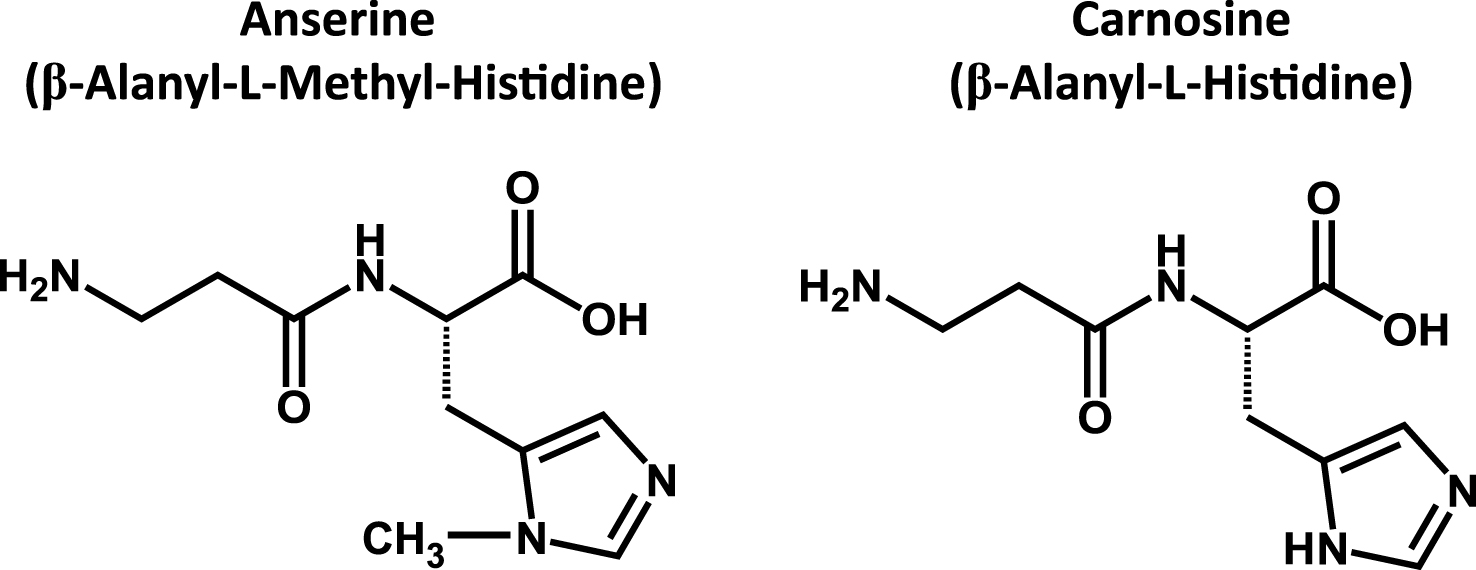
Fig.3
Longitudinal change in score of WMS-LM2 between the two groups. Box plot of WMS-LM2 data described in Table 3. Each black dot represents the change of score in each volunteer. Active (n = 19), Placebo (n = 20). Solid bar shows median, and box shows 25–75 percentile. BL, Baseline; FU, Follow-up. We observed a significant improvement of WMS-LM2 score in the ACS group before (F[1,37] = 9.067, p = 0.0047), after adjusting for age (F[1] = 6.8588, p = 0.0128).
![Longitudinal change in score of WMS-LM2 between the two groups. Box plot of WMS-LM2 data described in Table 3. Each black dot represents the change of score in each volunteer. Active (n = 19), Placebo (n = 20). Solid bar shows median, and box shows 25–75 percentile. BL, Baseline; FU, Follow-up. We observed a significant improvement of WMS-LM2 score in the ACS group before (F[1,37] = 9.067, p = 0.0047), after adjusting for age (F[1] = 6.8588, p = 0.0128).](https://content.iospress.com:443/media/jad/2016/50-1/jad-50-1-jad150767/jad-50-jad150767-g003.jpg)
Fig.4
Significant decreases in inflammatory cytokines in the ACS Group. Of 26 cytokines tested, three (IL-8, CCL-2 (MCP-1), and IL-5) were significantly decreased (p < 0.01, after FDR) in the sera of the ACS group. No cytokines significantly decreased in the placebo group. Each black dot represents the concentration of cytokine in each volunteer at the indicated test. Active (n = 19), Placebo (n = 20). Red bar shows median, and red error bar shows 25–75 percentile. BL, Baseline; FU, Follow-up.
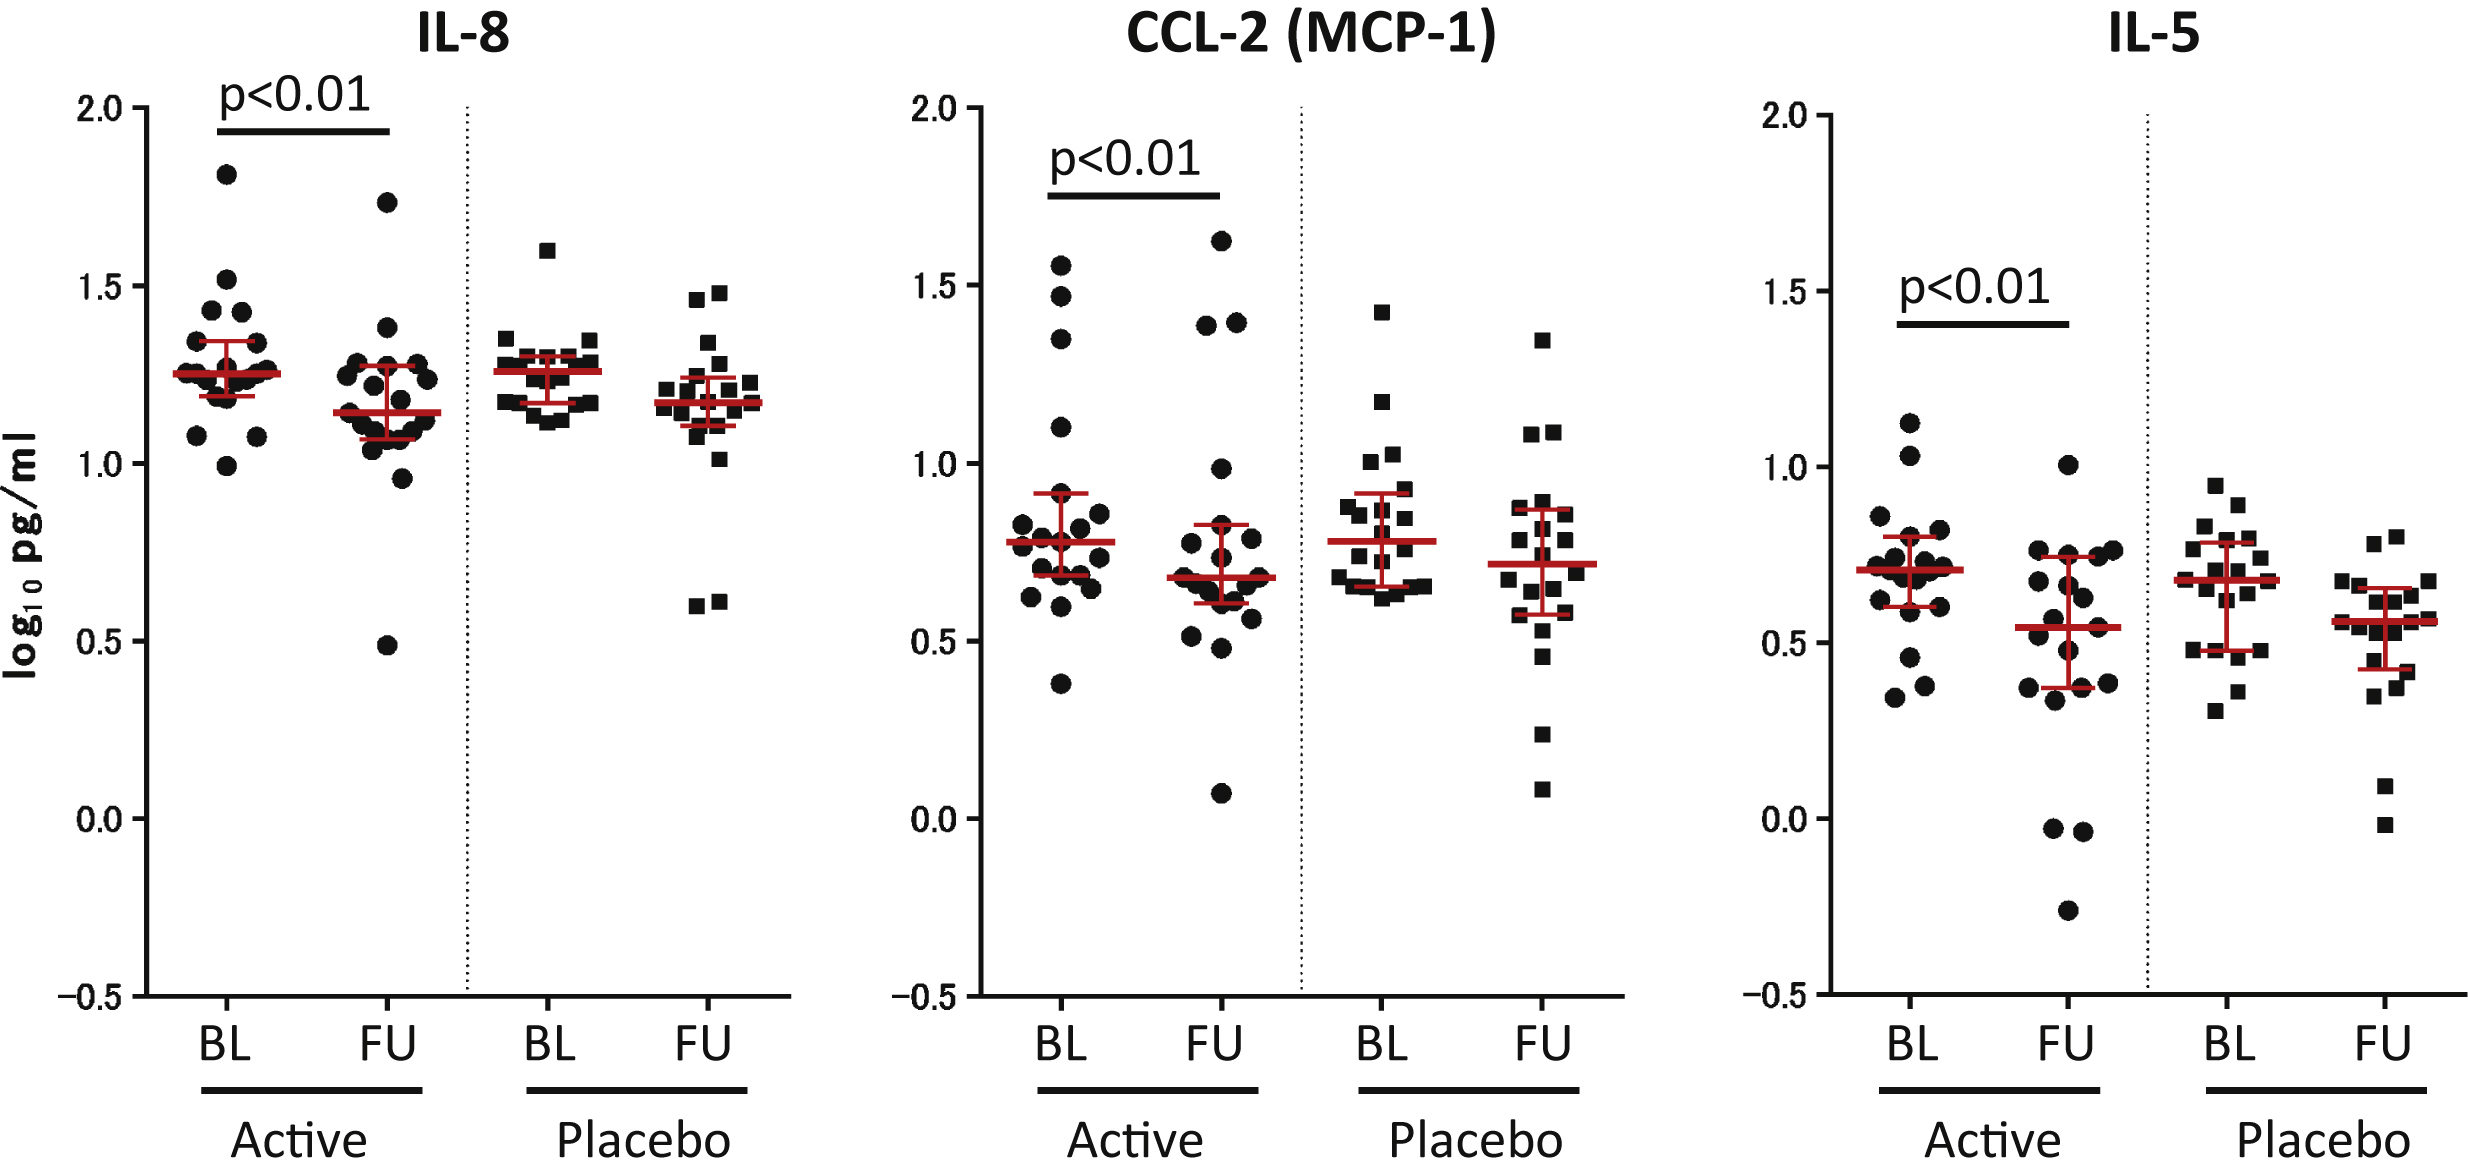
Fig.5
Analysis and location of longitudinal brain perfusion changes. Color indicates the brain region that showed a difference in brain perfusion changes between the two groups, after repeated two-way ANOVA, interaction Time×Variant (active > placebo, p < 0.01, Voxel threshold > 500). Due to low image quality, we eliminated one individual from the ACS group; therefore, we compared 38 participants in the ACS (n = 18) and placebo (n = 20) groups. Inverse calculation showed no plot. The locations are plotted on a template human brain. Red arrows with PCC (BA29) shows a cluster of perfusion preservation after supplementation (Cluster Size: 797; Peak (x, y, z) = (–8, –58, 16) at Z-score of 3.51).
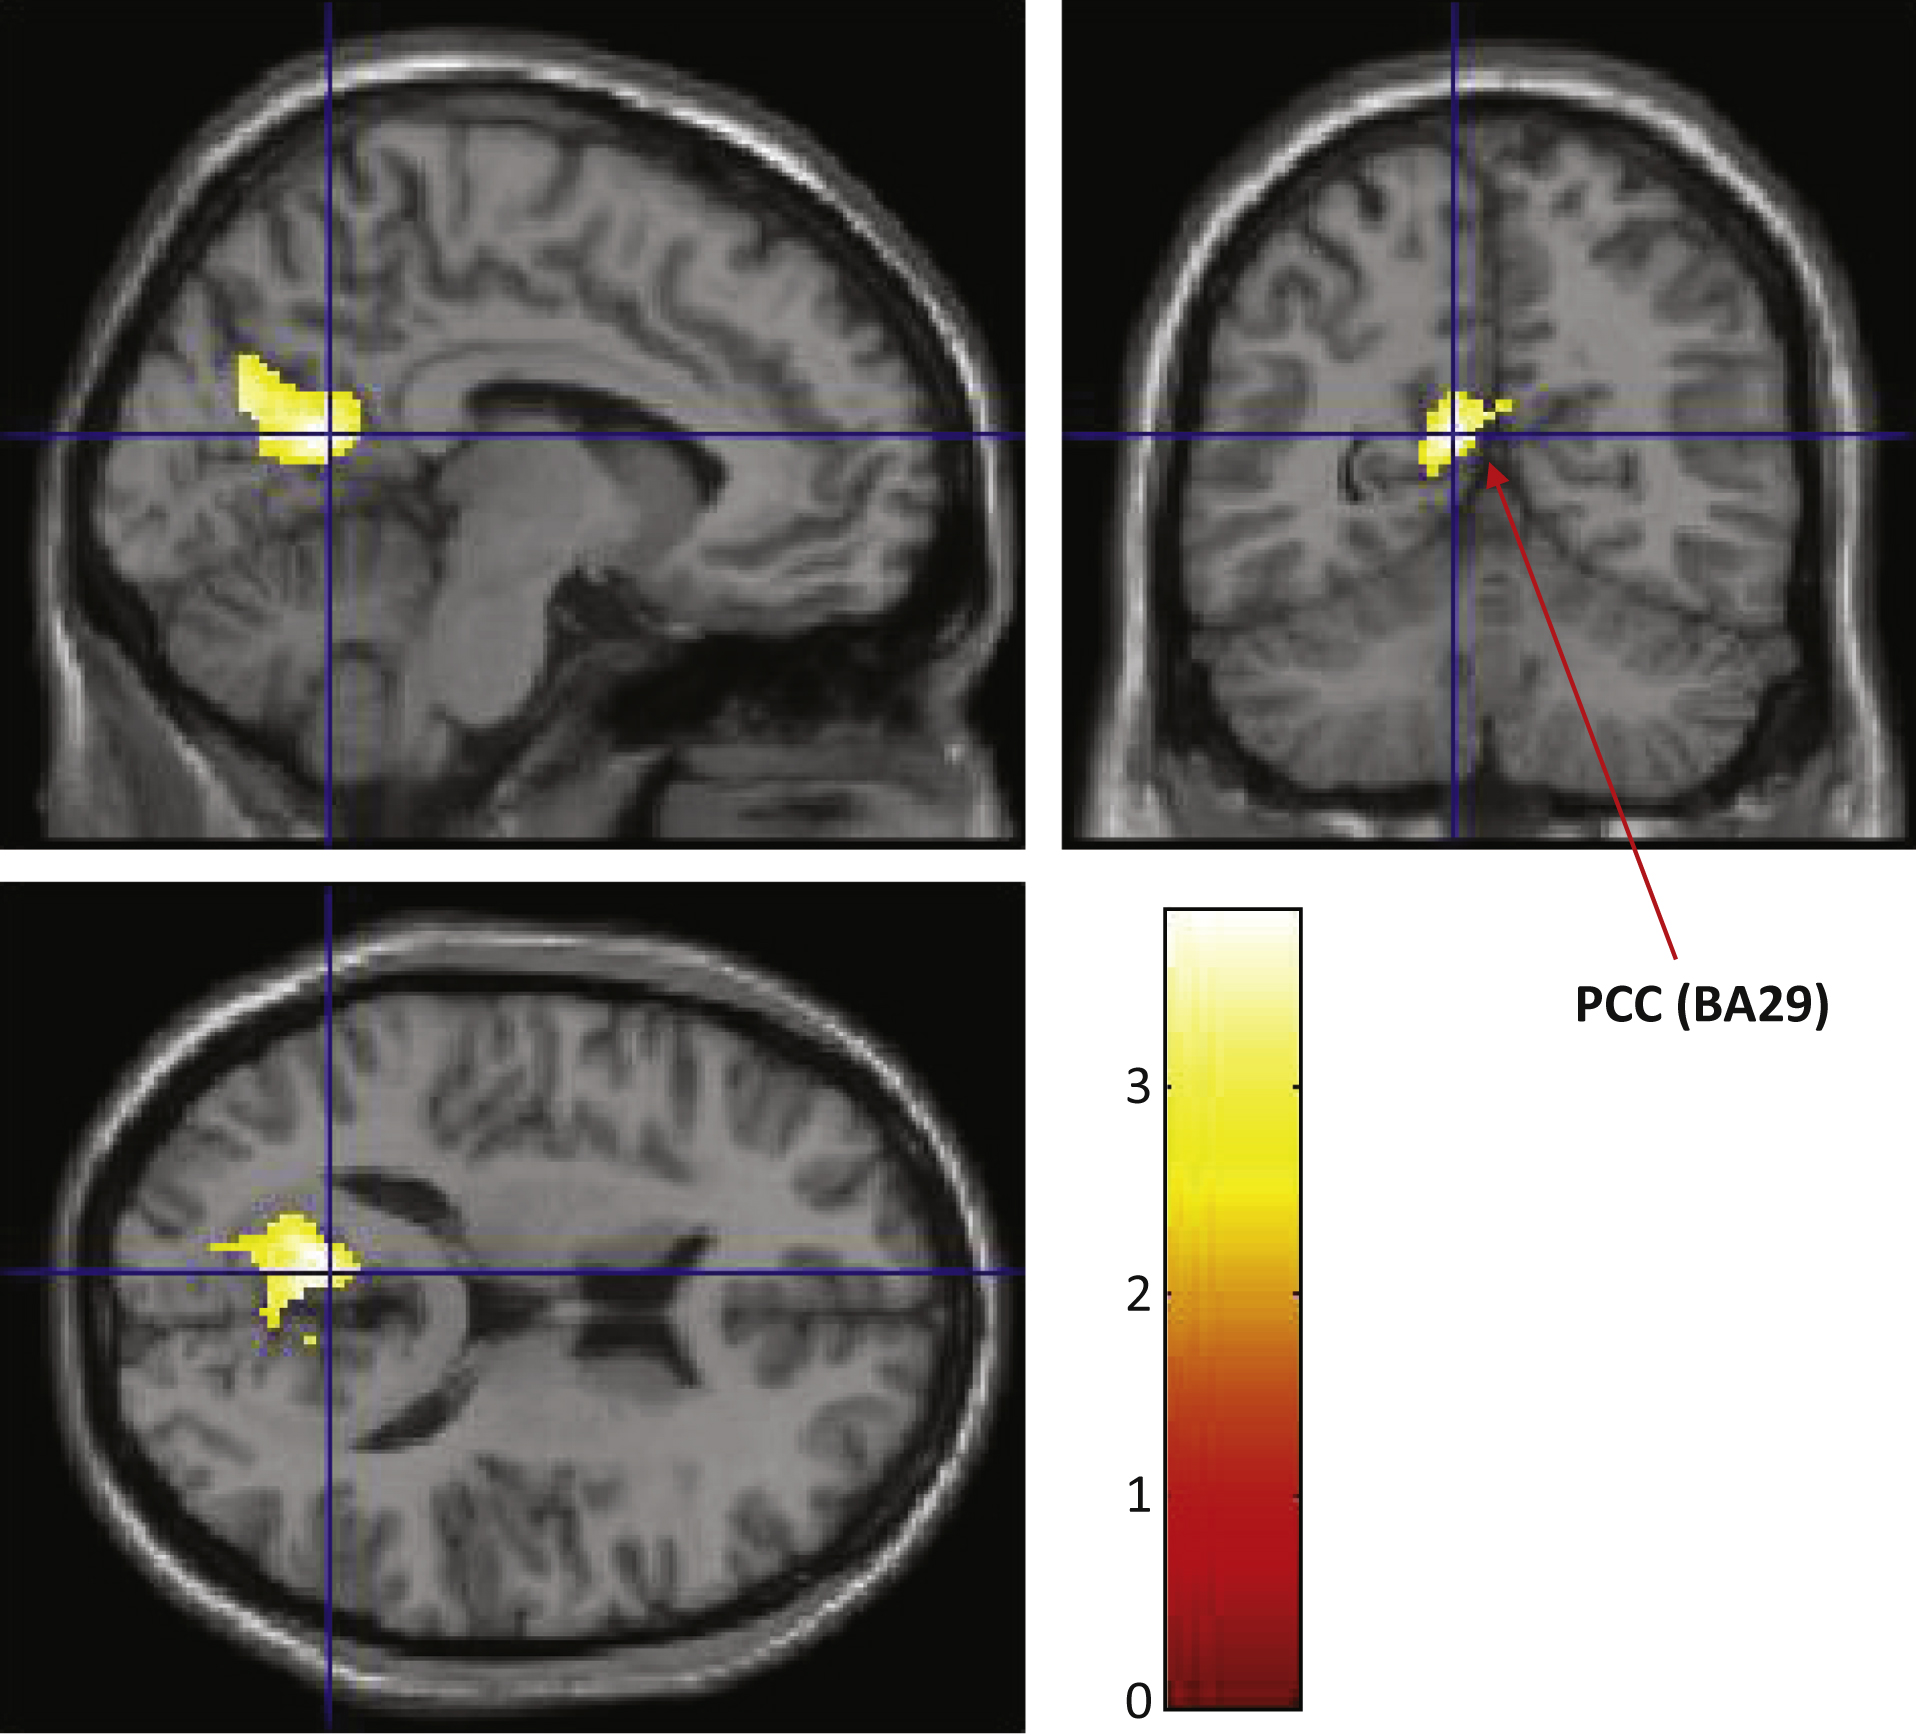
Fig.6
Longitudinal change in PCC perfusion change between the two groups. We used a PCC ROI defined by a public domain program for the SPM software: toolbox, wfu_pickatlas, and performed a ROI analysis. We observed a significant preservation of the brain perfusion of the PCC in the ACS group (p = 0.0228). After adjusting for age, we detected a significant difference between the two groups (F(1) = 5.5051, p = 0.0248).
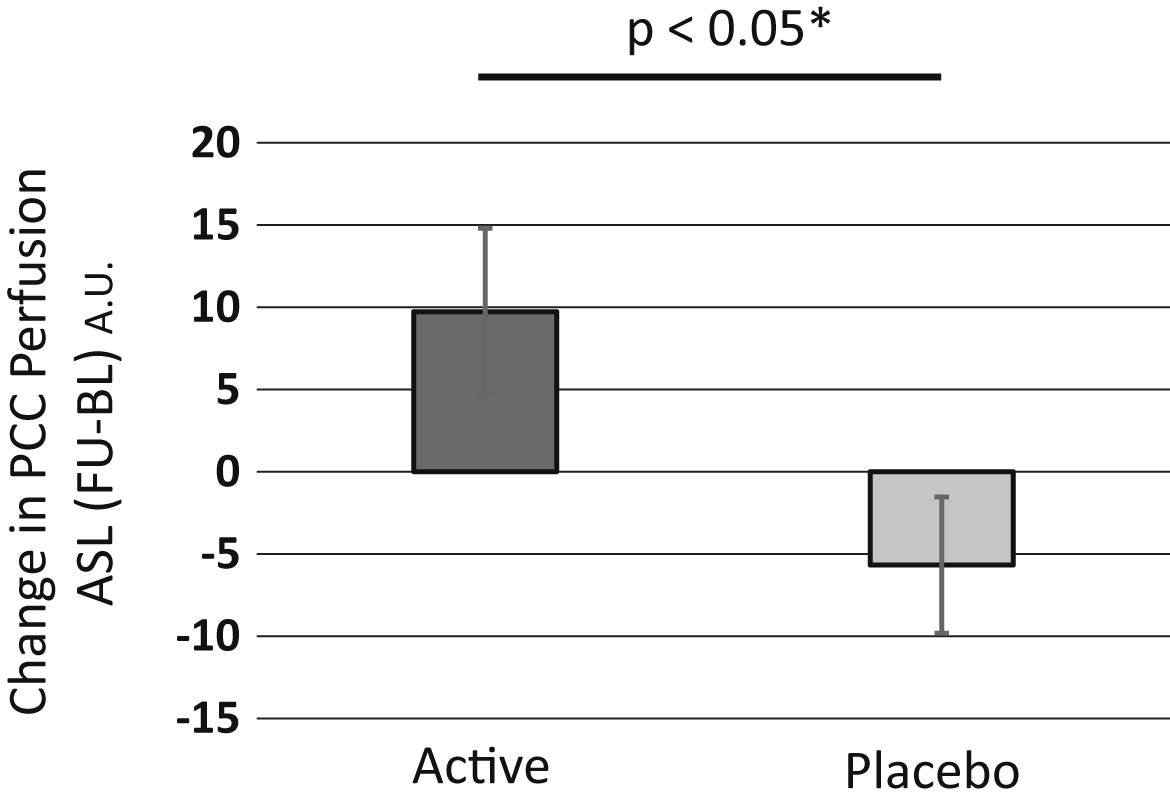
Fig.7
Longitudinal change in score of WMS-LM2 between the two groups in another RCT. Each black dot represents the change of score in each volunteer between the baseline score and the 6 month follow-up score. Active (n = 42), Placebo (n = 42). Solid bar shows median, and box shows 25–75 percentile. BL, Baseline; FU, 6 Month Follow-up. We observed a significant improvement of WMS-LM2 score in the ACS group before (F[1,82] = 5.509, p = 0.0213), and after adjusting for age (F[1] = 5.6125, p = 0.0202).
![Longitudinal change in score of WMS-LM2 between the two groups in another RCT. Each black dot represents the change of score in each volunteer between the baseline score and the 6 month follow-up score. Active (n = 42), Placebo (n = 42). Solid bar shows median, and box shows 25–75 percentile. BL, Baseline; FU, 6 Month Follow-up. We observed a significant improvement of WMS-LM2 score in the ACS group before (F[1,82] = 5.509, p = 0.0213), and after adjusting for age (F[1] = 5.6125, p = 0.0202).](https://content.iospress.com:443/media/jad/2016/50-1/jad-50-1-jad150767/jad-50-jad150767-g007.jpg)
Table 1
Baseline characteristics of participants who completed 3 month-test
| Active (19) | Placebo (20) | p | |
| Age (mean±SD) | 67.8±5.6 | 70.6±5.1 | 0.12 |
| Gender (M/F) | 8/11 | 9/10 | 0.74 |
| BMI | 21.6±3.0 | 21.0±5.4 | 0.68 |
| Education (y) | 14.9±2.5 | 15.2±2.4 | 0.80 |
| MMSE | 28.6±1.6 | 29.0±1.1 | 0.48 |
Significance was determined according to Student t-test, and chi-square test (for gender).
Table 2
Estimated intake of anserine and carnosine in each group
| Food | Active Group Ave.±SD | Placebo Group Ave.±SD | p value | |
| Anserine (mg/day) | Poultry | 217±179 | 198±167 | 0.73 |
| Pork | 9.3±8.0 | 4.4±3.1 | 0.02 | |
| Beef | 7.9±7.9 | 7.2±9.7 | 0.79 | |
| Eel | 0±0 | 0±0 | N. D. | |
| White fish | 120±138 | 98±86 | 0.56 | |
| Blue back Fish | 1.2±1.2 | 1.5±1.6 | 0.48 | |
| Red meat Fish | 54.9±53.3 | 67.0±63.5 | 0.53 | |
| Anserine from daily food | 411 ± 278 | 377 ± 271 | 0.70 | |
| Anserine from supplementation | 750 | 0 | N. D. | |
| Anserine (Total) | 1,161 ± 278 | 377 ± 271 | 9.5E-11 | |
| Carnosine (mg/day) | Poultry | 60.9±50.3 | 55.6±46.9 | 0.73 |
| Pork | 124±106 | 58.8±41.4 | 0.02 | |
| Beef | 38.6±38.3 | 34.9±46.9 | 0.79 | |
| Eel | 7.4±5.3 | 6.1±1.7 | 0.34 | |
| White fish | 0±0 | 0±0 | N. D. | |
| Blue back Fish | 32.5±33.4 | 41.4±43.7 | 0.48 | |
| Red meat Fish | 4.3±4.2 | 5.3±5.0 | 0.53 | |
| Carnosine from daily food | 268 ± 135 | 202 ± 110 | 0.10 | |
| Carnosine from supplementation | 250 | 0 | N. D. | |
| Carnosine (Total) | 518 ± 135 | 202 ± 110 | 1.3E-09 | |
| Anserine+Carnosine (mg/day) | 1,679 ± 384 | 579 ± 360 | 4.0E-11 |
Estimated intake of anserine and carnosine was calculated from the results of a 7-item food frequency questionnaires filled out by each volunteer (Materials and Methods section 2.3. Inventory of food intake during 3-month test period) and the average amount of anserine and carnosine in various types of meat described by Boldyrev et al. [6].
Table 3
Scores of neuropsychological tests of the ACS and placebo groups
| Baseline (ave.±SD) | Follow-up (ave.±SD) | Change (ave.±SD) | Interaction (df = 1) | |||||
| Active | Placebo | Active | Placebo | Active | Placebo | F | p value | |
| WMS-LM1 | 13.4±4.2 | 13.2±3.9 | 11.4±3.6 | 10.2±3.7 | –2.0±4.2 | –3.0±2.8 | 0.787 | 0.3807 |
| WMS-LM2 | 11.9±4.1 | 13.1±3.6 | 11.4±3.6 | 9.1±4.1 | 0.5±3.8 | 4.1±3.5 | 9.067 | 0.0047** |
| ADAScog | 9.6±3.7 | 9.1±9.2 | 8.8±4.6 | 9.2±4.7 | –0.80±3.5 | 0.16±4.9 | 0.500 | 0.4839 |
| BDI | 10.2±6.4 | 8.8±6.9 | 6.8±4.8 | 7.4±4.4 | –3.4±4.2 | –1.4±5.6 | 1.641 | 0.2082 |
| SF-36 MCS | 54.0±8.6 | 50.6±7.0 | 54.0±7.5 | 52.8±5.9 | –0.02±6.5 | 2.12±6.8 | 1.024 | 0.3182 |
| SF-36 PCS | 47.4±8.1 | 48.0±7.3 | 48.5±5.9 | 47.3±9.3 | 1.04±8.0 | –0.67±8.0 | 0.443 | 0.5100 |
Scores of the baseline and follow-up tests are shown (mean±SD). Active: ACS group. Change: score at follow-up –score at baseline. Significance was determined by two-way repeated ANOVA (Time [baseline or follow-up]×Variant [ACS or placebo]), by utilizing GraphPad Prism (GraphPad Software, Inc. La Jolla, CA. www.graphpad.com). The F(df1) and P value obtained after the interaction analysis (Time×Variant) are shown. **p < 0.01 between the two groups without any adjustment. After age-adjustment, F(1) = 6.8588 and p = 0.0128 between the two groups.
Table 4
Baseline characteristics of another RCT participants who completed 6 month-test
| Active (42) | Placebo (42) | p | |
| Age (mean±SD) | 69.4±5.9 | 70.4±5.7 | 0.43 |
| Gender (M/F) | 19/23 | 18/24 | 0.83 |
| BMI | 22.9±2.7 | 22.3±2.7 | 0.29 |
| Education (y) | 14.9±1.9 | 14.6±3.0 | 0.52 |
| MMSE | 27.7±1.7 | 27.7±1.9 | 0.85 |
Significance was determined according to Student t-test, and chi-square test (for gender).


