
Empirically Defining Trajectories of Late-Life Cognitive and Functional Decline
Abstract
Background:
Alzheimer’s disease (AD) is associated with variable cognitive and functional decline, and it is difficult to predict who will develop the disease and how they will progress.
Objective:
This exploratory study aimed to define latent classes from participants in the Alzheimer’s Disease Neuroimaging Initiative (ADNI) database who had similar growth patterns of both cognitive and functional change using Growth Mixture Modeling (GMM), identify characteristics associated with those trajectories, and develop a decision tree using clinical predictors to determine which trajectory, as determined by GMM, individuals will most likely follow.
Methods:
We used ADNI early mild cognitive impairment (EMCI), late MCI (LMCI), AD dementia, and healthy control (HC) participants with known amyloid-β status and follow-up assessments on the Alzheimer’s Disease Assessment Scale - Cognitive Subscale or the Functional Activities Questionnaire (FAQ) up to 24 months postbaseline. GMM defined trajectories. Classification and Regression Tree (CART) used certain baseline variables to predict likely trajectory path.
Results:
GMM identified three trajectory classes (C): C1 (n = 162, 13.6%) highest baseline impairment and steepest pattern of cognitive/functional decline; C3 (n = 819, 68.7%) lowest baseline impairment and minimal change on both; C2 (n = 211, 17.7%) intermediate pattern, worsening on both, but less steep than C1. C3 had fewer amyloid- or apolipoprotein-E ɛ4 (APOE4) positive and more healthy controls (HC) or EMCI cases. CART analysis identified two decision nodes using the FAQ to predict likely class with 82.3% estimated accuracy.
Conclusions:
Cognitive/functional change followed three trajectories with greater baseline impairment and amyloid and APOE4 positivity associated with greater progression. FAQ may predict trajectory class.
INTRODUCTION
Alzheimer’s disease (AD) is a progressive neurodegenerative disease typically characterized by slow cognitive and functional decline; however, considerable variability in rate of progression makes it hard to predict an individual’s future course. AD is a continuum beginning pathologically decades before symptoms appear (preclinical stage) [1]. Symptoms progress through an early to late phase of mild cognitive impairment (MCI) and then worsen to include a more pronounced functional impairment referred to as dementia. Clinicians would like to provide patients with a likelihood of progression and how fast it may occur. Early detection and intervention might delay cognitive deterioration and/or reduce costs, especially in someone who could progress quickly. It is also important to understand disease progression for future clinical trials.
While historically AD progression has been modeled as a linear process, we now know that progression is typically slower in early disease stages and then increases more rapidly as the patient progresses into dementia [2, 3]. Sona and colleagues reviewed 82 studies assessing the role that various factors may have on rapid cognitive decline in AD [4]. In the studies reviewed, disease progression was modeled using individuals’ mean cognitive scores that were regressed on covariates such as diagnosis, age, and education, to determine their impact on disease progression [4]. These approaches attempt to describe the relationships among variables with the goal of identifying significant predictors of outcome. The limitation of these types of analyses is that they do not allow for subpopulations with variable rates of progression and they assume that one trajectory is adequate to describe the whole study population.
Growth Mixture Modeling (GMM) is a modeling approach that looks for relationships among individuals’ trajectories with the goal of classifying groups based on similar growth patterns [5, 6]. This approach enables identification of unobserved subpopulations based on similarities in their growth patterns over time rather than assuming that one trajectory approximates the whole population. Additionally, GMM allows for non-linear (e.g., quadratic) progression curves. Several studies have used GMM to follow trajectories of change in cognition and/or functioning in subjects at various stages of AD. Small and Backman utilized GMM to follow longitudinal trajectories of cognitive change as assessed by decline in Mini-Mental State Examination (MMSE) scores in preclinical AD and reported that a two-group quadratic model (and not a linear model) of cognitive decline provided the best statistical fit to the observed data [7]. Others have used GMM to follow trajectories of cognitive decline in cognitively healthy older adults followed for up to 54 months [8], and in Caucasian subjects with possible or probable AD for up to 13.5 years [9]. Leoutsakos et al. used parallel-process GMM to model class membership jointly as a function of both cognitive and functional decline by assessing change in MMSE and Clinical Dementia Rating Sum of Boxes (CDR-SB) scores and reported four distinct latent classes [10].
The objectives of this exploratory study were to define unobserved subgroups (latent classes) from participants in the Alzheimer’s Disease Neuroimaging Initiative (ADNI) database who had similar growth patterns of both cognitive and functional change using GMM, and to identify characteristics associated with those trajectories. We then applied Classification and Regression Tree (CART) analysis [11] to develop a decision tree that uses clinical predictors that could be applied to individuals to determine which trajectory, as determined by GMM, they will most likely follow.
METHODS
Subjects
Data were obtained in August 2013 from the ADNI database (http://adni.loni.usc.edu). ADNI recruited cognitively normal older individuals (healthy control, HC), and persons with early or late MCI (EMCI, LMCI) and AD dementia across the U.S. and Canada. Baseline characteristics of the overall population can be found in Table 1. Written informed consent was obtained for participation and approved by the institutional review board at each participating center. Detailed diagnostic, inclusion and exclusion criteria are described on the ADNI website (http://www.adni-info.org/).
We included all HC, EMCI, LMCI, and AD dementia subjects from ADNI -1, ADNI-GO, and ADNI-2 who had at least one amyloid measurement using cerebrospinal fluid (CSF) amyloid β1-42 (Aβ42), [11C] Pittsburgh compound B (PiB) positron emission tomography (PET) or [18F] florbetapir (FBP) PET, and at least one post-baseline assessment on the Alzheimer’s Disease Assessment Scale–Cognitive Subscale (ADAS-Cog13) or the Functional Activities Questionnaire (FAQ). Our study defined the baseline visit as the first amyloid measurement visit, for which we also used that associated clinical diagnosis. All EMCI and LMCI subjects were required to have MMSE scores between 24–30 (inclusive), a subjective memory concern reported by subject, informant, or clinician, absence of significant levels of impairment in other cognitive domains, essentially preserved activities of daily living, and an absence of dementia. EMCI and LMCI were distinguished from each other using education adjusted scores on delayed recall of one paragraph from Wechsler Memory Scale-Revised Logical Memory II (WMS-LMII) (EMCI: ≥16 years of education: score range 9–11; 8–15 years: 5–9; 0–7 years: 3–6; LMCI: ≥16 years: ≤8; 8–15 years: ≤4; 0–7 years: ≤2). For some subjects the first amyloid measurement (our study baseline) occurred after initial enrollment in ADNI, and those who converted to MCI were not designated as EMCI and LMCI at post-entry follow-up visits. For those MCI subjects, we applied the WMS-LMII education-adjusted score ranges from the ADNI-2 protocol to separate them into EMCI and LCMI groups. Inclusion criteria for AD subjects were MMSE scores between 20–26 (inclusive), a global Clinical Dementia Rating Scale score of 0.5 or 1.0, and meeting National Institute of Neurological and Communicative Disorders and Stroke and the Alzheimer’s Disease and Related Disorders Association (NINCDS/ADRDA) criteria for probable AD. A specific functional scale was not mandated as part of the clinical diagnosis.
Amyloid positive status was defined according to either PiB-PET composite standard uptake value ratio (SUVR) mean across five regions of interest (ROI) (anterior cingulate, frontal, lateral temporal, precuneus, and parietal cortices) of >1.6 normalized to the cerebellar cortex [12], FBP-PET composite SUVR of ≥1.1 mean across six ROIs (anterior and posterior cingulate, precuneus, frontal, temporal, and parietal cortices) using the whole cerebellum reference region [13], or CSF Aβ42 ≤192 pg/ml [14]. When a subject had more than one amyloid measure at baseline, the amyloid status was considered to be positive if at least one measure was positive.
The ADAS-Cog13, a 13-item cognitive test (score range 0 [normal] to 85 [impaired]), and the FAQ, an informant-rated, 10-item functional scale (score range 0 [no impairment] to 30 [dependent]), were assessed at baseline, 6-, 12-, and 24-month visits.
Demographic data, apolipoprotein E ɛ4 (APOE4) status (presence or not of at least one ɛ4 allele), FAQ, MMSE, Montreal Cognitive Assessment (MoCA), WMS-LMII, CDR-SB, Trail Making Test (TMT) Parts A and B, Geriatric Depression Scale (GDS) short form, and Neuropsychiatric Inventory (NPI)-Q scores were also documented from our study baseline visit.
Statistical analyses
GMM jointly modeled ADAS-Cog13 and FAQ scores to identify unobserved subpopulations based on similarity in trajectories, regardless of diagnosis or other clinical characteristics [5, 6]. The optimal number of subpopulations was determined by evaluating k (starting from 2) classes versus k-1 classes sequentially, until adding an additional class no longer statistically significantly improved fit through Lo-Mendell-Rubin-Adjusted Likelihood Ratio test. The mean structure (i.e., linear, quadratic, cubic, etc.) in GMM was determined by selecting the best-fitting model as defined by the largest Entropy and lowest Bayesian information criterion value.
Baseline characteristics were compared among the latent classes, including diagnosis, demographics, comorbidities, other clinical and cognitive measures, and amyloid and APOE4 status, with a likelihood ratio test in multinomial logit model for categorical characteristics, and analysis of variance for continuous measures. Uncertain class assignment was taken into consideration, using the three-step approach proposed in Asparouhov and Muthen [15].
CART [11] evaluated baseline variables to determine those that best predicted GMM most likely class membership. The model included gender, amyloid status, history of alcohol, smoking, cardiovascular disease, endocrine disease, education, age, as well as animal category fluency, FAQ, MMSE, MoCA, and NPI-Q scores. We built the classification tree using all data. Prediction accuracy was obtained through 10-fold cross-validation.
GMM was done in Mplus 7.1. CART was implemented using rpart package in R 15.3. And SAS 9.2 was used for all other analyses. Significance level of 0.05 was used when applicable.
RESULTS
The total dataset included 325 HC, 279 EMCI, 372 LMCI, and 216 AD dementia subjects. The average length of follow-up for the FAQ was 16.3 months (SD ± 7.1) and for the ADAS-Cog13 was 16.2 (± 7.1). Overall, 60% subjects were considered amyloid positive with amyloid positivity increasing with advanced disease stage (HC 35.1% , EMCI 51.3% , LMCI 71.8% , AD 91.7%). There were 31 cases that had discrepant amyloid results between CSF and FBP-PET (20 of the 31 discrepant cases were CSF positive but FBP-PET negative, and the opposite was true for the remaining 11 cases).
Table 2 shows a number of GMM models from which the final model was selected. The final model identified three quadratic trajectories across all subjects for cognitive/functional change as measured by the ADAS-Cog13 and FAQ bivariate analysis. While the graphs in Fig. 1 illustrate trajectories using mean values of individuals assigned to each class for each scale separately, GMM took both cognition and function into consideration when determining the classes. Additionally, Fig. 2 illustrates spaghetti plots of individuals’ trajectories in each class, overlayed with the fitted mean trajectory of that class.
Class 1 (n = 162, 13.6%) had the highest baseline FAQ and ADAS-Cog13 scores and steepest pattern of cognitive and functional worsening of all classes. In contrast, Class 3 (n = 819, 68.7%) had the lowest baseline FAQ and ADAS-Cog13 scores and minimal change on both over time. Class 2 (n = 211, 17.7%) had an intermediate pattern with baseline FAQ and ADAS-Cog13 scores that were more impaired than Class 3 but less than Class 1, and worsening on both scales that was slower than for Class 1.
Table 1 shows baseline demographics by latent class. Significant differences were observed among the three classes across most variables including age (p = 0.0021), APOE4 status (p < 0.0001), amyloid status (p < 0.0001), diagnosis (p < 0.0001), alcohol abuse (p = 0.0474), and all clinical and cognitive measures (p < 0.0001 except GDS p = 0.0007). No significant differences were observed for gender, education, or comorbidities of smoking, cardiovascular disease, or endocrine disease. On average, Class 1 subjects were older and more likely amyloid (92%) or APOE4 (69.1%) positive. The majority of Class 1 was diagnosed with AD dementia (79%) or LMCI (17.9%). This group showed the greatest amount of impairment across measures of cognition and function and the greatest neuropsychiatric symptom severity.
In contrast, Class 3 subjects were younger and less likely to be amyloid (48.2%) or APOE4 (38.3%) positive. Class 3 included HCs (39%) or were diagnosed with EMCI (29.9%) or LMCI (29.1%), and showed the least amount of impairment across all measures of cognition and function, and the lowest neuropsychiatric symptom severity.
Class 2 subjects were HCs (0.9%) or diagnosed with EMCI (13.7%), LMCI (49.8%), or AD dementia (35.5%). Subjects were close in age to Class 1, and a higher percentage than Class 3 was amyloid (84.4%) or APOE4 (64%) positive but slightly less than Class 1. Baseline scores on cognitive, functional, and neuropsychiatric scales were intermediate between Classes 1 and 3.
Figure 3 shows FAQ or ADAS-Cog13 mean scores by diagnostic group graphed adjacent to each class’s trajectory line. As expected, the arrays for mean score lines were ordered according to level of impairment of each diagnostic group and either above or below the latent class line.
CART analysis identified the FAQ as the input variable most predictive of latent classes found in GMM with two decision nodes that separated subjects into their most likely class at an estimated prediction accuracy of 82.3% (SD 1.11%) (Fig. 4). The first node partitioned Class 3 if the FAQ score was <5. The remaining subjects were split at the second node into Class 2 if the FAQ was <14, and into Class 1 if the FAQ was ≥14.
DISCUSSION
We approached the topic of clinical trajectories by using a person-centered modeling approach (GMM) in contrast to most other reports that use variable-centered approaches [4]. This enabled us to discern unobserved subpopulations based on similarities in their growth patterns over time rather than to assume that one trajectory approximates the whole population or to specify subgroups based on one or more variables. We found that the combination of cognitive and functional change over a 24-month period followed three distinct trajectories, represented by one class with the lowest baseline cognitive and functional impairment and virtually no change (Class 3) and two classes that both progressed but were separated by their degree of baseline impairment. Additionally, there were some clinical characteristics that differed across the classes, such as diagnosis, APOE4, and amyloid status. Our study included cases ranging from HC through AD dementia as diagnosed in the ADNI cohort, while other studies may not have addressed this whole spectrum. Further, we only selected ADNI cases where amyloid status was known, whereas most prior reports do not have the benefit of knowing amyloid status. Finally, GMM allowed quadratic in addition to lineartrajectories.
Our study found three trajectories of cognitive and functional change. Class 1 had the highest baseline FAQ and ADAS-Cog13 scores and the steepest pattern of cognitive and functional worsening. In contrast, Class 3, the largest group, had the lowest baseline FAQ and ADAS-Cog13 scores and minimal change on both scales. Not surprisingly, its constituents had diagnoses suggesting earlier stages of disease (% HCs>EMCI = LMCI). It is notable that almost half the individuals in this class of non-progressors were amyloid positive and we may have seen this class progress with a longer follow-up period. Class 2 had an intermediate pattern with baseline FAQ and ADAS-Cog13 scores that were more impaired than Class 3 but less than Class 1, and worsening on both scales, but less steep than for Class 1. Consistent with this pattern, Class 2 constituents, by diagnosis (% LMCI>AD dementia>EMCI), reflected less overall disease severity than in Class 1 (% AD dementia>LMCI>EMCI). A longer follow-up period could confirm whether the trajectory for Class 2 would eventually look like that for Class 1 as patients become more impaired. It is important to note that we did not look at the relationship between cognitive and functional decline because GMM was a bivariate analysis, nor do we know how the scales perform relative to each other in a psychometric fashion.
Previous studies have described trajectories of change in cognition and behavior in subjects with MCI or AD dementia. Xie and colleagues [16] used group-based trajectory analysis to identify distinct cognitive change patterns among a cohort of 187 MCI patients from two geriatric outpatient clinics over a course of up to 3.5 years. Five trajectories were identified and labeled based on their baseline MMSE score. Their two least cognitively impaired groups (MMSE of 27 and 29) had a stable course, which is consistent with our findings for Class 3.
Other studies with longer patient follow-up periods (up to 13.5 years) [9, 10] found that cognitive function, as measured by the MMSE, eventually declined to very low levels in almost all of the trajectories. In contrast, studies that delineate a group with a stable cognitive trajectory [2] or “nonprogression” in cognition and function (like ours) have the shortest follow-up periods (2 to 3.5 years). Wilkosz and colleagues [9] used latent class modeling and found six trajectories of cognitive and behavioral decline in a cohort of 201 Caucasian subjects with possible or probable AD dementia followed for up to 13.5 years. The concomitant variables included in the best latent class trajectory model were initial MMSE and age. Also, two of our co-authors (JSL and CGL) completed an analysis to identify classes of progression trajectories in incident AD dementia cases from the Cache County Dementia Progression Study in up to 8 years of follow-up, and to identify baseline predictors of membership for each group [10]. Using bivariate GMM based on MMSE and CDR-SB scores, those authors identified four latent classes. Class 1 was the largest (72%) and had theslowest progression as compared to the other three classes with more rapid worsening. In a multivariate model, only MMSE was a statistically significant predictor of likely class membership. However, these two studies only included subjects with dementia. Our study also included HC and EMCI subjects who progress more gradually over many years [17]. Overall, our findings are consistent with reports that the course of cognitive impairment in clinically diagnosed AD is variable, starts slow and progressively increases over time [2, 17].
A recent review of 82 studies that reported at least one factor associated with rate of progression for an AD patient population considered an extensive list of potential factors such as age, age of onset, gender, education, family history of dementia, MMSE and CDR scale baseline scores, comorbidities, APOE genotype, and cholinesterase inhibitor use [4]. Study results were often contradictory, and no reliable conclusions regarding factors possibly associated with rapid cognitive decline could be made; however, a trend was found for younger, more educated and/or more impaired patients. The more rapid decline in the higher educated is consistent with the hypothesis that higher cognitive reserve protects from early clinical manifestation of AD, but later patients deteriorate more rapidly as the disease progresses.
We found that class membership was associated with baseline age, APOE4 and amyloid status, diagnosis, and all cognitive, functional, and neuropsychiatric scores. Subjects that progressed were more often APOE4 or amyloid positive, older in age, and later in their disease stage. A number of studies, but not all [18], report that younger subjects have a more rapid decline in cognition compared to older subjects, as reviewed by Sona et al. [4]. However, we found an opposite association for age with class membership where subjects in Class 1 with the steepest progression were older than in Class 3, though we did not control for time from disease onset or disease severity, and AD and HC groups were age-matched, while EMCI and LMCI groups were younger on average. This finding may be driven by the fact that amyloid portends poorer outcome, especially when combined with other pathologies that increase with aging. Our findings are consistent with a number, but not all, of other studies that report greater cognitive decline in subjects with worse baseline cognitive impairment [3, 4, 19, 20]. APOE4 positivity is associated with a greater decline in function [21] and cognition [22, 23], although this relationship has not been observed consistently [24–27]. Possible explanations have focused on linear versus non-linear statistical models [22], or different AD clinical populations [23]. Our study results are consistent with a number of studies showing that amyloid positivity is associated with worse baseline scores and disease progression [1, 28–33]. Additionally, a faster decline in cognition is reportedly associated with increased neuropsychiatric symptom severity including agitation and wandering [34], hallucinations and delusions [35], and depressive symptoms [36]. Our results showed a higher NPI-Q score was associated with faster progression, but the overall severity of neuropsychiatric symptoms was low in our sample.
We did not find class membership to be associated with gender, education, or comorbidities of smoking, cardiovascular disease, or endocrine disease, although there is other evidence that vascular risk factors are associated with greater functional and cognitive decline [26, 37, 38]. Regan and colleagues [39] note though these risk factors may contribute to AD initially, they are not part of the underlying disease process. Alcohol abuse showed a significant difference among the trajectory classes in our analysis, but the percentage of patients reporting alcohol abuse was relatively low among the groups (range: 3.3% to 8%), making this finding less reliable. Those with higher cognitive reserve (more years of education) diagnosed with AD show an initial delay in symptom expression, followed by a more rapid rate of cognitive decline [4]. In the current study, education did not differ among the three classes, though most subjects in the ADNI cohort have a high level of education, limiting the ability to study this factor.
CART analysis can uncover complex interactions among predictors of trajectory class membership which could be difficult to identify using traditional multivariate techniques [11]. The result is a decision tree with a series of if-then scenarios to best allocate individuals to a particular class when applying the variable cutoff values that produced the best fit. This provides a straightforward approach to apply clinical predictors. The CART analysis identified two decision nodes, both based on FAQ results, to predict which subjects most likely belong to the GMM classes. While the ADAS-Cog13 and FAQ results jointly defined the original GMM classes, we chose to exclude the ADAS-Cog13 because it is utilized in research and not available to a clinician. However, we ran a separate CART analysis that included the ADAS-Cog and the FAQ remained the main differentiator. It is noteworthy that baseline cognitive variables or amyloid status were not better predictors of GMM membership. The FAQ is a functional measure that includes instrumental activities of daily living, such as preparing balanced meals and managing personal finances, and can be easily administered in a clinician office. Perhaps the FAQ cutoff values of 5 and 14, as identified through CART analysis, can facilitate identification of who will progress in other patient populations. These findings may extend the initial report suggesting a cut point of ≥9 (“dependent” or a score of 3 in three or more activities) to indicate impaired function consistent with dementia [40]. However, CART analyses are exploratory for generating hypotheses that need further testing.
There are some limitations to this study that should be taken into consideration. When determining amyloid status, we used CSF Aβ42, PiB-PET, or FBP-PET results. However, 31 cases had discrepant amyloid results (20 of 31 discrepant cases were CSF positive but FBP-PET negative). Possible reasons for this include the fact that CSF measures soluble Aβ and PET measures insoluble deposited amyloid plaque. Additionally, there is variability across CSF assays and laboratories, with no standardized cutoff for amyloid positivity [41]. ADNI attempts to control for this variability by using a centralized laboratory for the CSF assays but CSF Aβ specimens must be handled carefully and there could be site variability in this handling. For our analyses, we used the latest ADNI cutoffs for CSF amyloid positivity [14]. Another possible cause for the amyloid test discordance could be false negative scan results, which have been observed with FBP-PET [42]. CART uses most likely class membership, and cannot accommodate the fact that a subject could be in another class with smaller probability. Although our sample size of 1,192 was relatively large, the follow-up period of up to two years (mean about 16 months) may not be long enough to see progression, especially earlier in the disease spectrum. In addition, the relatively low incidence of comorbidities, limited racial representation and high years of education in the ADNI population may limit generalizability of these results. We included HCs in the analyses as some are still at risk for AD and could be transitional toward impairment and indeed, some were amyloid positive (35%).
Our findings make a unique contribution to the literature on longitudinal change in older persons, including those clinically diagnosed with MCI and AD dementia and may help inform clinicians and patients when amyloid biomarker testing is not available. Moreover, patients with MCI were further subdivided into EMCI and LMCI to better capture how those categorical designations populated the three latent classes. Our sample was larger than most prior reports and the amyloidstatus of patients was known. Third, we looked at changes in both cognition and function. Lastly, we used CART analysis to develop a decision tree, and identified two decision nodes based on the FAQ that separated patients along the three latent classes. These decision nodes may further the understanding of the FAQ scale cutoff values in relation to severity of impairment.
In summary, the combination of cognitive and functional change over a 24-month period followed three distinct trajectories where positive APOE4 and amyloid status were more associated with a subpopulation that had greater decline over time (64% – 69% and 84% – 92% , respectively). The FAQ score may help to predict trajectory. This type of information could be shared by the physician to help patients and families plan for the future. However, our results are exploratory and should be confirmed in other populations with longer term follow-up.
ACKNOWLEDGMENTS
We would like to acknowledge writing assistance from Sara Kollack-Walker, Ph.D., Associate Consultant – Scientific Communications, Eli Lilly and Company.
Data collection and sharing for this project was funded by the Alzheimer’s Disease. Neuroimaging Initiative (ADNI) (National Institutes of Health Grant U01 AG024904) and DOD ADNI (Department of Defense award number W81XWH-12-2-0012). ADNI is funded by the National Institute on Aging, the National Institute of Biomedical Imaging and Bioengineering, and through generous contributions from the following: AbbVie, Alzheimer’s Association; Alzheimer’s Drug Discovery Foundation; Araclon Biotech; BioClinica, Inc.; Biogen; Bristol-Myers Squibb Company; CereSpir, Inc.; Eisai Inc.; Elan Pharmaceuticals, Inc.; Eli Lilly and Company; EuroImmun; F. Hoffmann-La Roche Ltd and its affiliated company Genentech, Inc.; Fujirebio; GE Healthcare; IXICO Ltd.; Janssen Alzheimer Immunotherapy Research & Development, LLC.; Johnson & Johnson Pharmaceutical Research & Development LLC.; Lumosity; Lundbeck; Merck & Co., Inc.; Meso Scale Diagnostics, LLC.; NeuroRx Research; Neurotrack Technologies; Novartis Pharmaceuticals Corporation; Pfizer Inc.; Piramal Imaging; Servier; Takeda Pharmaceutical Company; and Transition Therapeutics. The Canadian Institutes of Health Research is providing funds to support ADNI clinical sites in Canada. Private sector contributions are facilitated by the Foundation for the National Institutes of Health (http://www.fnih.org). The grantee organization is the Northern California Institute for Research and Education, and the study is coordinated by the Alzheimer’s Disease Cooperative Study at the University of California, San Diego. ADNI data are disseminated by the Laboratory for Neuro Imaging at the University of Southern California.
Authors’ disclosures available online (http://j-alz.com/manuscript-disclosures/15-0563r1).
REFERENCES
[1] | Villemagne VL , Pike KE , Chételat G , Ellis KA , Mulligan RS , Bourgeat P , Ackermann U , Jones G , Szoeke C , Salvado O , Martins R , O’Keefe G , Mathis CA , Klunk WE , Ames D , Masters CL , Rowe CC ((2011) ) Longitudinal assessment of Aβ and cognition in aging and Alzheimer disease. Ann Neurol 69: , 181–192. |
[2] | Xie SX , Ewbank DC , Chittams J , Karlawish JH , Arnold SE , Clark CM ((2009) ) Rate of decline in Alzheimer disease measured by a Dementia Severity Rating Scale. Alzheimer Dis Assoc Disord 23: , 268–274. |
[3] | Ito K , Corrigan B , Zhao Q , French J , Miller R , Soares H , Katz E , Nicholas T , Billing B , Anziano R , Fullerton T , Alzheimer’s Disease Neuroimaging, Initiative ((2011) ) Disease progression model for cognitive deterioration from Alzheimer’s Disease Neuroimaging Initiative database. Alzheimers Dement 7: , 151–160. |
[4] | Sona A , Ellis KA , Ames D ((2013) ) Rapid cognitive decline in Alzheimer’s disease: A literature review. Int Rev Psychiatry 25: , 650–658. |
[5] | Muthen B ((2004) ) Latent variable analysis: Growth mixture modeling and related techniques for longitudinal data. In Handbook of Quantitative Methodology for the Social Sciences, Kaplan D , Ed. Sage Publications, Newbury Park, CA, pp. 345–368. |
[6] | Jung T , Wickrama KAS ((2008) ) An introduction to latent class growth analysis and growth mixture modeling. Soc Personal Psychol Compass 2: , 302–317. |
[7] | Small BJ , Backman L ((2007) ) Longitudinal trajectories of cognitive change in preclinical Alzheimer’s disease: A growth mixture modeling analysis. Cortex 43: , 826–834. |
[8] | Pietrzak RH , Lim YY , Ames D , Harrington K , Restrepo C , Martins RN , Rembach A , Laws SM , Masters CL , Villemagne VL , Rowe CC , Maruff P , Australian Imaging, Biomarkers, Lifestyle (AIBL) Research, Group ((2015) ) Trajectories of memory decline in preclinical Alzheimer’s disease: Results from the Australian Imaging, Biomarkers and Lifestyle Flagship Study of Ageing. Neurobiol Aging 36: , 1231–1238. |
[9] | Wilkosz P , Seltman HJ , Devlin B , Weamer EA , Lopez OL , DeKosky ST , Sweet RA ((2010) ) Trajectories of cognitive decline in Alzheimer’s disease. Int Psychogeriatr 22: , 281–290. |
[10] | Leoutsakos JS , Forrester SN , Corcoran CD , Norton MC , Rabins PV , Steinberg MI , Tschanz JT , Lyketsos CG ((2015) ) Latent classes of course in Alzheimer’s disease and predictors: The Cache County Dementia Progression Study. Int J Ger Psychiatry 30: , 824–832. |
[11] | Breiman L , Friedman JH , Olshen RA , Stone CJ ((1984) ) Classification and Regression Trees. Chapman & Hall (Wadsworth Inc.), New York. |
[12] | Pike KE , Savage G , Villemagne VL , Ng S , Moss SA , Maruff P , Mathis CA , Klunk WE , Masters CL , Rowe CC ((2007) ) Beta-amyloid imaging and memory in non-demented individuals: Evidence for preclinical Alzheimer’s disease. Brain 130: , 2837–2844. |
[13] | Joshi AD , Pontecorvo MJ , Clark CM , Carpenter AP , Jennings DL , Sadowsky CH , Adler LP , Kovnat KD , Seibyl JP , Arora A , Saha K , Burns JD , Lowrey MJ , Mintun MA , Skovronsky DM , Florbetapir F 18 Study, Investigators ((2012) ) Performance characteristics of amyloid PET with florbetapir F 18 in patients with Alzheimer’s disease and cognitively normal subjects. J Nucl Med 53: , 378–384. |
[14] | Shaw LM , Vanderstichele H , Knapik-Czajka M , Clark CM , Aisen PS , Petersen RC , Blennow K , Soares H , Simon A , Lewczuk P , Dean R , Siemers E , Potter W , Lee VM , Trojanowski JQ , Alzheimer’s Disease Neuroimaging Initiative ((2009) ) Cerebrospinal fluid biomarker signature in Alzheimer’s disease neuroimaging initiative subjects. Ann Neurol 65: , 403–413. |
[15] | Asparouhov T , Muthén B ((2014) ) Auxiliary variables in mixture modeling: Three-step approaches using Mplus. Struct Equ Modeling 21: , 329–341. |
[16] | Xie H , Mayo N , Koski L ((2011) ) Identifying and characterizing trajectories of cognitive change in older persons with mild cognitive impairment. Dement Geriatr Cogn Disord 31: , 165–172. |
[17] | Villemagne VL , Burnham S , Bourgeat P , Brown B , Ellis KA , Salvado O , Szoeke C , Macaulay SL , Martins R , Maruff P , Ames D , Rowe CC , Masters CL , Australian Imaging Biomarkers Lifestyle (AIBL) Research Group ((2013) ) Amyloid β deposition, neurodegeneration, and cognitive decline in sporadic Alzheimer’s disease: A prospective cohort study. Lancet Neurol 12: , 357–367. |
[18] | Backman L , Jones S , Small BJ , Aguero-Torres H , Fratiglioni L ((2003) ) Rate of cognitive decline in preclinical Alzheimer’s disease: The role of comorbidity. J Gerontol B Psychol Sci Soc Sci 58B: , 228–236. |
[19] | Morris JC , Roe CM , Grant EA , Head D , Storandt M , Goate AM , Fagan AM , Holtzman DM , Mintun MA ((2009) ) Pittsburgh compound B imaging and prediction of progression from cognitive normality to symptomatic Alzheimer disease. Arch Neurol 66: , 1469–1475. |
[20] | Parikh M , Hynan LS , Weiner MF , Lacritz L , Ringe W , Cullum CM ((2014) ) Single neuropsychological test scores associated with rate of cognitive decline in early Alzheimer disease. Clin Neuropsychol 28: , 926–940. |
[21] | Dal Forno G , Xeno-Rasmusson D , Brandt J , Carson KA , Brookmeyer R , Troncoso J , Kawas CH ((1996) ) Apolipoprotein E genotype and rate of decline in probable Alzheimer’s disease. Arch Neurol 53: , 345–350. |
[22] | Martins CA , Oulhaj A , de Jager CA , Williams JH ((2005) ) alleles predict the rate of cognitive decline in Alzheimer disease. A nonlinear model. Neurology 65: , 1888–1893. |
[23] | Cosentino S , Scarmeas N , Helzner E , Glymour MM , Brandt J , Albert M , Blacker D , Stern Y ((2008) ) APOE epsilon 4 allele predicts faster cognitive decline in mild Alzheimer disease. Neurology 70: , 1842–1849. |
[24] | Growdon JH , Locascio JJ , Corkin S , Gomez-Isla T , Hyman BT ((1996) ) Apolipoprotein E genotype does not influence rates of cognitive decline in Alzheimer’s disease. Neurology 47: , 444–448. |
[25] | Murphy GM Jr , Taylor J , Kraemer HC , Yesavage J , Tinklenberg JR ((1997) ) No association between Apolipoprotein E ɛ4 allele and rate of decline in Alzheimer’s disease. Am J Psychiatry 154: , 603–608. |
[26] | Aerssens J , Raeymaekersa P , Lilienfeldb S , Geertsc H , Koningsd F , Parys W ((2001) ) APOE genotype: No influence on galantamine treatment efficacy nor on rate of decline in Alzheimer’s Disease. Dement Geriatr Cogn Disord 12: , 69–77. |
[27] | Tschanz JT , Corcoran CD , Schwartz S , Treiber K , Green RC , Norton MC , Mielke MM , Piercy K , Steinberg M , Rabins PV , Leoutsakos JM , Welsh-Bohmer KA , Breitner JC , Lyketsos CG ((2011) ) Progression of cognitive, functional, and neuropsychiatric symptom domains in a population cohort with Alzheimer dementia: The Cache County Dementia Progression study. Am J Geriatr Psychiatry 19: , 532–542. |
[28] | Gustafson DR , Skoog I , Rosengren L , Zetterberg H , Blennow K ((2007) ) Cerebrospinal fluid beta-amyloid 1-42 concentration may predict cognitive decline in older women. J Neurol Neurosurg Psychiatry 78: , 461–464. |
[29] | Fagan AM , Roe CM , Xiong C , Mintun MA , Morris JC , Holtzman DM ((2007) ) Cerebrospinal fluid tau/beta-amyloid(42) ratio as a prediction of cognitive decline in nondemented older adults. Arch Neurol 64: , 343–349. |
[30] | Samtani MN , Raghavan N , Shi Y , Novak G , Farnum M , Lobanov V , Schultz T , Yang E , DiBernardo A , Narayan VA , Alzheimer’s Disease Neuroimaging Initiative ((2013) ) Disease progression model in subjects with mild cognitive impairment from the Alzheimer’s disease neuroimaging initiative: CSF biomarkers predict population subtypes. Br J Clin Pharmacol 75: , 146–161. |
[31] | Doraiswamy PM , Sperling RA , Johnson K , Reiman EM , Wong TZ , Sabbagh MN , Sadowsky CH , Fleisher AS , Carpenter A , Joshi AD , Lu M7 , Grundman M , Mintun MA , Skovronsky DM , Pontecorvo MJ , AV45-A11 Study Group ((2014) ) Florbetapir F 18 amyloid PET and 36-month cognitive decline: A prospective multicenter study. Mol Psychiatry 19: , 1044–1051. |
[32] | Doraiswamy PM , Sperling RA , Coleman RE , Johnson KA , Reiman EM , Davis MD , Grundman M , Sabbagh MN , Sadowsky CH , Fleisher AS , Carpenter A , Clark CM , Joshi AD , Mintun MA , Skovronsky DM , Pontecorvo MJ , AV45-A11 Study Group ((2012) ) Amyloid-β assessed by florbetapir F 18 PET and 18-month cognitive decline: A multicenter study. Neurology 79: , 1636–1644. |
[33] | Resnick SM , Sojkova J , Zhou Y , An Y , Ye W , Holt DP , Dannals RF , Mathis CA , Klunk WE , Ferrucci L , Kraut MA , Wong DF ((2010) ) Longitudinal cognitive decline is associated with fibrillar amyloid-beta measured by [11C]PiB. Neurology 74: , 807–815. |
[34] | Miller TP , Tinklenberg JR , Brooks JO 3rd , Fenn HH , Yesavage JA ((1993) ) Selected psychiatric symptoms associated with rate of cognitive decline in patients with Alzheimer’s disease. J Geriatr Psychiatry Neurol 6: , 235–238. |
[35] | Wilson RS , Gilley DS , Bennett DA , Beckett LA , Evans DA ((2000) ) Hallucinations, delusions, and cognitive decline in Alzheimer’s disease. J Neurol Neurosurg Psychiatry 69: , 172–177. |
[36] | Wilson RS , Barnes LL , Mendes de Leon CF , Aggarwal NT , Schneider JS , Bach J , Pilat J , Beckett LA , Arnold SE , Evans DA , Bennett DA ((2002) ) Depressive symptoms, cognitive decline, and risk of AD in older persons. Neurology 59: , 364–370. |
[37] | Mielke MM , Rosenberg PB , Tschanz J , Cook L , Corcoran C , Hayden KM , Norton M , Rabins PV , Green RC , Welsh-Bohmer KA , Breitner JC , Munger R , Lyketsos CG ((2007) ) Vascular factors predict rate of progression in Alzheimer disease. Neurology 69: , 1850–1858. |
[38] | Lorius N , Locascio JJ , Rentz DM , Johnson KA , Sperling RA , Viswanathan A , Marshall GA , Alzheimer’s Disease Neuroimaging Initiative ((2015) ) Vascular disease and risk factors are associated with cognitive decline in the Alzheimer disease spectrum. Alzheimer Dis Assoc Disord 29: , 18–25. |
[39] | Regan C , Katona C , Walker Z , Hooper J , Donovan J , Livingston G ((2006) ) Relationship of vascular risk to the progression of Alzheimer disease. Neurology 67: , 1357–1362. |
[40] | Pfeffer R , Kurosaki T , Harrah CH Jr , Chance JM , Filos S ((1982) ) Measurement of functional activities of older adults in the community. J Gerontol 37: , 323–329. |
[41] | Mattsson N , Andreasson U , Persson S , Carrillo MC , Collins S , Chalbot S , Cutler N , Dufour-Rainfray D , Fagan AM , Heegaard NH , Robin Hsiung GY , Hyman B , Iqbal K , Kaeser SA , Lachno DR , Lleó A , Lewczuk P , Molinuevo JL , Parchi P , Regeniter A , Rissman RA , Rosenmann H , Sancesario G , Schröder J , Shaw LM , Teunissen CE , Trojanowski JQ , Vanderstichele H , Vandijck M , Verbeek MM , Zetterberg H , Blennow K , Alzheimer’s Association QC Program Work Group ((2013) ) CSF biomarker variability in the Alzheimer’s Association quality control program. Alzheimers Dement 9: , 251–261. |
[42] | Clark CM , Pontecorvo MJ , Beach TG , Bedell BJ , Coleman RE , Doraiswamy PM , Fleisher AS , Reiman EM , Sabbagh MN , Sadowsky CH , Schneider JA , Arora A , Carpenter AP , Flitter ML , Joshi A , Krautkramer MJ , Lu M , Mintun MA , Skovronsky DM , for the AV-45-A16 Study Group ((2012) ) Cerebral PET with florbetapir compared with neuropathology at autopsy for detection of neuritic amyloid-β plaques; a prospective cohort study. Lancet Neurol 11: , 669–678. |
Figures and Tables
Fig.1
Three trajectories (latent classes) are graphed for the FAQ (left) and ADAS-Cog13 (right) when jointly modeled by GMM.
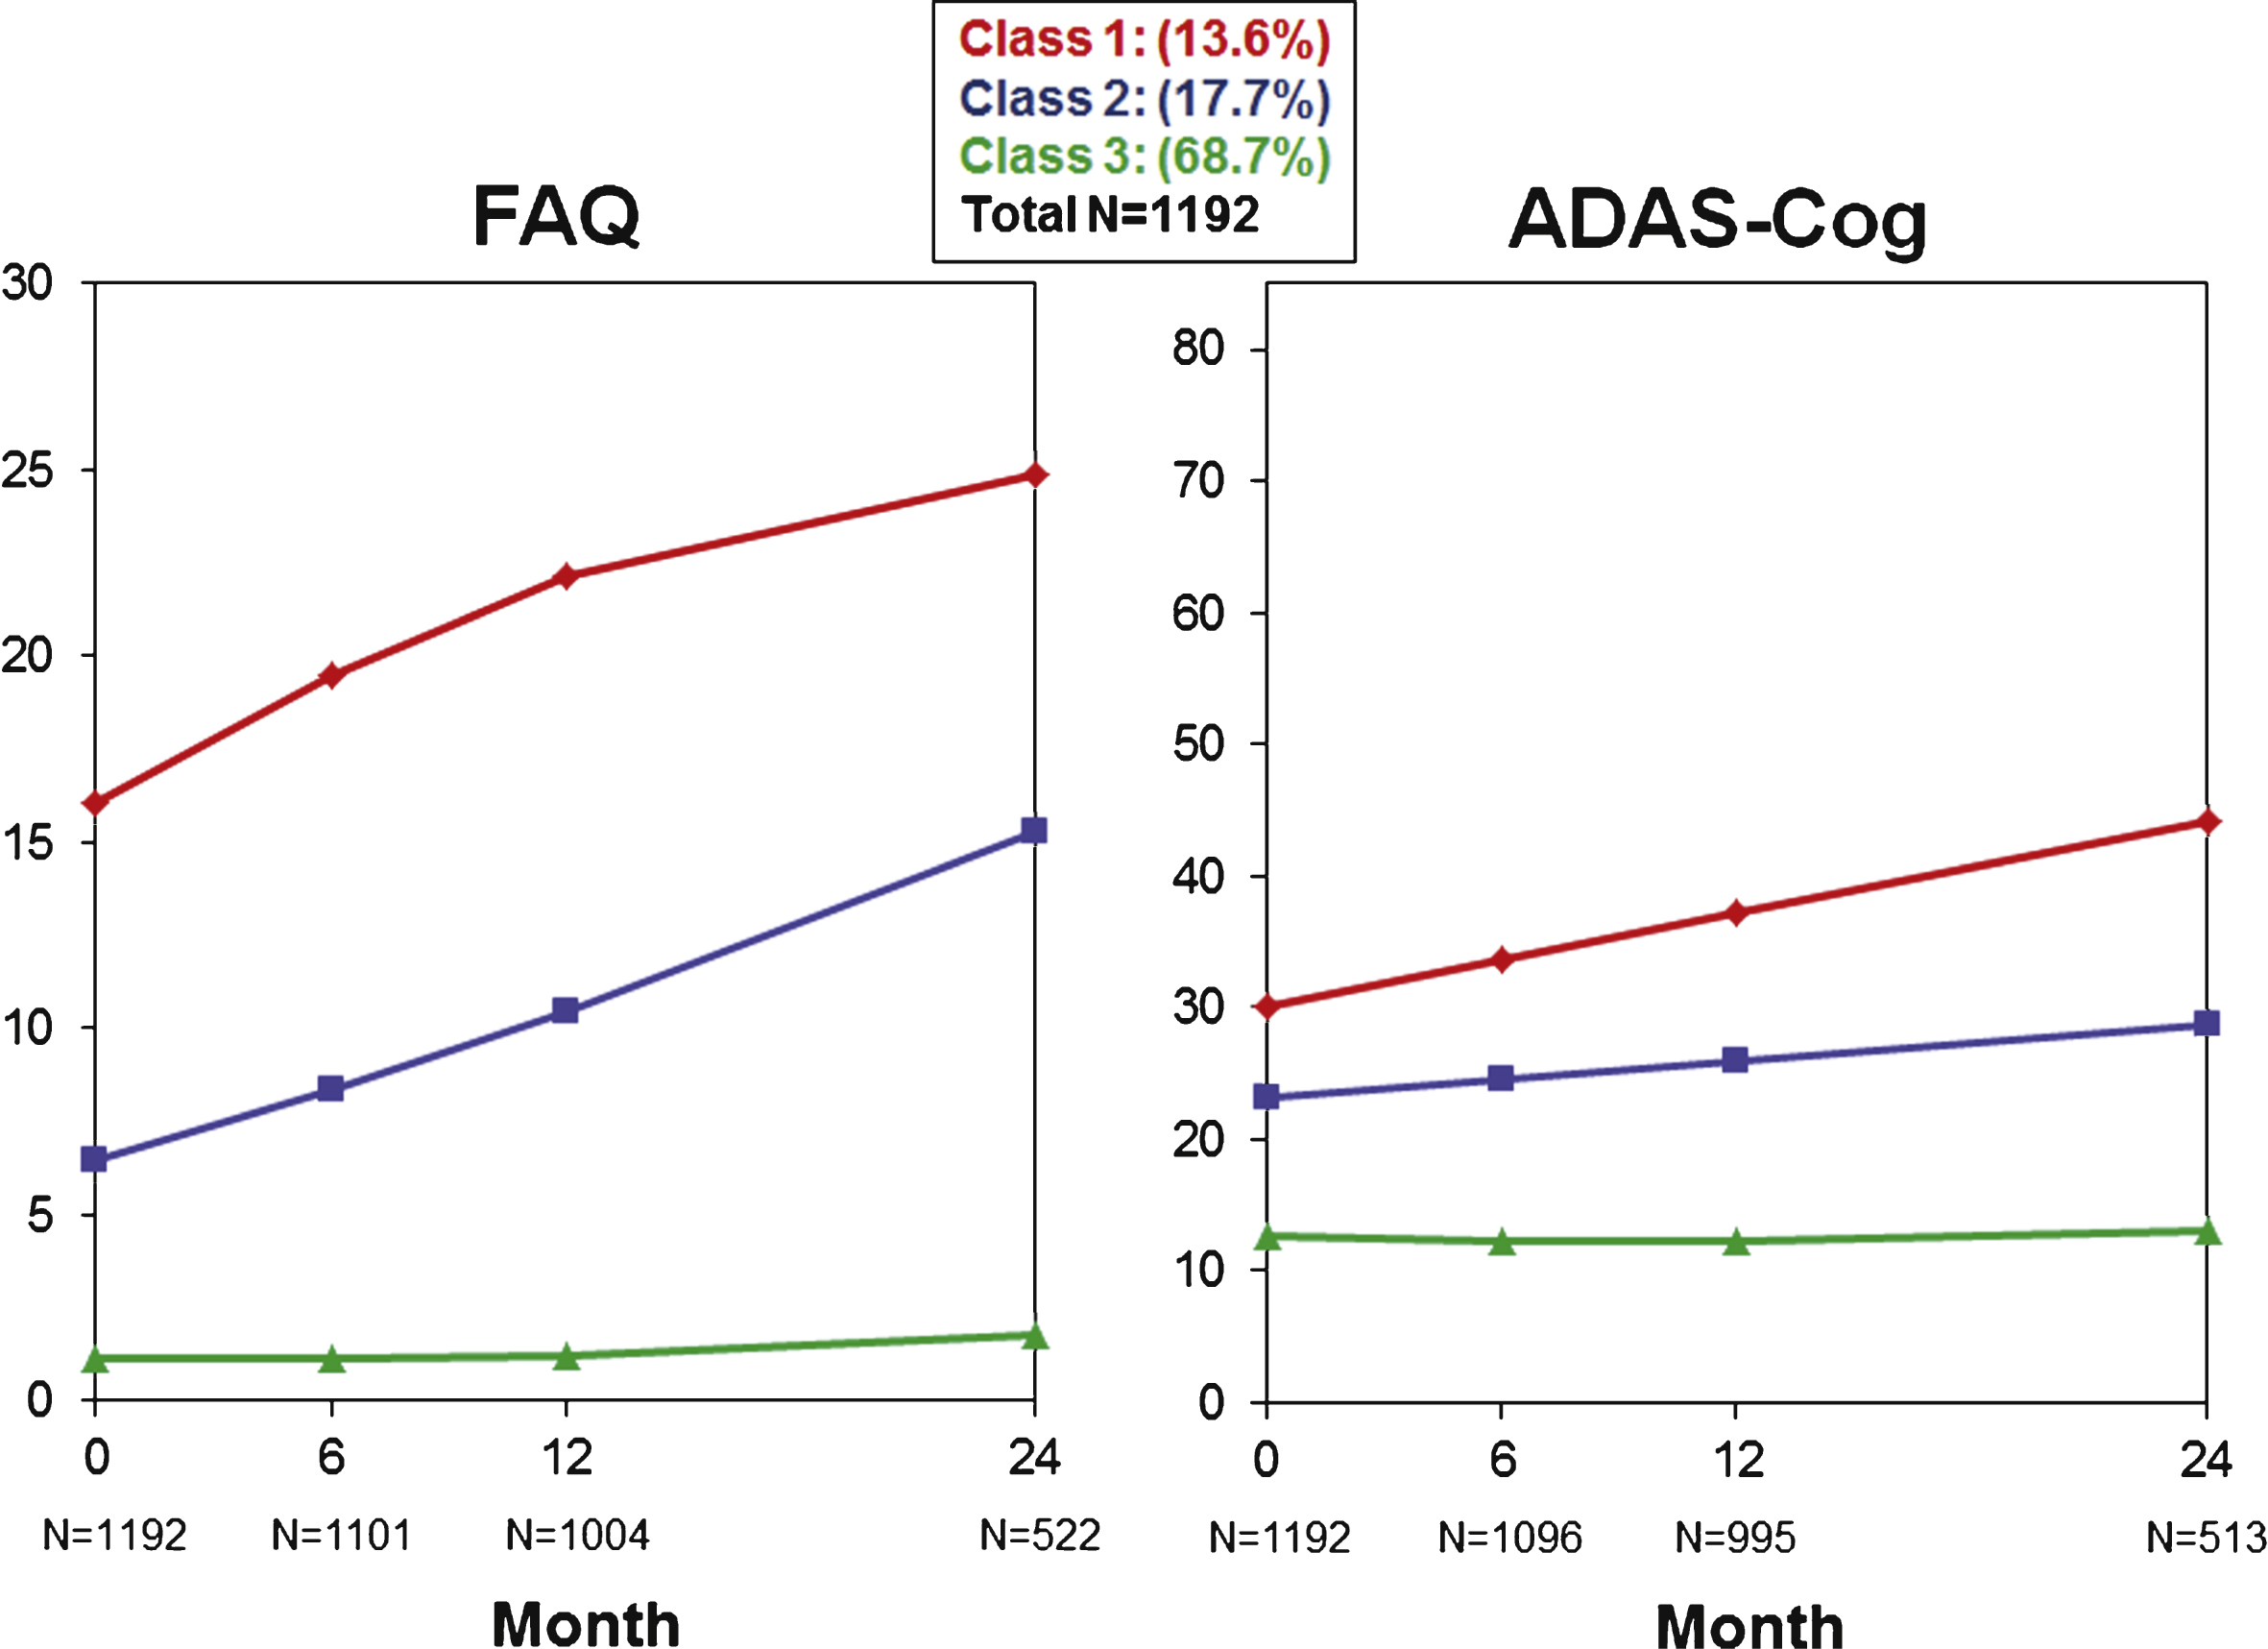
Fig.2
Individual trajectories graphed for each subject within each latent class are shown for the FAQ (top) and the ADAS-Cog13 (bottom) when jointly modeled by GMM. Class trajectories (from Fig. 1) are shown in color.
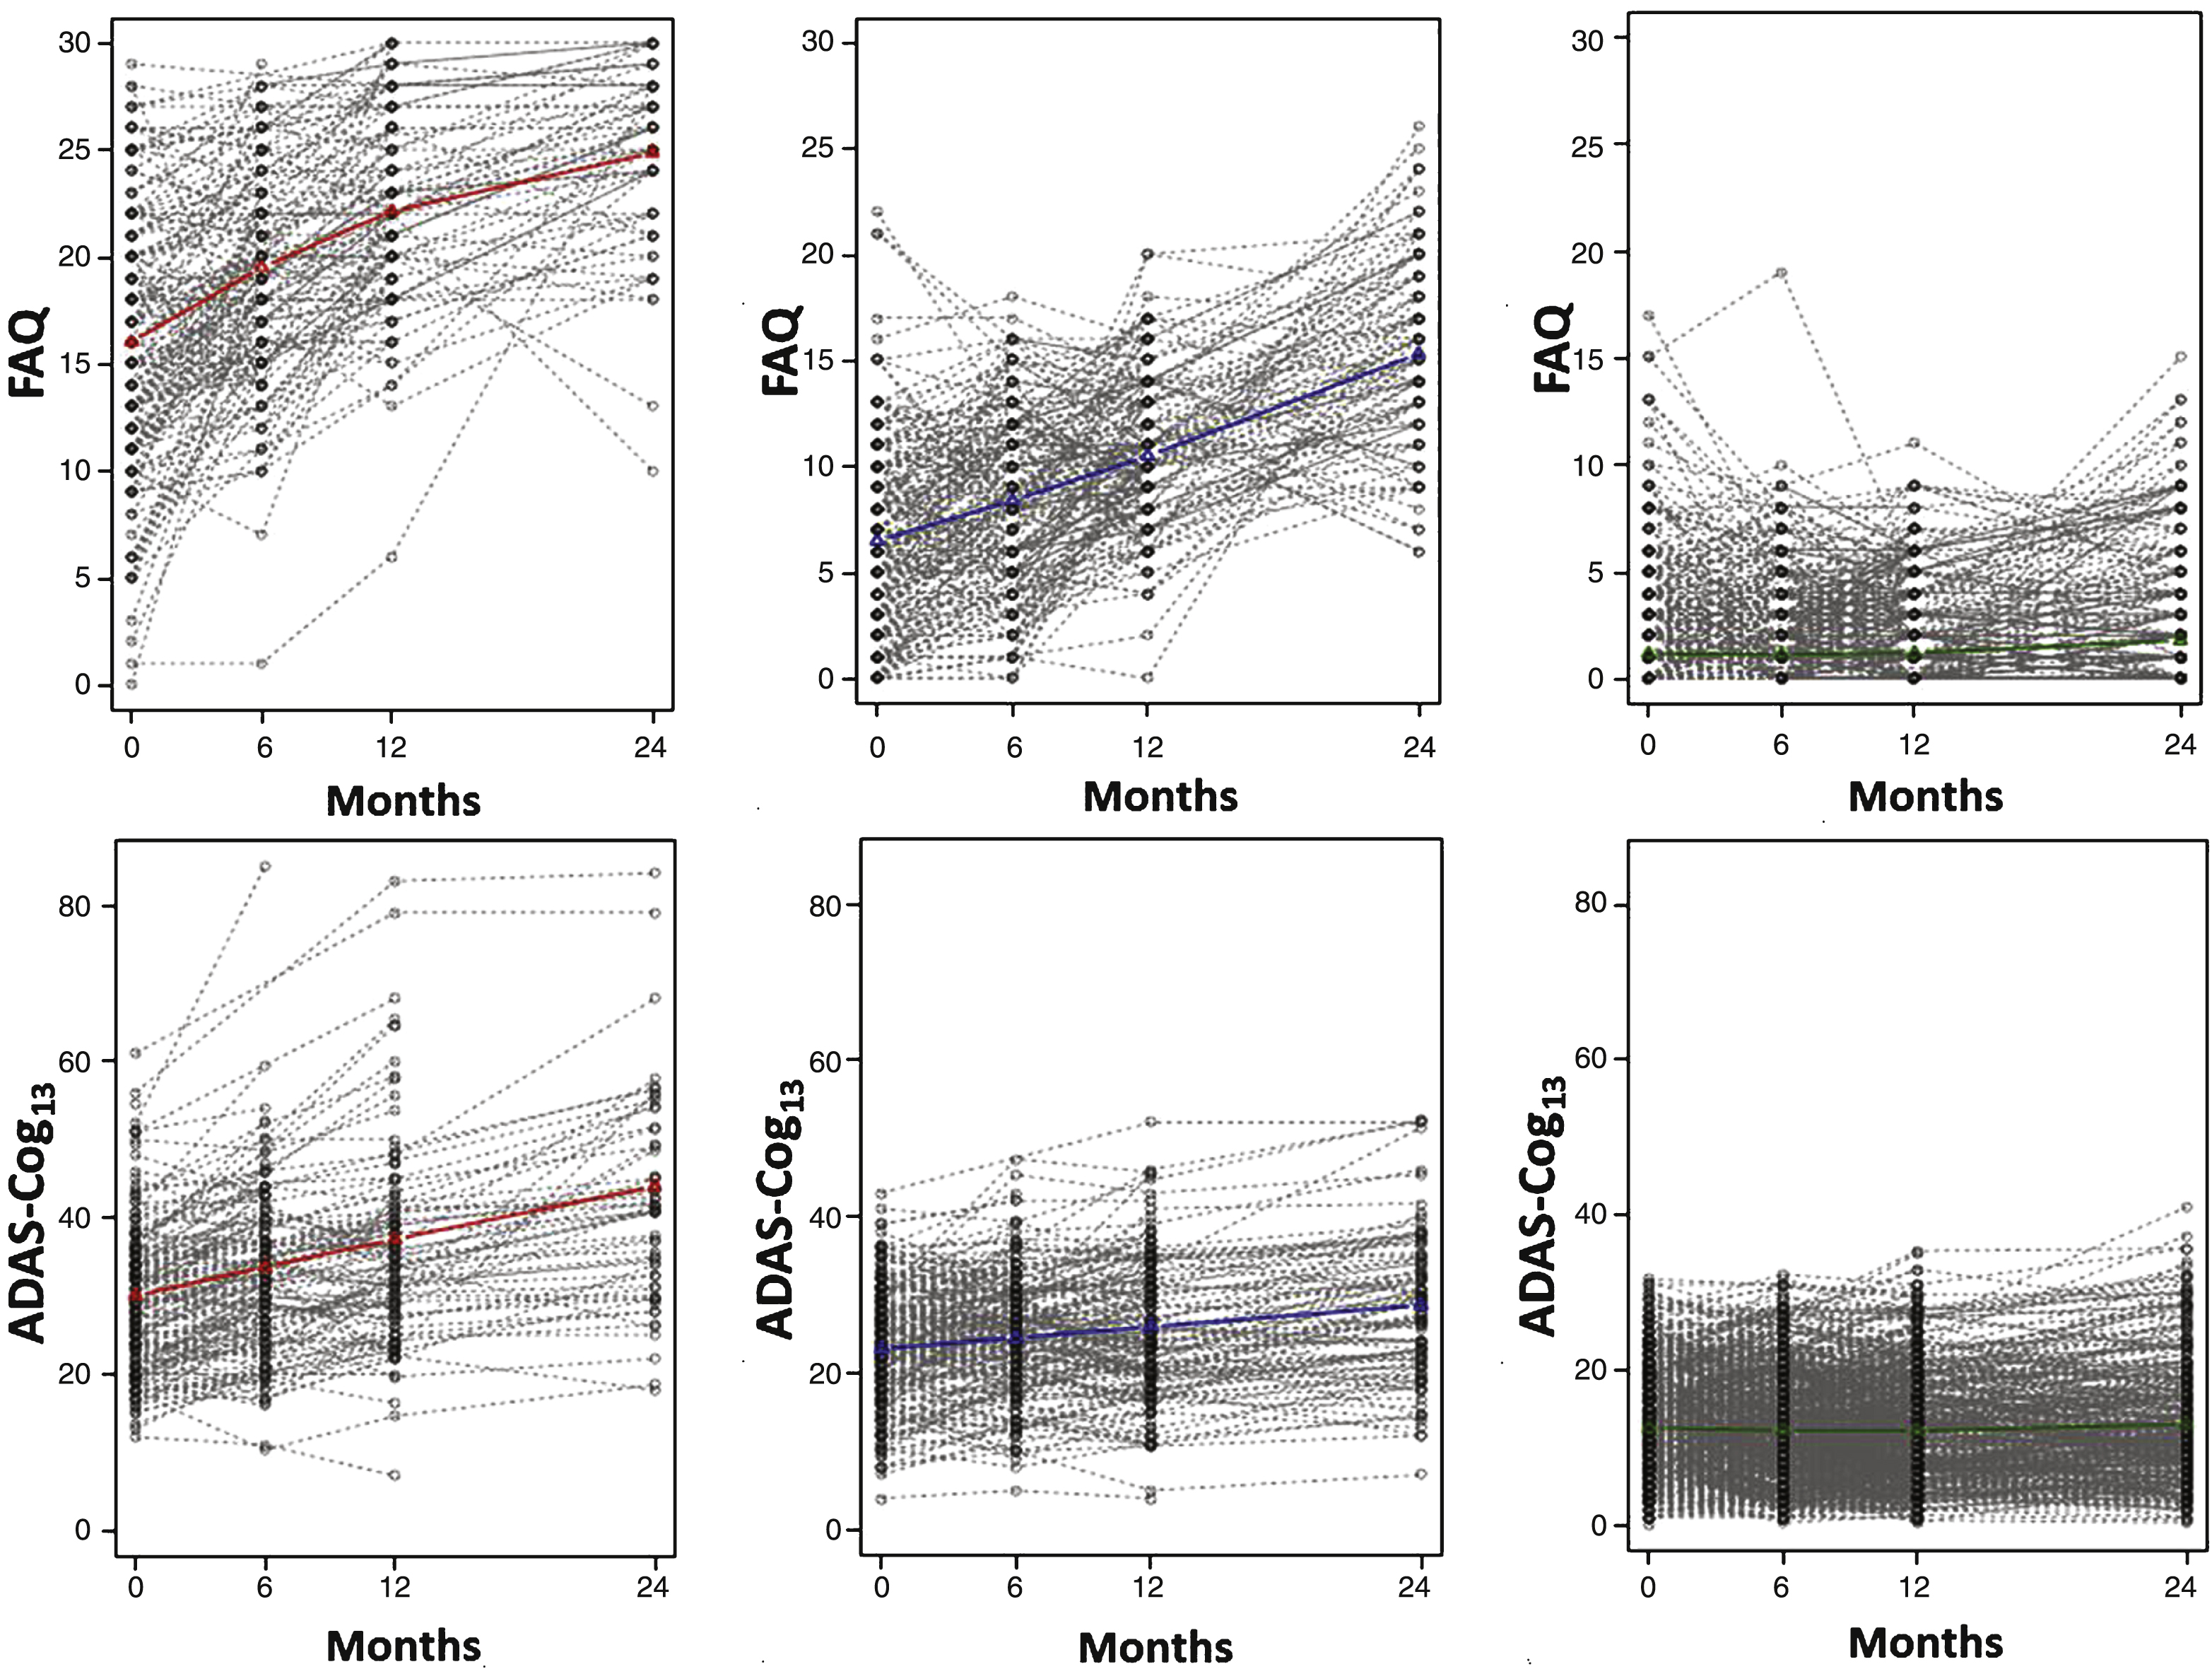
Fig.3
Trajectories are graphed to reveal diagnostic subgroups for Classes 1, 2, and 3 for the FAQ (top) and the ADAS-Cog13 (bottom) when jointly modeled by GMM. Class trajectories (from Fig. 1) are shown in color.
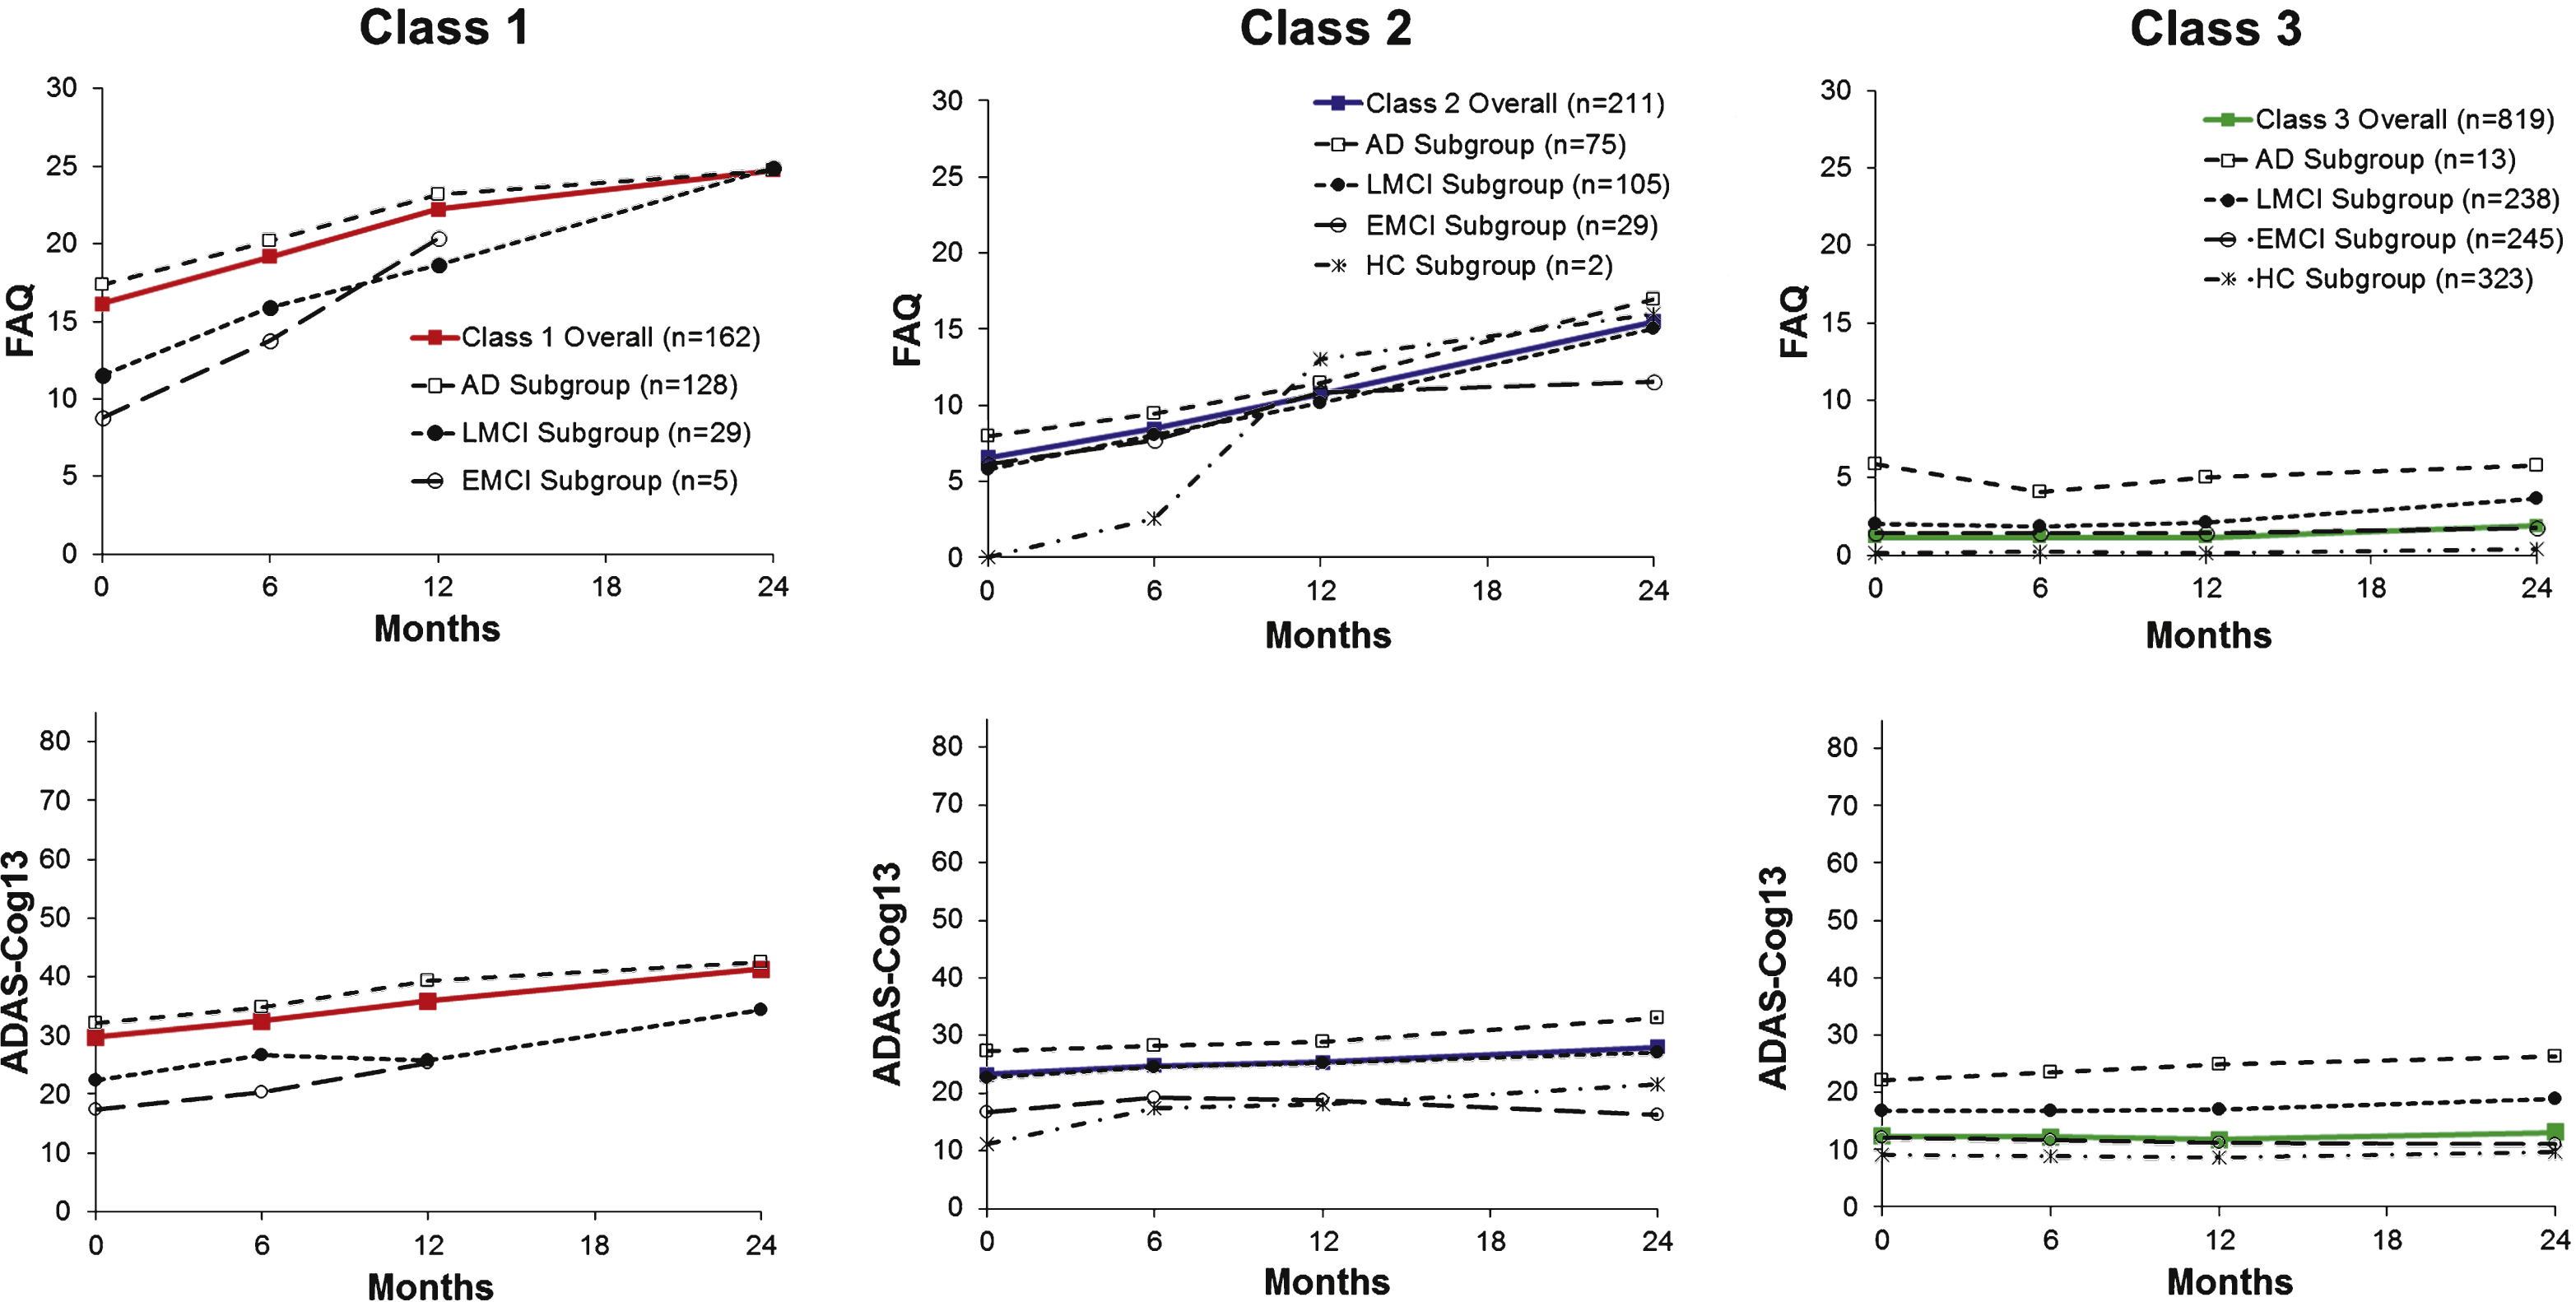
Fig.4
Classification and Regression Tree (CART) analysis of multiple variables selected categorical cutoffs on the FAQ as the best determinant to predict most likely class membership attributable to the original GMM classifications. CART predication accuracy was 82.3% as compared to the original GMM classes. Diagnostic group identity of subjects resulting from the CART attribution to the GMM classes is listed in the colored boxes and the distribution of the same subjects to specific classes in the original GMM classes is listed below the colored boxes for each Class.
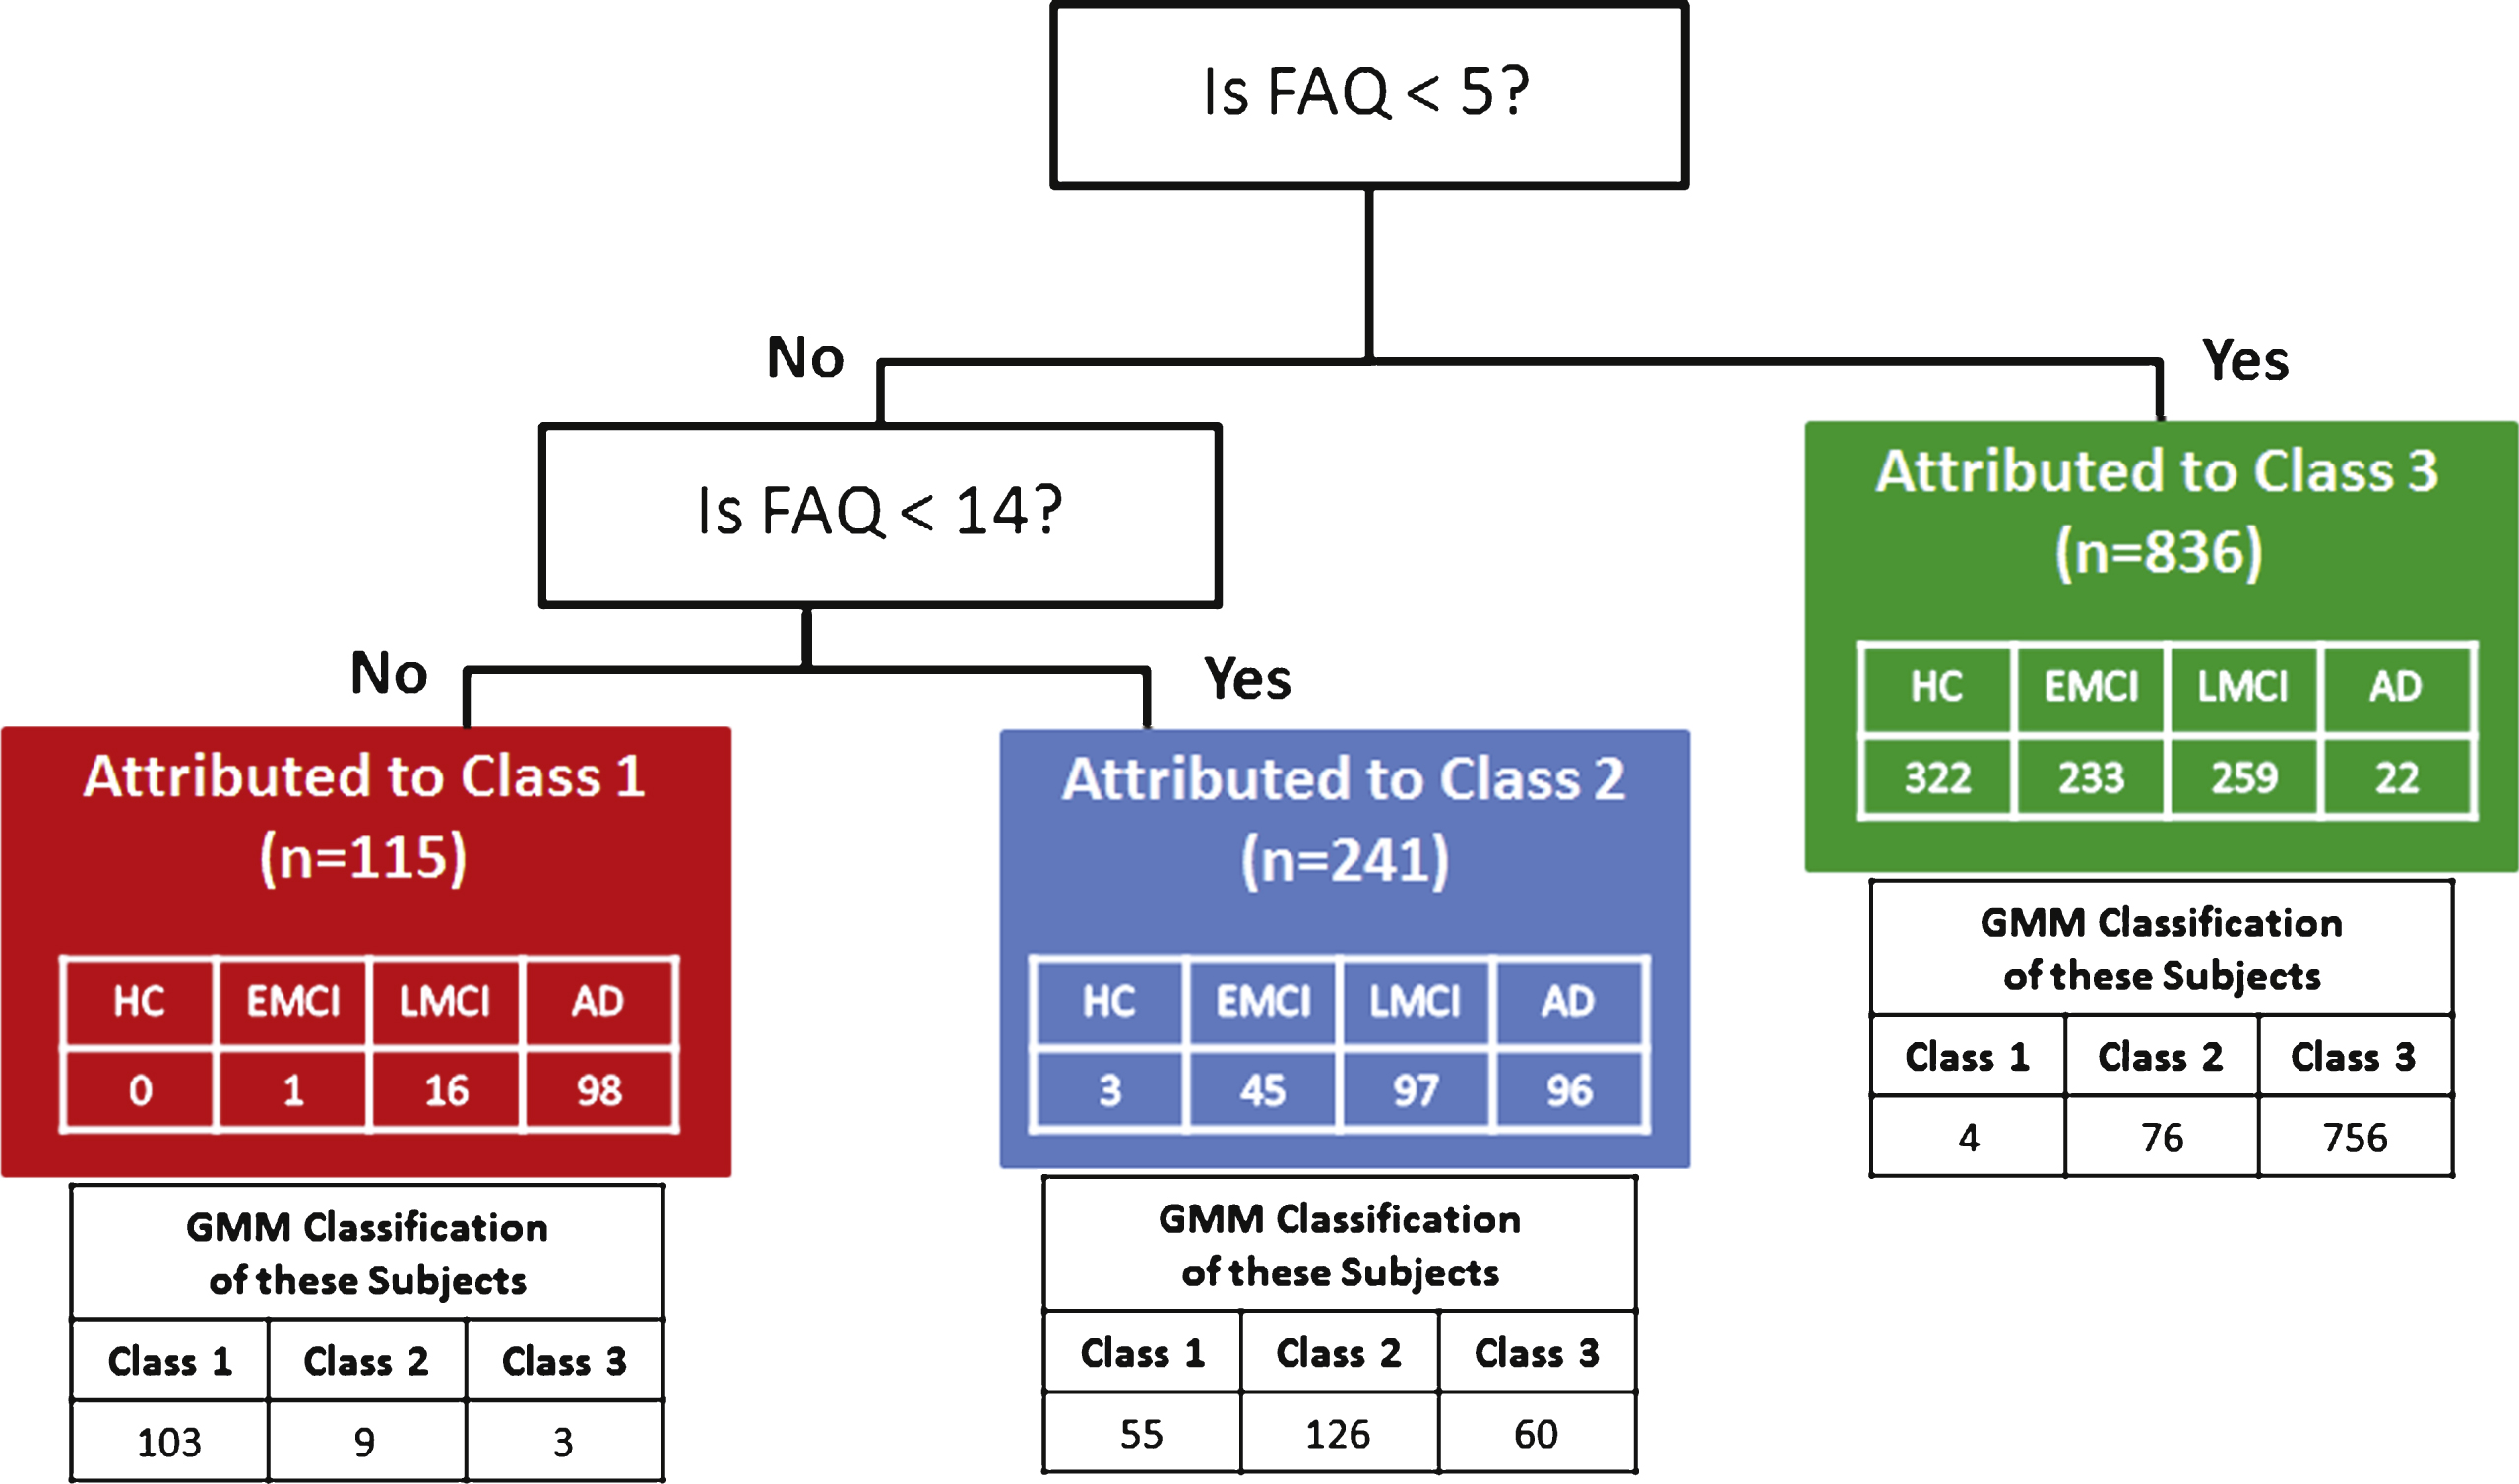
Table 1
Baseline demographics and other clinical characteristics by latent class (mean ± SD unless otherwise specified)
| Class 1 n = 162 | Class 2 n = 211 | Class 3 n = 819 | Total n = 1,192 | p-value* | |
| Age (years) | 74.7 ± 8.31 | 74.4 ± 7.28 | 72.9 ± 7.16 | 73.4 ± 7.38 | 0.0021 |
| Female (%) | 59.3% | 62.1% | 54.8% | 56.7% | 0.1287 |
| Race (% Caucasian) | 97.5% | 96.2% | 92.3% | 93.7% | 0.0612 |
| Education (years) | 15.7 ± 2.92 | 15.8 ± 2.92 | 16.1 ± 2.75 | 16.0 ± 2.81 | 0.0968 |
| EVIQ | 114.3 ± 8.83 | 113.7 ± 9.62 | 117.8 ± 8.24 | 116.6 ± 8.75 | <0.0001 |
| Amyloid Positive† | 92.0% | 84.4% | 48.2% | 60.6% | <0.0001 |
| APOE ɛ4 carrier | 69.1% | 64.0% | 38.3% | 47.1% | <0.0001 |
| Diagnosis (%): | <0.0001 (By column) | ||||
| HC (n) | 0 | 2 | 323 | 325 | |
| % of Column | 0.0% | 0.9% | 39.4% | 27.3% | |
| % of Row | 0.0% | 0.6% | 99.4% | 100% | |
| EMCI (n) | 5 | 29 | 245 | 279 | |
| % of Column | 3.1% | 13.7% | 29.9% | 23.4% | |
| % of Row | 1.8% | 10.4% | 87.8% | 100% | |
| LMCI (n) | 29 | 105 | 238 | 372 | |
| % of Column | 17.9% | 49.8% | 29.1% | 31.2% | |
| % of Row | 7.8% | 28.2% | 64.0% | 100% | |
| AD (n) | 128 | 75 | 13 | 216 | |
| % of Column | 79.0% | 35.5% | 1.6% | 18.1% | |
| % of Row | 59.3% | 34.7% | 6.0% | 100% | |
| Medical History | |||||
| Alcohol Abuse | 8.0% | 3.3% | 3.9% | 4.4% | 0.0474 |
| Smoking | 40.1% | 37.4% | 38.7% | 38.7% | 0.8699 |
| Cardiovascular disease | 71% | 64% | 67.9% | 67.6% | 0.3433 |
| Endocrine disease | 42.6% | 42.7% | 40.2% | 40.9% | 0.7261 |
| ADAS-Cog13 | 29.8 ± 9.55 | 23.5 ± 7.39 | 12.5 ± 6.10 | 16.8 ± 9.54 | <0.0001 |
| FAQ | 16.1 ± 6.15 | 6.5 ± 4.41 | 1.2 ± 2.26 | 4.1 ± 6.21 | <0.0001 |
| Animal Category Fluency | 12.0 ± 4.95 | 15.0 ± 5.10 | 19.0 ± 5.33 | 17.4 ± 5.85 | <0.0001 |
| CDR-SB | 4.9 ± 2.08 | 2.6 ± 1.25 | 0.8 ± 0.85 | 1.7 ± 1.86 | <0.0001 |
| Wechsler LM II | 1.7 ± 2.32 | 3.3 ± 3.30 | 9.2 ± 4.65 | 7.1 ± 5.20 | <0.0001 |
| MMSE | 23.5 ± 3.11 | 25.8 ± 2.44 | 28.3 ± 1.73 | 27.2 ± 2.74 | <0.0001 |
| MoCA | 17.3 ± 4.73 | 20.3 ± 3.32 | 24.5 ± 2.89 | 23.1 ± 4.08 | <0.0001 |
| Trail Making Test Part A | 68.7 ± 35.91 | 48.8 ± 26.62 | 36.7 ± 14.40 | 43.1 ± 23.70 | <0.0001 |
| Trail Making Test Part B | 200.8 ± 84.99 | 160.7 ± 80.08 | 96.3 ± 52.76 | 120.9 ± 74.00 | <0.0001 |
| NPI-Q | 4.4 ± 4.62 | 2.9 ± 3.50 | 1.2 ± 1.99 | 2.0 ± 3.07 | <0.0001 |
| GDS Short Form | 1.8 ± 1.76 | 1.7 ± 1.40 | 1.4 ± 1.47 | 1.5 ± 1.51 | 0.0007 |
Data are presented as mean ± SD unless indicated otherwise. APOE, apolipoprotein E; AD, Alzheimer’s disease; ADAS-Cog13, Alzheimer’s Disease Assessment Scale-Cognitive Subscale, 13-item version; CDR-SB, Clinical Dementia Rating Sum of Boxes; EMCI, early mild cognitive impairment; EVIQ, Estimated Verbal Intelligence Quotient; FAQ, Functional Activities Questionnaire; GDS, Geriatric Depression Scale; HC, healthy controls; LM, Logical Memory; LMCI, late mild cognitive impairment; MMSE, Mini-Mental State Examination; MoCA, Montreal Cognitive Assessment; NPI-Q, Neuropsychiatric Inventory-Questionnaire. *p-values were from likelihood ratio test in multinomial logit model for categorical measures and from analysis of variance corrected for uncertainty for continuous variables. Uncertainty in latent class assignment is taken into consideration, using a three-step manual calculation as in Asparouhov & Muthén [15]. †31 cases had discrepant amyloid test results (20 out of 31 discrepant cases were CSF positive but FBP-PET negative).
Table 2
GMM adjustment indices for 2 to 4 classes
| Number of Classes | Growth Structure | AIC | BIC | p-Value LMR-LRT | Entropy | n (%) of smallest class2 | Linear | 43178.7 | 43321.0 | <0.0001 | 0.943 | 217 (18.2%) |
| Quadratic | 43181.7 | 43369.8 | <0.0001 | 0.946 | 219 (18.4%) | |||||||
| 3 | Linear | 42868.6 | 43041.5 | 0.0081 | 0.912 | 162 (13.6%) | ||||||
| Quadratic | 42802.1 | 43030.8 | 0.0329 | 0.917 | 162 (13.6%) | |||||||
| 4 | Linear | 42794.9 | 42977.9 | 0.3796 | 0.928 | 79 (6.6%) | ||||||
| Quadratic | 42495.6 | 42765.1 | 0.0819 | 0.944 | 64 (5.4%) |
AIC, Akaike Information Criteria; BIC, Bayesian Information Criteria; LMR-LRL, Lo-Mendell-Rubin - Likelihood Ratio Test.


