
Quantitative Neuroimaging Software for Clinical Assessment of Hippocampal Volumes on MR Imaging
Abstract
Background:
Multiple neurological disorders including Alzheimer’s disease (AD), mesial temporal sclerosis, and mild traumatic brain injury manifest with volume loss on brain MRI. Subtle volume loss is particularly seen early in AD. While prior research has demonstrated the value of this additional information from quantitative neuroimaging, very few applications have been approved for clinical use. Here we describe a US FDA cleared software program, NeuroreaderTM, for assessment of clinical hippocampal volume on brain MRI.
Objective:
To present the validation of hippocampal volumetrics on a clinical software program.
Method:
Subjects were drawn (n = 99) from the Alzheimer Disease Neuroimaging Initiative study. Volumetric brain MR imaging was acquired in both 1.5 T (n = 59) and 3.0 T (n = 40) scanners in participants with manual hippocampal segmentation. Fully automated hippocampal segmentation and measurement was done using a multiple atlas approach. The Dice Similarity Coefficient (DSC) measured the level of spatial overlap between NeuroreaderTM and gold standard manual segmentation from 0 to 1 with 0 denoting no overlap and 1 representing complete agreement. DSC comparisons between 1.5 T and 3.0 T scanners were done using standard independent samples T-tests.
Results:
In the bilateral hippocampus, mean DSC was 0.87 with a range of 0.78–0.91 (right hippocampus) and 0.76–0.91 (left hippocampus). Automated segmentation agreement with manual segmentation was essentially equivalent at 1.5 T (DSC = 0.879) versus 3.0 T (DSC = 0.872).
Conclusion:
This work provides a description and validation of a software program that can be applied in measuring hippocampal volume, a biomarker that is frequently abnormal in AD and other neurological disorders.
INTRODUCTION
The hippocampus is a vital temporal lobe structure in memory [1, 2] and loses volume in multiple brain disorders including Alzheimer’s disease (AD), depression, schizophrenia, traumatic brain injury, post-traumatic stress disorder, and mesial temporal sclerosis from temporal lobe epilepsy [3–7]. There are therefore multiple diseases in which clinicians could derive actionable information from hippocampal volume. Of the disorders listed above, AD has received the most attention with respect to potentially applying hippocampal volumes in clinical practice.
Currently for any person suspected having AD, the standard of care includes obtaining magnetic resonance imaging (MRI) of the brain [8]. However, the main purpose of doing so is to exclude any other causes of cognitive impairment (e.g., tumor, large stroke) as opposed to directly assessing the patterns of atrophy for indications of AD. The hippocampus is one of the first structures affected by the neuropathology of AD that is visible with MR imaging [9, 10] and the extent of atrophy correlates strongly with general and domain specific tests of cognitive function [11]. One pathology study found that visual assessments by two experienced neuroradiologists of the size of the hippocampus on MR imaging was insensitive for detecting early stage AD, with only 27% sensitivity [12]. Thus, while visual assessments cannot detect early hippocampal pathology, such identification is possible with quantitative approaches [13]. An Alzheimer Disease Neuroimaging Initiative (ADNI) study also showed that quantitative hippocampal volumetrics with FreeSurfer in 189 subjects (49 controls, 89 with mild cognitive impairment (MCI), and 50 with AD) were superior to visual ratings both for identifying controls from persons with MCI and for tracking progression from MCI to AD over 3.2 years [14]. Hippocampal volumetrics can therefore longitudinally assess progression in those at earlier stages of neurodegeneration.
Relevance of hippocampal volumetrics in AD is applicable not only to accurate and early diagnosis but also for preventive approaches due to increasing recognition of lifestyle factors in AD risk reduction [15–20]. The hippocampus is an increasingly identified target of risk modification in AD [21, 22]. Lifestyle factors from obesity to physical activity and diet have been shown to influence hippocampal structure measured on quantitative MR imaging volumetrics [23, 24]. Such prevention strategies will be needed as the number of persons with AD is projected to increase from 5.1 million in 2015 to 13.8 million by 2050 [25].
Hippocampal volumetrics can also provide additional important information in diagnosis and treatment of other disorders. Mild traumatic brain injury, for example, can present with hippocampal atrophy [4, 26] that can be detected with MR imaging in collegiate football players. Longitudinal assessment of hippocampal volume in a prospective study of 62 moderate to severe traumatic brain injury (TBI) patients secondary to trauma also showed abnormal low volumes evaluated on MR imaging at 3 and 12 months. Hippocampal volume loss is also related to combat service and post-traumatic stress disorder [27, 28]. Hippocampal volume has been suggested as a viable treatment biomarker in major depressive disorder [29, 30]. Additionally, hippocampal volume can aid in distinguishing bipolar from unipolar depression [31]. Severity of hippocampal volume is also useful in assessment of psychiatric diseases such as schizophrenia, has a larger degree of volume loss on MRI quantified volumes, particularly in the presubiculum and subiculum compared to bipolar [32]. Mesial temporal sclerosis, which is seen in 65% of persons with temporal lobe epilepsy, can present with hippocampal atrophy [33–36]. Asymmetry of such hippocampal atrophy has been shown to distinguish temporal lobe epilepsy, the cause of 60% of all epilepsy cases, from controls with 94% accuracy [13, 37]. Hippocampal volumetric asymmetry may also be used to predict laterality of seizure activity in medial temporal lobe epilepsy [38]. Imaging the hippocampus is therefore important for neurodegenerative and non-neurodegenerative diseases.
Multiple quantitative methods exist for measuring hippocampal volume; the original method was by hand traced borders of the hippocampus on serial MR images by a trained operator with knowledge of hippocampal anatomy [39]. While this method is considered the most rigorous for hippocampal volumetrics, the length of time required to trace one scan makes routine clinical use impractical. This has given rise to automated or semi-automated quantitative algorithms of that the boundary shift integral was one of the earlier examples [40]. Voxel-based methods have also been developed for hippocampal quantitation [41–43]. However, despite being available since the 1980 s and the presence of meta-analysis results about the added value of hippocampal volumetrics in AD [44], automated hippocampal assessments are not routine standard of care.
Recently, commercial hippocampal segmentation algorithms are being developed, but they have yet to gain widespread use [45]. However, the importance of developing such tools is recognized and guidelines have been proposed [46–48] for incorporating hippocampal volumetrics into clinical assessments for AD and drug trials. The potential of such a clinical application can also be applied to other disorders known to affect the hippocampus such as epilepsy, TBI, and depression. This work describes the validation of this automated hippocampal volumetric measurement program on 99 subjects from the ADNI study with manually segmented hippocampi. For this work, we specifically draw these images from scans on which Delphi consensus criteria were reached on the boundaries and standards for gold standard manual hippocampal volumetry [48]. This consensus provides the single best available manual volumetry standard to which we can compare a new fully automated brain MR imaging program, NeuroreaderTM.
MATERIALS AND METHODS
Subjects
All analyses of the de-identified human data were done or in accord with the Helsinki Declaration of 1975. Subjects were drawn from the European Alzheimer’s Disease Consortium - Alzheimer’s Disease Neuroimaging Initiative Harmonized Protocol (EADC-ADNI HarP) sub-study from the larger ADNI [48]. The EADC-ADNI HarP for Manual Hippocampal Segmentation project provided manually segmented 100 ADNI MR images for analysis of this study. The scans were obtained on a variety of commercial 1.5 Tand 3.0 T MR imaging scanners on subjects across the continuum of cognitive health including healthy controls, MCI, and AD as described in recent work [49]. Experts designated “master tracers” segmented the hippocampi based upon standardized HarP guidelines for anatomical landmarks of the hippocampus on MR imaging detailed in a separate user manual (http://www.centroalzheimer.it/public/SOPs/online/HarmonizedProtocol_ACPC_UserManual_Biblio.Pdf). To be considered a master tracer, an intra- and inter-rater intra-class correlation coefficient of at least 0.9 was required for all segmented hippocampal volumes [42].
We downloaded the hippocampal expansion labels produced by that manual segmentation and used them as ground truth in assessing the quality of our automated hippocampal segmentation. The list of the 100 original images used for the segmentation and the labels were retrieved from the EADC-ADNI HarP webpage: http://www.hippocampal-protocol.net/SOPs/index.php.
MRI technique
All MR images were produced as part of the ADNI study as fully described in prior work [41, 50, 51]. Table 1 describes the scanning protocol of the ADNI MRI dataset, specifically the T1-weighted axial 3D MRIs used in the EADC-ADNI HarP project.
Image quality pre-processing
Image pre-processing was done using standard methodology from ADNI as described in prior work [51] and on the LONI website (http://adni.loni.usc.edu/methods/mri-analysis/mri-pre-processing/). To summarize, the images acquired using GE scanners received the following correction steps: Gradwrap to correct for the geometric distortion, B1 non-uniformity correction of intensity non-uniformity and N3 correction to sharpen the image by removing residual intensity non-uniformity. The images acquired using the Philips scanner only received an N3 non-uniformity correction.
NeuroreaderTM automated hippocampal and brain MRI segmentation
Figure 1 describes steps of the NeuroreaderTM processing algorithms.
The following analyses were performed twice: once at the Brainreader ApS. (J.A.) and for a second time at the University of Wisconsin (E.D.; J.M.). There were no differences in the results of these separate analyses. This work is based in part upon hippocampal volumetric algorithms applied in earlier work [52].
We downloaded the original ADNI images from the Laboratory of Neuroimaging Image Data Archive (https://ida.loni.usc.edu/login.jsp) by following the instructions provided on the website. The level of agreement between manual segmentation and automated quantitation was assessed by the Dice Similarity Coefficient (DSC), first described by Dice [53]. The DSC measures the similarity index, defined as the intersection divided by the mean volume of the two volumes. DSC measures similarity indices range between 0 (no overlap) and 1 (complete or perfect agreement) [54]. Only one image showed poor dice similarity [53, 55] between manually segmented hippocampal structure and NeuroreaderTM. The DSC visual inspection of the manually produced hippocampal mask from this one image showed poor quality segmentation of that image and was therefore omitted from the DSC calculations.
The NeuroreaderTM image processing pipeline is based on multi-atlas segmentation through use of non-linear registration. All original code for the following steps was written in C++ and combined into a concise program with a graphical user interface for potential clinical use. Images to be segmented are first run through an N4 correction that adds additional bias correction not addressed by N3 to further optimize non-uniformity correction [56]. Hippocampal segmentation was achieved with a multi-atlas based approach as this provides superior segmentation performance compared to segmentation based on a single atlas [57]. In a multiple atlas approach, probabilistic information is incorporated from multiple templates to account for anatomical variability in different populations [58]. The bias corrected image was linearly registered to the ICBM 2009c Nonlinear Symmetric 1×1×1 mm template using a block matching algorithm [59]. From a cohort of 200 images also registered to this template, the 10 atlases that corresponded best with the input image were selected based upon the highest normalized correlation coefficient between the atlas and the input image. Each of these 10 atlases was non-linearly registered to the input image using an inverse-consistent symmetric free form deformation method [60] running on a graphics processing unit. Based on the computed deformation fields from the non-linear registration, the hippocampus segmentations from each atlas were transferred to the input image and hippocampus probability maps were created. Local intensity and gradient information from the input image were then used in the segmentation algorithm to resolve which voxels to include in the hippocampus segmentation.
Processing times for NeuroreaderTM range from between 3–7 minutes as a function of image size, for 64 brain structural volumes including both hippocampi, irrespective of magnetic field strength. Hippocampal volumetry by expert manual tracers takes 30 minutes, 15 minutes for each hippocampus [61]. A list of brain structures segmented by NeuroreaderTM is provided in Supplementary Table 1 with results and analysis detailed on hippocampal volume as that is the main focus of this work.
Statistical analysis
The General Linear Model was utilized to statistically predict hippocampal volumes. Age and gender adjusted comparisons are then used for computation of z-scores to allow for potential comparisons between an image and a normative database. The normative database used for z-score calculations in NeuroreaderTM is derived from MP-RAGE 3.0T volumetric sequences obtained in cognitively normal persons from the ADNI-GO study [62]. It included 231 individuals, 113 women (age range 62–90 years) and 118 men (age 60–88 years). Lower z-scores denote volume loss in the hippocampus compared to normative data. The statistical model is used to calculate the confidence interval and the z-score for each measured volume, which is presented in a sample patient report from NeuroreaderTM in Fig. 2. Output includes hippocampal volume in milliliters, proportion of hippocampal volume as a proportion of estimated head size as measured as total intracranial volume (gray matter volume + white matter volume + cerebrospinal fluid volume + dura) and a z-score that can be expressed when comparing NeuroreaderTM output to normative data.
Additional analyses were performed with independent samples t-tests in order to assess if the DSC varied as a function of field strength. Statistically significant results were further assessed with a Cohen’s D value to measure effect size [63].
RESULTS
Table 2 displays the subject characteristics and quantitative results from NeuroreaderTM as a function of field strength. There were no statistically significant differences between the 1.5 T and 3.0 T groups in age, gender, or total intracranial volume.
Table 2 also shows that the DSC between the 1.5 Tand 3.0 T groups statistically significant (p = 0.03) with a small magnitude effect size (Cohen’s D = 0.3).
Table 3A shows DSC values in control, MCI, and AD. Statistically significant differences are seen between the DSC values when comparing control and AD in both hippocampi. Statistically significant differences are seen between MCI and AD DSC values in the right hippocampus. Table 3B shows that NeuroreaderTM can segment the hippocampus with an average DSC of 0.87 for both the right and left hippocampus across 1.5 T and 3.0 T field strengths. The DSC reaches a maximum of 0.91 across both samples.
Figure 3 displays a row of images representing color-coded hippocampal images.
DISCUSSION
This work describes a hippocampal volumetric technique, NeuroreaderTM, that can be applied in a routine clinical environment. Our results demonstrate overlap with gold standard manual volumetry approaching close to perfect agreement with average and maximal DSC values of 0.87 and 0.91 in an ADNI sample. This information can be generalized across both 1.5 and 3.0 T scanners as we included data from both types of MR imaging field strengths. NeuroreaderTM is a Class I medical device with Food and Drug Administration (FDA) 510(k) clearance (http://www.accessdata.fda.gov/cdrh_docs/pdf14/K140828.pdf) for the automated segmentation and labeling of brain structures on MR images. FDA clearance refers to a specific process whereby the FDA permits the marketing of medical devices, including software, after a careful review process more fully described elsewhere (http://www.fda.gov/MedicalDevices/ProductsandMedicalProcedures/DeviceApprovalsandClearances/510kClearances). For NeuroreaderTM, this included a review of the segmentation process, as seen in Fig. 1, and an overview of the data output for clinical use as summarized in Fig. 2. FDA clearance carries the implication that clinicians may apply NeuroreaderTM with safety and effectiveness on patient MR images of the brain.
While Neuroreader is the second FDA cleared MR imaging volumetric software program, there is no information available on DSC values for the other FDA-cleared tool, NeuroquantTM. However, there have been multiple studies done comparing manual volumetry to Freesurfer for the hippocampus, the progenitor software program to NeuroquantTM [64]. One study of 10 healthy controls, 10 persons with AD, and 10 with semantic dementia found a similarity index range of 0.45–0.59 between Freesurfer and manual volumetry in the hippocampus [65]. Another study in a Spanish cohort of 41 healthy controls, 23 with MCI, and 25 persons with AD found overlap between Freesurfer and manual volumetry between 0.74–0.81 in the hippocampus [66]. An ADNI cohort study of 80 subjects including healthy controls, MCI, and AD subjects found a similarity index of 0.82 between Freesurfer calculated hippocampal volumes and manual volumetry [67]. In the context of this literature, NeuroreaderTM performs well in computing hippocampal volumes. While the magnitude of the DSC is slightly lower in persons with AD, the overall DSC still compares favorably to other values found in the literature, as described above. However, future studies should be performed to further compare NeuroreaderTM in direct comparisons to other automated volumetric tools available for clinical application.
A misdiagnosis of AD incurs high cost [68] ranging from $9,500 to $14,000 per year, thus highlighting the potential cost-savings from imaging approaches that improve the correct identification of AD. One suggested approach for structural imaging is to therefore use hippocampal volumetrics added to MRI scans that are already indicated by current practice standards to determine who should obtain additional biomarkers, such as cerebrospinal fluid amyloid or other imaging tests, if an underlying neurodegenerative process is suspected based upon the results of hippocampal volumetrics [69]. Fast efficient and accurate hippocampal volumetric algorithms as detailed in the current study can therefore provide important information to clinicians in the work up and care of persons with AD [70]. Although molecular imaging biomarkers with amyloid imaging exist [71], there are several practical limitations. First, such methods involve the use of ionizing radiation. Second, no reimbursement from Centers for Medicare & Medicaid Services exists for amyloid imaging, although this issue continues to produce controversy [72]. Third, even if reimbursement was available for amyloid imaging, the costs of PET imaging are high at between $2,700–$5,000 [73, 74]. FDG-PET, which provides a broader array of differential considerations compared to compared to amyloid imaging, including the ability to identify frontotemporal and Lewy body dementia, costs an average of approximately $1,300 per scan [74]. By contrast, a non-contrast volumetric MR imaging scan of the brain costs $437.20 on average per scan [74]. The additional cost of using NeuroreaderTM or a program like it is approximately $80 on average [74]. Thus, the addition of MR imaging quantitative volumetrics can provide useful information at modest financial costs.
While the focus of this study was to describe the overlap between NeuroreaderTM automated hippocampal volumetrics and manual volumetry, this program is also FDA cleared for computing volumes of other brain structures. This has implications for application to other disorders featuring volume loss in non-hippocampal regions. A recent meta-analysis of 193 studies composed of 15,892 individuals across six diverse diagnostic groups including addiction, obsessive compulsive disorder, and anxiety feature gray matter volume loss particularly in the frontal lobes [75]. Whole brain volume changes longitudinally can have clinical importance, with change in total gray matter and white matter volumes over time being predictive of treatment response in multiple sclerosis [76]. Consequently, the potential for NeuroreaderTM to evolve for clinical application in other disorders given its measurement of various brain structures carries considerable potential.
Advantages of the work presented here are the use of a rigorous algorithm with validation against manually segmented images in a well-characterized and validated cohort with MR imaging on different scanners and field strengths. We have also shown in this work that the agreement between hippocampal volume and manual segmentation is high at both 1.5 T and 3 T MR imaging. Thus, using older 1.5 MR scanners will still allow for a highly effective segmentation and volumetric assessment. Implications of this work are therefore applications of hippocampal volumetrics in routine clinical practice onto a pre-existing workflow that results in MR imaging on persons with memory complaints and dementia. The main area of future improvement in this work is testing on subjects with serial MR imaging over time. Consequently, future directions include applications of this algorithm in community cohorts with longitudinal information to see if it is possible to identify potential pre-destined converters to mild cognitive impairment and AD. Other cohorts with diseases such as TBI, depression, and epilepsy can also be tested with this algorithm. Such work will improve the identification and subsequent care of persons with hippocampal specific braindisease.
We have shown in this work that NeuroreaderTM quantifies hippocampal volume that correlates with high fidelity to manual tracings. This software demonstrates sensitive volumetric assessments regardless of field strength used, either 1.5 or 3 T scanners. Such a program has the potential to be used in the clinical assessment of hippocampal disorders with particular applicability to AD and possible extension to other neuropsychiatric disorders.
ACKNOWLEDGMENTS
No external funding was used to support this work.
Data used in preparation of this article were obtained from the Alzheimer’s Disease Neuroimaging Initiative (ADNI) database (http://adni.loni.usc.edu). As such, the investigators within the ADNI contributed to the design and implementation of ADNI and/or provided data but did not participate in analysis or writing of this report. A complete listing of ADNI investigators can be found at: http://adni.loni.usc.edu/wp-content/uploads/how_to_apply/ADNI_Acknowledgement_List.pdf.
Authors’ disclosures available online (http://j-alz.com/manuscript-disclosures/15-0559r1).
Appendices
The supplementary material is available in the electronic version of this article: http://dx.doi.org/10.3233/JAD-150559.
REFERENCES
1 | Olton DS, Becker JT, Handelmann GE (1979) Hippocampus, space, and memory Behav Brain Sci 2: 313 322 |
2 | Squire LR (1992) Memory and the hippocampus: A synthesis from findings with rats, monkeys, and humans Psychol Rev 99: 195 231 |
3 | Nenadic I, Dietzek M, Schönfeld N, Lorenz C, Gussew A, Reichenbach JR, Sauer H, Gaser C, Smesny S (2015) Brain structure in people at ultra-high risk of psychosis, patients with first-episode schizophrenia, and healthy controls: A VBM study Schizophrenia Res 161: 169 176 |
4 | Singh R, Meier TB, Kuplicki R, Savitz J, Mukai I, Cavanagh L, Allen T, Teague TK, Nerio C, Polanski D, Bellgowan PSF (2014) Relationship of collegiate football experience and concussion with hippocampal volume and cognitive outcomes JAMA 311: 1883 |
5 | Wang Z, Neylan TC, Mueller SG, Lenoci M, Truran D, Marmar CR, Weiner MW, Schuff N (2010) Magnetic resonance imaging of hippocampal subfields in posttraumatic stress disorder Arch Gen Psychiatry 67: 296 |
6 | Wisse LEM, Biessels GJ, Stegenga BT, Kooistra M, van der Veen PH, Zwanenburg JJM, van der Graaf Y, Geerlings MI (2015) Major depressive episodes over the course of 7 years and hippocampal subfield volumes at 7 tesla MRI: The PREDICT-MR study J Affect Disord 175: 1 7 |
7 | Xu Y, Jack CR, O’Brien PC, Kokmen E, Smith GE, Ivnik RJ, Boeve BF, Tangalos RG, Petersen RC (2000) Usefulness of MRI measures of entorhinal cortex versus hippocampus in AD Neurology 54: 1760 1767 |
8 | Knopman DS, DeKosky ST, Cummings JL, Chui H, Corey-Bloom J, Relkin N, Small GW, Miller B, Stevens JC (2001) Practice parameter: Diagnosis of dementia (an evidence-based review): Report of the Quality Standards Subcommittee of the American Academy of Neurology Neurology 56: 1143 1153 |
9 | Killiany RJ, Hyman BT, Gomez-Isla T, Moss MB, Kikinis R, Jolesz F, Tanzi R, Jones K, Albert MS (2002) MRI measures of entorhinal cortex vs hippocampus in preclinical AD Neurology 58: 1188 1196 |
10 | Pennanen C, Kivipelto M, Tuomainen S, Hartikainen P, Hänninen T, Laakso MP, Hallikainen M, Vanhanen M, Nissinen A, Helkala E-L, Vainio P, Vanninen R, Partanen K, Soininen H (2004) Hippocampus and entorhinal cortex in mild cognitive impairment and early AD Neurobiol Aging 25: 303 310 |
11 | Kesslak JP, Nalcioglu O, Cotman CW (1991) Quantification of magnetic resonance scans for hippocampal and parahippocampal atrophy in Alzheimer’s disease Neurology 41: 51 |
12 | Ringman JM, Pope W, Salamon N (2010) Insensitivity of visual assessment of hippocampal atrophy in familial Alzheimer’s disease J Neurol 257: 839 842 |
13 | Farid N, Girard HM, Kemmotsu N, Smith ME, Magda SW, Lim WY, Lee RR, McDonald CR (2012) Temporal lobe epilepsy: Quantitative MR volumetry in detection of hippocampal atrophy Radiology 264: 542 550 |
14 | Varon D, Barker W, Loewenstein D, Greig M, Bohorquez A, Santos I, Shen Q, Harper M, Vallejo-Luces T, Duara RAlzheimer’s Disease Neuroimaging Initiative (2015) Visual rating and volumetric measurement of medial temporal atrophy in the Alzheimer’s Disease Neuroimaging Initiative (ADNI) cohort: Baseline diagnosis and the prediction of MCI outcome Int J Geriatr Psychiatry 30: 192 200 |
15 | Barnes DE, Yaffe K (2011) The projected effect of risk factor reduction on Alzheimer’s disease prevalence Lancet Neurol 10: 819 828 |
16 | Cherbuin N, Reglade-Meslin C, Kumar R, Jacomb P, Easteal S, Christensen H, Sachdev P, Anstey KJ (2009) Risk factors of transition from normal cognition to mild cognitive disorder: The PATH through Life Study Dement Geriatr Cogn Disord 28: 47 55 |
17 | Boyle CP, Raji CA, Erickson KI, Lopez OL, Becker JT, Gach HM, Longstreth WT, Teverovskiy L, Kuller LH, Carmichael OT, Thompson PM (2015) Physical activity, body mass index, and brain atrophy in Alzheimer’s disease Neurobiol Aging 36: S194 S202 |
18 | Fotuhi M, Do D, Jack C (2012) Modifiable factors that alter the size of the hippocampus with ageing Nat Rev Neurol 8: 189 202 |
19 | Raji CA, Erickson KI, Lopez OL, Kuller LH, Gach HM, Thompson PM, Riverol M, Becker JT (2014) Regular fish consumption and age-related brain gray matter loss Am J Prev Med 47: 444 451 |
20 | Raji CA, Ho AJ, Parikshak NN, Becker JT, Lopez OL, Kuller LH, Hua X, Leow AD, Toga AW, Thompson PM (2010) Brain structure and obesity Hum Brain Mapp 31: 353 364 |
21 | Erickson KI, Raji CA, Lopez OL, Becker JT, Rosano C, Newman AB, Gach HM, Thompson PM, Ho AJ, Kuller LH (2010) Physical activity predicts gray matter volume in late adulthood: The Cardiovascular Health Study Neurology 75: 1415 1422 |
22 | Erickson KI, Voss MW, Prakash RS, Basak C, Szabo A, Chaddock L, Kim JS, Heo S, Alves H, White SM, Wojcicki TR, Mailey E, Vieira VJ, Martin SA, Pence BD, Woods JA, McAuley E, Kramer AF (2011) Exercise training increases size of hippocampus and improves memory Proc Natl Acad Sci U S A 108: 3017 3022 |
23 | Raji CA, Wei SH, Bredesen DE, Moylan S, Law M, Small GW, Thompson PM, Friedlander RM, Silverman DH, Baune BT, Hoang TA, Salamon N, Vernooij MW (2015) Hot topics in research: Preventive neuroradiology in brain aging and cognitive decline AJNR Am J Neuroradiol 10.3174/ajnr.A4409 |
24 | Varma VR, Chuang YF, Harris GC, Tan EJ, Carlson MC (2015) Low-intensity daily walking activity is associated with hippocampal volume in older adults Hippocampus 25: 605 615 |
25 | Alzheimer’s Association (2015) Alzheimer’s disease facts and figures Alzheimers Dement 11: 332 384 |
26 | Strain JF, Womack KB, Didehbani N, Spence JS, Conover H, Hart JJr, Kraut MA, Cullum CM (2015) Imaging correlates of memory and concussion history in retired National Football League athletes JAMA Neurol 72: 773 780 |
27 | Gurvits TV, Shenton ME, Hokama H, Ohta H, Lasko NB, Gilbertson MW, Orr SP, Kikinis R, Jolesz FA, McCarley RW, Pitman RK (1996) Magnetic resonance imaging study of hippocampal volume in chronic, combat-related posttraumatic stress disorder Biol Psychiatry 40: 1091 1099 |
28 | Wignall EL, Dickson JM, Vaughan P, Farrow TFD, Wilkinson ID, Hunter MD, Woodruff PWR (2004) Smaller hippocampal volume in patients with recent-onset posttraumatic stress disorder Biol Psychiatry 56: 832 836 |
29 | Abdallah CG, Salas R, Jackowski A, Baldwin P, Sato JR, Mathew SJ (2015) Hippocampal volume and the rapid antidepressant effect of ketamine J Psychopharmacol 29: 591 595 |
30 | Ishiwata A, Mizumura S, Mishina M, Yamazaki M, Katayama Y (2014) The potentially protective effect of donepezil in Alzheimer’s disease Dement Geriatr Cogn Disord 38: 170 177 |
31 | Redlich R, Almeida JJR, Grotegerd D, Opel N, Kugel H, Heindel W, Arolt V, Phillips ML, Dannlowski U (2014) Brain morphometric biomarkers distinguishing unipolar and bipolar depression JAMA Psychiatry 71: 1222 |
32 | Haukvik UK, Westlye LT, Mørch-Johnsen L, Jørgensen KN, Lange EH, Dale AM, Melle I, Andreassen OA, Agartz I (2015) hippocampal subfield volumes in schizophrenia and bipolar disorder Biol Psychiatry 77: 581 588 |
33 | Benedict RHB, Ramasamy D, Munschauer F, Weinstock-Guttman B, Zivadinov R (2009) Memory impairment in multiple sclerosis: Correlation with deep grey matter and mesial temporal atrophy J Neurol Neurosurg Psychiatry 80: 201 206 |
34 | Moran NF, Lemieux L, Kitchen ND, Fish DR, Shorvon SD (2001) Extrahippocampal temporal lobe atrophy in temporal lobe epilepsy and mesial temporal sclerosis Brain 124: 167 175 |
35 | Mueller SG, Laxer KD, Barakos J, Cheong I, Garcia P, Weiner MW (2009) Subfield atrophy pattern in temporal lobe epilepsy with and without mesial sclerosis detected by high-resolution MRI at 4 Tesla: Preliminary results Epilepsia 50: 1474 1483 |
36 | de Lanerolle NC, Lee TS (2005) New facets of the neuropathology and molecular profile of human temporal lobe epilepsy Epilepsy Behav 7: 190 203 |
37 | Téllez-Zenteno JF, Hernández-Ronquillo L (2012) A review of the epidemiology of temporal lobe epilepsy Epilepsy Res Treat 2012: 1 5 |
38 | Ver Hoef LW, Williams FB, Kennedy RE, Szaflarski JP, Knowlton RC (2013) Predictive value of hippocampal internal architecture asymmetry in temporal lobe epilepsy Epilepsy Res 106: 155 163 |
39 | Rodrigue KM (2004) Shrinkage of the entorhinal cortex over five years predicts memory performance in healthy adults J Neurosci 24: 956 963 |
40 | Ezekiel F, Chao L, Kornak J, Du AT, Cardenas V, Truran D, Jagust W, Chui H, Miller B, Yaffe K, Schuff N, Weiner M (2004) Comparisons between global and focal brain atrophy rates in normal aging and Alzheimer disease: Boundary shift integral versus tracing of the entorhinal cortex and hippocampus Alzheimer Dis Assoc Disord 18: 196 201 |
41 | Boccardi M, Bocchetta M, Apostolova LG, Preboske G, Robitaille N, Pasqualetti P, Collins LD, Duchesne S, Jack CR, Frisoni GB (2013) Establishing magnetic resonance images orientation for the EADC-ADNI manual hippocampal segmentation protocol J Neuroimaging 24: 509 514 |
42 | Bocchetta M, Boccardi M, Ganzola R, Apostolova LG, Preboske G, Wolf D, Ferrari C, Pasqualetti P, Robitaille N, Duchesne S, Jack CR, Frisoni GB (2015) Harmonized benchmark labels of the hippocampus on magnetic resonance: The EADC-ADNI project Alzheimers Dementia 11: 151 160 e151 |
43 | Hirata Y, Matsuda H, Nemoto K, Ohnishi T, Hirao K, Yamashita F, Asada T, Iwabuchi S, Samejima H (2005) Voxel-based morphometry to discriminate early Alzheimer’s disease from controls Neurosci Lett 382: 269 274 |
44 | Barnes J, Bartlett JW, van de Pol LA, Loy CT, Scahill RI, Frost C, Thompson P, Fox NC (2009) A meta-analysis of hippocampal atrophy rates in Alzheimer’s disease Neurobiol Aging 30: 1711 1723 |
45 | Jack CR, Barkhof F, Bernstein MA, Cantillon M, Cole PE, DeCarli C, Dubois B, Duchesne S, Fox NC, Frisoni GB, Hampel H, Hill DLG, Johnson K, Mangin J-F, Scheltens P, Schwarz AJ, Sperling R, Suhy J, Thompson PM, Weiner M, Foster NL (2011) Steps to standardization and validation of hippocampal volumetry as a biomarker in clinical trials and diagnostic criterion for Alzheimer’s disease Alzheimers Dement 7: 474 485 e474 |
46 | Boccardi M, Bocchetta M, Ganzola R, Robitaille N, Redolfi A, Duchesne S, Jack CRJr, Frisoni GBSegmentation E-AWGoTHPfMH for the Alzheimer’s Disease Neuroimaging Initiative (2015) Operationalizing protocol differences for EADC-ADNI manual hippocampal segmentation Alzheimers Dement 11: 184 194 |
47 | Duchesne S, Valdivia F, Robitaille N, Mouiha A, Valdivia FA, Bocchetta M, Apostolova LG, Ganzola R, Preboske G, Wolf D, Boccardi M, Jack CRJr, Frisoni GBWorking Group on The Harmonized Protocol for Manual Hippocampal Segmentation EADC-ADNI for the Alzheimer’s Disease Neuroimaging Initiative (2015) Manual segmentation qualification platform for the EADC-ADNI harmonized protocol for hippocampal segmentation project Alzheimers Dement 11: 161 174 |
48 | Frisoni GB, Jack CRJr, Bocchetta M, Bauer C, Frederiksen KS, Liu Y, Preboske G, Swihart T, Blair M, Cavedo E, Grothe MJ, Lanfredi M, Martinez O, Nishikawa M, Portegies M, Stoub T, Ward C, Apostolova LG, Ganzola R, Wolf D, Barkhof F, Bartzokis G, DeCarli C, Csernansky JG, deToledo-Morrell L, Geerlings MI, Kaye J, Killiany RJ, Lehericy S, Matsuda H, O’Brien J, Silbert LC, Scheltens P, Soininen H, Teipel S, Waldemar G, Fellgiebel A, Barnes J, Firbank M, Gerritsen L, Henneman W, Malykhin N, Pruessner JC, Wang L, Watson C, Wolf H, deLeon M, Pantel J, Ferrari C, Bosco P, Pasqualetti P, Duchesne S, Duvernoy H, Boccardi MWorking Group on The Harmonized Protocol for Manual Hippocampal Volumetry EADC-ADNI for the Alzheimer’s Disease Neuroimaging Initiative (2015) The EADC-ADNI Harmonized Protocol for manual hippocampal segmentation on magnetic resonance: Evidence of validity Alzheimers Dement 11: 111 125 |
49 | Boccardi M, Bocchetta M, Morency FC, Collins DL, Nishikawa M, Ganzola R, Grothe MJ, Wolf D, Redolfi A, Pievani M, Antelmi L, Fellgiebel A, Matsuda H, Teipel S, Duchesne S, Jack CRJr, Frisoni GBWorking Group on The Harmonized Protocol for Manual Hippocampal Segmentation EADC-ADNI for the Alzheimer’s Disease Neuroimaging Initiative (2015) Training labels for hippocampal segmentation based on the EADC-ADNI harmonized hippocampal protocol Alzheimers Dement 11: 175 183 |
50 | Boccardi M, Ganzola R, Bocchetta M, Pievani M, Redolfi A, Bartzokis G, Camicioli R, Csernansky JG, de Leon MJ, deToledo-Morrell L, Killiany RJ, Lehericy S, Pantel J, Pruessner JC, Soininen H, Watson C, Duchesne S, Jack CRJr, Frisoni GB (2011) Survey of protocols for the manual segmentation of the hippocampus: Preparatory steps towards a joint EADC-ADNI harmonized protocol J Alzheimers Dis 26: Suppl 3 61 75 |
51 | Jack CRJr, Bernstein MA, Fox NC, Thompson P, Alexander G, Harvey D, Borowski B, Britson PJ, L Whitwell J, Ward C, Dale AM, Felmlee JP, Gunter JL, Hill DL, Killiany R, Schuff N, Fox-Bosetti S, Lin C, Studholme C, DeCarli CS, Krueger G, Ward HA, Metzger GJ, Scott KT, Mallozzi R, Blezek D, Levy J, Debbins JP, Fleisher AS, Albert M, Green R, Bartzokis G, Glover G, Mugler J, Weiner MW (2008) The Alzheimer’s Disease Neuroimaging Initiative (ADNI): MRI methods J Magn Reson Imaging 27: 685 691 |
52 | Ahdidan J, Hviid LB, Chakravarty MM, Ravnkilde B, Rosenberg R, Rodell A, Stødkilde-Jørgensen H, Videbech P (2011) Longitudinal MR study of brain structure and hippocampus volume in major depressive disorder Acta Psychiatr Scand 123: 211 219 |
53 | Dice LR (1945) Measures of the amount of ecologic association between species Ecology 26: 297 |
54 | Shen Q (2011) Volumetric analysis of brain MRI for Alzheimer’s disease Open Access Dissertations Paper 526 |
55 | Zou KH, Warfield SK, Bharatha A, Tempany CMC, Kaus MR, Haker SJ, Wells WM, Jolesz FA, Kikinis R (2004) Statistical validation of image segmentation quality based on a spatial overlap index1 Acad Radiol 11: 178 189 |
56 | Tustison NJ, Avants BB, Cook PA, Yuanjie Z, Egan A, Yushkevich PA, Gee JC (2010) N4ITK: Improved N3 Bias Correction IEEE Trans Med Imaging 29: 1310 1320 |
57 | Carmichael OT, Aizenstein HA, Davis SW, Becker JT, Thompson PM, Meltzer CC, Liu Y (2005) Atlas-based hippocampus segmentation in Alzheimer’s disease and mild cognitive impairment Neuroimage 27: 979 990 |
58 | Fischl B, Salat DH, Busa E, Albert M, Dieterich M, Haselgrove C, van der Kouwe A, Killiany R, Kennedy D, Klaveness S, Montillo A, Makris N, Rosen B, Dale AM (2002) Whole brain segmentation: Automated labeling of neuroanatomical structures in the human brain Neuron 33: 341 355 |
59 | Ourselin S, Roche A, Subsol G, Pennec X, Ayache N (2001) Reconstructing a 3D structure from serial histological sections Image Vis Comput 19: 25 31 |
60 | Modat M, Ridgway GR, Taylor ZA, Lehmann M, Barnes J, Hawkes DJ, Fox NC, Ourselin S (2010) Fast free-form deformation using graphics processing units Comput Methods Programs Biomed 98: 278 284 |
61 | Winston GP, Cardoso MJ, Williams EJ, Burdett JL, Bartlett PA, Espak M, Behr C, Duncan JS, Ourselin S (2013) Automated hippocampal segmentation in patients with epilepsy: Available free online Epilepsia 54: 2166 2173 |
62 | Jack CRJr, Bernstein MA, Borowski BJ, Gunter JL, Fox NC, Thompson PM, Schuff N, Krueger G, Killiany RJ, Decarli CS, Dale AM, Carmichael OW, Tosun D, Weiner MWAlzheimer’s Disease Neuroimaging Initiative (2010) Update on the magnetic resonance imaging core of the Alzheimer’s disease neuroimaging initiative Alzheimers Dement 6: 212 220 |
63 | Cohen J (1988) Statistical power analysis for the behavioral sciences Lawrence Earlbaum Associates Hillsdale, NJ |
64 | Ochs AL, Ross DE, Zannoni MD, Abildskov TJ, Bigler ED (2015) Comparison of automated brain volume measures obtained with NeuroQuant(R) and FreeSurfer J Neuroimaging 25: 721 727 |
65 | Lehmann M, Douiri A, Kim LG, Modat M, Chan D, Ourselin S, Barnes J, Fox NC (2010) Atrophy patterns in Alzheimer’s disease and semantic dementia: A comparison of FreeSurfer and manual volumetric measurements Neuroimage 49: 2264 2274 |
66 | Sanchez-Benavides G, Gomez-Anson B, Sainz A, Vives Y, Delfino M, Pena-Casanova J (2010) Manual validation of FreeSurfer’s automated hippocampal segmentation in normal aging, mild cognitive impairment, and Alzheimer disease subjects Psychiatry Res 181: 219 225 |
67 | Mulder ER, de Jong RA, Knol DL, van Schijndel RA, Cover KS, Visser PJ, Barkhof F, Vrenken HAlzheimer’s disease Neuroimaging Initiative (2014) Hippocampal volume change measurement: Quantitative assessment of the reproducibility of expert manual outlining and the automated methods FreeSurfer and FIRST Neuroimage 92: 169 181 |
68 | Kirson N, Hunter C, Desai U, Cummings A, San Roman A, Faries D, Hardwick C, Birnbaum H (2013) Excess costs associated with misdiagnosis of Alzheimer’s disease among U.S. Medicare beneficiaries with vascular dementia or Parkinson’s disease Alzheimers Dement 9: P845 P846 |
69 | Brewer JB (2009) Fully-automated volumetric MRI with normative ranges: Translation to clinical practice Behav Neurol 21: 21 28 |
70 | Ramani A, Jensen JH, Helpern JA (2006) Quantitative MR imaging in Alzheimer disease Radiology 241: 26 44 |
71 | Klunk WE, Engler H, Nordberg A, Wang Y, Blomqvist G, Holt DP, Bergstrom M, Savitcheva I, Huang G-F, Estrada S, Austin B, Debnath ML, Barletta J, Price JC, Sandell J, Lopresti BJ, Wall A, Koivisto P, Antoni G, Mathis CA, Langstrom B (2004) Imaging brain amyloid in Alzheimer’s disease with Pittsburgh Compound-B Ann Neurol 55: 306 319 |
72 | Hughes S (2013) Mixed reaction to CMS decision on amyloid PET imaging. Medscape, July 19, 2013,http://www.medscape.com/viewarticle/808149, Accessed Ma 1, 2015 |
73 | Alzheimer’s Association. For Healthcare Professionals: Frequently asked questions about beta-amyloid imaging,http://www.alz.org/documents_custom/hcp_faq_auc.pdf |
74 | Desikan RS, Rafii MS, Brewer JB, Hess CP (2013) An expanded role for neuroimaging in the evaluation of memory impairment AJNR Am J Neuroradiol 34: 2075 2082 |
75 | Goodkind M, Eickhoff SB, Oathes DJ, Jiang Y, Chang A, Jones-Hagata LB, Ortega BN, Zaiko YV, Roach EL, Korgaonkar MS, Grieve SM, Galatzer-Levy I, Fox PT, Etkin A (2015) Identification of a common neurobiological substrate for mental illness JAMA Psychiatry 72: 305 315 |
76 | Perez-Miralles FC, Sastre-Garriga J, Vidal-Jordana A, Rio J, Auger C, Pareto D, Tintore M, Rovira A, Montalban X (2015) Predictive value of early brain atrophy on response in patients treated with interferon beta Neurol Neuroimmunol Neuroinflamm 2: e132 |
Figures and Tables
Fig.1
Neuroreadertrademark image processing pipeline.
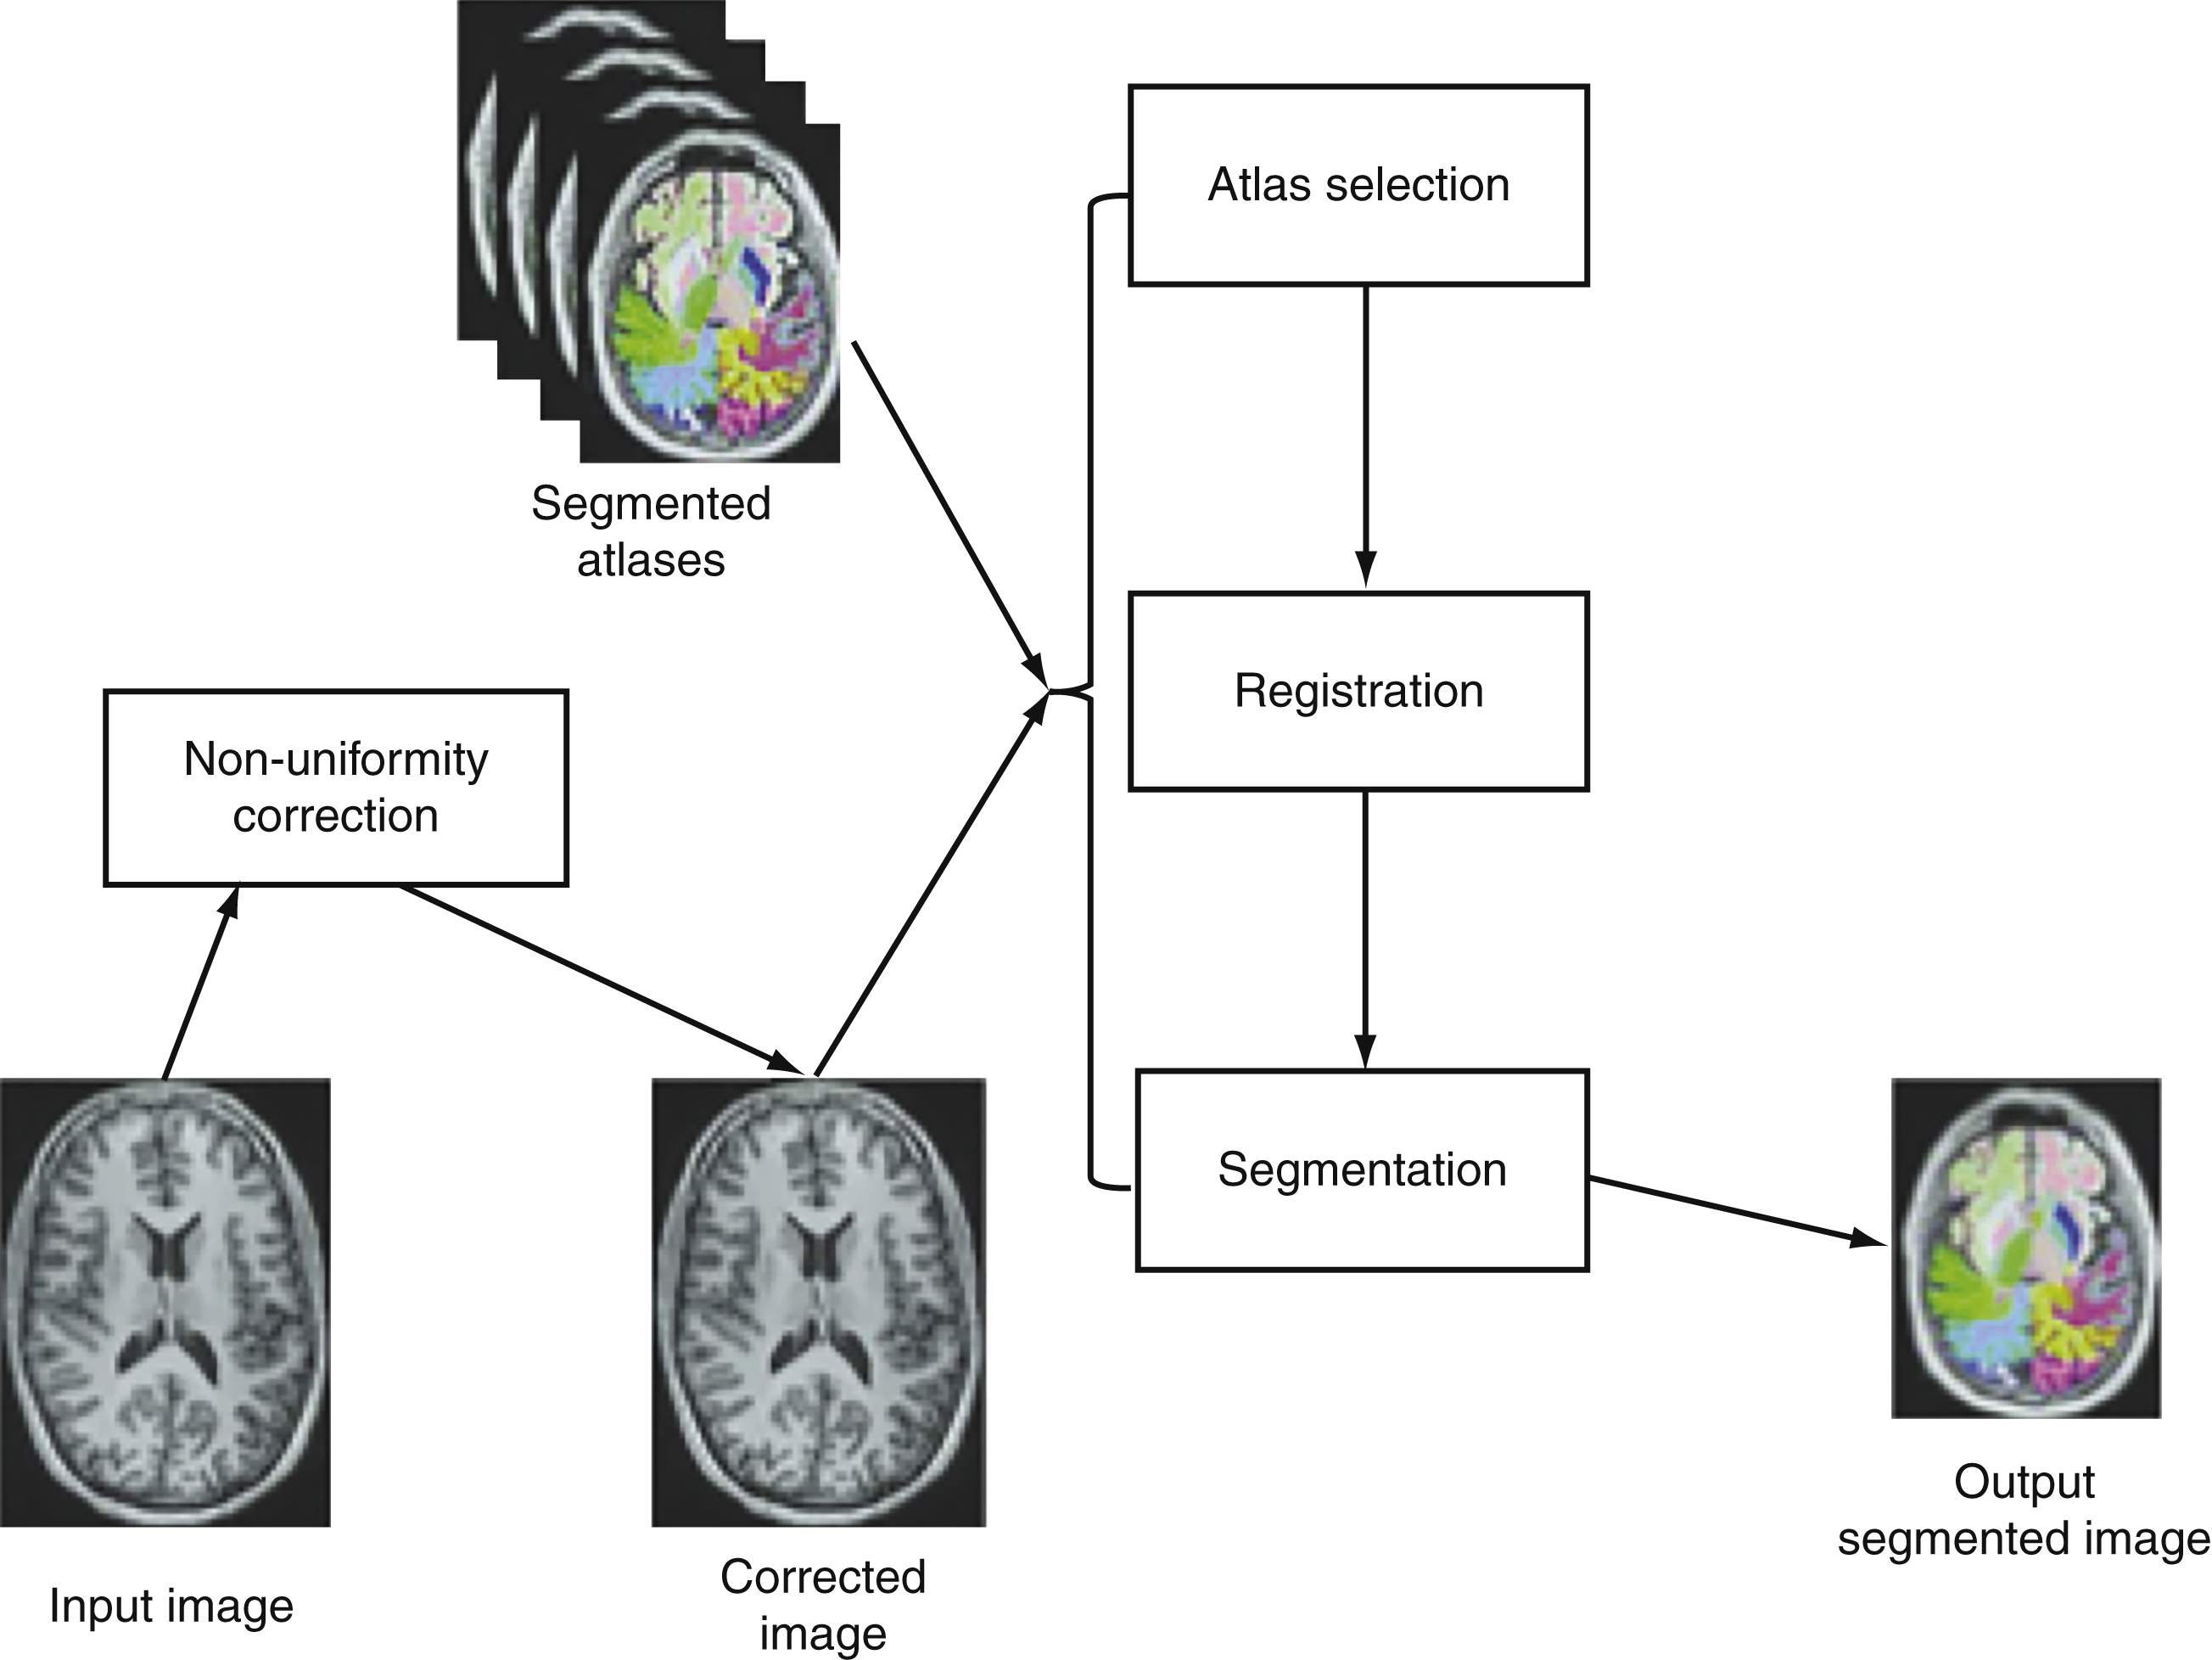
Fig.2
Neuroreadertrademark hippocampal volumetric measurements with statistical analysis.
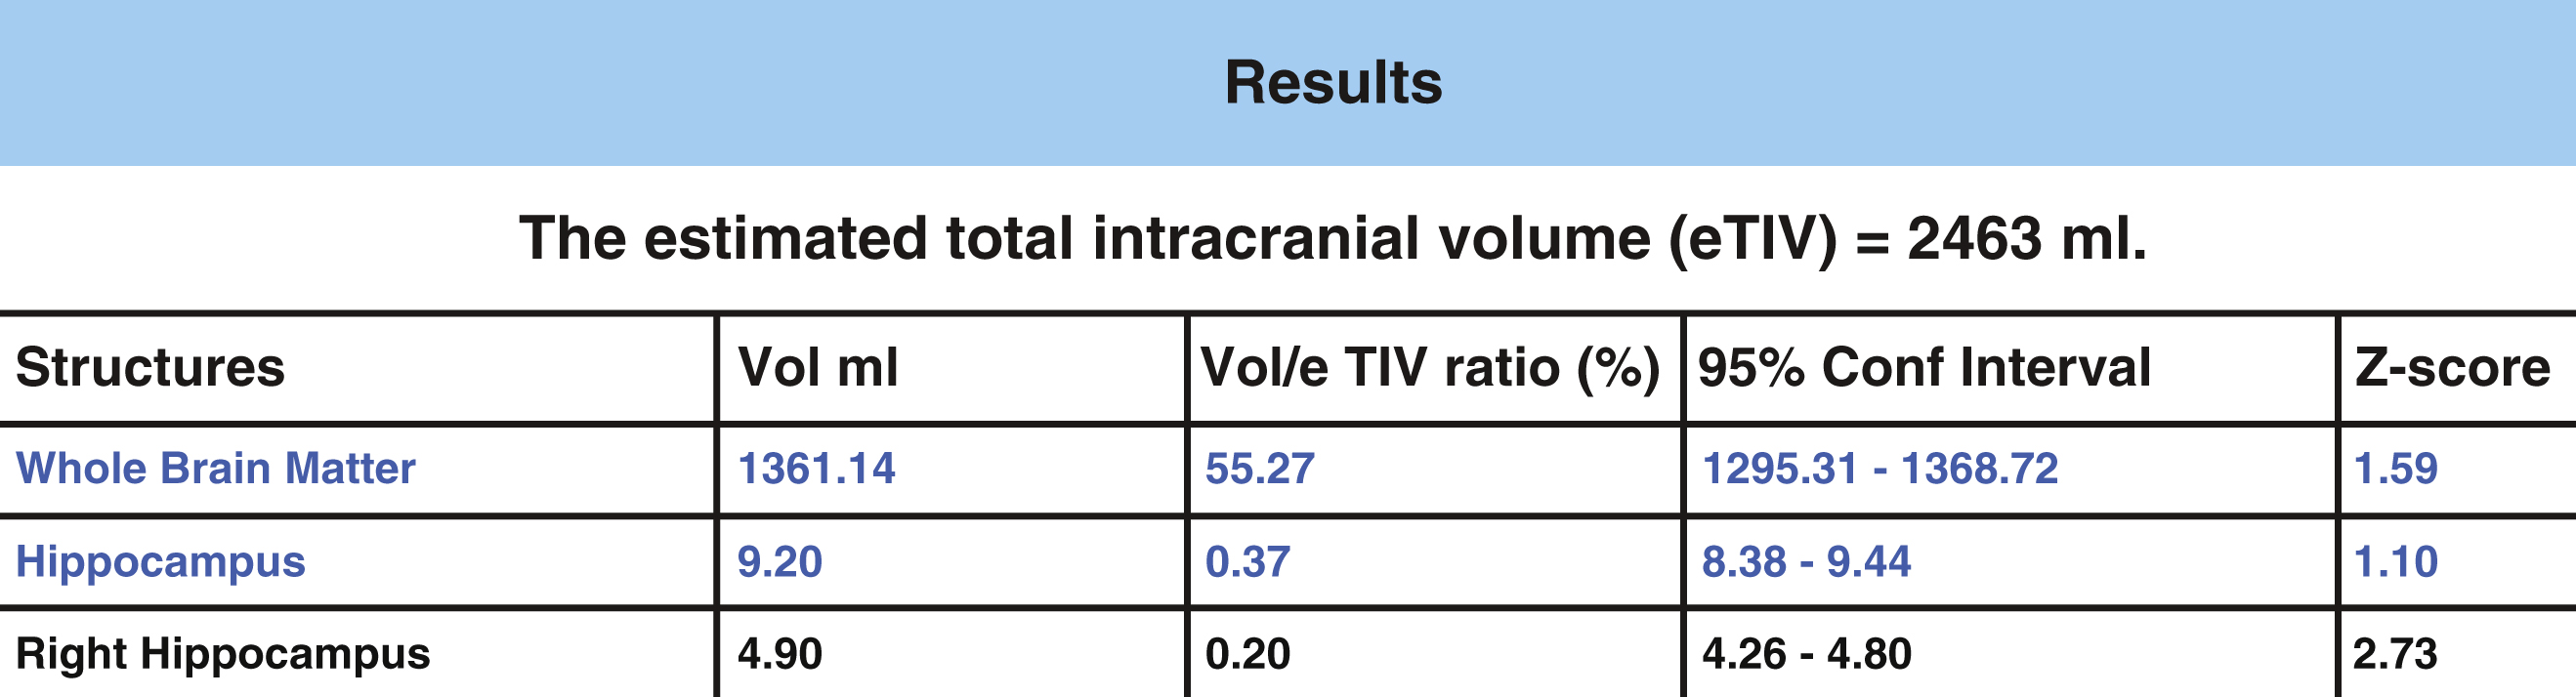
Fig.3
Color coded hippocampal image segmentation.
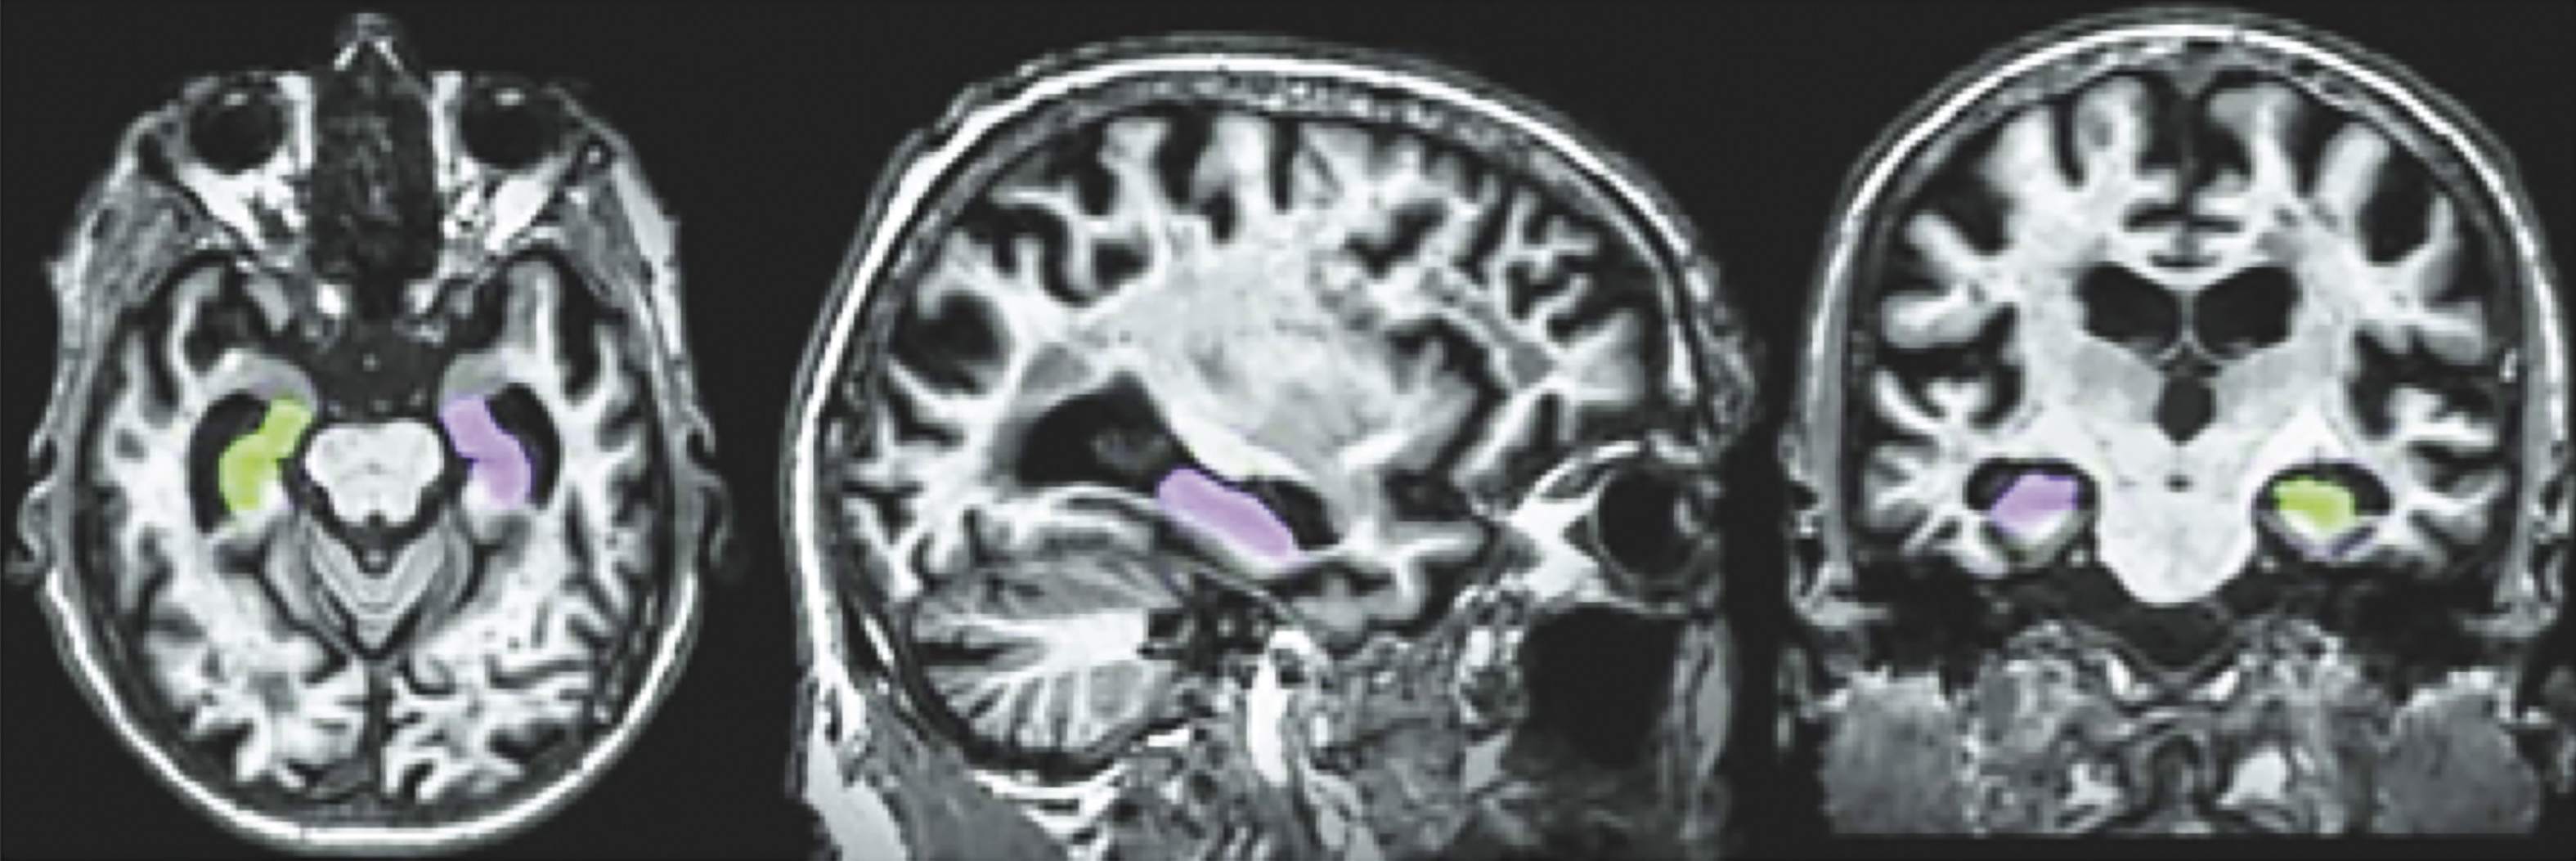
Table 1
Scan protocols
| Tesla | 1.5 | 3.0 |
| Scanner | GE Medical systems | Philips Medical systems |
| Sequence | MP-RAGE | MP-RAGE |
| Flip angle (°) | 8 | 8 |
| Matrix size | 256×256×170 | 256×256×170 |
| TE (ms) | 3.9 | 3.2 |
| TR (ms) | 8.9 | 6.8 |
| Voxel size (mm3) | 0.9×0.9×1.2 | 1×1×1.2 |
Table 2
Subject characteristics
| Variable | 1.5 T (n = 59) | 3.0 T (n = 40) | t value | Statistics (p-value) |
| Age | 74.4±7.4 | 74.9±7.9 | –0.30 | 0.39 |
| Gender (M/F) | 31/28 | 24/16 | NA | 0.54 |
| Total Intracranial Volume | 1887.16±188 | 1891.37±206 | –0.12 | 0.45 |
| Dice Similarity Coefficient (%) | 87.93±1.6 | 87.26±2.4 | 1.99 | 0.03, 0.3 * |
*Cohen’s D effect sizes for statistically significant results.
Table 3A
Dice similarity coefficients (DSC) comparing NeuroreaderTM and manual volumetry in controls, MCI, and AD
| Manual Compared | Control | MCI | AD | t, p-values | t, p-values | t, p-values |
| to NeuroreaderTM | DSC (n = 28) | DSC (n = 33) | DSC (n = 38) | MCI/NC | MCI/AD | AD/NC |
| Left Hippocampus | 88.7% ±1.7 | 87.7% ±3.1 | 86.9% ±1.8 | 1.3, 0.09 | 1.09, 0.13 | <0.001, 1 * |
| Right Hippocampus | 88.5% ±1.6 | 87.8% ±2.3 | 86.9% ±1.7 | 0.77, 0.22 | 1.91, 0.03, 0.4 * | 0.003, 1 * |
*Cohen’s D effect sizes for statistically significant results.
Table 3B
Dice similarity coefficients between the ground truth and the NeuroreaderTM segmentation for the right and left hippocampus
| Hippocampus | Min | Max | Mean | Median | Std. Dv. | Variance |
| Right | 0.7852 | 0.9155 | 0.8749 | 0.8810 | 0.0239 | 0.0006 |
| Left | 0.7630 | 0.9185 | 0.8739 | 0.8782 | 0.0247 | 0.0006 |


