
Efficacy and Safety of MMFS-01, a Synapse Density Enhancer, for Treating Cognitive Impairment in Older Adults: A Randomized, Double-Blind, Placebo-Controlled Trial
Abstract
Background:
Cognitive impairment is a major problem in elderly, affecting quality of life. Pre-clinical studies show that MMFS-01, a synapse density enhancer, is effective at reversing cognitive decline in aging rodents.
Objective:
Since brain atrophy during aging is strongly associated with both cognitive decline and sleep disorder, we evaluated the efficacy of MMFS-01 in its ability to reverse cognitive impairment and improve sleep.
Methods:
We conducted a randomized, double-blind, placebo-controlled, parallel-designed trial in older adult subjects (age 50–70) with cognitive impairment. Subjects were treated with MMFS-01 (n = 23) or placebo (n = 21) for 12 weeks and cognitive ability, sleep quality, and emotion were evaluated. Overall cognitive ability was determined by a composite score of tests in four major cognitive domains.
Results:
With MMFS-01 treatment, overall cognitive ability improved significantly relative to placebo (p = 0.003; Cohen’s d = 0.91). Cognitive fluctuation was also reduced. The study population had more severe executive function deficits than age-matched controls from normative data and MMFS-01 treatment nearly restored their impaired executive function, demonstrating that MMFS-01 may be clinically significant. Due to the strong placebo effects on sleep and anxiety, the effects of MMFS-01 on sleep and anxiety could not be determined.
Conclusions:
The current study demonstrates the potential of MMFS-01 for treating cognitive impairment in older adults.
INTRODUCTION
Cognitive function declines with aging [1]. Cognitive impairment in elderly is a major problem that can affect activities of daily living (ADL) and qualityof life [2, 3]. Although the neuropathological process underlying cognitive impairment remains elusive, the best correlate to cognitive impairment is brain atrophy [1, 4]. Brain atrophy is associated with neuronal, axonal, and synaptic loss. So far, the best structural predictor of cognitive decline is the degree of synaptic loss [5]. Since synapses are the elemental units of neural communication, synapse loss and reduction of synaptic plasticity should have a major impact on neural signaling, resulting in impaired cognition. Therapeutic strategies that prevent net synapse loss and increase synapse density may have great potential for cognitive impairment.
In our pre-clinical studies, we found that the level of brain magnesium is a critical factor controlling synapse density and plasticity. Elevating neuronal intracellular magnesium can increase functional synapse density and plasticity in cultured hippocampal neurons [6, 7]. Mechanistically, we found that intracellular magnesium in neurons serves as a critical second messenger controlling neuronal energy supply and functional synapse density [7]. In an intact rodent, treatment with conventional magnesium salts is ineffective at elevating brain magnesium and improving memory function [8]. This is because active transport systems tightly control the amount of magnesium that crosses first from digestive tract into blood, and then from blood to cerebrospinal fluid (CSF) [9]. In human, increasing blood magnesium by up to 300% only changes CSF magnesium by less than 19% [10]. To overcome this problem, we developed L-Threonic acid Magnesium salt (L-TAMS, formerly MgT), a compound that can effectively enhance CSF magnesium concentration via oral intake [8]. L-TAMS treatment increases synapse density in brain regions critical for executive function and memory, such as the prefrontal cortex and hippocampus [8, 11–13]. Furthermore, L-TAMS treatment increases the number of NR2B containing NMDA receptors, resulting in an enhancement of synaptic plasticity in aging rats and Alzheimer’s disease (AD) model mice [8, 14]. At a functional level, L-TAMS treatment reverses cognitive impairment in aging rats and AD model mice [8, 14]. The increase of synapse density in aging rats is linearly correlated with memory improvement [8]. L-TAMS treatment also enhances fear memory extinction and prevents fear memory over-generalization, leading to a reduction of anxiety in rats [13, 15].
Here, we conducted a randomized, double-blind, placebo-controlled trial to evaluate the efficacy and safety of a treatment regimen consisting of 12 weeks of oral intake of MMFS-01, a compound containing L-TAMS, in older adults with cognitive impairment. We used three inclusion criteria, including subjective memory complaints (SMC), sleep disorder, and anxiety, to select subjects who had cognitive impairment. Their cognitive impairment was later confirmed by an object cognitive test (Trail Making Test - Part B).Sleep and anxiety disorder were used as inclusion criteria to increase the chance of recruiting subjects who had cognitive impairment with an underlyingneurodegenerative condition. This was necessary because previous studies show that SMC is not a good sole indicator of mild cognitive impairment (MCI). Many people who think they have memory issues actually have a normal cognitive profile when tested with objective memory tests. There is only a 30% chance that someone with SMC has MCI [16]. It is common that patients with brain atrophy not only have MCI but also have neuropsychiatric symptoms [17]. The common core non-cognitive symptoms in MCI patients are anxiety [18, 19] and sleep disorder [20, 21]. 47% of MCI patients have anxiety symptoms [22], and 83% of those with MCI and anxiety develop AD compared to only 41% of those with MCI without anxiety [23]. Recent studies show sleep disorder is strongly correlated with cognitive impairment [20], and even the chance of getting AD [24].
Our efficacy evaluation included determination of body magnesium status, tests of cognition in four domains (executive function, working memory, attention, and episodic memory), and measurements of sleep quality and emotional state [25].
MATERIALS AND METHODS
Study design
This was a 12-week parallel-designed, randomized, single-site, double-blind, placebo-controlled clinical trial that compared MMFS-01 and placebo. MMFS-01is a compound containing L-TAMS, trademarked under the name ClariMem®.
Participants
Subjects were men or women between 50 and 70 years of age with self-reported complaints of cognition (memory and concentration), and with anxiety and sleep disorder. Subjects had a Mini-Mental State Examination score (MMSE) equal to or greater than 24. Sleep difficulties defined by a score of greater than 5 on the Pittsburgh Sleep Quality Index (PSQI), and the presence of mild-to-moderate anxiety, with scores ≥12 and ≤ 28 on the Hamilton Anxiety Questionnaire sub-score A (HAM-A), were required for inclusion in the study [26].
Exclusion criteria included active heart disease; uncontrolled high blood pressure (≥140/90 mmHg); renal or hepatic impairment/disease; Type I or II diabetes; bipolar disorder; Parkinson’s disease; AD; dementia; unstable thyroid disease; diagnosed major affective disorder; psychiatric disorder (hospitalized in the past year); immune disorder (such as HIV/AIDS); a history of cancer (except localized skin cancer without metastases or in situ cervical cancer) within 5 years prior to screening; current use of calcium channel blockers, SSRIs or anxiolytics other than benzodiazepines as needed, with “as needed” defined as less than 5 times per month; current use of any medications that are known to interact with magnesium including loop, thiazide, or potassium-sparing diuretics, muscle relaxants, penicillamine, corticosteroids, magnesium-containing antacids or other magnesium containing products; use less than 7 days before the randomization visit of calcium channel blockers, any anxiolytics or SSRIs; current use of antibiotics (a washout period of 2 weeks was allowed); presence of an unstable dose of medication (defined as fewer than 90 days at the same dose); presence of an allergy or sensitivity to any ingredient in the test product; hepatic or renal dysfunction as evidenced by ALT, AST, AP being ≥2 times the upper limit of normal or serum creatinine value ≥2.0 mg/; history of drug or alcohol abuse in the past 12 months or had begun/stopped smoking ≤ 6 months ago or had plans to begin/quit smoking; possibility that the subject may become pregnant as shown by lack of birth control use, pre-menopausal status or absence of hysterectomy; status of pregnancy, lactation or plans to become pregnant during the study period; participation in another research study either presently or within 30 days prior to the screening visit; any condition, abnormality, medication usage or clinically significant clinical laboratory findings that, in the opinion of the investigator, would compromise the safety of the subject or the quality of the study data. Subjects were allowed to take medications if the medication was not part of the exclusion criteria and the dose was unchanged at least 90 days before screening and throughout the study.
Subjects stopped taking any dietary supplements at least 7 days prior to randomization, and maintained cessation during the study. They refrained from alcohol consumption or exercise for at least 24 hours prior to each test visit. No changes to the methods, including eligibility requirements and dosing, were made after commencement of the trial.
Recruitment and randomization
Subject randomization began in November 2012, and recruitment was completed in June 2013. A total of 51 subjects (age 50–70) were recruited by Miami Research Associates (MRA) and enrolled in a randomized double-blind, placebo-controlled trial conducted at MRA (Miami). Data for all subjects at every time point were collected by MRA at their Miami clinical laboratory.
Before the study began, the protocol, informed-consent form, and other information provided to subjects and caregivers were reviewed and approved by the Aspire IRB (September 20, 2012). Subjects were randomly assigned to the MMFS-01 or placebo group in a ratio of 1:1, using a block-2 randomization schedule. Subjects received a sequential number corresponding to the order in which they entered the study. Study sponsors, investigators, research coordinators, attending care teams, and subjects were blinded to treatment group. The consulting statistician locked the database of data elements and unblinded it by accessing the table of randomized assignments and merging them into the data tables.
Dosage
Dosage was set to correspond to approximately 25 mg/kg/day. To accomplish this, subjects between 50 and 70 kg took 1.5 g/day, and subjects between 70 and 100 kg took 2 g/day of MMFS-01. At conclusion of the study, 8 subjects (35 percent) were taking 1.5 g of MMFS-01 per day, and 15 subjects (65 percent) were taking 2 g of MMFS-01 per day.
Power analysis
Enrollment for this study was targeted at 50 subjects (25 per group). Prior to this study, this compound was given open-label to a small number of subjects(L-TAMS has self-affirmed/FDA-affirmed GRAS status). These subjects’ subjective feeling was a significant improvement in anxiety, sleep, and mental clarity. They had significant improvement in anxiety based on the HAM-A questionnaire. Therefore, we powered the analysis in this trial by reduction of HAM-A score. We predicted the treatment would lead to a 50% reduction in HAM-A score, with a SD of HAM-A scores of approximately ± 10 score points [27]. Assuming a serial coefficient correlation of about 0.5 for HAM-Ascores at baseline and 12 weeks, the within-group SD of the 12-week changes would also be ± 10 score points. With the use of an unpaired Student t-test with a significance level of 0.05, a total enrollment of 50 subjects (40 completers if 20% attrition) was required for the study to be able to detect differences of about a 45% reduction in HAM-A score. We assumed an attrition rate of 20% in line with previous experience by the contract research organization that ran the study, MRA. Even if the attrition rate had been as high as 32% , there would have been enough analyzable subjects (34 subjects) to provide 87% power in detecting a clinically meaningful 50% HAM-A score reduction.
Efficacy endpoints
Efficacy assessments were made at Baseline Visit, Week 6 Visit, and Week 12 Visit. The change in the body’s magnesium status was quantified by assessing blood magnesium concentration (plasma Mg2 +), urine magnesium concentration normalized by the estimated glomerular filtration rate (uMg2 +/GFR), and intracellular magnesium concentration (Red Blood Cell; RBC Mg2 +). The key functional efficacy outcome measures included measurements of cognitive abilities, sleep quality, and affect.
TMT-B test
The Trail Making Test – Part B (TMT-B) assesses executive function as well as impulsivity, visual search, visual attention, and motor speed [28]. In the test, subjects were required to connect a series of label circles that constituted a trail. Scores were calculated as the inverse of the time (in milliseconds) it took the subject to complete the task (all 25 circle connections), representing speed. Scores from subjects unable to complete the task in the maximum allotted time (360 seconds), or from those who quit prior to the maximum allotted time, were scaled to the time to complete 25 circle connections before converting to speed. Six out of 44 (13%) subjects did not complete the task at least once with a total of 9 occurrences, 5 at baseline, 3 at Week 6, and 1 at Week 12. Higher speeds reflected better performance.
DigitSpan test
The DigitSpan test assesses working memory performance. Scores were based on the length of the longest sequence of digits (consecutive numbers) subjects could remember and thus ranged from 0 without an upper bound, with higher scores reflecting better performance.
Eriksen Flanker Congruent/Incongruent test
The Eriksen Flanker Congruent/Incongruent test assesses attention, that is, cognitive processes involved in detection and recognition of targets in the presence of distracting information [29]. A target directional arrow was flanked by either arrows in the same (congruent) or opposite direction (incongruent). The average time to correctly select the target arrow’s direction was recorded. The incongruent task was more difficult than the congruent task because the congruent task did not require response inhibition and was less confounded by training effects. Therefore, the response times in the congruent condition were subtracted from those in the incongruent condition to remove training effects and discern effects on attention. The opposite of this difference was reported so higher scores reflected better performance.
Face-Name association test
Finally, the Face-Name Association test assesses hippocampal-dependent episodic memory [30]. Twenty faces with twenty fictional popular first names were shown on screen. Subjects were then asked to remember and later recognize each face and name pair when presented with the same or novel face and name pairs. Using signal detection theory, the hit rate, false alarm rate, and sensitivity index (d’) were calculated, where d’ = z (hit rate) -z (false alarm rate) .d’ showed how well the subject distinguished old from new. Hit rate was defined as a correct identification of an old face and name pair and false alarm as an incorrect identification of a new face and name pair. Higher scores reflected improved performance with scores above three indicative of a near perfect score.
Composite score
Scores from several cognitive tests, evaluating four domains of cognition—executive function, working memory, attention, and episodic memory—were combined to produce a composite score to assess overall cognitive ability [25]. The cognitive tests included TMT-B for executive function [31], DigitSpan for working memory capacity [32], Face-Name Association for episodic memory [33], and Eriksen Congruent/Incongruent Flanker [29] for attention.
The composite score was calculated as the average of the four individual z scores (
Effect size (Cohen’s d) was determined for each of the cognitive endpoints at Week 6 and Week 12 using the formula
Cohen’s
Sleep
Sleep quality was measured with PSQI [26]. PSQI is a self-rated questionnaire which assesses sleep quality and disturbances over a 1-month time interval. Higher scores indicated worse sleep quality. Based on previous research, a global PSQI score greater than 5 yields a diagnostic sensitivity of 89.6% and specificity of 86.5% (kappa = 0.75, p less than 0.001) in distinguishing good and poor sleepers [26].
Emotion
Affective personality was assessed with the HAM-Aand the Positive and Negative Affect Schedule (PANAS). The HAM-A is a rating scale used in both clinical and research settings to measure the severity of psychic and somatic anxiety symptoms [34]. It did not provide any standardized probe questions and was administered by a clinician (subject did not complete the questionnaire by his/herself). Scores ranged from 0 to 56 where ≤ 17 indicated mild severity, 18 to 24 mild to moderate severity, 25 to 30 moderate to severe severity, and >30 severe severity. The PANAS is a self-rated tool used to measure positive and negative affect over a 1-week time interval, and consists of two 10-item scales, one for Positive Affect and the other for Negative Affect [35]. Subjects were asked to rate different feelings and emotions using the following Likert scale: 1 = very slightly or not at all, 2 = a little, 3 = moderately, 4 = quite a bit and 5 = extremely. Scores for each scale ranged from 10 to 50. Higher positive affect scores represented more positive affect, and thus, better outcomes. Higher negative affect scores represented more negative affect, and thus, worse outcomes.
Cognitive ability fluctuation analysis
The fluctuation of cognitive ability over time was evaluated by calculating variance of the change in composite score from Week 6 to Week 12 of individual subjects, with the formula
Tolerability and safety
Safety evaluations included recording all adverse events, results of laboratory tests (comprehensive metabolic panel, uric acid, and complete blood count with differential), vital signs, body weight, and subjective remarks.
Adverse events were listed, MedDRA encoded, grouped by general type of event (gastrointestinal, neurologic, cardiac, etc.), and cross-tabulated by event type and product group. The principal investigator catalogued adverse events as mild, moderate, or severe according to the following definitions: Mild (causing no limitation in normal activities), Moderate (causing some limitation in normal activities), and Severe (causing significant limitation in or the inability to perform normal activities). A central laboratory conducted all laboratory evaluations. Of the 47 adverse events, 13 events, occurring in 10 subjects, were judged by the principal investigator to be probably or possibly related to the study product. Probably and possibly-related adverse events were considerably more prevalent in the placebo group than in the MMFS-01 group (9 and 4 events, in 6 and 4 subjects, respectively). The predominant adverse events were related to gastrointestinal function (affecting 5 of 25 subjects (20.0%) in the MMFS-01 group and 4 of 26 subjects (15.4%) in placebo group, p = 0.726) or infections/infestations (affecting 4 of 25 subjects (16%) in the MMFS-01 group and 6 of 26 subjects (23%) in placebo group, p = 0.726).
Statistical analysis
The safety population consisted of subjects who received at least one dose of any study product, and who had any subsequent encounter with the study site. The efficacy population included all subjects who completed all scheduled visits, had no protocol deviations that in the judgment of the principal investigator would have invalidated their efficacy data (see product compliance section below). Only data from subjects that completed all visits were included in the statistical analysis; therefore, there were no missing data values in the dataset, and imputation was notrequired.
Statistical analyses for cognitive tests and body magnesium status variables were performed with SPSS and R. For categorical variables, difference in the distribution of categories between the different treatment groups was tested for nominal significance by the Chi-Square test, in SPSS or GraphPad Prism. Formal statistical tests were performed for cognitive endpoints and magnesium status using a univariate analysis of covariance (ANCOVA) model at Week 6 and Week 12 with baseline values as a covariate. For safety endpoints, changes were tested for significance by the paired Student t-test, or the non-parametric Wilcoxon signed-ranks test if necessary. Differences in adverse event patterns between product groups were tested by the Fisher’s Exact test.
Longitudinal repeated measures ANCOVA analyses using observed data without any data imputation were used to determine the overall effect from baseline of MMFS-01 compared to placebo. The model included the categorical fixed effects of treatment (MMFS-01 versus placebo), week (6 and 12), and treatment-by-week interaction, as well as the continuous fixed covariate of baseline measurement. Normality of distribution and equality of variance were determined using the Shapiro-Wilk’s test and Levene’s test, respectively. For endpoint values that violated either test, additional bootstrapping was employed, using resampling methods. In the ANCOVA analyses, in order to simulate the F-distribution under the null hypothesis, resampling techniques were used to permute the treatment labels, time point labels, and baseline values. For each of the 10,000 random permutations, F-statistics for the ANCOVA model were computed, and used to compute a percentile p-value for the dataset. Bootstrapping was used for TMT-B, Mg2 + Urine, and Mg2 + Plasma. In one exception, to determine treatment differences at Week 6 and Week 12 between the MMFS-01 and placebo groups for percent change in RBC magnesium concentration, an analysis of variance (ANOVA) model was used instead of ANCOVA.
As this was not a pivotal Phase-III clinical trial, it was not required to control the study-wise Type-1 error rate to a specified alpha level. Each efficacy endpoint was considered an independent question of interest, with a hypothesized difference, and was tested independently using a two-tailed 0.05 alpha level (p ≤ 0.05 required for a conclusion of statistical significance). No interim analysis was performed for this study.
To determine outliers, individual data for each test was analyzed. If a baseline score was greater than 2 SDs away from the mean then that data point was considered to be an outlier, and therefore excluded. Of the four cognitive tests, outliers were only found on the Flanker test. Out of 44 baseline data points, 3 subjects were removed (1 MMFS-01, 2 placebo) from the analysis of the Flanker test. Additionally, we found some ceiling effects in the Face-Name test, in which some subjects had a near perfect baseline score (>3). Therefore, we set 3 as the threshold for the ceiling baseline Face-Name score. Out of 44 data points, 3 subjects were removed (2 MMFS-01, 1 Placebo) from the analysis of the Face-Name test. We removed the contribution of any excluded subject to the composite score so the excluded data points did not erroneously skew the composite score. Except for outliers and scores at the ceiling, all data were included for all subjects for all outcome measurement analyses.
Product compliance
Compliance was measured via the pill counting method, by documenting the number of calendar days between visits and the number of pills that should have been taken. Subject compliance was recorded as a percent of the prescribed amount for each visit and then averaged to produce an overall compliance figure. Per the original protocol, 80–120% compliance was considered acceptable. Of 44 subjects in the per protocol population, 41 returned their unused pills and were in the acceptable range. The remaining 3 did not return their pills, but were determined to be within the acceptable range of compliance based on the estimation of the PI, using MRA staff’s familiarity with the subject and/or subject’s compliance during other testing phase(s) of the study to make this decision. Therefore, all 44 subjects were considered compliant.
Funding and sponsor involvement
The study was funded by Neurocentria Inc., CA, USA, and designed jointly by Neurocentria and MRA. The study was executed and data was collected by MRA who vouched for its integrity, with Dr. Diane Krieger (MRA) serving as the Principal Investigator.Statistical analysis of several efficacy variables including affective, sleep quality and clinical impression tests, and all safety variables including adverse events was carried out by MRA. Neurocentria conducted statistical analysis for cognitive tests and body magnesium status variables. Neurocentria wrote the paper through an iterative review process. ClinicalTrials.gov number, NCT02363634.
RESULTS
Study population
The mean subject age was 57.3 ± 5.2 years, with 71% female. Baseline demographic and background characteristics are summarized in Table 1; there were no significant differences in these characteristics between the treatment and control groups. 66.7% of the subjects (34 of 51) had coexisting medical conditions at baseline. The most common conditions were gastrointestinal (10 subjects; 19.6%). None of the subjects were taking CNS medications and there were no significant differences between groups in the presence of coexisting diseases or medication use.
25 subjects received MMFS-01 (Neurocentria, Inc., Fremont, California, USA), and 26 received placebo. 7 subjects (14%) discontinued the study prematurely: 2 (7.7%) in the MMFS-01 group and 5 (19%) in the placebo group (Fig. 1). Withdrawn consent was the primary reason for discontinuation. The remaining 44 subjects completed the study and were included in the efficacy analysis.
Efficacy
The effects of MMFS-01 on body magnesium levels
We determined the change in body magnesium status by quantifying magnesium in urine (excretion), plasma (extracellular), and RBC (intracellular). Excreted magnesium was measured to estimate the relative amount of absorbed magnesium, because magnesium excreted in urine is proportional to absorbed magnesium, provided that the subject has normal kidney function for mineral reabsorption (i.e., the higher the absorption of magnesium, the higher the excretion) [36]. Treatment with MMFS-01 for 12 weeks resulted in a significant increase in the excretion rate of magnesium relative to placebo (p = 0.027). Plasma magnesium concentration is tightly controlled by homeostatic mechanisms, and plasma magnesium concentration is hardly changed by conventional oral magnesium supplementation [37]. While magnesium was initially higher in the plasma of subjects taking MMFS-01 (Week 6) versus placebo, there was no difference between the two groups at Week 12, due to a change in plasma magnesium concentration in the placebo group from Week 6 to Week 12. This difference is indicated by a significant treatment×time interaction between MMFS-01 and placebo (p < 0.05). Finally, RBC magnesium concentration increased in MMFS-01 treated subjects from baseline to Week 12 (3.3 ± 1.9%) and from Week 6 to Week 12 (3.0 ± 2.0%) compared with a reduction in placebo treated subjects at Week 12 (–0.6% ± 1.8%) and from Week 6 to Week 12 (–3.6 ± 2.1% , p = 0.019). The body magnesium results are summarized in Table 2. These results suggest that the dosage of MMFS-01 was effective at loading magnesium into the body.
The effects of MMFS-01 on cognitive abilities
The effect of MMFS-01 on cognitive ability was evaluated in four cognitive domains: executive function, working memory, attention, and episodic memory by administration of the Trail Making, DigitSpan, Flanker, and Face-Name tests, respectively, at Baseline, Week 6, and Week 12 (Table 3). These cognitive tests were chosen based on the current consensus that multiple domains of cognition should be evaluated to determine cognitive impairment [38]. The cognitive domains we selected were similar to those included in the Alzheimer’s Disease Cooperative Study - Preclinical Alzheimer Cognitive Composite (ADCS-PACC), are in line with recent recommendations by the U.S. Food and Drug Administration, and are reliable for testing cognitive deficits and improvements [39, 40].
MMFS-01 treatment resulted in a significant overall treatment effect in TMT-B (p = 0.047; Table 3 and Fig. 2A). Performance speed in TMT-B (Fig. 2A), reflecting executive function and cognitive processing, improved from baseline at Week 6. The mean improvement (MI) was 2.0 ± 0.8 ms–1 at Week 6 and 2.1 ± 0.8 ms–1 at Week 12 in the MMFS-01 group, corresponding to improvements of 19.1% (Week 6) and 19.9% (Week 12). There was little improvement from baseline in the placebo group at Week 6 (MI = 0.1 ± 0.5 ms–1) and Week 12 (MI = 0.2 ± 0.8 ms–1). These results correspond to an effect size (Cohen’s d) of 0.58 at Week 6 and 0.51 at Week 12 (Table 3).
The DigitSpan test assesses working memory capacity. Subjects receiving MMFS-01 improved their DigitSpan scores (Table 3 and Fig. 2B) at Week 6 (MI = 1.61 ± 0.48 consecutive numbers) compared to those receiving placebo (MI = 0.10 ± 0.59 consecutive numbers). This difference was significant (p = 0.023, Cohen’s d = 0.61), representing a 13.1% net improvement. At Week 12, the improvement persisted in the MMFS-01 group (MI = 1.43 ± 0.55 consecutive numbers), but there was an increase of the test scores in the placebo group (MI = 0.67 ± 0.54 consecutive numbers). Therefore, the difference between the MMFS-01 and placebo groups was not significantly different at Week 12 (p = 0.225).
We used the Flanker test (Table 3 and Fig. 2C) to evaluate attention capability. The opposite of the difference between incongruent and congruent test times was used to represent the test score (see Materials and Methods for explanation). We observed improved test scores relative to baseline in the MMFS-01 group, but the improvements were not statistically different from that of the placebo group at either Week 6 or Week 12, and there was not an overall treatment effect. Flanker test time improved by 34.9% (Week 6) and 38.2% (Week 12) in subjects receiving MMFS-01; however, times of subjects receiving placebo also improved at Week 6 (14.3%) and Week 12 (32.3%). These results suggest that there were significant training effects in this test, which reduced the test’s utility for evaluating efficacy of treatment.
We used the Face-Name association test to evaluate episodic memory (Table 3 and Fig. 2D). In subjects receiving MMFS-01, test scores did not significantly change from baseline at Week 6 (7.1% , p = 0.460), but improved significantly from baseline at Week 12 (37.6% , p = 0.003). However, similarly, the test scores in the placebo group did not improve at Week 6, but increased from baseline by 16.2% at Week 12, although not significantly (p = 0.207). Despite a 21.4% net improvement at Week 12 with MMFS-01 treatment, improvement in the MMFS-01 group was not significantly better than improvement in the placebo group (p = 0.089, Cohen’s d = 0.44).
Finally, to evaluate the overall cognitive ability of each subject, we calculated the composite score of all subjects at baseline, Week 6, and Week 12. Each individual score from each cognitive test was converted to a z score and the z scores from the four tests were averaged (
To determine if improvement in overall cognitive ability persisted from Week 6 to Week 12 in individual subjects we plotted the composite score change from baseline at Week 6 versus the change from baseline at Week 12. The degree of improvement at Week 6 was significantly correlated with the degree of improvement from baseline at Week 12 (R = 0.72, p < 0.001; Supplemental Figure 1B). Conversely, in the placebo group, there was no correlation between change in composite score at Week 6 and change in composite score from baseline at Week 12 (R = 0.07, p = 0.753; Supplementary Figure 1A). This analysis suggests that the treatment effects of MMFS-01 persisted in individual subjects.
MMFS-01 treatment reduces fluctuation in overall cognitive ability
Fluctuation of cognitive ability is an early sign of cognitive impairment [42]. It is reported that 85% of MCI patients have fluctuations over time in their cognitive ability [43]. To evaluate if the subjects’ cognitive ability fluctuated, for each subject we plotted the composite score change from baseline at Week 6 and Week 12 (Fig. 3A-D). In the placebo group, subjects’ composite scores changed dramatically both positively and negatively from baseline (Fig. 3A, C), confirming the existence of cognitive variance in subjects in the current study. Interestingly, in the MMFS-01 treated group, changes from baseline at both Week 6 and Week 12 were mostly positive (Fig. 3B, D). Thus, MMFS-01 treatment appeared to reduce negative fluctuations in overall cognitive ability.
To quantify the effect of MMFS-01 on the fluctuation of cognitive ability, we compared the variance of composite scores between MMFS-01 and placebo groups (Fig. 3E). We calculated variance of individual subjects’ composite score between Week 6 and Week 12 (see Methods for equation). We did not use change from Baseline to Week 6 to avoid the pre-existing cognitive fluctuation prior to treatment. Variance of the composite scores in the placebo group was σ2 = 0.53 whereas variance in MMFS-01 treated group was σ2 = 0.22, a reduction of 57.6% . This analysis included all subjects, even those whose composite score did not improve at Week 6 (n = 7 of 23), so any delayed improvement that occurred from Week 6 to Week 12 contributed to this variance. When we only considered subjects whose composite score improved at Week 6 (n = 16 of 23), variance was even smaller (σ2 = 0.14), representing a 72.8% reduction in variance (Fig. 3E). Therefore, MMFS-01 treatment might also help reduce cognitive fluctuation.
Change in intracellular magnesium predicted the improvement of cognitive abilities
We noticed that the composite scores of subjects in the treatment group did not improve uniformly and in particular, four subjects had little or no improvement after 12 weeks of treatment. Our pre-clinical studies indicate that the increase in intracellular magnesium concentration in neurons is essential for the increase in synapse density (unpublished data) and elevation of CSF magnesium is an important intermediary molecule in the mechanism of action through which our compound leads to an improvement in cognitive abilities [8]. In principle, the increase in intracellular magnesium in neurons should be a predictor of the improvement of cognitive abilities. Unfortunately, current technology does not permit safe quantification of intracellular magnesium of neurons in human. Therefore, we decided to use intracellular magnesium of RBCs as a surrogate marker. Although intracellular magnesium in peripheral cells may not be a true indicator of brain magnesium, it provided a reference for the loading effectiveness of magnesium into cells.
Remarkably, the percent change of RBC intracellular magnesium concentration predicted, with statistical significance, the enhancement in overall cognitive ability (composite score) in the MMFS-01 group (R = 0.49; p = 0.021; Fig. 3G), but not in the placebo group (R =0.22; p = 0.334; Fig. 3F). Controlling for the effects of baseline composite score (see below), the correlation between the percent change of RBC intracellular magnesium concentration and the change in composite score at Week 12 further improved (denoted as R’ = 0.54; p = 0.012; Fig. 3G), with no significant change in the placebo group (R’ = 0.25, p = 0.294; Fig. 3F).
There was also a small but non-significant inverse correlation between baseline composite score and the change in composite score at Week 12 in the MMFS-01group (R = –0.34; p = 0.126; Fig. 3I), that was not present in the placebo group (R = –0.18; p = 0.442; Fig. 3H). Controlling for the percent change of intracellular magnesium, the correlation between baseline composite score and change in composite improved nearly to statistical significance in the MMFS-01 group (R’ = –0.42; p = 0.060; Fig. 3I) but not in the placebo group (R’ = –0.21; p = 0.380; Fig. 3H). These data suggest that MMFS-01 might be more effective at improving the overall cognitive ability of subjects with greater cognitive deficits.
Clinical significance of MMFS-01
Analysis of data from the cognitive tests demonstrated that the improvement of cognitive abilities by MMFS-01 treatment was statistically significant. We carried out further analysis to determine the clinical significance of MMFS-01 treatment. One way to quantify clinical significance is to determine how much cognitive deficit is reversed by comparing test scores with normative data of age-matched subjects. Unfortunately, normative data for our composite score is not available. However, normative data for TMT-B is available from cognitively competent subjects from age 18 to 89 years (referred to hereafter as Tombaugh study), and performance on TMT-B declines with age [44]. We compared results from our study with data from the Tombaugh study. Subjects in our study took significantly longer (125.7 ± 17.6 s) to complete the TMT-B task than age-matched (average age 50–70 years) cognitively normal subjects in the Tombaugh study (75.0 ± 1.3 s; p < 0.0001), confirming that subjects in our study indeed had executive function decline (Fig. 4A), and a mild cognitive impairment.
To quantify how much cognitive impairment was reversed, we plotted average speed of performance on TMT-B as a function of age. The youngest age group, age 18–24, performed the fastest, so all other age groups were normalized to the 18–24 age group. Strikingly, performance of cognitively normal subjects on the TMT-B task declined linearly with age (R = –0.99, p = 10–8), at a rate of 1.04% per year (Fig. 4B). Average TMT-Bspeed for all subjects we studied was about 10% lower than age-matched controls. Following 12 weeks of MMFS-01 treatment there was an average increase of 10.3 ± 3.8% in TMT-B speed, such that their speed was close to that of their age-matched controls.
With this data, we assigned each subject a “brain age” that corresponded to that subject’s speed relative to the normative TMT-B data. The difference between each subject’s actual age and brain age was representative of the degree of executive function decline. For example, a 50-year-old subject who performed approximately 10% worse on the TMT-B test than a normal 50-year-old had a brain age that corresponded approximately to a cognitively normal 60-year-old, and therefore had a 10-year deficit. The average age of all subjects who completed the current study was 57.8 ± 0.8 years (Fig. 4B blue arrow), but their average brain age at baseline was 68.3 ± 3.0 years (Fig. 4B, red arrow), suggesting that the subjects in the current study had about 10 years of cognitive impairment. After 6 weeks of treatment, the average brain age of the MMFS-01 group deceased from 69.6 ± 4.2 years to 60.6 ± 5.6 years, an improvement of 9.0 ± 3.5 years (Fig. 4C, top right panel), and persisted after 12 weeks of treatment with 9.4 ± 3.5 years of improvement (Fig. 4B, green arrow; 4C, bottom right panel). In contrast, there was little change in the average brain age in the placebo group, improving 0.6 ± 2.3 years at Week 6 (Fig. 4C, top left panel) and 0.8 ± 3.5 years at Week 12 (Fig. 4C, bottom left panel). These data demonstrate that MMFS-01 treatment was effective in our subjects at reversing cognitive impairment almost back to normal ability relative to age.
Using elevation of RBC intracellular magnesium as a biomarker to screen for responders, we found that 15 of 22 subjects in the MMFS-01 group (68.2%) responded to MMFS-01 treatment. When the brain age of only the responders was calculated, the improvement at Week 12 was 14.6 ± 3.9 years, indicating an even greater reduction in cognitive impairment among magnesium responders than all subjects receiving MMFS-01. On the other hand, these data also show approximately 30% of the subjects did not respond to MMFS-01 treatment.
Safety and tolerability
The effects of MMFS-01 on sleep quality and emotion
We also evaluated the effects of MMFS-01 treatment on neuropsychiatric symptoms (Table 4). Subjects in the placebo group had significant changes in affect, anxiety, and sleep at Week 6 and Week 12, as reflected by the subjective tests HAM-A, PANAS: Positive Affect, PANAS: Negative Affect, and PSQI, suggesting that there were significant placebo effects on all three. MMFS-01 treatment had similar effects on affect, anxiety, and sleep, but was not significantly better or worse than placebo. Therefore, in this trial, using these subjective measures, MMFS-01 treatment did not have an effect on sleep or anxiety. Importantly though, MMFS-01 treatment did not make anxiety, sleep disorder, or affect worse.
Adverse events
The safety population was composed of 25 subjects in the MMFS-01 group and 26 subjects in the placebo group. A total of 47 adverse events were observed among 28 of the 51 subjects in the safety population, experienced approximately equally among subjects in placebo and MMFS-01 groups (15 and 13 subjects, respectively; Table 5). Individual events were considerably more prevalent in the placebo group than in the MMFS-01 group (30 and 17 events, respectively). Most adverse events were mild, and no serious adverse events were observed during the course of the study. No significant changes in body weight, systolic blood pressure, diastolic blood pressure, or heart rate were observed. For additional tolerability and safety information, see Materials and Methods section.
DISCUSSION
This study sought to determine the effects of MMFS-01, a synapse density enhancer, on cognitive ability, sleep disorder, and anxiety in older adult subjects with cognitive impairment. The inclusion criteria we chose, including SMC, sleep disorder and anxiety, of which the latter two are strongly associated with cognitive impairment [18, 20], enriched our population for those who had an underlying cognitive impairment. Indeed, the subjects recruited in this study had a mild cognitive impairment (approximately 10 years) compared to age-matched controls from normative data (Fig. 4). Therefore, the results from this study are more appropriately interpreted as a reduction of cognitive impairment than as an enhancement of cognitive function.
MMFS-01 treatment resulted in an improvement in multiple individual cognitive domains. After 6 weeks of treatment with MMFS-01, we observed improvements in executive function (TMT-B), and working memory (DigitSpan), both associated with the prefrontal cortex, and after 12 weeks, we observed improvement in episodic memory, associated with the hippocampus [11, 12]. These observations suggest that the mechanisms of action of MMFS-01 might work at different time scales in different brain areas.
Although there was a significant overall improvement in executive function (p = 0.047, Cohen’s d = 0.51 at Week 12), it was unclear how this improvement would impact the subject’s daily function. It is common practice in evaluating clinical trial data to not only evaluate effect size but to also evaluate clinical significance. For example, in Parkinson’s disease clinical trials, a total score change of 8 points in the Unified Parkinson’s Disease Rating Scale is considered to be clinically significant because it demonstrates a meaningful functional improvement in patients’ quality of life even though statistical significance can be achieved with a lower score change [45]. Here, we show that the improvement on the TMT-B test reflected an approximate 9-year improvement in executive function, which might have a meaningful effect on the subject’s quality of life.
Even though the improvement in executive function was clinically significant, each of the individual cognitive tests only provided information on one cognitive domain. To evaluate the efficacy of new therapies for reducing cognitive impairment, one needs to evaluate the change of overall cognitive ability. Conventionally, overall cognitive ability is determined by a composite score calculated from a set of cognitive tests [46, 47]. Currently, a standardized set of individual cognitive tests has not been established. Cognitive domains that decline significantly with age include attention/working memory, executive function, episodic memory, and visuo-spatial ability [46]. Several attempts have been made to establish composite tests that can be used to quantify overall cognitive abilities across these domains. The Alzheimer’s Disease Cooperative Study-Preclinical Alzheimer Cognitive Composite (ADCS-PACC), the Alzheimer’s Prevention Initiative composite cognitive test score, and the UCSD Performance-Based Skills Assessment (UPSA) are some of the examples [25, 48, 49]. Our study evaluated the same cognitive domains (albeit without evaluation of visuo-spatial ability). Each test we chose to evaluate specific domain function is extensively used and highly sensitive, as each has a large dynamic range with limited ceiling and floor effects [46]. Thus, the composite score in the current study should be valid to represent overall cognitive ability.
We determined that MMFS-01 improved overall cognitive ability (composite score) both in absolute terms and compared to the placebo group. The effect size for change in overall cognitive ability was robust (d = 0.91 at Week 12), generating enough statistical power in a sample size of only 44 subjects. The effect size was significantly larger for overall cognitive ability than for individual cognitive tests. The possible interpretation is that subjects in the MMFS-01 group who improved in one domain typically improved in the other domains, whereas, in the placebo group, subjects who improved in one domain often had no change or decreased in the other domains.
The consistency in improvement among the different cognitive domains for individual subjects in the MMFS-01 group was in line with our observation that MMFS-01 reduced fluctuations in cognitive ability (Fig. 3). Cognitive fluctuation is a known phenomenon in those with cognitive impairment and is likely due to variations in the activity of neural networks [42, 43]. These fluctuations can have a dramatic impact on subject’s performance on cognitive testing over time [50]. Indeed, large fluctuations in cognitive ability over time were observed in subjects in the placebo group. The reduction in cognitive fluctuation with MMFS-01 treatment might be a more noteworthy observation than the increase in overall cognitive ability because from a clinical perspective it might be most important to reduce the number of “bad days” a patient has. This might result in higher overall functionality and quality of life. If so, the reduction of cognitive fluctuation may be a meaningful outcome measure and could be included as an efficacy endpoint in future clinical trials.
Since not all subjects responded to MMFS-01 treatment, a biomarker that predicts responders would be ideal in a clinical setting. Our pre-clinical work indicates that the mechanism of action of MMFS-01 is increased structural and functional synapse density, mediated by an elevation of neuronal intracellular magnesium concentration [7, 8]. Consistent with this mechanism, we identified a biomarker—the percent change in RBC magnesium concentration at 12 weeks of treatment—that predicted treatment response (or lack thereof). If confirmed, the biomarker can potentially be used to predict the outcome of MMFS-01 therapy and help identify the subjects who are more likely to benefit from MMFS-01 treatment.
At the onset of this trial, in addition to determining the effects of MMFS-01 treatment on cognitive ability, we also sought to determine its effects on emotion and sleep. The large placebo effects observed in this study, typical in these types of trials [51], is unfortunate because it prevented us from determining the true effects of MMFS-01 on emotion and sleep (Table 4). With the current subjective measures it is difficult to determine the effects of MMFS-01 on emotion and sleep. One possible way to solve this problem is to use objective evaluators of emotion. For example, our animal studies show that L-TAMS treatment can enhance fear extinction [13], and such experiments can be done in humans [52]. We plan to use more objective measures to test the effects of MMFS-01 treatment on anxiety and sleep in a future trial.
This trial also evaluated the safety of MMFS-01. Importantly, the adverse event profile was similar between the MMFS-01 and placebo groups, with nearly all events classified as mild and none as serious. This is promising because any treatment for age-related cognitive decline or any other pre-AD cognitive impairment needs to have an extremely good safety and tolerance profile, since patients will likely take the medicine for many years.
There is currently no effective way to reverse age-related cognitive decline or MCI. Numerous efforts with different approaches have had minimal effect. For example, pharmacological or dietary supplemental treatments using cholinesterase inhibitors, statins, or vitamin E are ineffective at reducing cognitive deficits or delaying onset of AD in MCI patients [53–56]. The only treatment showing consistent positive results is physical exercise, but with a modest effect size (in the Cohen’s d = 0.30 range) [57–59]. Recent studies utilizing mental exercise therapy have shown some exciting potential [60–65], albeit with small effect sizes. Interestingly, we found in our pre-clinical studies that a combination of L-TAMS treatment and environmental enrichment/physical exercise can further enhance the cognitive ability of aging rodents (unpublishedobservation).
Study limitations
Although this study showed strong efficacy of MMFS-01 for improving cognitive ability, one caution we have is that the population of subjects we studied not only had cognitive impairment but also had common neuropsychiatric symptoms including anxiety and sleep disorder. Therefore, we do not know whether our compound will be equally effective in people with cognitive impairment but without neuropsychiatric symptoms. Nevertheless, since approximately 50% of MCI patients have anxiety [22], even if MMFS-01 only works for this subtype of MCI patients, it still would represent a significant portion of MCI patients. There are several other limitations to our study that should be considered when interpreting the results. One of them is the relatively small sample size recruited at only one study site. Due to the inhomogeneity of human genetic background and environment, a larger trial size with more geographical locations and more ethnic diversity is needed. Another important limitation is trial length. A longer trial will help determine the long-term outcome of MMFS-01 treatment and whether MMFS-01 will delay onset to AD/dementia. Finally, it is not known if MMFS-01 can reverse cognitive impairment in those with more severe cognitive deficits, such as AD. To evaluate this, we are currently testing MMFS-01 in another trial with mild and moderate AD patients.
CONCLUSIONS
In summary, the current study demonstrated efficacy of MMFS-01, a compound designed to increase brain synapse density, on restoration of cognitive abilities. This study highlights the importance of increasing neuronal intracellular magnesium, a key intermediary of synapse density control, on improving cognitive abilities in older adults.
ACKNOWLEDGMENTS
We thank the volunteers and site staff who participated in this study, including Dr. John Pezzullo, MRA, for creating the randomization schedule and log, carrying out statistical analysis on emotion and sleep endpoints, and generating the clinical project report. We acknowledge and thank Dr. Diane Krieger, Dr. Douglas Kalman, Mr. Adam Samson, and Ms. Samantha Feldman, MRA, for study execution, data collection, and statistical analysis and interpretation of safety data (including adverse events), and subjective endpoints (including anxiety, mood, and sleep quality). We thank Dr. Alan Garfinkel and Dr. Nick Wisniewski, University of California Los Angeles, for their help with statistical bootstrapping analysis. We also thank Dr. Jack Feldman, University of California Los Angeles, for his critical review and helpful insight of the manuscript.
This work is supported by Neurocentria, Inc.
Authors’ disclosures available online (http://j-alz.com/manuscript-disclosures/15-0538r2).
Appendices
The supplementary material is available in the electronic version of this article: http://dx.doi.org/10.3233/JAD-150538.
REFERENCES
[1] | Jack CR Jr , Wiste HJ , Weigand SD , Knopman DS , Vemuri P , Mielke MM , Lowe V , Senjem ML , Gunter JL , Machulda MM , Gregg BE , Pankratz VS , Rocca WA , Petersen RC ((2015) ) Age, sex, and APOE epsilon4 effects on memory, brain structure, and beta-amyloid across the adult life span. JAMA Neurol 72: , 511–519. |
[2] | Perneczky R , Pohl C , Sorg C , Hartmann J , Tosic N , Grimmer T , Heitele S , Kurz A ((2006) ) Impairment of activities of daily living requiring memory or complex reasoning as part of the MCI syndrome. Int J Geriatr Psychiatry 21: , 158–162. |
[3] | Farias ST , Mungas D , Reed BR , Harvey D , Cahn-Weiner D , Decarli C ((2006) ) MCI is associated with deficits in everyday functioning. Alzheimer Dis Assoc Disord 20: , 217–223. |
[4] | Fox NC , Scahill RI , Crum WR , Rossor MN ((1999) ) Correlation between rates of brain atrophy and cognitive decline in AD. Neurology 52: , 1687–1689. |
[5] | Terry RD , Masliah E , Salmon DP , Butters N , DeTeresa R , Hill R , Hansen LA , Katzman R ((1991) ) Physical basis of cognitive alterations in Alzheimer’s disease: Synapse loss is the major correlate of cognitive impairment. Ann Neurol 30: , 572–580. |
[6] | Slutsky I , Sadeghpour S , Li B , Liu G ((2004) ) Enhancement of synaptic plasticity through chronically reduced Ca2+ flux during uncorrelated activity. Neuron 44: , 835–849. |
[7] | Zhou H , Liu G ((2015) ) Regulation of density of functional presynaptic terminals by local energy supply. Mol Brain 8: , 42 |
[8] | Slutsky I , Abumaria N , Wu LJ , Huang C , Zhang L , Li B , Zhao X , Govindarajan A , Zhao MG , Zhuo M , Tonegawa S , Liu G ((2010) ) Enhancement of learning and memory by elevating brain magnesium. Neuron 65: , 165–177. |
[9] | Kim YJ , McFarlane C , Warner DS , Baker MT , Choi WW , Dexter F ((1996) ) The effects of plasma and brain magnesium concentrations on lidocaine-induced seizures in the rat. Anesth Analg 83: , 1223–1228. |
[10] | McKee JA , Brewer RP , Macy GE , Phillips-Bute B , Campbell KA , Borel CO , Reynolds JD , Warner DS ((2005) ) Analysis of the brain bioavailability of peripherally administered magnesium sulfate: A study in humans with acute brain injury undergoing prolonged induced hypermagnesemia. Crit Care Med 33: , 661–666. |
[11] | Burgess N , Maguire EA , O’Keefe J ((2002) ) The human hippocampus and spatial and episodic memory. Neuron 35: , 625–641. |
[12] | Kane MJ , Engle RW ((2002) ) The role of prefrontal cortex in working-memory capacity, executive attention, and general fluid intelligence: An individual-differences perspective. Psychon Bull Rev 9: , 637–671. |
[13] | Abumaria N , Yin B , Zhang L , Li XY , Chen T , Descalzi G , Zhao L , Ahn M , Luo L , Ran C , Zhuo M , Liu G ((2011) ) Effects of elevation of brain magnesium on fear conditioning, fear extinction, and synaptic plasticity in the infralimbic prefrontal cortex and lateral amygdala. J Neurosci 31: , 14871–14881. |
[14] | Li W , Yu J , Liu Y , Huang X , Abumaria N , Zhu Y , Xiong W , Ren C , Liu XG , Chui D , Liu G ((2014) ) Elevation of brain magnesium prevents synaptic loss and reverses cognitive deficits in Alzheimer’s disease mouse model. Mol Brain 7: , 65 |
[15] | Abumaria N , Luo L , Ahn M , Liu G ((2013) ) Magnesium supplement enhances spatial-context pattern separation and prevents fear overgeneralization. Behav Pharmacol 24: , 255–263. |
[16] | Mitchell AJ ((2008) ) The clinical significance of subjective memory complaints in the diagnosis of mild cognitive impairment and dementia: A meta-analysis. Int J Geriatr Psychiatry 23: , 1191–1202. |
[17] | Lee GJ , Lu PH , Hua X , Lee S , Wu S , Nguyen K , Teng E , Leow AD , Jack CR Jr , Toga AW , Weiner MW , Bartzokis G , Thompson PM Alzheimer’s Disease Neuroimaging, Initiative (2012) ) Depressive symptoms in mild cognitive impairment predict greater atrophy in Alzheimer’s disease-related regions. Biol Psychiatry 71: , 814–821. |
[18] | Bierman EJ , Comijs HC , Jonker C , Beekman AT ((2007) ) Symptoms of anxiety and depression in the course of cognitive decline. Dement Geriatr Cogn Disord 24: , 213–219. |
[19] | Schaie KW , Willis SL , Caskie GI ((2004) ) The Seattle longitudinal study: Relationship between personality and cognition. Neuropsychol Dev Cogn B Aging Neuropsychol Cogn 11: , 304–324. |
[20] | Mander BA , Rao V , Lu B , Saletin JM , Lindquist JR , Ancoli-Israel S , Jagust W , Walker MP ((2013) ) Prefrontal atrophy, disrupted NREM slow waves and impaired hippocampal-dependent memory in aging. Nat Neurosci 16: , 357–364. |
[21] | Chaves da Silva RAP ((2015) ) Sleep disturbances and mild cognitive impairment: A review. Sleep Science 8: , 36–41. |
[22] | Apostolova LG , Di LJ , Duffy EL , Brook J , Elashoff D , Tseng CH , Fairbanks L , Cummings JL ((2014) ) Risk factors for behavioral abnormalities in mild cognitive impairment and mild Alzheimer’s disease. Dement Geriatr Cogn Disord 37: , 315–326. |
[23] | Palmer K , Berger AK , Monastero R , Winblad B , Backman L , Fratiglioni L ((2007) ) Predictors of progression from mild cognitive impairment to Alzheimer disease. Neurology 68: , 1596–1602. |
[24] | Ju YE , McLeland JS , Toedebusch CD , Xiong C , Fagan AM , Duntley SP , Morris JC , Holtzman DM ((2013) ) Sleep quality and preclinical Alzheimer disease. JAMA Neurol 70: , 587–593. |
[25] | Langbaum JB , Hendrix SB , Ayutyanont N , Chen K , Fleisher AS , Shah RC , Barnes LL , Bennett DA , Tariot PN , Reiman EM ((2014) ) An empirically derived composite cognitive test score with improved power to track and evaluate treatments for preclinical Alzheimer’s disease. Alzheimers Dement 10: , 666–674. |
[26] | Buysse DJ , Reynolds CF 3rd , Monk TH , Berman SR , Kupfer DJ ((1989) ) The Pittsburgh Sleep Quality Index: A new instrument for psychiatric practice and research. Psychiatry Res 28: , 193–213. |
[27] | Amsterdam JD , Li Y , Soeller I , Rockwell K , Mao JJ , Shults J ((2009) ) A randomized, double-blind, placebo-controlled trial of oral Matricaria recutita (chamomile) extract therapy for generalized anxiety disorder. J Clin Psychopharmacol 29: , 378–382. |
[28] | Arbuthnott K , Frank J ((2000) ) Trail making test, part B as a measure of executive control: Validation using a set-switching paradigm. J Clin Exp Neuropsychol 22: , 518–528. |
[29] | Eriksen B , Eriksen C ((1974) ) Effects of noise letters upon the identification of a target letter in a nonsearch task. Percept Psychophys 16: , 143–149. |
[30] | Zeineh MM , Engel SA , Thompson PM , Bookheimer SY ((2003) ) Dynamics of the hippocampus during encoding and retrieval of face-name pairs. Science 299: , 577–580. |
[31] | Ashendorf L , Jefferson AL , O’Connor MK , Chaisson C , Green RC , Stern RA ((2008) ) Trail Making Test errors in normal aging, mild cognitive impairment, and dementia. Arch Clin Neuropsychol 23: , 129–137. |
[32] | Kurt P , Yener G , Oguz M ((2011) ) Impaired digit span can predict further cognitive decline in older people with subjective memory complaint: A preliminary result. Aging Ment Health 15: , 364–369. |
[33] | James LE , Fogler KA , Tauber SK ((2008) ) Recognition memory measures yield disproportionate effects of aging on learning face-name associations. Psychol Aging 23: , 657–664. |
[34] | Hamilton M ((1959) ) The assessment of anxiety states by rating. Br J Med Psychol 32: , 50–55. |
[35] | Watson D , Clark LA , Tellegen A ((1988) ) Development and validation of brief measures of positive and negative affect: The PANAS scales. J Pers Soc Psychol 54: , 1063–1070. |
[36] | Walker AF , Marakis G , Christie S , Byng M ((2003) ) Mg citrate found more bioavailable than other Mg preparations in a randomised, double-blind study. Magnes Res 16: , 183–191. |
[37] | Muhlbauer B , Schwenk M , Coram WM , Antonin KH , Etienne P , Bieck PR , Douglas FL ((1991) ) Magnesium-L-aspartate-HCl and magnesium-oxide: Bioavailability in healthy volunteers. Eur J Clin Pharmacol 40: , 437–438. |
[38] | Dubois B , Feldman HH , Jacova C , Cummings JL , Dekosky ST , Barberger-Gateau P , Delacourte A , Frisoni G , Fox NC , Galasko D , Gauthier S , Hampel H , Jicha GA , Meguro K , O’Brien J , Pasquier F , Robert P , Rossor M , Salloway S , Sarazin M , de Souza LC , Stern Y , Visser PJ , Scheltens P ((2010) ) Revising the definition of Alzheimer’s disease: A new lexicon. Lancet Neurol 9: , 1118–1127. |
[39] | Donohue MC , Sperling RA , Salmon DP , Rentz DM , Raman R , Thomas RG , Weiner M , Aisen PS ((2014) ) The preclinical Alzheimer cognitive composite: Measuring amyloid-related decline. JAMA Neurol 71: , 961–970. |
[40] | Food and Drug Administration ((2013) ) FDA Guidance for Industry. Alzheimer’s disease: Developing drugs for the treatment of early stage disease. Food and Drug Administration, Washington, DC. |
[41] | Cohen J ((2013) ) Statistical power analysis for the behavioral sciences Academic press |
[42] | Palop JJ , Chin J , Mucke L ((2006) ) A network dysfunction perspective on neurodegenerative diseases. Nature 443: , 768–773. |
[43] | Kaduszkiewicz H , Eisele M , Wiese B , Prokein J , Luppa M , Luck T , Jessen F , Bickel H , Mosch E , Pentzek M , Fuchs A , Eifflaender-Gorfer S , Weyerer S , Konig HH , Brettschneider C , van den Bussche H , Maier W , Scherer M , Riedel-Heller SG ((2014) ) Prognosis of mild cognitive impairment in general practice: Results of the German AgeCoDe study. Ann Fam Med 12: , 158–165. |
[44] | Tombaugh TN ((2004) ) Trail Making Test A and B: Normative data stratified by age and education. Arch Clin Neuropsychol 19: , 203–214. |
[45] | Schrag A , Sampaio C , Counsell N , Poewe W ((2006) ) Minimal clinically important change on the unified Parkinson’s disease rating scale. Mov Disord 21: , 1200–1207. |
[46] | Albert MS , DeKosky ST , Dickson D , Dubois B , Feldman HH , Fox NC , Gamst A , Holtzman DM , Jagust WJ , Petersen RC , Snyder PJ , Carrillo MC , Thies B , Phelps CH ((2011) ) The diagnosis of mild cognitive impairment due to Alzheimer’s disease: Recommendations from the National Institute on Aging-Alzheimer’s Association workgroups on diagnostic guidelines for Alzheimer’s disease. Alzheimers Dement 7: , 270–279. |
[47] | Huang Y , Ito K , Billing CB Jr , Anziano RJ ((2015) ) Development of a straightforward and sensitive scale for MCI and early AD clinical trials. Alzheimers Dement 11: , 404–414. |
[48] | Goldberg TE , Koppel J , Keehlisen L , Christen E , Dreses-Werringloer U , Conejero-Goldberg C , Gordon ML , Davies P ((2010) ) Performance-based measures of everyday function in mild cognitive impairment. Am J Psychiatry 167: , 845–853. |
[49] | Ayutyanont N , Langbaum JB , Hendrix SB , Chen K , Fleisher AS , Friesenhahn M , Ward M , Aguirre C , Acosta-Baena N , Madrigal L , Munoz C , Tirado V , Moreno S , Tariot PN , Lopera F , Reiman EM ((2014) ) The Alzheimer’s prevention initiative composite cognitive test score: Sample size estimates for the evaluation of preclinical Alzheimer’s disease treatments in presenilin 1 E280A mutation carriers. J Clin Psychiatry 75: , 652–660. |
[50] | Escandon A , Al-Hammadi N , Galvin JE ((2010) ) Effect of cognitive fluctuation on neuropsychological performance in aging and dementia. Neurology 74: , 210–217. |
[51] | Huedo-Medina TB , Kirsch I , Middlemass J , Klonizakis M , Siriwardena AN ((2012) ) Effectiveness of non-benzodiazepine hypnotics in treatment of adult insomnia: Meta-analysis of data submitted to the Food and Drug Administration. BMJ 345: , e8343 |
[52] | Schiller D , Delgado MR ((2010) ) Overlapping neural systems mediating extinction, reversal and regulation of fear. Trends Cogn Sci 14: , 268–276. |
[53] | Russ TC , Morling JR ((2012) ) Cholinesterase inhibitors for mild cognitive impairment. Cochrane Database Syst Rev 9: , CD009132 |
[54] | Bettermann K , Arnold AM , Williamson J , Rapp S , Sink K , Toole JF , Carlson MC , Yasar S , Dekosky S , Burke GL ((2012) ) Statins, risk of dementia, and cognitive function: Secondary analysis of the ginkgo evaluation of memory study. J Stroke Cerebrovasc Dis 21: , 436–444. |
[55] | Farina N , Isaac MG , Clark AR , Rusted J , Tabet N ((2012) ) Vitamin E for Alzheimer’s dementia and mild cognitive impairment. Cochrane Database Syst Rev 11: , CD002854 |
[56] | Dysken MW , Sano M , Asthana S , Vertrees JE , Pallaki M , Llorente M , Love S , Schellenberg GD , McCarten JR , Malphurs J , Prieto S , Chen P , Loreck DJ , Trapp G , Bakshi RS , Mintzer JE , Heidebrink JL , Vidal-Cardona A , Arroyo LM , Cruz AR , Zachariah S , Kowall NW , Chopra MP , Craft S , Thielke S , Turvey CL , Woodman C , Monnell KA , Gordon K , Tomaska J , Segal Y , Peduzzi PN , Guarino PD ((2014) ) Effect of vitamin E and memantine on functional decline in Alzheimer disease: The TEAM-AD VA cooperative randomized trial. JAMA 311: , 33–44. |
[57] | Chapman SB , Aslan S , Spence JS , Defina LF , Keebler MW , Didehbani N , Lu H ((2013) ) Shorter term aerobic exercise improves brain, cognition, and cardiovascular fitness in aging. Front Aging Neurosci 5: , 75 |
[58] | Colcombe S , Kramer AF ((2003) ) Fitness effects on the cognitive function of older adults: A meta-analytic study. Psychol Sci 14: , 125–130. |
[59] | McDonnell MN , Smith AE , Mackintosh SF ((2011) ) Aerobic exercise to improve cognitive function in adults with neurological disorders: A systematic review. Arch Phys Med Rehabil 92: , 1044–1052. |
[60] | Anguera JA , Boccanfuso J , Rintoul JL , Al-Hashimi O , Faraji F , Janowich J , Kong E , Larraburo Y , Rolle C , Johnston E , Gazzaley A ((2013) ) Video game training enhances cognitive control in older adults. Nature 501: , 97–101. |
[61] | Rebok GW , Ball K , Guey LT , Jones RN , Kim HY , King JW , Marsiske M , Morris JN , Tennstedt SL , Unverzagt FW , Willis SL ((2014) ) Ten-year effects of the advanced cognitive training for independent and vital elderly cognitive training trial on cognition and everyday functioning in older adults. J Am Geriatr Soc 62: , 16–24. |
[62] | Smith GE , Housen P , Yaffe K , Ruff R , Kennison RF , Mahncke HW , Zelinski EM ((2009) ) A cognitive training program based on principles of brain plasticity: Results from the Improvement in Memory with Plasticity-based Adaptive Cognitive Training (IMPACT) study. J Am Geriatr Soc 57: , 594–603. |
[63] | Cheng ST , Chow PK , Song YQ , Yu EC , Chan AC , Lee TM , Lam JH ((2014) ) Mental and physical activities delay cognitive decline in older persons with dementia. Am J Geriatr Psychiatry 22: , 63–74. |
[64] | Bozoki A , Radovanovic M , Winn B , Heeter C , Anthony JC ((2013) ) Effects of a computer-based cognitive exercise program on age-related cognitive decline. Arch Gerontol Geriatri 57: , 1–7. |
[65] | Owen AM , Hampshire A , Grahn JA , Stenton R , Dajani S , Burns AS , Howard RJ , Ballard CG ((2010) ) Putting brain training to the test. Nature 465: , 775–778. |
Figures and Tables
Fig.1
Study assignment and outcomes. All subjects who withdrew were evaluated for the presence of an adverse event. If an adverse event was determined as the reason for withdrawn consent then “had adverse event(s)” was listed as the reason for premature discontinuation.
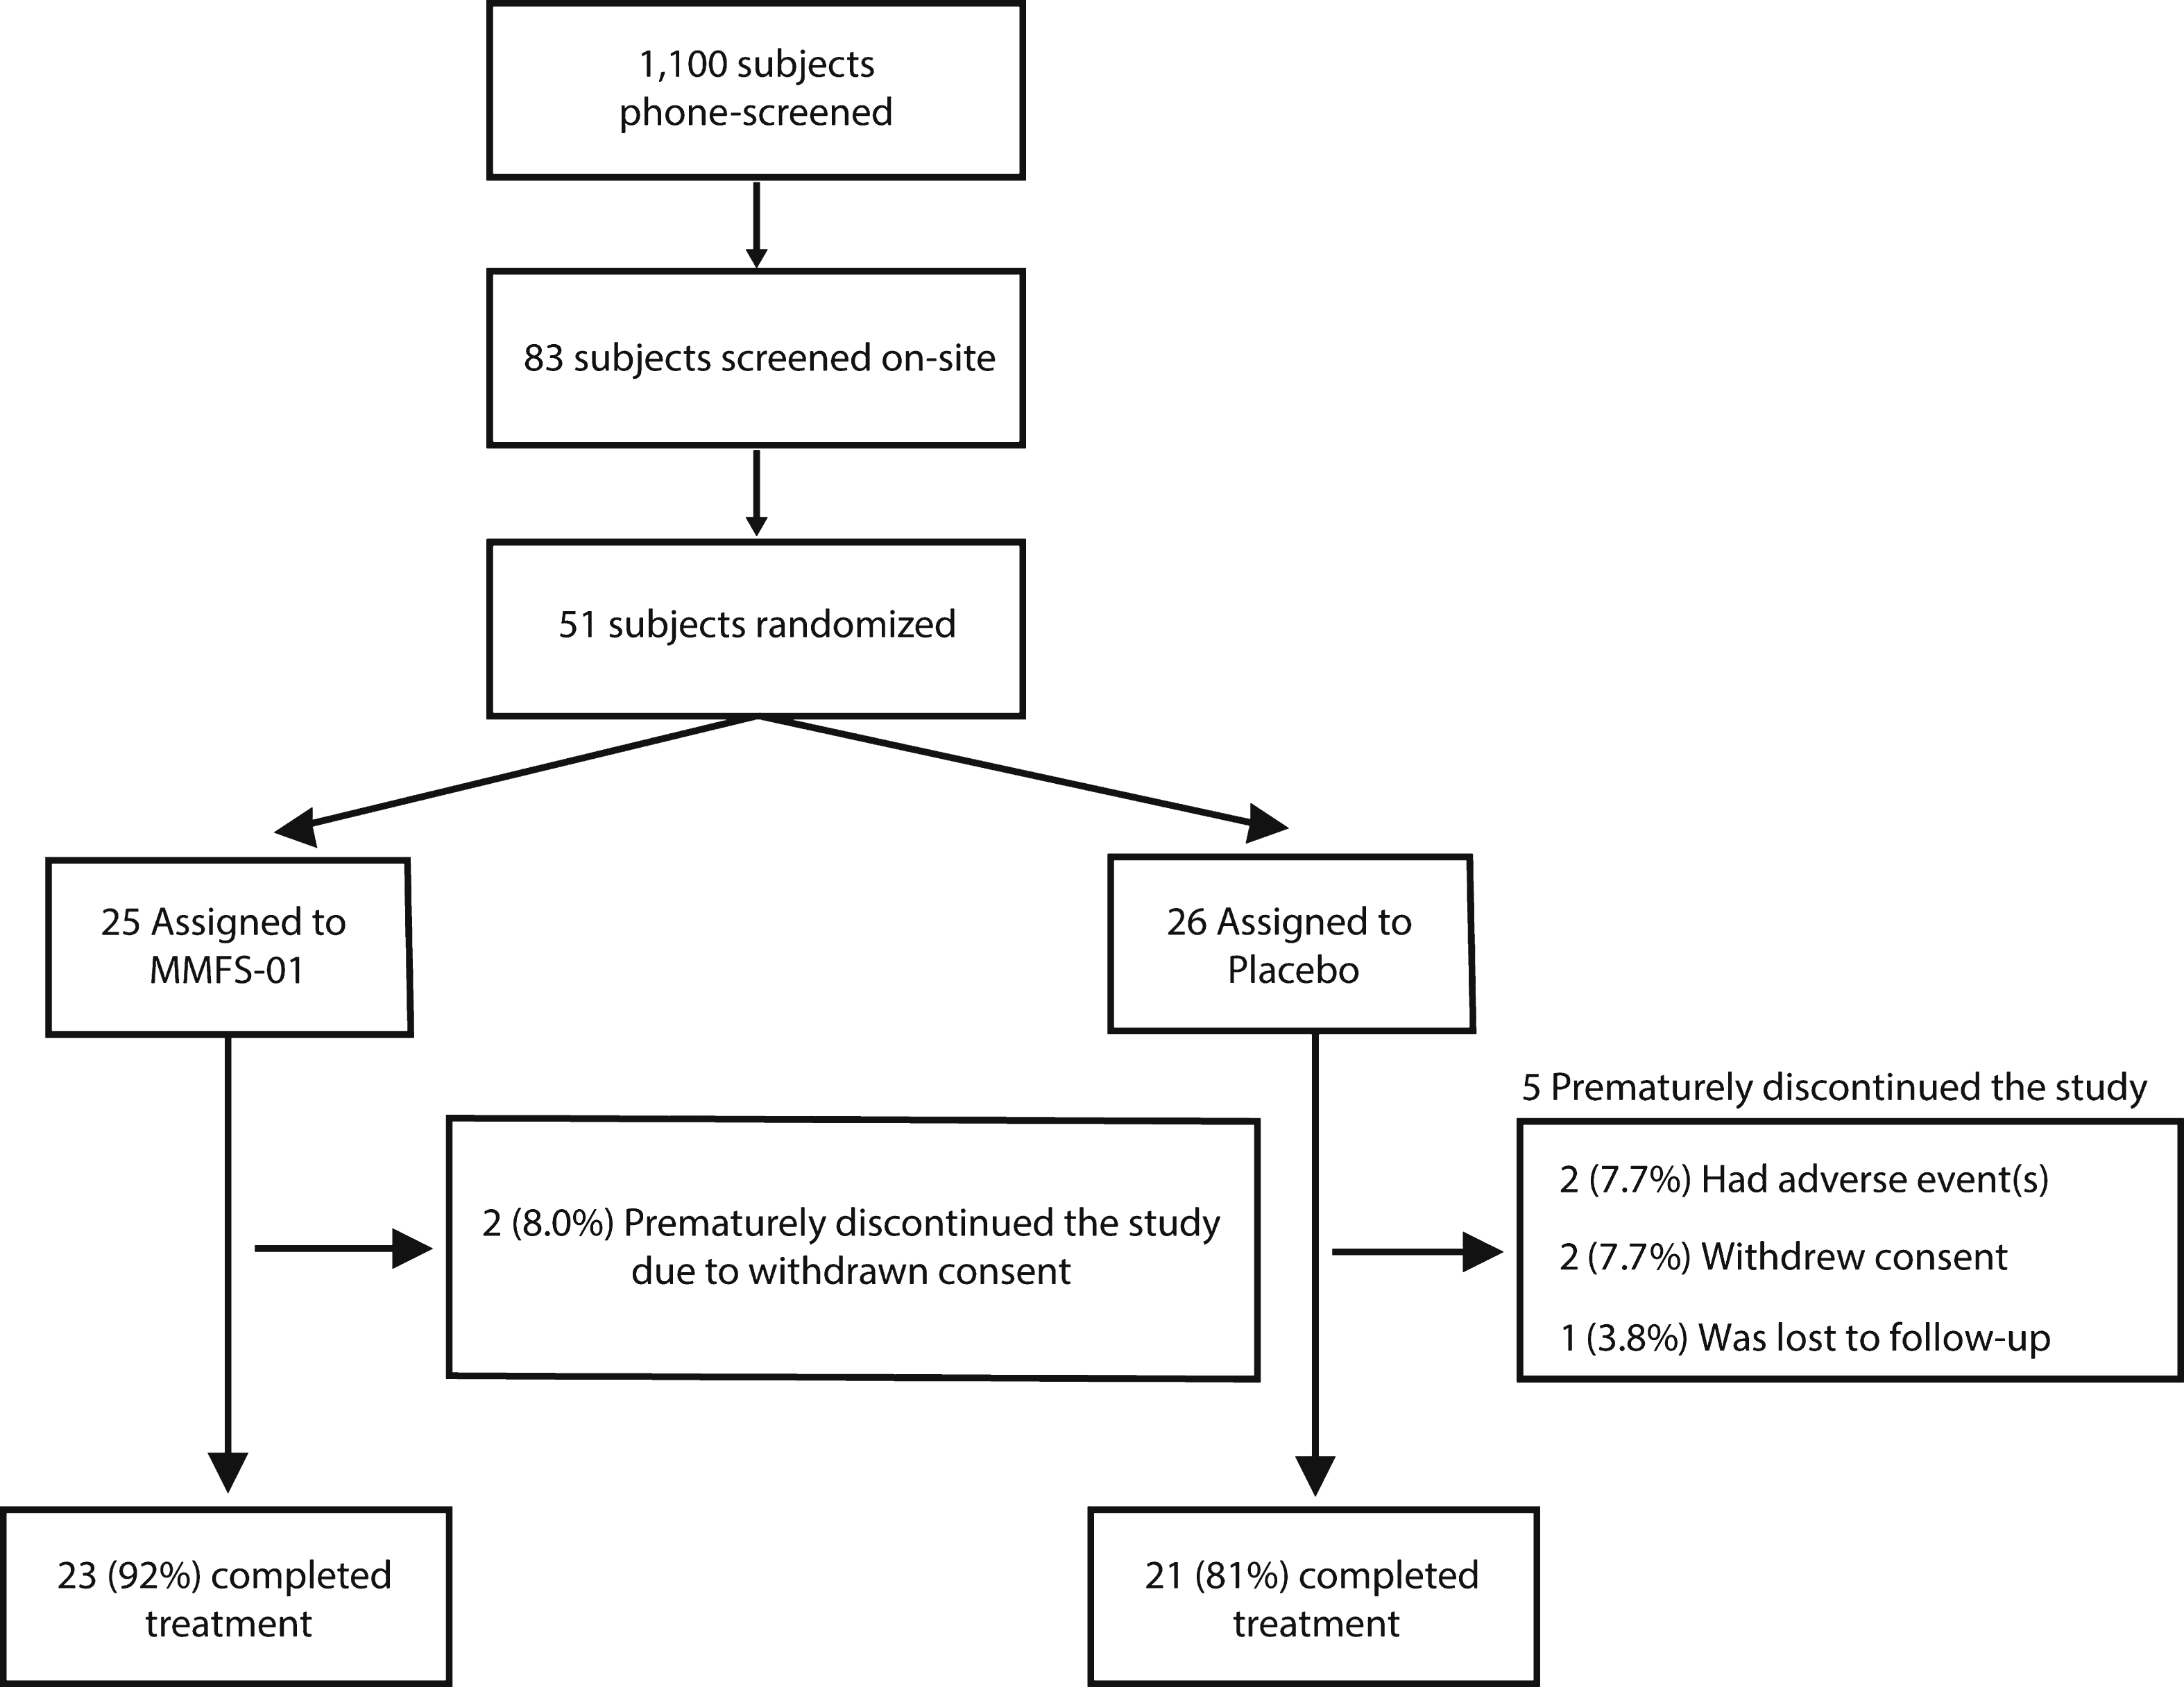
Fig.2
Cognitive endpoints for MMFS-01 and placebo. Change from baseline (dashed line) was evaluated at Week 6 and Week 12 for MMFS-01 (red line) and placebo (black line) treated groups in four cognitive tests: TMT-B (A), DigitSpan (B), Flanker (C), and Face-Name (D). TMT-B is presented as speed (milliseconds) to complete 25 circle connections, DigitSpan as the number of consecutive numbers (consec. #s) repeated without error, Flanker as the opposite of the difference between Congruent time and Incongruent time –1 (IC-C) in seconds, and Face-Name as relative d’ score. The opposite of change in IC-C is shown to illustrate positive change for improvement in the task. Overall cognitive ability (composite score) is the average of the z scores (
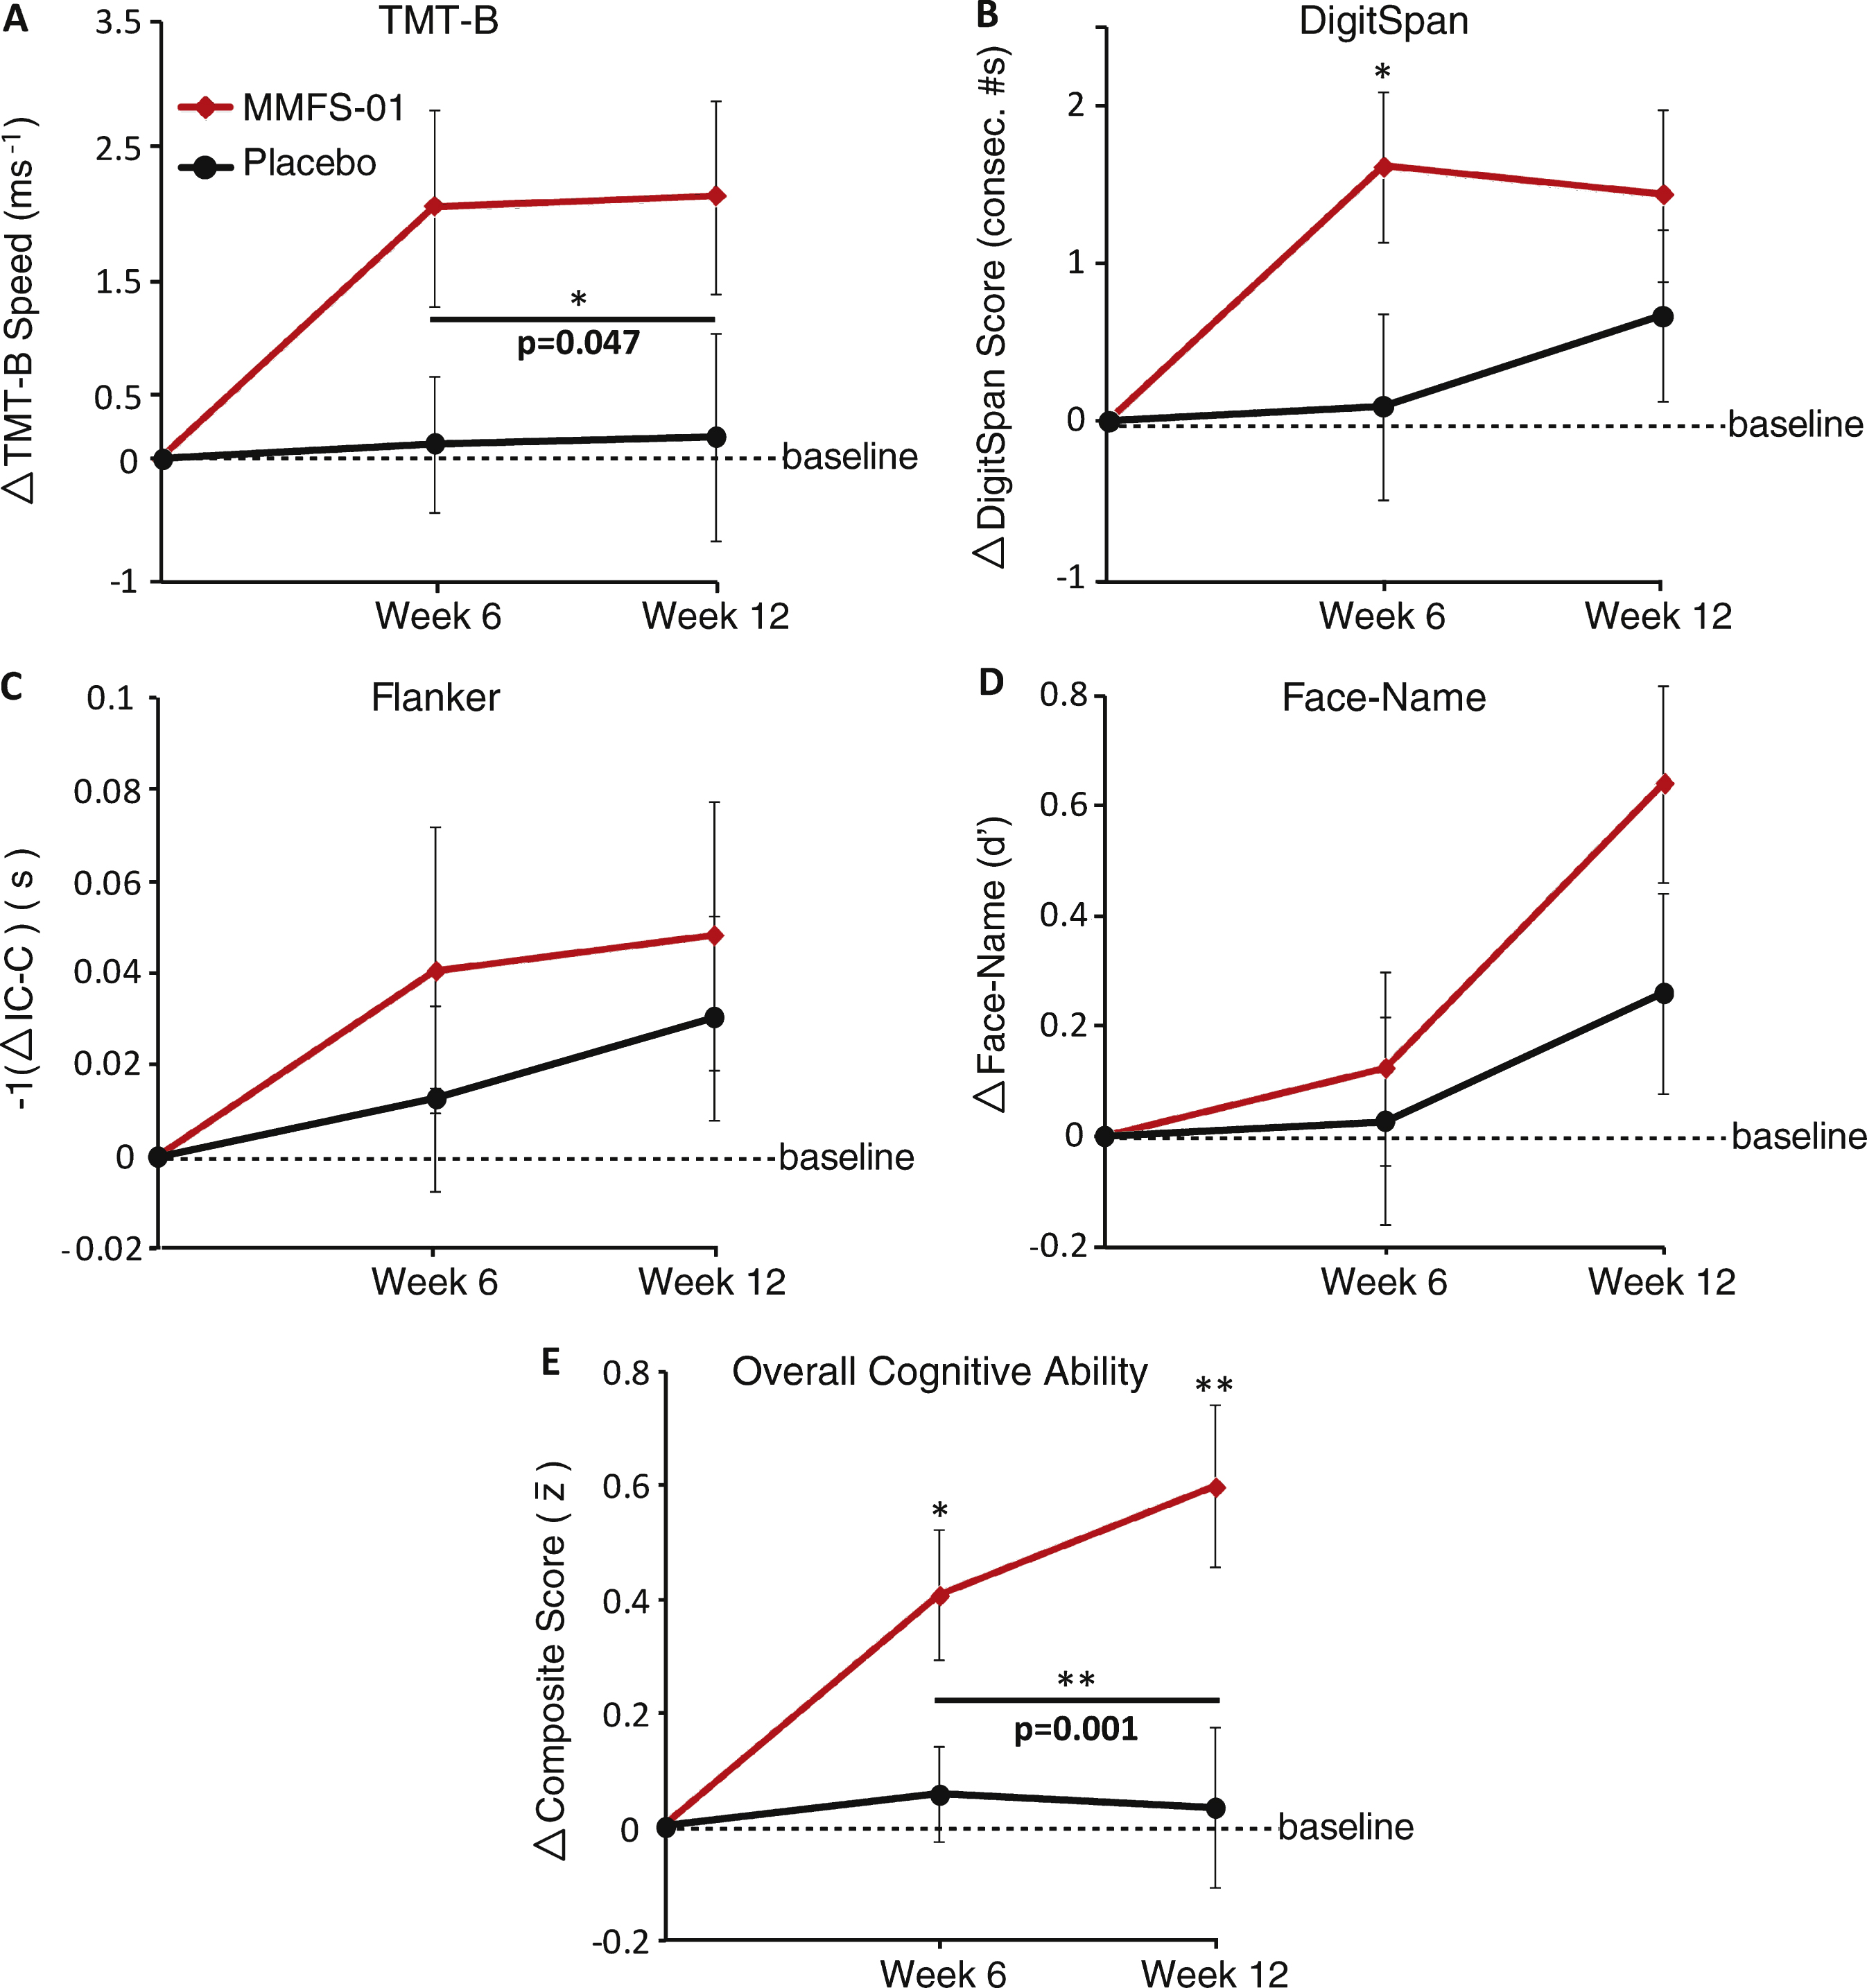
Fig.3
Analysis of composite score fluctuation. A–D) Individual subject change from baseline composite score at Week 6 and Week 12. Each arrow represents an individual subject, ordered as subject number determined by the order in which each enrolled in the study. Green arrows indicate an increase from baseline in composite score and red arrows indicate a decrease from baseline in composite score. E) Change in composite score from Week 6 to Week 12 for each subject. Bars indicate range of data. Only subjects in the MMFS-01 group who had a positive composite score at Week 6 were included in the “Responders only” group (far right). F, G) Correlations (R) were determined between the percent change of RBC intracellular magnesium concentration and the change from baseline in composite score at Week 12 for placebo treated (F) and MMFS-01 treated (G) subjects. H, I) Correlations (R) were also determined between the baseline composite score and the change from baseline in composite score at Week 12 for placebo treated (H) and MMFS-01 treated (I) subjects. To eliminate contribution to the correlation from other factors, either percent change of RBC intracellular magnesium concentration or baseline composite score was controlled for while calculating each correlation. These correlations (not graphed) are denoted as R’.
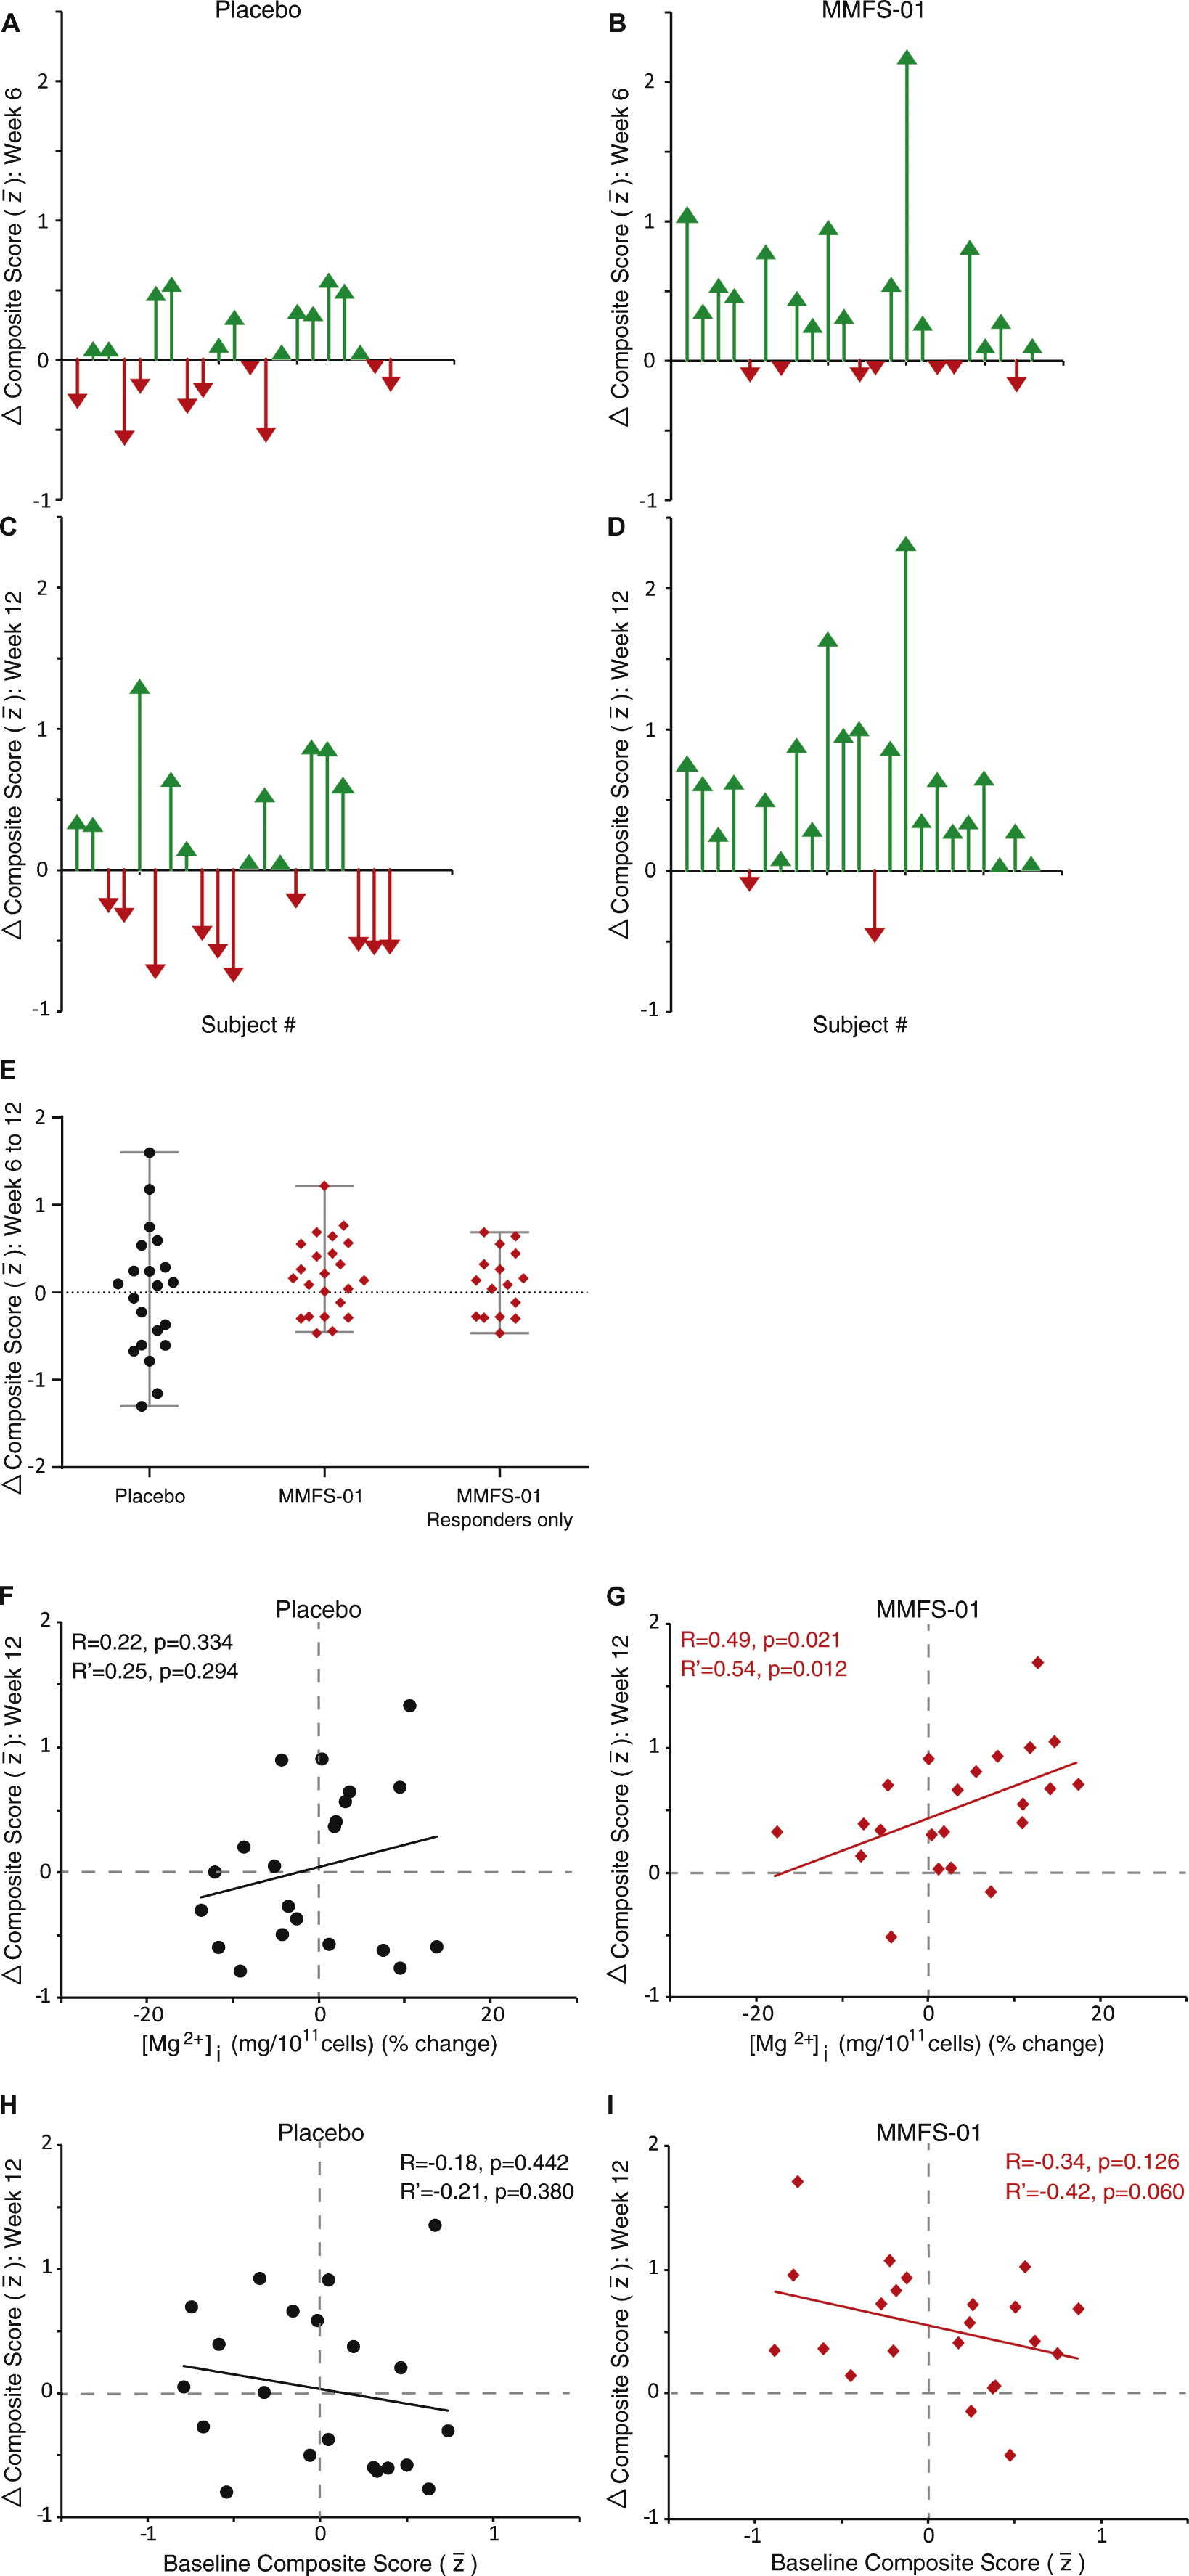
Fig.4
Reversal of executive function deficits in MMFS-01 treated subjects. A) Average TMT-B time was compared to age-matched normative data [44]. B) Relationship between age and normalized TMT-B speed (percent normalized to peak speed; 100% = 18–24 age group) was graphed from normative data (ages 18–89 separated in 11 different age groups). TMT-B speed declines linearly (R = –0.99, p = 10–8) at a rate of 1.04% per year (black line). Shown on the graph are the location where TMT-B speed corresponds to the average actual age of all subjects in the study (blue arrow), the initial brain age of subjects in the MMFS-01 group (red arrow), and the brain age of subjects following 12 weeks of MMFS-01 treatment (green arrow). The average impairment in brain age of the subjects at the beginning of the trial, relative to age-matched controls from the normative data set, is depicted along the linear trendline (red line). The area of the graph corresponding to the age range of subjects in the study (50–70 years) is enlarged in the inset. C) Change in brain age from baseline for each subject in the MMFS-01 group at Week 6 (top right panel) and Week 12 (bottom right panel) and placebo group at Week 6 (top left panel) and Week 12 (bottom left panel). Each arrow indicates an individual subject, ordered as subject number determined by the order in which each enrolled in the study. Green arrows indicate brain age improvement and red arrows indicate brain age decline relative to baseline. The average brain age improvement is indicated by a dashed line.
![Reversal of executive function deficits in MMFS-01 treated subjects. A) Average TMT-B time was compared to age-matched normative data [44]. B) Relationship between age and normalized TMT-B speed (percent normalized to peak speed; 100% = 18–24 age group) was graphed from normative data (ages 18–89 separated in 11 different age groups). TMT-B speed declines linearly (R = –0.99, p = 10–8) at a rate of 1.04% per year (black line). Shown on the graph are the location where TMT-B speed corresponds to the average actual age of all subjects in the study (blue arrow), the initial brain age of subjects in the MMFS-01 group (red arrow), and the brain age of subjects following 12 weeks of MMFS-01 treatment (green arrow). The average impairment in brain age of the subjects at the beginning of the trial, relative to age-matched controls from the normative data set, is depicted along the linear trendline (red line). The area of the graph corresponding to the age range of subjects in the study (50–70 years) is enlarged in the inset. C) Change in brain age from baseline for each subject in the MMFS-01 group at Week 6 (top right panel) and Week 12 (bottom right panel) and placebo group at Week 6 (top left panel) and Week 12 (bottom left panel). Each arrow indicates an individual subject, ordered as subject number determined by the order in which each enrolled in the study. Green arrows indicate brain age improvement and red arrows indicate brain age decline relative to baseline. The average brain age improvement is indicated by a dashed line.](https://content.iospress.com:443/media/jad/2016/49-4/jad-49-4-jad150538/jad-49-jad150538-g004.jpg)
Table 1
Baseline characteristics according to treatment group
| Characteristic | Placebo (n = 26) | MMFS-01 (n = 25) |
| Age - y ± SD | 57.6 ± 4.4 | 57.1 ± 6.0 |
| Gender - no. (%) | ||
| Male | 8 (31%) | 7 (28%) |
| Female | 18 (69%) | 18 (72%) |
| Ethnicity - no. (%) | ||
| Hispanic | 25 (96%) | 22 (88%) |
| Non-Hispanic | 1 (4%) | 3 (12%) |
| Race - no (%) | ||
| African-American | 3 (12%) | 2 (8%) |
| Caucasian | 23 (88%) | 23 (92%) |
| Medical History - no. (%) | ||
| Cardiovascular | 10 (38%) | 9 (36%) |
| Dermatological | 0 (0%) | 3 (12%) |
| Ears/Nose/Throat/Mouth/Eyes | 6 (23%) | 6 (24%) |
| Endocrine/Metabolic | 7 (27%) | 5 (20%) |
| Gastrointestinal | 14 (54%) | 11 (44%) |
| Musculoskeletal | 8 (31%) | 12 (48%) |
| Neurological | 10 (38%) | 11 (44%) |
| Renal/Genitourinary | 1 (4%) | 5 (20%) |
| CNS Medication - no. (%) | 0 (0%) | 0 (0%) |
| Height - cm ± SD | 159.7 ± 9.7 | 161.0 ± 9.1 |
| Weight - kg ± SD | 73.2 ± 12.9 | 73.1 ± 10.4 |
| MMSE Score ± SD | 28.2 ± 1.3 | 27.8 ± 1.6 |
Table 2
Change from baseline in physiological measures
| Week 6 | Week 12 | ||||||
| Endpoint | Baseline Score | change from baseline | p value (between groups) | change from baseline | p value (between groups) | Total Treatment p value | |
| Physiological | |||||||
| Mg2 + Urine (mg/ml) | |||||||
| MMFS-01 | 0.061 ± 0.003 | 0.026 ± 0.007 | 0.140 | 0.025 ± 0.007 | 0.048* | 0.027* | |
| Placebo | 0.062 ± 0.006 | 0.012 ± 0.006 | 0.005 ± 0.007 | ||||
| [Mg2 +] Plasma (mg/dL) | |||||||
| MMFS-01 | 2.04 ± 0.033 | 0.100 ± 0.032 | 0.026* | 0.065 ± 0.030 | 0.808 | 0.119 | |
| Placebo | 2.06 ± 0.041 | –0.002 ± 0.043 | 0.052 ± 0.035 | ||||
| [Mg2 +]i RBC (mg/1011 cells) | |||||||
| MMFS-01 | 1.15 ± 0.038 | 0.003 ± 0.026 | 0.217 | 0.032 ± 0.023 | 0.262 | 0.829 | |
| Placebo | 1.19 ± 0.035 | 0.049 ± 0.026 | –0.009 ± 0.021 | ||||
Mean ± SEM. *significant p < 0.05.
Table 3
Change from baseline in cognitive measures
| Week 6 | Week 12 | |||||||
| Endpoint | Baseline Score (Mean ± SEM) | change from baseline | p value (between groups) | Effect Size Cohen’s d (95% C.I.) | change from baseline | p value (between groups) | Effect Size Cohen’s d (95% C.I.) | Total Treatment p value |
| Cognitive TMT-B (ms–1) | ||||||||
| MMFS-01 | 10.6 ± 1.0 | 2.0 ± 0.8 | 0.066 | 0.58 (–0.03–1.17) | 2.1 ± 0.8 | 0.116 | 0.51 (–0.10–1.10) | 0.047* |
| Placebo | 11.2 ± 0.9 | 0.1 ± 0.5 | 0.2 ± 0.8 | |||||
| DigitSpan (consecutive #s) | ||||||||
| MMFS-01 | 11.52 ± 0.59 | 1.61 ± 0.48 | 0.023* | 0.61 (–0.01–1.20) | 1.43 ± 0.55 | 0.225 | 0.30 (–0.3–0.89) | 0.064 |
| Placebo | 11.05 ± 0.50 | 0.10 ± 0.59 | 0.67 ± 0.54 | |||||
| Flanker: –1(Incongruent - Congruent) (s) | ||||||||
| MMFS-01 | 0.13 ± 0.03 | 0.04 ± 0.03 | 0.964 | 0.27 (–0.89–0.35) | 0.05 ± 0.03 | 0.440 | 0.15 (–0.76–0.47) | 0.660 |
| Placebo | 0.09 ± 0.02 | 0.01 ± 0.02 | 0.03 ± 0.02 | |||||
| Face-Name (d’) | ||||||||
| MMFS-01 | 1.70 ± 0.14 | 0.12 ± 0.16 | 0.484 | 0.10 (–0.51–0.72) | 0.64 ± 0.19 | 0.089 | 0.44 (–0.18–1.05) | 0.103 |
| Placebo | 1.57 ± 0.14 | 0.04 ± 0.18 | 0.25 ± 0.19 | |||||
| Overall Cognitive Ability ( | ||||||||
| MMFS-01 | –0.025 ± 0.12 | 0.41 ± 0.12 | 0.017* | 0.74 (0.12–1.34) | 0.60 ± 0.13 | 0.003** | 0.91 (0.27–1.51) | 0.001** |
| Placebo | –0.002 ± 0.11 | 0.06 ± 0.08 | 0.03 ± 0.14 | |||||
Mean ± SEM. *significant p < 0.05. **significant p < 0.01.
Table 4
Change from baseline in emotional and sleep measures
| Week 6 | Week 12 | ||||||
| Endpoint | Baseline Score | change from baseline | p value (change from baseline) | p value (between group difference) | change from baseline | p value (change from baseline) | p value (between group difference) |
| Emotional | |||||||
| HAM-A | |||||||
| MMFS-01 | 17.1 ± 3.0 | –6.3 ± 3.6 | <0.001*** | 0.876 | –7.3 ± 5.8 | <0.001*** | 0.396 |
| Placebo | 17.2 ± 2.5 | –6.1 ± 3.4 | <0.001*** | –8.6 ± 4.1 | <0.001*** | ||
| PANAS: Positive Affect | |||||||
| MMFS-01 | 28.3 ± 6.6 | 4.7 ± 5.2 | <0.001*** | 0.648 | 3.9 ± 7.0 | 0.014* | 0.596 |
| Placebo | 27.7 ± 8.1 | 3.8 ± 8.1 | 0.046* | 5.1 ± 8.2 | 0.01* | ||
| PANAS: Negative Affect | |||||||
| MMFS-01 | 24.8 ± 6.4 | –7.6 ± 7.5 | <0.001*** | 0.556 | –8.3 ± 8.9 | 0.001** | 0.371 |
| Placebo | 23.9 ± 6.0 | –6.3 ± 5.9 | <0.001*** | –6.4 ± 9.0 | 0.008** | ||
| Sleep | |||||||
| PSQI | |||||||
| MMFS-01 | 13.7 ± 2.6 | –4.2 ± 3.8 | <0.001*** | 0.415 | –4.8 ± 4.5 | <0.001*** | 0.279 |
| Placebo | 12.9 ± 2.4 | –3.2 ± 3.7 | <0.001*** | –6.1 ± 3.3 | <0.001*** | ||
Mean ± SEM. *significant p < 0.05. **significant p < 0.01. ***significant p < 0.001.
Table 5
All adverse events observed in the study
| Adverse Event | # of Events | # of Subjects | ||
| MMFS-01 (n = 25) | Placebo (n = 26) | MMFS-01 (n = 25) | Placebo (n = 26) | |
| Gastrointestinal disorders | 5 | 6 | 5 | 4 |
| General disorders and administration site conditions | 0 | 2 | 0 | 2 |
| infections and infestations | 4 | 7 | 4 | 6 |
| injury, poisoning and procedural complications | 0 | 1 | 0 | 1 |
| Musculoskeletal and connective tissue disorders | 3 | 0 | 3 | 0 |
| Nervous system disorders | 1 | 7 | 1 | 5 |
| Psychiatric disorders | 1 | 3 | 1 | 3 |
| Respiratory, thoracic and mediastinal disorders | 2 | 2 | 2 | 1 |
| Skin and subcutaneous tissue disorders | 0 | 1 | 0 | 1 |
| Surgical and medical procedures | 0 | 1 | 0 | 1 |
| Vascular disorders | 1 | 0 | 1 | 0 |
| All Organ Systems | 17 | 30 | 13 | 15 |


