
Diffusion Kurtosis Imaging: A Possible MRI Biomarker for AD Diagnosis?
Abstract
The purpose of this explorative study was to investigate whether diffusion tensor imaging (DTI) and diffusion kurtosis imaging (DKI) parameter changes are reliable measures of white matter integrity changes in Alzheimer’s disease (AD) patients using a whole brain voxel-based analysis (VBA). Therefore, age- and gender-matched patients with mild cognitive impairment (MCI) due to AD (n = 18), dementia due to AD (n = 19), and age-matched cognitively healthy controls (n = 14) were prospectively included. The magnetic resonance imaging protocol included routine structural brain imaging and DKI. Datasets were transformed to a population-specific atlas space. Groups were compared using VBA. Differences in diffusion and mean kurtosis measures between MCI and AD patients and controls were shown, and were mainly found in the splenium of the corpus callosum and the corona radiata. Hence, DTI and DKI parameter changes are suggestive of white matter changes in AD.
INTRODUCTION
Structural and functional disruptions in the relationship between anatomically distinct brain regions occur in patients with dementia, supporting the notion of a disconnection syndrome [1, 2]. Brain connectivity can be studied by means of advanced diffusion magnetic resonance imaging (MRI) techniques, and could serve as a potential biomarker for early Alzheimer’s disease (AD) diagnosis.
Recent advancements in MRI provide an insight into the major white matter (WM) bundles in the brain, using diffusion tensor imaging (DTI). DTI, which is sensitive to the Brownian motion of water, enables the measurement of restricted and/or hindered movement of water molecules as they diffuse in the brain. Due to the highly organized nature of the WM, the main diffusion orientation will generally coincide with the orientation of the axons in this tissue. Therefore, DTI can characterize the orientation and integrity of WM fibers [3, 4]. Increased mean diffusivity (MD) and decreased fractional anisotropy (FA) have been found in mild cognitive impairment (MCI) and AD dementia as compared to controls [5]. The differences between MCI and controls are similar to those found between AD and controls, although fewer regions reached statistical significance [5]. In addition, a correlation between cognitive decline and reduced FA and increased MD has been demonstrated in AD [6].
DTI has limitations with respect to quantitative analysis as well as to qualitative fiber tractography [7, 8]. Despite the high sensitivity of DTI to detect WM damage, its specificity to discriminate between different micro-structural WM changes and between different brain disorders remains relatively low [9]. Therefore, diffusion kurtosis imaging (DKI) was introduced [10]. Based on the estimation of non-Gaussian diffusion, DKI parameters can be calculated. In addition, by estimating Gaussian and non-Gaussian diffusion, more accurate DTI parameters can be obtained [11]. A growing list of publications reported the ability of DKI to provide additional sensitive parameters, such as mean kurtosis (MK), radial kurtosis, axial kurtosis, and fractional kurtosis anisotropy, to detect developmental and pathological changes in neural tissues, as compared to conventional DTI [12–14]. There is evidence that the kurtosis parameters are good probes for the presence of membranes and other barriers and that they are sensitive for detecting changes in permeability [10, 15]. Therefore, DKI may reveal new insights in the physiology of cells during pathological states and may be useful for investigating abnormalities in tissues with isotropic structure in which techniques such as DTI are less useful [16].
A recent study, using manual region-of-interest (ROI) analysis, has shown decreased radial kurtosis and MK in the WM of the parietal lobe in AD as compared to MCI [17]. Another study, also using manual ROI analysis, found decreased MK, radial and axial kurtosis values in specific brain regions in AD as compared to controls. Comparing MCI and controls, fewer regions reached statistical significance [18].
As DKI provides an insight into structural connectivity changes, this potential and non-invasive biomarker reflects a different pathophysiological aspect of AD as compared to the existing cerebrospinal fluid (CSF) biochemical markers that reflect the neuropathological state of AD and might not only improve diagnostic accuracy for early AD but could also have a predictive value with regard to disease progression. This explorative study aimed at evaluating whether DTI and DKI parameter changes are measures of WM integrity changes in AD patients using a whole brain voxel-based analysis (VBA).
MATERIALS AND METHODS
Study population
Patients with MCI due to AD (n = 18) and dementia due to AD (n = 19) were prospectively recruited. In addition, cognitively healthy controls (n = 14) were prospectively included. All groups were age- and gender-matched. Patients with MCI due to AD and dementia due to AD were diagnosed according to the NIA-AA research criteria, with at least intermediate probability of AD etiology (based on DNA analysis, CSF biomarkers, and/or hippocampal atrophy (HCA) on MRI) [19, 20]. MCI due to AD and dementia due to AD will hereafter be referred to as ‘MCI’ and ‘AD’, respectively. The study was approved by the local ethics committee, and all subjects gave written informed consent.
Visual rating of HCA, analysis of CSF biomarkers (in consented MCI and AD patients who had no contra-indication for lumbar puncture), and DNA analysis contributed to the characterization of the study population as all MCI and AD patients had at least one positive AD biomarker, and thus fulfilled the NIA-AA research criteria for MCI due to AD and dementia due to AD. In addition, for population description purposes the SNPs in apolipoprotein E (APOE) (rs429358 and rs7412, determining the ɛ2/ɛ3/ɛ4 polymorphism) were genotyped by Sanger sequencing starting from genomic DNA isolated from lympohocytes.
Mini-Mental State Examination (MMSE) scores were only considered when the time lapse between MMSE and MRI scan was equal to or less than three months (AD n = 13; MCI n = 10). All control subjects underwent a Montreal Cognitive Assessment (MoCA) test to rule out cognitive decline and met the following criteria: (1) no neurological or psychiatric history and (2) no organic disease involving the central nervous system. HVA was also visually rated in the control population.
Image acquisition
All MRI data were acquired with a 3T MRI scanner with a 32-channel head coil (Siemens Trio, Erlangen, Germany). Imaging acquisition was performed in all patients and controls. A multi-slice, single-shot EPI, spin echo sequence (TR/TE = 7700/139 ms) was used to obtain 40 axial slices without slice gap and 2.2 mm nominal isotropic resolution (FOV = 220×220 mm). Diffusion weighting was applied according to an optimized diffusion gradient encoding scheme that consisted of 25, 40, and 75 diffusion weighted gradients, isotropically distributed over three shells with b = 700, 1000, 2800 s/mm2 respectively. In addition, 10 non-diffusion weighted images (b0) were acquired. The acquisition time was 16 min.
Image processing
Motion correction was performed by aligning all diffusion-weighted images with an affine transformation to the non-diffusion-weighted image. Thereafter, a b-matrix rotation was performed, to ensure that the orientation information of the diffusion tensors is correct in each voxel [21].
The diffusion and kurtosis tensors were then calculated using the DKI model [11] in every voxel using a weighted linear least squares method with well-chosen weights to obtain a bias free estimation [11, 22, 23]. Subsequently, the FA, MD, and MK quantitative maps were calculated. The following steps were included in the processing pipeline to construct an atlas and align all subject data in the same atlas space:
1. All DTI data sets were transformed to the FA map of a randomly selected subject with an affine transformation using Multimodality Image Registration using Information Theory based on the FA maps [24].
2. A population specific DTI atlas was constructed from these affinely aligned data sets [25, 26]. This atlas was made from the 51 data sets, and thus represents an average brain of the AD, MCI, and healthy subjects. As the tensor information is present in the atlas, it can be used to drive the non-affine registration of the following step, resulting in a highly accurate image registration result.
3. The affinely coregistered data sets were transformed to the population-specific atlas using a viscous fluid based non-rigid coregistration algorithm that was adopted to include all tensor information during the iterative alignment procedure [27, 28]. The preservation of principal direction tensor reorientation strategy was thereby incorporated [29].
4. Both the affine and non-affine deformation fields were then applied to all original quantitative maps, in order to align them in the same population-specific atlas space.
5. All aligned images were smoothed by an adaptive, anisotropic smoothing kernel (FWHM = 6 mm) [30]. This spatially dependent, anisotropic kernel was estimated from the FA maps and subsequently applied to the FA and MD images.
Hippocampal atrophy rating
HCA of all participants was visually rated according to the Scheltens methodology [31] on coronal reconstructions of the DICOM MPR images perpendicular to the temporal lobes by using the Osirix program on a 23-inch monitor. First, two researchers experienced with HCA rating (MDB and FDB) rated all images separately, blinded for diagnosis, before rating together to reach a consensus on divergent rates. The consensus rates were used in this study.
CSF sampling and CSF biomarker analysis
Lumbar puncture and CSF sampling and handling have been performed according to a standard protocol [32, 33]. CSF samples were stored at –80°C until analysis. CSF biomarker analyses of amyloid-β of 42 amino acids (Aβ1 - 42), total tau protein (T-tau), and tau phosphorylated at threonine 181 (P-tau181P) were performed using commercially available single parameter ELISA kits (INNOTEST ®, Fujirebio Europe, Ghent, Belgium) as described previously [32, 33]. A CSF biomarker profile was considered pathological and suggestive for AD if a subject displayed a low CSF Aβ1 - 42 value in combination with an increased T-tau and/or increased P-tau181P value [34]. In our lab, normal values are: Aβ1 - 42 > 638.5 pg/mL, T-tau < 296.5 pg/mL, and P-tau181P < 56.5 pg/mL. These cutpoints have been determined in autopsy-confirmed AD patients as compared to cognitively healthy elderly [35].
Statistical analysis
Voxel-wise independent sample t-tests were performed using SPM8 software (http://www.fil.ion.ucl.ac.uk/spm/software/spm8/) to evaluate FA, MK, and MD differences between the groups. For the latter, uncorrected p < 0.001 results for at least 20 consecutive voxels are thereby reported. By ‘consecutive’ we mean that only clusters with a size larger than the threshold (all connected voxels) were included. In order to reduce the number of statistical tests, statistical analysis was only performed within a WM mask that was created by selecting voxels with an FA >0.2 in the created atlas FA image, to limit the analysis to relevant WM. For the following tests SPSS Statistics 20 (IBM, Armonk, NY, USA) was used. Independent sample t-tests were used to compare age between all the groups and MMSE scores between AD and MCI. A Chi-Square test was performed to compare gender distribution across the groups. In order to compare HCA and the presence of APOE ɛ4 alleles between the groups Mann-Whitney U-tests were used, as both variables were not normally distributed.
RESULTS
Study population
The demographic, clinical and biomarker characteristics are presented in Table 1.
Biomarker data: Results from DNA analysis, HCA ratings, and CSF biomarkers (Table 1)
Lumbar puncture was performed in 15 MCI patients and in 11 AD patients. The levels of Aβ1 - 42, T-tau, and P-tau181P did not differ significantly between these two groups (Aβ1 - 42: p = 0.509; T-tau: p = 0.194; P-tau181P: p = 0.060).
HCA was rated in all subjects and did not differ significantly between the MCI and AD groups (AD versus MCI: p = 0.602). However, the difference was significant between the AD and cognitively healthy control groups as well as between the MCI and control groups (AD versus controls: p = 0.002; MCI versus controls: p = 0.003).
All patients had biomarker evidence for AD, either based on AD CSF biomarkers and/or on HCA through visual rating of hippocampal volume. One subject did not display HCA but this subject’s AD CSF biomarker profile was suggestive for AD (low CSF Aβ1 - 42 value in combination with an increased T-tau and/or increased P-tau181P value). All other subjects displayed hippocampal atrophy, including 11 subjects in whom CSF biomarkers were not available and 12 subjects in whom the CSF biomarkers did not completely fulfill the criteria. Of these latter 12 subjects, two had a completely normal CSF biomarker profile whereas some had normal Aβ1 - 42 values (n = 7) or normal tau values (n = 3).
One of the MCI patients carried an APP Val717Gly mutation. This patient presented with hippocampal atrophy and a CSF biomarker profile that was characteristic for AD (Aβ1 - 42 = 334 pg/mL; T-tau = 680 pg/mL; P-tau181P = 82 pg/mL).
Correlation analyses between the DKI parameters and HCA and MMSE scores showed no significant results.
AD versus controls
In the following three sections, statistical results are displayed on different axial slices (Figs. 1–3).
Figure 1A displays the regions with decreased FA in AD patients as compared with controls, showing differences in the cerebellar peduncles, inferior longitudinal fasciculus, cingulum, and body and splenium of the corpus callosum.
Following regions showed significantly increased MD in AD in contrast with controls: cerebellar peduncles, inferior longitudinal fasciculus, superior longitudinal fasciculus, cingulum, forceps major, corona radiate and genu, body and splenium of the corpus callosum (Fig. 1B).
Many regions showed significantly decreased MK comparing AD and controls (Fig. 1C): cerebellar peduncles, inferior longitudinal fasciculus, uncinate fasciculus, corticospinal tract, corona radiate and genu, body and splenium of the corpus callosum.
MCI versus controls
FA was decreased and MD increased in MCI as compared with controls in the splenium of the corpus callosum, as shown in Figs. 2A and 2B.
Decreased MK in MCI in contrast with controls was shown in the splenium of the corpus callosum and the corona radiate (Fig. 2C).
DISCUSSION
In this explorative study, diffusion tensor and kurtosis measures were compared between MCI and AD patients and controls. The study’s novelty is the fact that DKI, an innovative MRI technique, is used as well as that the group-wise comparisons are performed with VBA. Moreover, the patient population was thoroughly characterized and all MCI and AD diagnoses were biomarker based according to the NIA-AA research criteria for AD. Twelve patients represented with conflicting AD biomarkers. However, the CSF concentration of Aβ1 - 40 was not analyzed in this study, which would probably increase the number of patients with characteristic AD biomarker profiles [36–39].
Using VBA, one of the major assets of the study, DTI and DKI parameters were analyzed at the voxel level in the whole brain. This allows for an explorative analysis, as no hypothesis should be made regarding the spatial location of the expected differences. In addition, since no regions have to be outlined manually, this analysis approach is observer-independent. Additionally, ROI analysis is labor-intensive and time-consuming, as 3D structures need to be delineated by 2D ROIs on different slices. Finally, a clear hypothesis on the location of expected diffusion differences is needed in the ROI analysis approach [40].
The reliability of VBA results depends on the accuracy of the image registration, which is especially challenging in patients with AD because performing a voxel-based diffusion MRI analysis on elderly subjects, and more specifically on AD patients, is very challenging, due to the presence of brain atrophy. Therefore, instead of performing image registration to a standard template, such as the MNI atlas, all data sets were aligned to a population-specific atlas constructed from the data in this study. Transforming data sets from elderly and especially AD patients to a standard healthy brain such as MNI introduces registration errors that will affect the results (even when higher order viscous fluid model based registrations were used). In this context, the atlas itself is only used as a ‘reference frame’ to which all data sets are registered. If it can be assumed that the registration itself of all the data to this atlas succeeds (which is an essential assumption in VBA, hence MNI was not used), similar results will be obtained, regardless the atlas used. In addition, to increase image registration accuracy, a high dimensional image registration algorithm based on the tensor information was used to align all data sets. However, partial volume effects between WM and gray matter cannot be completely excluded. After visual assessment of the image registration it was found that registration errors did not contribute to the observed findings.
The main differences in MK were found between AD and controls. Many brain regions showed significantly decreased MK in AD as compared to controls. Interestingly, only the splenium of the corpus callosum and the corona radiate were significantly different between MCI patients and controls. A recent study found extensive demyelination in the splenium and posterior corona radiate, measured by magnetization transfer imaging, in amnestic MCI patients. Moreover, the demyelination in the splenium and posterior corona radiate as well as in the superior longitudinal fasciculus was associated with episodic memory performance [41].
With regard to the splenium of the corpus callosum specifically, our results are in line with earlier findings of atrophy of the splenium in AD, MCI, and subjective cognitive impairment [42–44]. The splenium size at baseline correlates with MMSE change after 1-year follow-up in AD patients [43]. Furthermore, it was shown that annual tissue loss in the splenium is associated with progression to dementia. Subjects who progressed to dementia had more severe tissue loss in the splenium than subjects without progression at 3-year follow-up. This study, moreover, showed that more severe atrophy in the splenium was correlated with a lower MMSE score at 3-year follow-up [45]. A recent DTI review [46] suggested that high-risk for AD among cognitively healthy individuals was associated with WM integrity decline in tracts connecting GM structures associated with memory function, including the splenium of the corpus callosum.
With regard to the corona radiate, decreased FA in the corona radiate correlates to cognitive decline in multiple sclerosis [47], probably due to the corona radiate containing fibers linking the capsula interna to cortical areas.
Consistent with our results, earlier studies comparing MCI, AD, and controls also found decreased values of MK in MCI and AD [17, 18]. MK and radial kurtosis in the anterior corona radiate discriminated best between MCI and controls [18], which is in line with our results. Significantly decreased kurtosis parameters in the parietal and occipital lobes in AD as compared to MCI have been reported [17]. In contrast, our study did not find kurtosis differences between AD and MCI. This difference might be due to the different diagnostic criteria used. While this study used the NIA-AA biomarker-based research criteria [19, 20] for MCI and AD, Gong et al. [17] used clinical criteria for MCI. This heterogeneous MCI population will be more heterogeneous than the AD population. Moreover, both DKI studies [17, 18] conducted manual ROI analysis, whereas VBA was used in this study.
Regarding the DTI parameters, the differences in FA and MD were most pronounced between AD and controls. When comparing MCI to controls, only the splenium showed significantly decreased FA, while decreased FA was found in AD patients in many regions when compared to controls. Even more regions showed increased MD in AD patients compared to controls, while only the splenium was significantly different between MCI patients and controls. These results are partly consistent with earlier DTI studies reporting increased MD and decreased FA in MCI/AD as compared to controls [48–57].
Our results suggest that MD and MK are more sensitive compared to FA to detect differences between both MCI/AD and controls. This is in line with a meta-analysis [5] and a recent study comparing regional DTI measures in AD, MCI, and controls showing that FA was least sensitive to detect group differences [58]. In our study, MK seemed most sensitive to discriminate controls from MCI while MD was most sensitive to detect changes between MCI and AD. Additional studies including larger cohorts of subjects are needed to confirm these results. In addition, as DTI and DKI measures only provide an indirect characterization of microstructure, it would be interesting to apply biophysical models of the diffusion MRI signal to detect subtle microstructural changes of biological tissue more precisely. One such model is the WM model which relates DKI-derived metrics to WM microstructure [59]. This model has been applied to AD, amnestic MCI, and controls [60, 61] showing that WM tract integrity metrics are potential biomarkers for early AD and for disease progression.
This study has several limitations. First, only statistical results that were uncorrected for multiple comparisons were reported, as only very few voxels remained significantly different following correction for multiple comparisons. This can be explained by the relatively small population included and studies on larger groups are necessary to confirm these first findings. An additional limitation is inherent to VBA, such as the need for a perfect registration. However, by using a population-specific atlas of the subjectsstudied and a high dimensional registration algorithm based on tensor elements, we tried to ensure optimal image alignment. Finally, the number of patients is too limited to draw firm conclusions with regard to the use of DKI as a biomarker for MCI and AD. More and larger, prospective longitudinal studies are needed to further define the use of this potential biomarker and to investigate its benefit over other biomarkers.
CONCLUSIONS
Based on this explorative study, the results suggest that: 1) MD and MK are more sensitive than FA to discriminate MCI and AD from controls; 2) MK is most sensitive to discriminate MCI from controls; and 3) MD is most sensitive to discriminate MCI from AD.
We hypothesize that in WM structures and brain regions that are relevant for cognitive functioning, i.e., the splenium of the corpus callosum and the corona radiate, MK is most sensitive for detection of initial degeneration from the preclinical to MCI phase, and that further degeneration from MCI to AD is picked up by MD changes.
In conclusion, DTI and DKI parameter changes are suggestive of WM changes in AD. Independent and larger prospective studies are needed to evaluate whether these changes, and more specifically decreased kurtosis values in the splenium of the corpus callosum and the corona radiate could serve as a non-invasive MRI-based biomarker for early AD diagnosis.
ACKNOWLEDGMENTS
This work was in part supported by an unrestricted research grant from Janssen Pharmaceutica NV, Belgium; the Agency for Innovation by Scienceand Technology (IWT); the Antwerp University Research Fund; the Alzheimer Research Foundation (SAO-FRMA); the Institute Born-Bunge; the Research Foundation Flanders (FWO); the Belgian Science Policy Office Interuniversity Attraction Poles (IAP) program P7/16; the Flemish Government initiated Methusalem excellence program, Belgium; the Flemish Government initiated VIND program on networks for dementia research; and the EU/EFPIA Innovative Medicines Initiative Joint Undertaking (EMIF grant n° 115372). This work is part of the BIOMARKAPD project within the EU Joint Programme for Neurodegenerative Disease Research (JPND).
The authors acknowledge the assistance of Dr. S. Van der Mussele and Mrs. J. Luyckx (BIODEM, UAntwerp) as well as the clinical staff of the Department of Neurology and Memory Clinic of Hospital Network Antwerp (ZNA), Middelheim and Hoge Beuken, Antwerp, Belgium, the Genetic Service Facility (GSF) of the VIB Department of Molecular Genetics, as well as of the Department of Radiology, Antwerp University Hospital.
Authors’ disclosures available online (http://j-alz.com/manuscript-disclosures/15-0253r2).
References
1 | Morrison JH, Hof PR(2002) Selective vulnerability of corticocortical and hippocampal circuits in aging and Alzheimer’s diseaseProg Brain Res136: 467486 |
2 | Delbeuck X, Van der Linden M, Collette F(2003) Alzheimer’s disease as a disconnection syndrome?Neuropsychol Rev13: 7992 |
3 | Basser PJ, Mattiello J, LeBihan D(1994) MR diffusion tensor spectroscopy and imagingBiophys J66: 259267 |
4 | Beaulieu C(2002) The basis of anisotropic water diffusion in the nervous system - a technical reviewNMR Biomed15: 435455 |
5 | Clerx L, Visser PJ, Verhey F, Aalten P(2012) New MRI markers for Alzheimer’s disease: A meta-analysis of diffusion tensor imaging and a comparison with medial temporal lobe measurementsJ Alzheimers Dis29: 405429 |
6 | Fellgiebel A, Yakushev I(2011) Diffusion tensor imaging of the hippocampus in MCI and early Alzheimer’s diseaseJ Alzheimers Dis26: Suppl 3257262 |
7 | Abhinav K, Yeh FC, Pathak S, Suski V, Lacomis D, Friedlander RM, Fernandez-Miranda JC(2014) Advanced diffusion MRI fiber tracking in neurosurgical and neurodegenerative disorders and neuroanatomical studies: A reviewBiochim Biophys Acta1842: 22862297 |
8 | Wheeler-Kingshott CA, Cercignani M(2009) About “axial” and “radial” diffusivitiesMagn Reson Med61: 12551260 |
9 | Alexander AL, Lee JE, Lazar M, Field AS(2007) Diffusion tensor imaging of the brainNeurotherapeutics4: 316329 |
10 | Jensen JH, Helpern JA, Ramani A, Lu H, Kaczynski K(2005) Diffusional kurtosis imaging: The quantification of non-gaussian water diffusion by means of magnetic resonance imagingMagn Reson Med53: 14321440 |
11 | Veraart J, Poot DH, Van HW, Blockx I, Van der Linden A, Verhoye M, Sijbers J(2011) More accurate estimation of diffusion tensor parameters using diffusion Kurtosis imagingMagn Reson Med65: 138145 |
12 | Hui ES, Cheung MM, Qi L, Wu EX(2008) Towards better MR characterization of neural tissues using directional diffusion kurtosis analysisNeuroimage42: 122134 |
13 | Van Cauter S, Veraart J, Sijbers J, Peeters RR, Himmelreich U, De Keyzer F, Van Gool SW, Van Calenbergh F, De Vleeschouwer S, Van Hecke W, Sunaert S(2012) Gliomas: Diffusion kurtosis MR imaging in gradingRadiology263: 492501 |
14 | Vanhoutte G, Pereson S, Delgado YP, Guns PJ, Asselbergh B, Veraart J, Sijbers J, Verhoye M, Van BC, Van der Linden A(2013) Diffusion kurtosis imaging to detect amyloidosis in an APP/PS1 mouse model for Alzheimer’s diseaseMagn Reson Med69: 11151121 |
15 | Lu H, Jensen JH, Ramani A, Helpern JA(2006) Three-dimensional characterization of non-gaussian water diffusion in humans using diffusion kurtosis imagingNMR Biomed19: 236247 |
16 | Zhuo J, Xu S, Proctor JL, Mullins RJ, Simon JZ, Fiskum G, Gullapalli RP(2012) Diffusion kurtosis as an in vivo imaging marker for reactive astrogliosis in traumatic brain injuryNeuroimage59: 467477 |
17 | Gong NJ, Wong CS, Chan CC, Leung LM, Chu YC(2013) Correlations between microstructural alterations and severity of cognitive deficiency in Alzheimer’s disease and mild cognitive impairment: A diffusional kurtosis imaging studyMagn Reson Imaging31: 688694 |
18 | Falangola MF, Jensen JH, Tabesh A, Hu C, Deardorff RL, Babb JS, Ferris S, Helpern JA(2013) Non-Gaussian diffusion MRI assessment of brain microstructure in mild cognitive impairment and Alzheimer’s diseaseMagn Reson Imaging31: 840846 |
19 | Albert MS, DeKosky ST, Dickson D, Dubois B, Feldman HH, Fox NC, Gamst A, Holtzman DM, Jagust WJ, Petersen RC, Snyder PJ, Carrillo MC, Thies B, Phelps CH(2011) The diagnosis of mild cognitive impairment due to Alzheimer’s disease: Recommendations from the National Institute on Aging-Alzheimer’s Association workgroups on diagnostic guidelines for Alzheimer’s diseaseAlzheimers Dement7: 270279 |
20 | McKhann GM, Knopman DS, Chertkow H, Hyman BT, Jack CRJr, Kawas CH, Klunk WE, Koroshetz WJ, Manly JJ, Mayeux R, Mohs RC, Morris JC, Rossor MN, Scheltens P, Carrillo MC, Thies B, Weintraub S, Phelps CH(2011) The diagnosis of dementia due to Alzheimer’s disease: Recommendations from the National Institute on Aging-Alzheimer’s Association workgroups on diagnostic guidelines for Alzheimer’s diseaseAlzheimers Dement7: 263269 |
21 | Leemans A, Jones DK(2009) The B-matrix must be rotated when correcting for subject motion in DTI dataMagn Reson Med61: 13361349 |
22 | Veraart J, Rajan J, Peeters RR, Leemans A, Sunaert S, Sijbers J(2012) Comprehensive framework for accurate diffusion MRI parameter estimationMagn Reson Med70: 972984 |
23 | Veraart J, Sijbers J, Sunaert S, Leemans A, Jeurissen B(2013) Weighted linear least squares estimation of diffusion MRI parameters: Strengths, limitations, and pitfallsNeuroimage81: 335346 |
24 | Maes F, Collignon A, Vandermeulen D, Marchal G, Suetens P(1997) Multimodality image registration by maximization of mutual informationIEEE Trans Med Imaging16: 187198 |
25 | Van Hecke W, Sijbers J, D’Agostino E, Maes F, De Backer S, Vandervliet E, Parizel PM, Leemans A(2008) On the construction of an inter-subject diffusion tensor magnetic resonance atlas of the healthy human brainNeuroimage43: 6980 |
26 | Van Hecke W, Leemans A, Sage CA, Emsell L, Veraart J, Sijbers J, Sunaert S, Parizel PM(2011) The effect of template selection on diffusion tensor voxel-based analysis resultsNeuroimage55: 566573 |
27 | Van Hecke W, Leemans A, D’Agostino E, De Backer S, Vandervliet E, Parizel PM, Sijbers J(2007) Nonrigid coregistration of diffusion tensor images using a viscous fluid model and mutual informationIEEE Trans Med Imaging26: 15981612 |
28 | Sage CA, Van HW, Peeters R, Sijbers J, Robberecht W, Parizel P, Marchal G, Leemans A, Sunaert S(2009) Quantitative diffusion tensor imaging in amyotrophic lateral sclerosis: RevisitedHum Brain Mapp30: 36573675 |
29 | Alexander DC, Pierpaoli C, Basser PJ, Gee JC(2001) Spatial transformations of diffusion tensor magnetic resonance imagesIEEE Trans Med Imaging20: 11311139 |
30 | Van Hecke W, Leemans A, De Backer S, Jeurissen B, Parizel PM, Sijbers J(2010) Comparing isotropic and anisotropic smoothing for voxel-based DTI analyses: A simulation studyHum Brain Mapp31: 98114 |
31 | Scheltens P, Leys D, Barkhof F, Huglo D, Weinstein HC, Vermersch P, Kuiper M, Steinling M, Wolters EC, Valk J(1992) Atrophy of medial temporal lobes on MRI in “probable” Alzheimer’s disease and normal ageing: Diagnostic value and neuropsychological correlatesJ Neurol NeurosurgPsychiatry55: 967972 |
32 | Engelborghs S, De Vreese K, Van de Casteele T, Vanderstichele H, Van Everbroeck B, Cras P, Martin JJ, Vanmechelen E, De Deyn PP(2008) Diagnostic performance of a CSF-biomarker panel in autopsy-confirmed dementiaNeurobiol Aging29: 11431159 |
33 | Le Bastard N, Coart E, Vanderstichele H, Vanmechelen E, Martin JJ, Engelborghs S(2013) Comparison of two analytical platforms for the clinical qualification of Alzheimer’s disease biomarkers in pathologically-confirmed dementiaJ Alzheimers Dis33: 117131 |
34 | Dubois B, Feldman HH, Jacova C, Hampel H, Molinuevo JL, Blennow K, DeKosky ST, Gauthier S, Selkoe D, Bateman R, Cappa S, Crutch S, Engelborghs S, Frisoni GB, Fox NC, Galasko D, Habert MO, Jicha GA, Nordberg A, Pasquier F, Rabinovici G, Robert P, Rowe C, Salloway S, Sarazin M, Epelbaum S, de Souza LC, Vellas B, Visser PJ, Schneider L, Stern Y, Scheltens P, Cummings JL(2014) Advancing research diagnostic criteria for Alzheimer’s disease: The IWG-2 criteriaLancet Neurol13: 614629 |
35 | Van der Mussele S, Fransen E, Struyfs H, Luyckx J, Marien P, Saerens J, Somers N, Goeman J, De Deyn PP, Engelborghs S(2014) Depression in mild cognitive impairment is associated with progression to Alzheimer’s disease: A longitudinal studyJ Alzheimers Dis42: 12391250 |
36 | Struyfs H, Van Broeck B, Timmers M, Fransen E, Sleegers K, Van Broeckhoven C, De Deyn PP, Streffer JR, Mercken M, Engelborghs S(2015) Diagnostic accuracy of cerebrospinal fluid amyloid-beta isoforms for early and differential dementia diagnosisJ Alzheimers Dis45: 813822 |
37 | Welge V, Fiege O, Lewczuk P, Mollenhauer B, Esselmann H, Klafki HW, Wolf S, Trenkwalder C, Otto M, Kornhuber J, Wiltfang J, Bibl M(2009) Combined CSF tau, p-tau181 and amyloid-beta 38/40/42 for diagnosing Alzheimer’s diseaseJ Neural Transm116: 203212 |
38 | Lewczuk P, Zimmermann R, Wiltfang J, Kornhuber J(2009) Neurochemical dementia diagnostics: A simple algorithm for interpretation of the CSF biomarkersJ Neural Transm116: 11631167 |
39 | Slaets S, Le Bastard N, Martin JJ, Sleegers K, Van Broeckhoven C, De Deyn PP, Engelborghs S(2013) Cerebrospinal fluid Abeta1-40 improves differential dementia diagnosis in patients with intermediate P-tau181P levelsJ Alzheimers Dis36: 759767 |
40 | Astrakas LG, Argyropoulou MI(2010) Shifting from region of interest (ROI) to voxel-based analysis in human brain mappingPediatr Radiol40: 18571867 |
41 | Carmeli C, Donati A, Antille V, Viceic D, Ghika J, vonGunten A, Clarke S, Meuli R, Frackowiak RS, Knyazeva MG(2013) Demyelination in mild cognitive impairment suggests progression path to Alzheimer’s diseasePLoS One8: e72759 |
42 | Wang PJ, Saykin AJ, Flashman LA, Wishart HA, Rabin LA, Santulli RB, McHugh TL, MacDonald JW, Mamourian AC(2006) Regionally specific atrophy of the corpus callosum in AD, MCI and cognitive complaintsNeurobiol Aging27: 16131617 |
43 | Frederiksen KS, Garde E, Skimminge A, Ryberg C, Rostrup E, Baare WF, Siebner HR, Hejl AM, Leffers AM, Waldemar G(2011) Corpus callosum atrophy in patients with mild Alzheimer’s diseaseNeurodegener Dis8: 476482 |
44 | Di Paola M, Luders E, Di Iulio F, Cherubini A, Passafiume D, Thompson PM, Caltagirone C, Toga AW, Spalletta G(2010) Callosal atrophy in mild cognitive impairment and Alzheimer’s disease: Different effects in different stagesNeuroimage49: 141149 |
45 | Frederiksen KS, Garde E, Skimminge A, Barkhof F, Scheltens P, van Straaten EC, Fazekas F, Baezner H, Verdelho A, Ferro JM, Erkinjuntti T, Jokinen H, Wahlund LO, O’Brien JT, Basile AM, Pantoni L, Inzitari D, Waldemar G(2011) Corpus callosum tissue loss and development of motor and global cognitive impairment: The LADIS studyDement Geriatr Cogn Disord32: 279286 |
46 | Gold BT, Johnson NF, Powell DK, Smith CD(2012) White matter integrity and vulnerability to Alzheimer’s disease: Preliminary findings and future directionsBiochim Biophys Acta1822: 416422 |
47 | Van Hecke W, Nagels G, Leemans A, Vandervliet E, Sijbers J, Parizel PM(2010) Correlation of cognitive dysfunction and diffusion tensor MRI measures in patients with mild and moderate multiple sclerosisJ Magn Reson Imaging31: 14921498 |
48 | Kantarci K, Jack CRJr, Xu YC, Campeau NG, O’Brien PC, Smith GE, Ivnik RJ, Boeve BF, Kokmen E, Tangalos EG, Petersen RC(2001) Mild cognitive impairment and Alzheimer disease: Regional diffusivity of waterRadiology219: 101107 |
49 | Bozzali M, Falini A, Franceschi M, Cercignani M, Zuffi M, Scotti G, Comi G, Filippi M(2002) White matter damage in Alzheimer’s disease assessed in vivo using diffusion tensor magnetic resonance imagingJ Neurol Neurosurg Psychiatry72: 742746 |
50 | Takahashi S, Yonezawa H, Takahashi J, Kudo M, Inoue T, Tohgi H(2002) Selective reduction of diffusion anisotropy in white matter of Alzheimer disease brains measured by 3.0 Tesla magnetic resonance imagingNeurosci Lett332: 4548 |
51 | Fellgiebel A, Wille P, Muller MJ, Winterer G, Scheurich A, Vucurevic G, Schmidt LG, Stoeter P(2004) Ultrastructural hippocampal and white matter alterations in mild cognitive impairment: A diffusion tensor imaging studyDementGeriatr Cogn Disord18: 101108 |
52 | Medina D, DeToledo-Morrell L, Urresta F, Gabrieli JD, Moseley M, Fleischman D, Bennett DA, Leurgans S, Turner DA, Stebbins GT(2006) White matter changes in mild cognitive impairment and AD: A diffusion tensor imaging studyNeurobiol Aging27: 663672 |
53 | Rose SE, McMahon KL, Janke AL, O’Dowd B, de ZG, Strudwick MW, Chalk JB(2006) Diffusion indices on magnetic resonance imaging and neuropsychological performance in amnestic mild cognitive impairmentJ Neurol Neurosurg Psychiatry77: 11221128 |
54 | Xie S, Xiao JX, Gong GL, Zang YF, Wang YH, Wu HK, Jiang XX(2006) Voxel-based detection of white matter abnormalities in mild Alzheimer diseaseNeurology66: 18451849 |
55 | Zhang Y, Schuff N, Jahng GH, Bayne W, Mori S, Schad L, Mueller S, Du AT, Kramer JH, Yaffe K, Chui H, Jagust WJ, Miller BL, Weiner MW(2007) Diffusion tensor imaging of cingulum fibers in mild cognitive impairment and Alzheimer diseaseNeurology68: 1319 |
56 | Kavcic V, Ni H, Zhu T, Zhong J, Duffy CJ(2008) White matter integrity linked to functional impairments in aging and early Alzheimer’s diseaseAlzheimers Dement4: 381389 |
57 | Stebbins GT, Murphy CM(2009) Diffusion tensor imaging in Alzheimer’s disease and mild cognitive impairmentBehav Neurol21: 3949 |
58 | Nir TM, Jahanshad N, Villalon-Reina JE, Toga AW, Jack CR, Weiner MW, Thompson PMAlzheimer’s Disease Neuroimaging I(2013) Effectiveness of regional DTI measures in distinguishing Alzheimer’s disease, MCI, and normal agingNeuroimage Clin3: 180195 |
59 | Fieremans E, Jensen JH, Helpern JA(2011) White matter characterization with diffusional kurtosis imagingNeuroimage58: 177188 |
60 | Fieremans E, Benitez A, Jensen JH, Falangola MF, Tabesh A, Deardorff RL, Spampinato MV, Babb JS, Novikov DS, Ferris SH, Helpern JA(2013) Novel white matter tract integrity metrics sensitive to Alzheimer disease progressionAJNR Am J Neuroradiol34: 21052112 |
61 | Benitez A, Fieremans E, Jensen JH, Falangola MF, Tabesh A, Ferris SH, Helpern JA(2014) White matter tract integrity metrics reflect the vulnerability of late-myelinating tracts in Alzheimer’s diseaseNeuroimage Clin4: 6471 |
Figures and Tables
Fig.1
Differences between Alzheimer’s disease (AD) and control (CO) subjects. Transversal fractional anisotropy maps, based on the population atlas, showing the regions with significantly different regions in orange (uncorrected p < 0.001 results for at least 20 consecutive voxels). A) Regions with decreased fractional anisotropy in the AD subjects versus the CO subjects. B) Regions with increased mean diffusivity in the AD subjects versus the CO subjects. C) Regions with decreased mean kurtosis in the AD subjects versus the CO subjects.
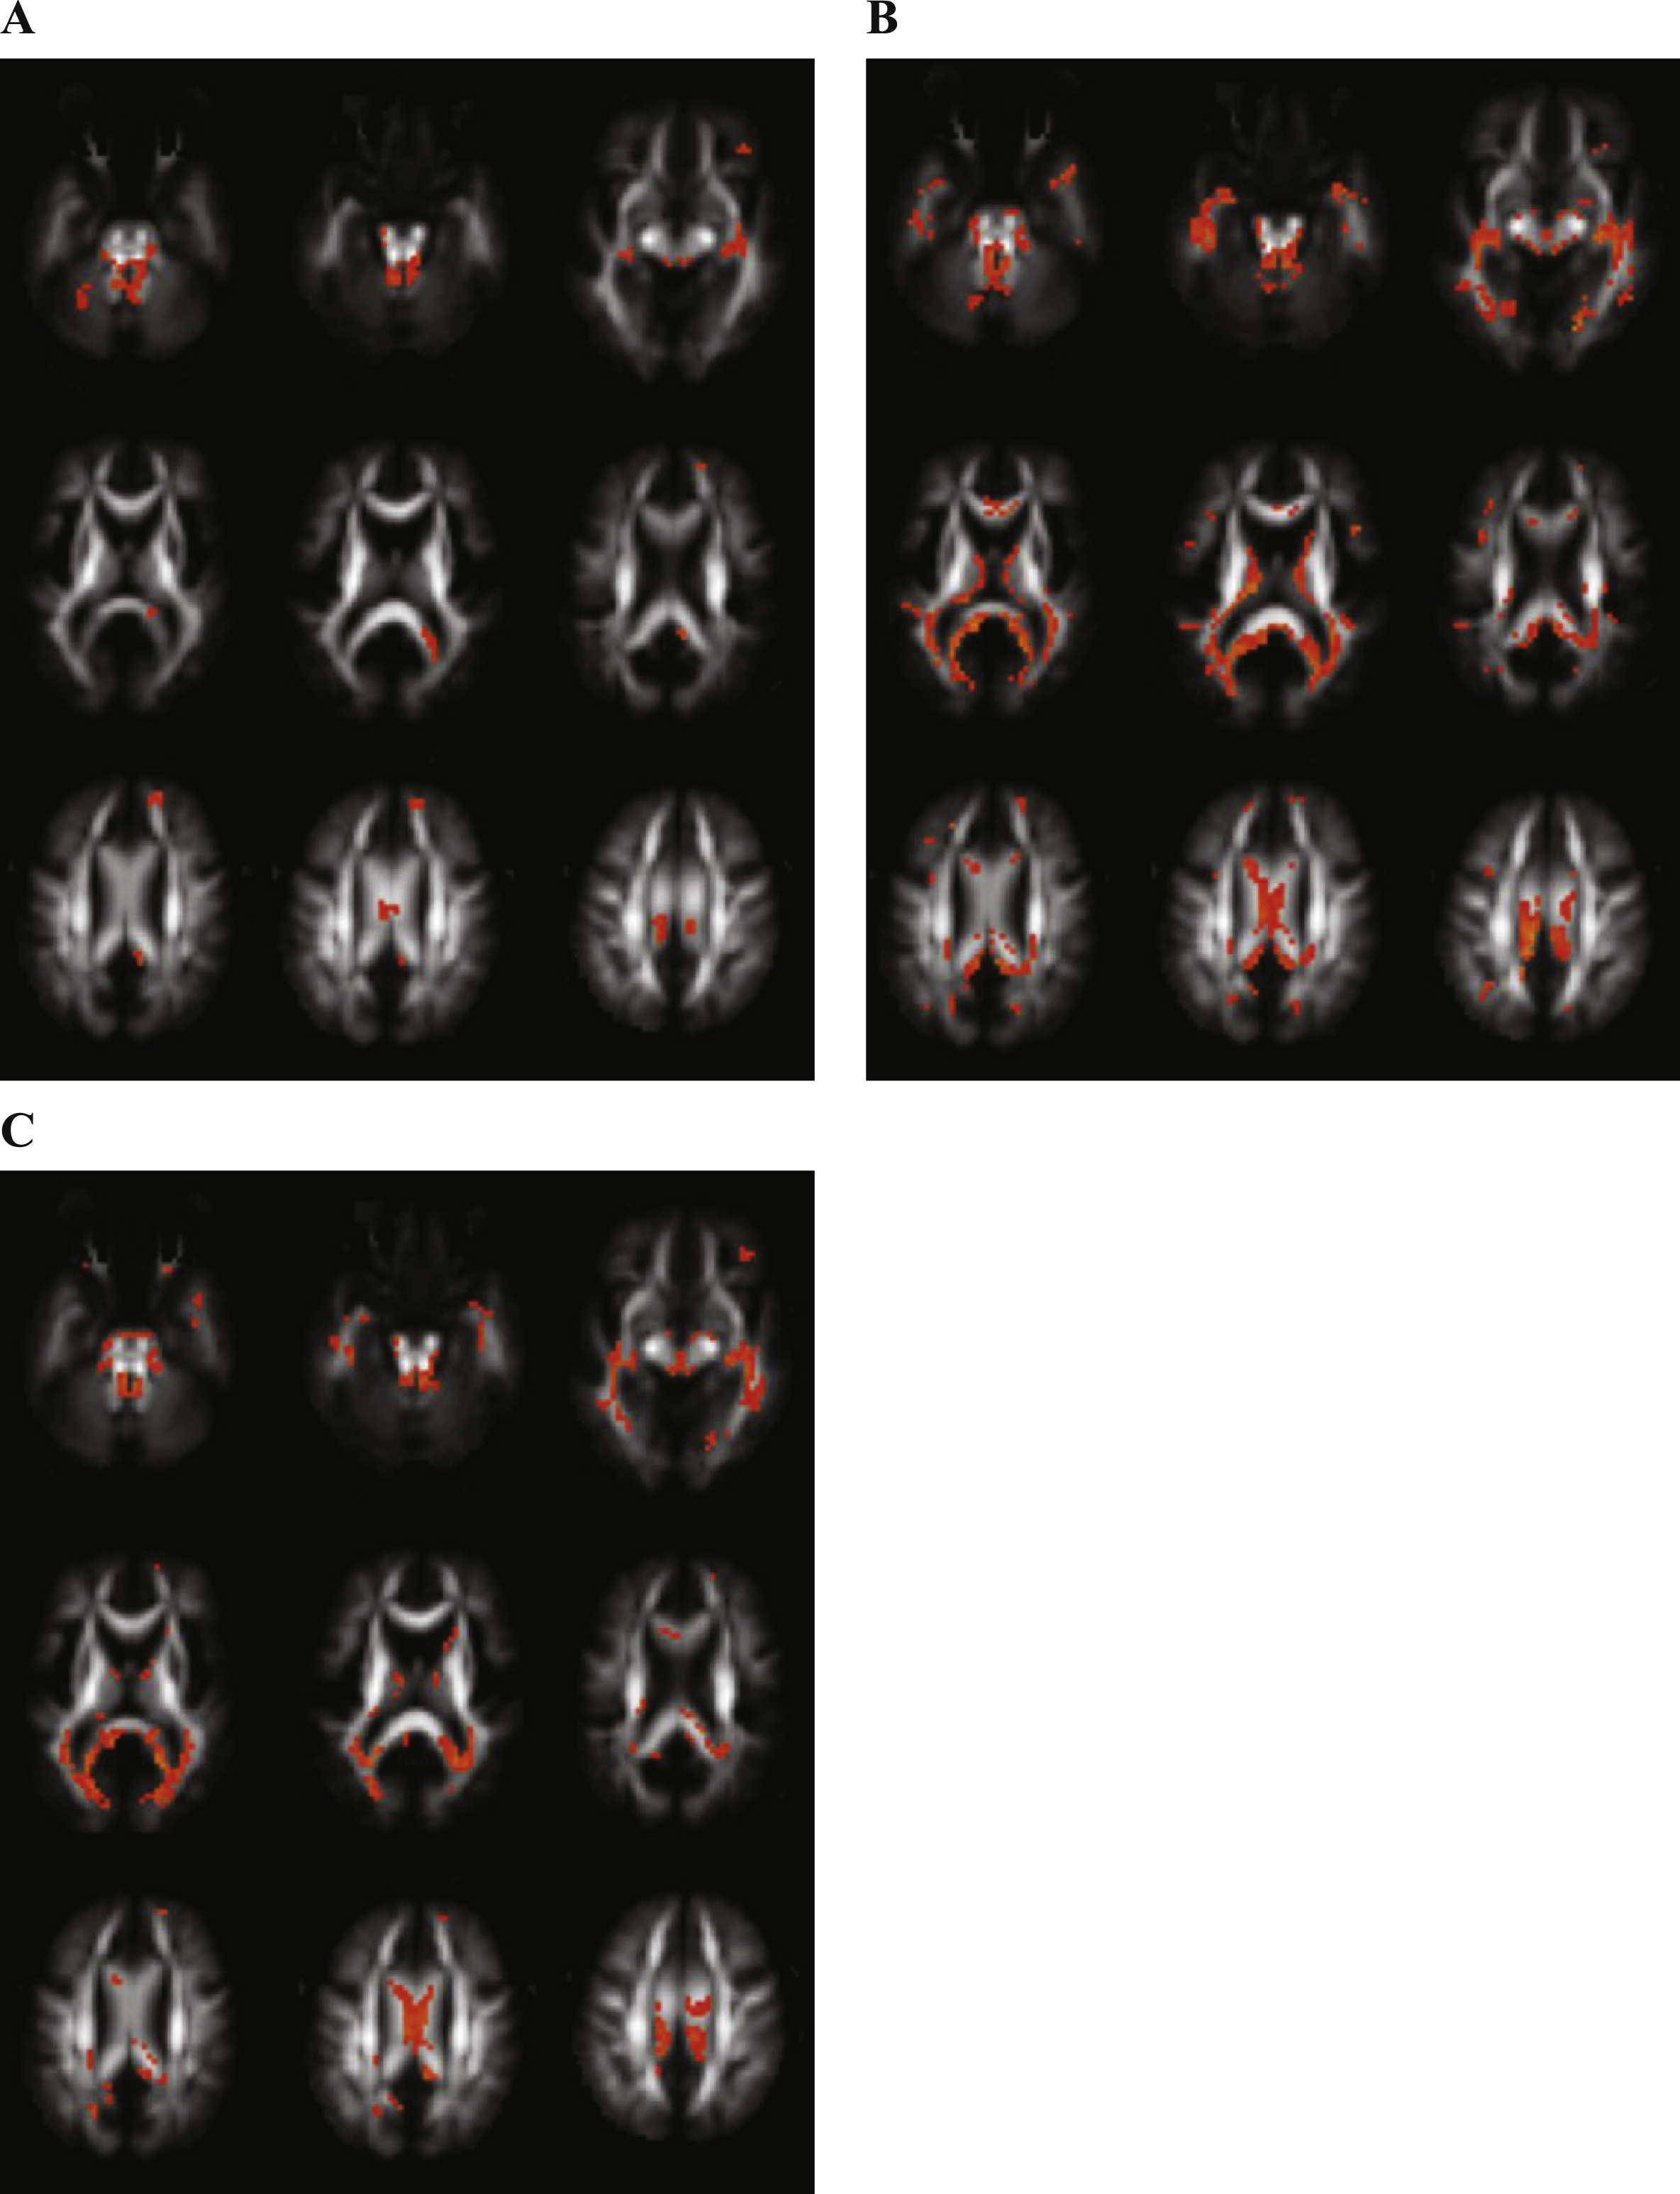
Fig.2
Differences between mild cognitive impairment (MCI) and control (CO) subjects. Transversal fractional anisotropy maps, based on the population atlas, showing the regions with significantly different regions in orange (uncorrected p < 0.001 results for at least 20 consecutive voxels). A) Regions with decreased fractional anisotropy in MCI subjects versus CO subjects. B) Regions with increased mean diffusivity in the MCI group versus the CO group. C) Regions with decreased mean kurtosis in MCI patients versus CO subjects.
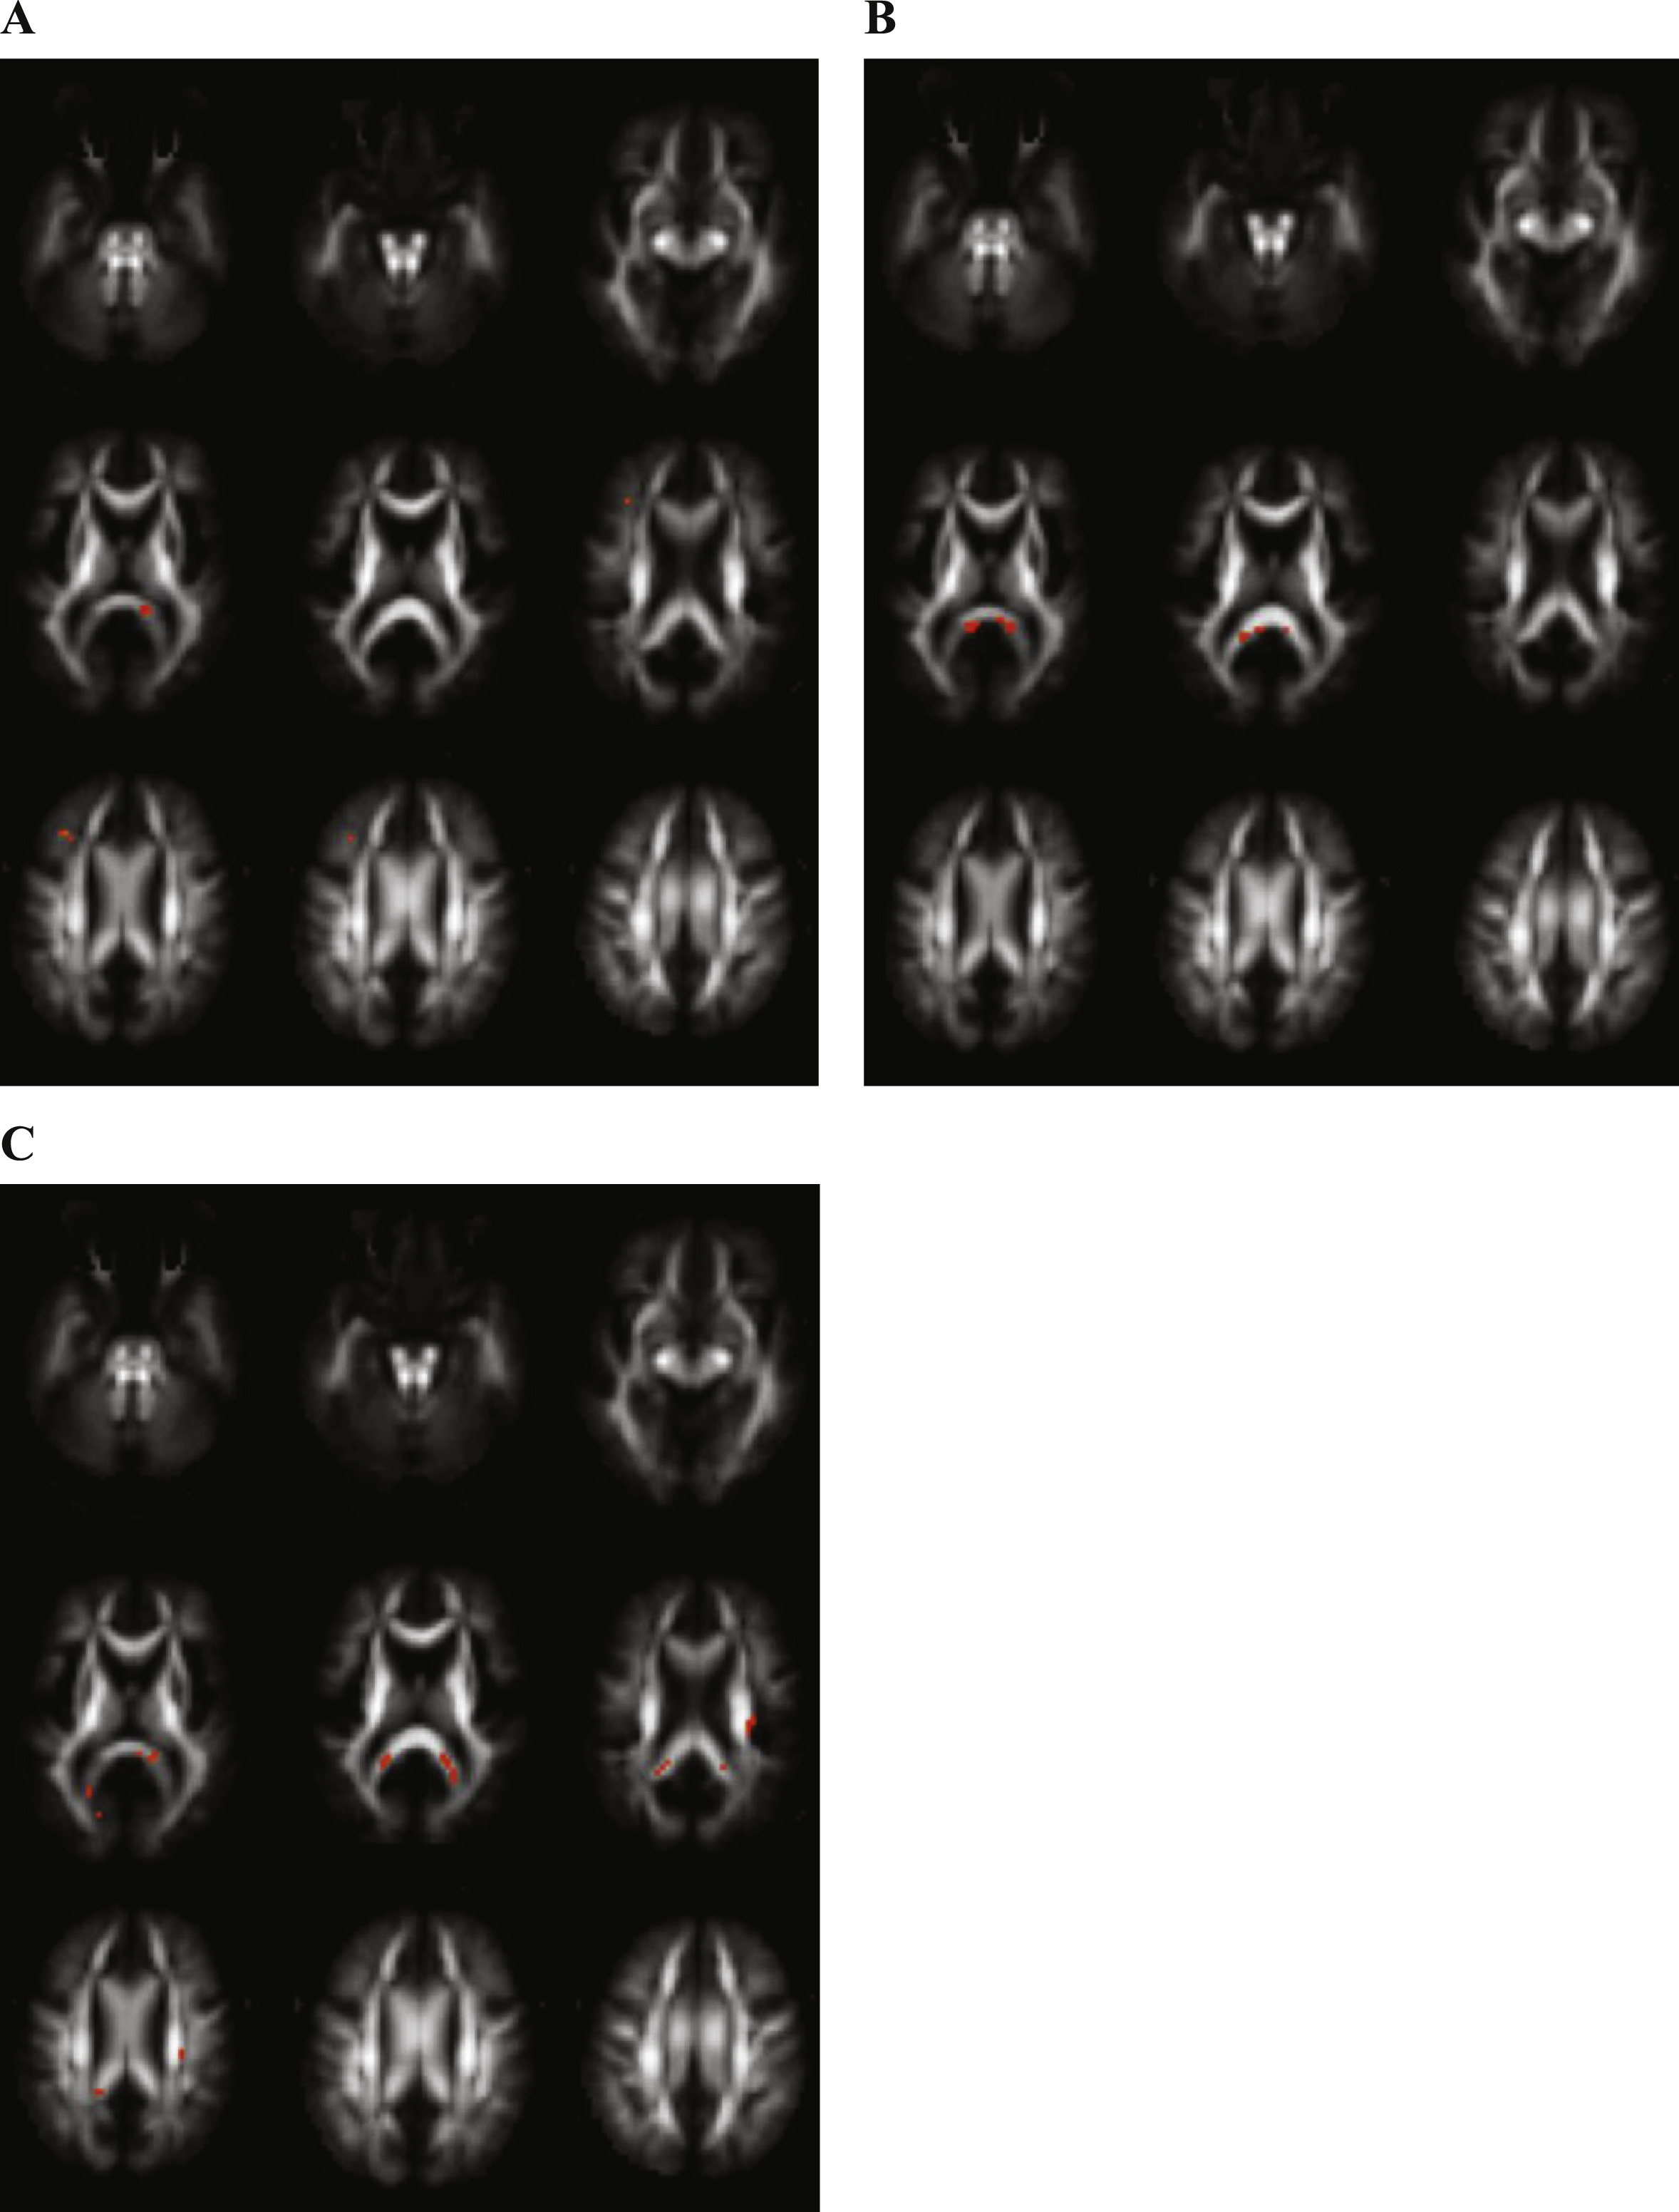
Fig.3
Differences between Alzheimer’s disease (AD) and mild cognitive impairment (MCI) subjects. Transversal fractional anisotropy maps, based on the population atlas, showing the regions with significantly different regions in orange (uncorrected p < 0.001 results for at least 20 consecutive voxels). A) No differences were found in fractional anisotropy in the AD group versus the MCI group. B) Regions with increased mean diffusivity in the AD group versus the MCI group. C) No differences were found in mean kurtosis in the AD groups versus the MCI group.
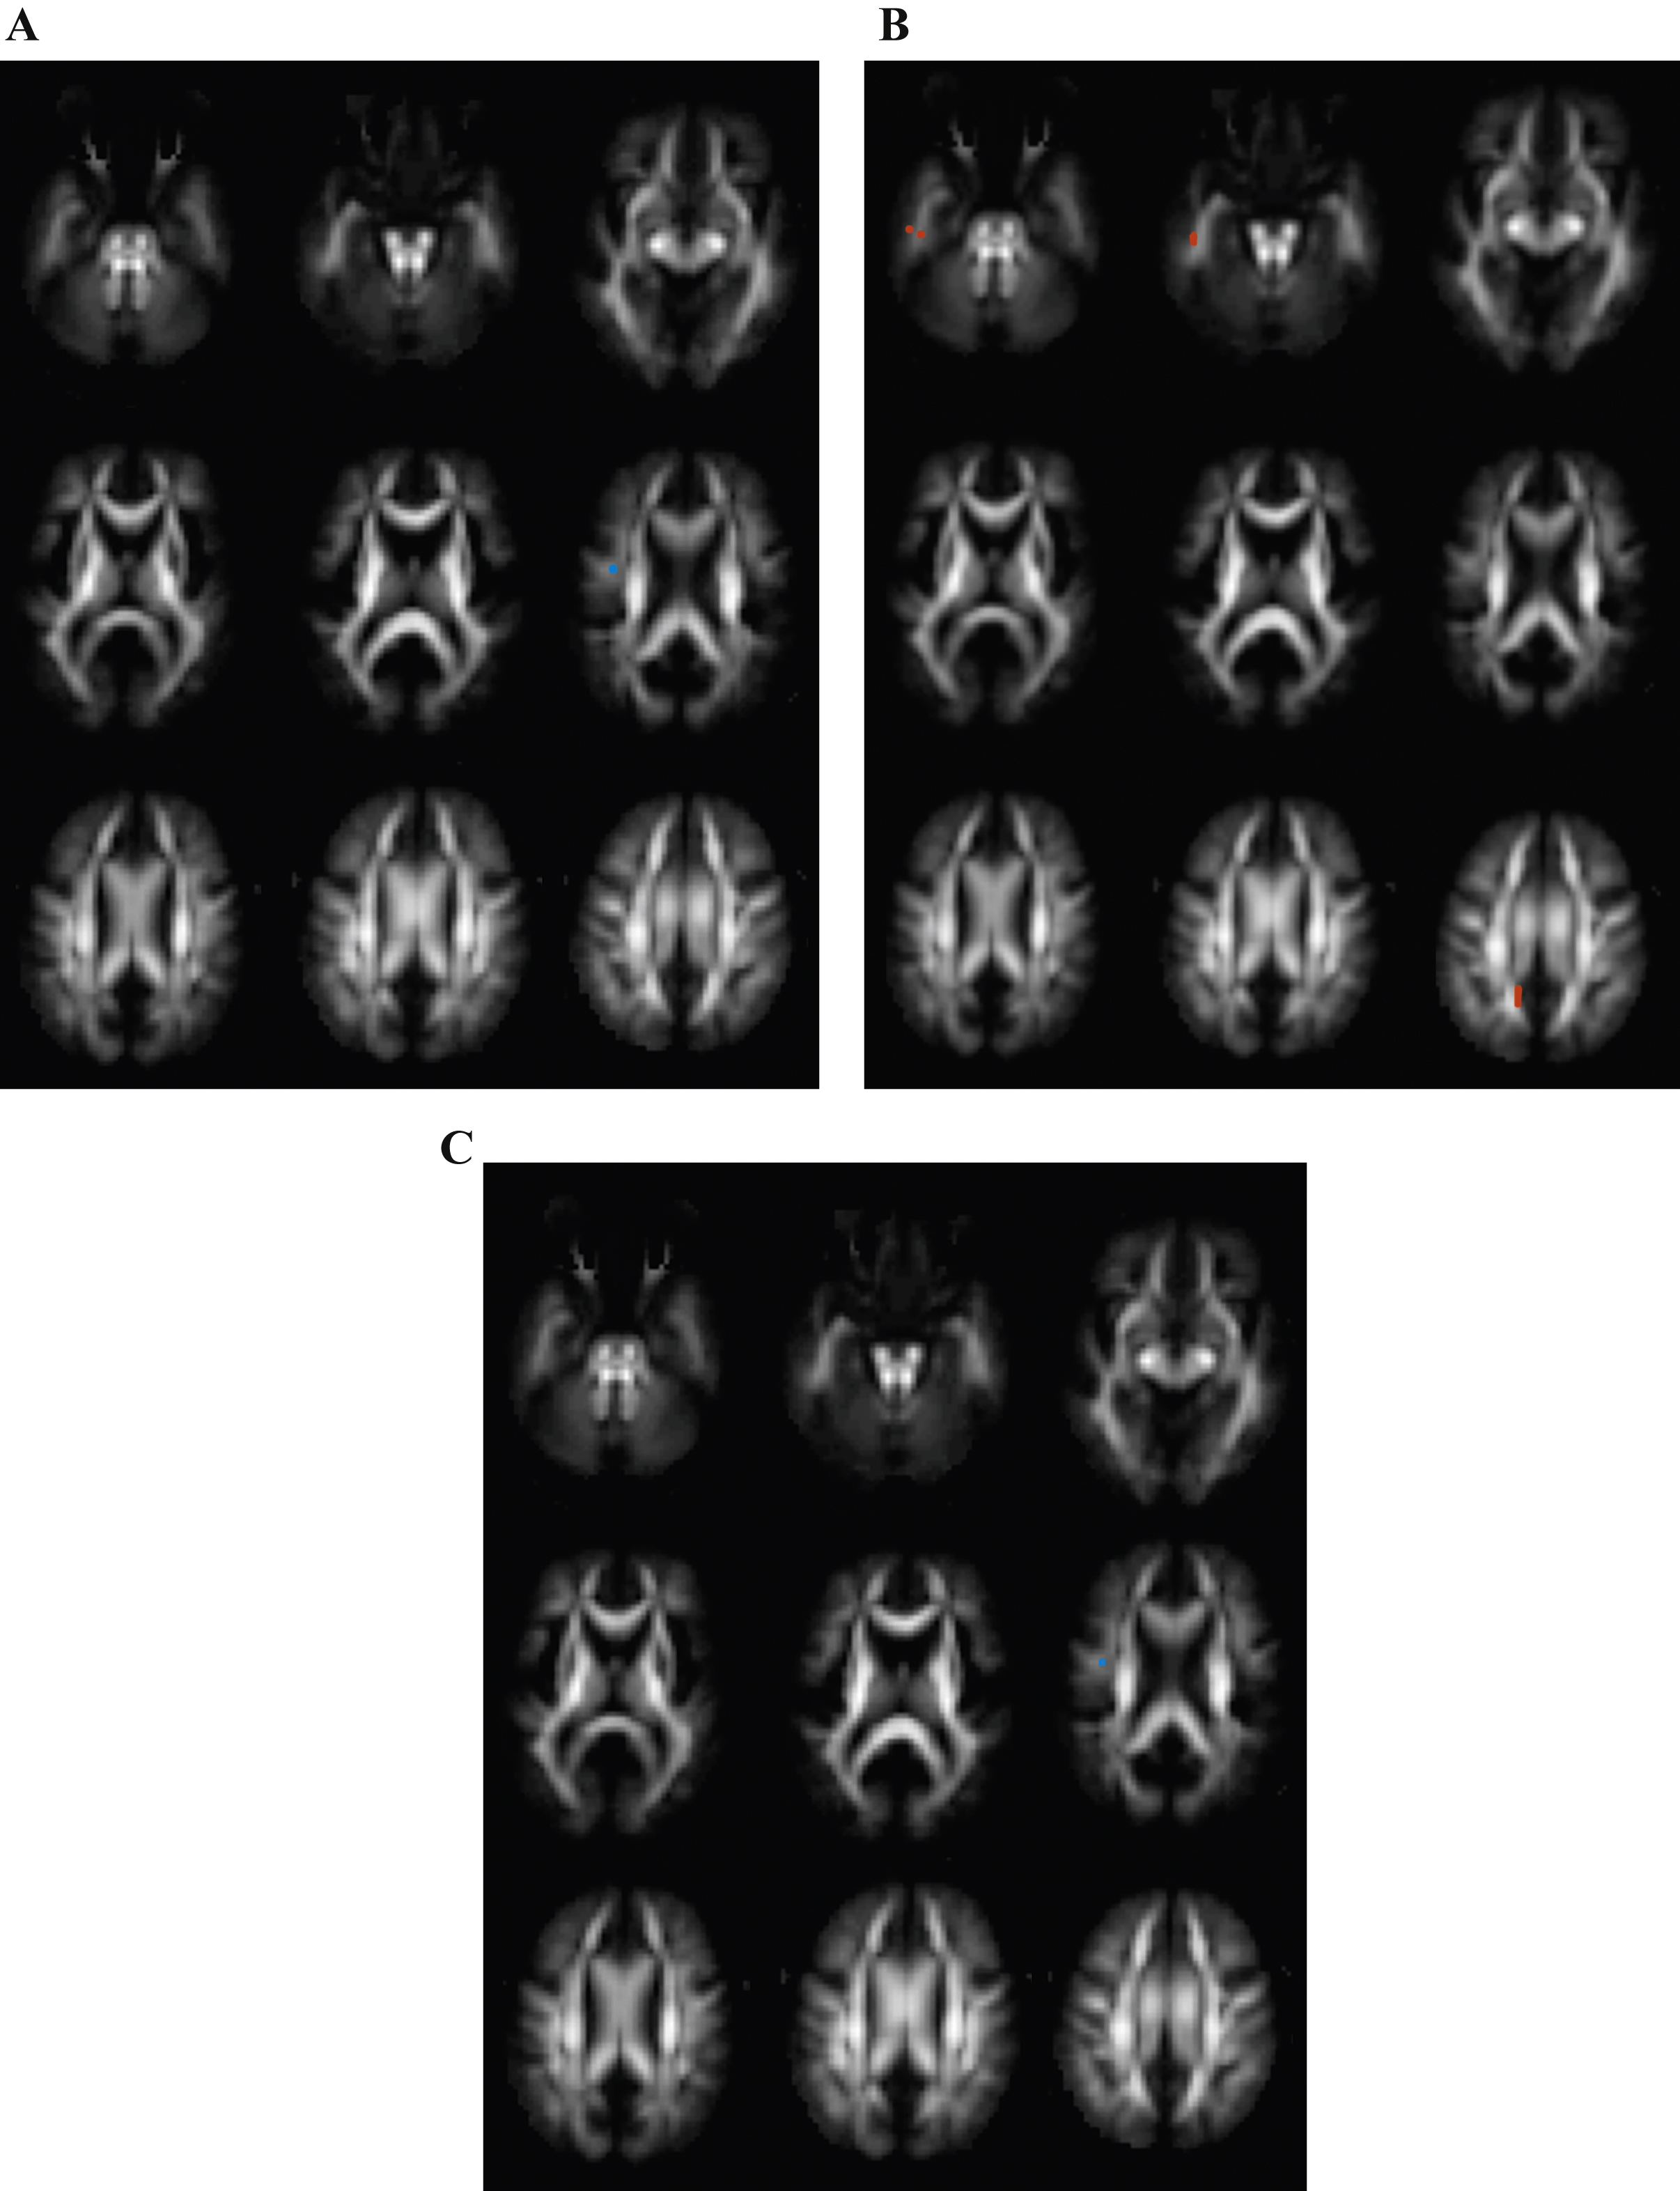
Fig.4
Voxels reaching statistical significance (p < 0.05) after FWE correction on whole-brain level for multiple comparison in Alzheimer’s disease versus control subjects at a cluster threshold of 20. No differences were found in fractional anisotropy. A) Regions with increased mean diffusivity. B) Regions with decreased mean kurtosis.
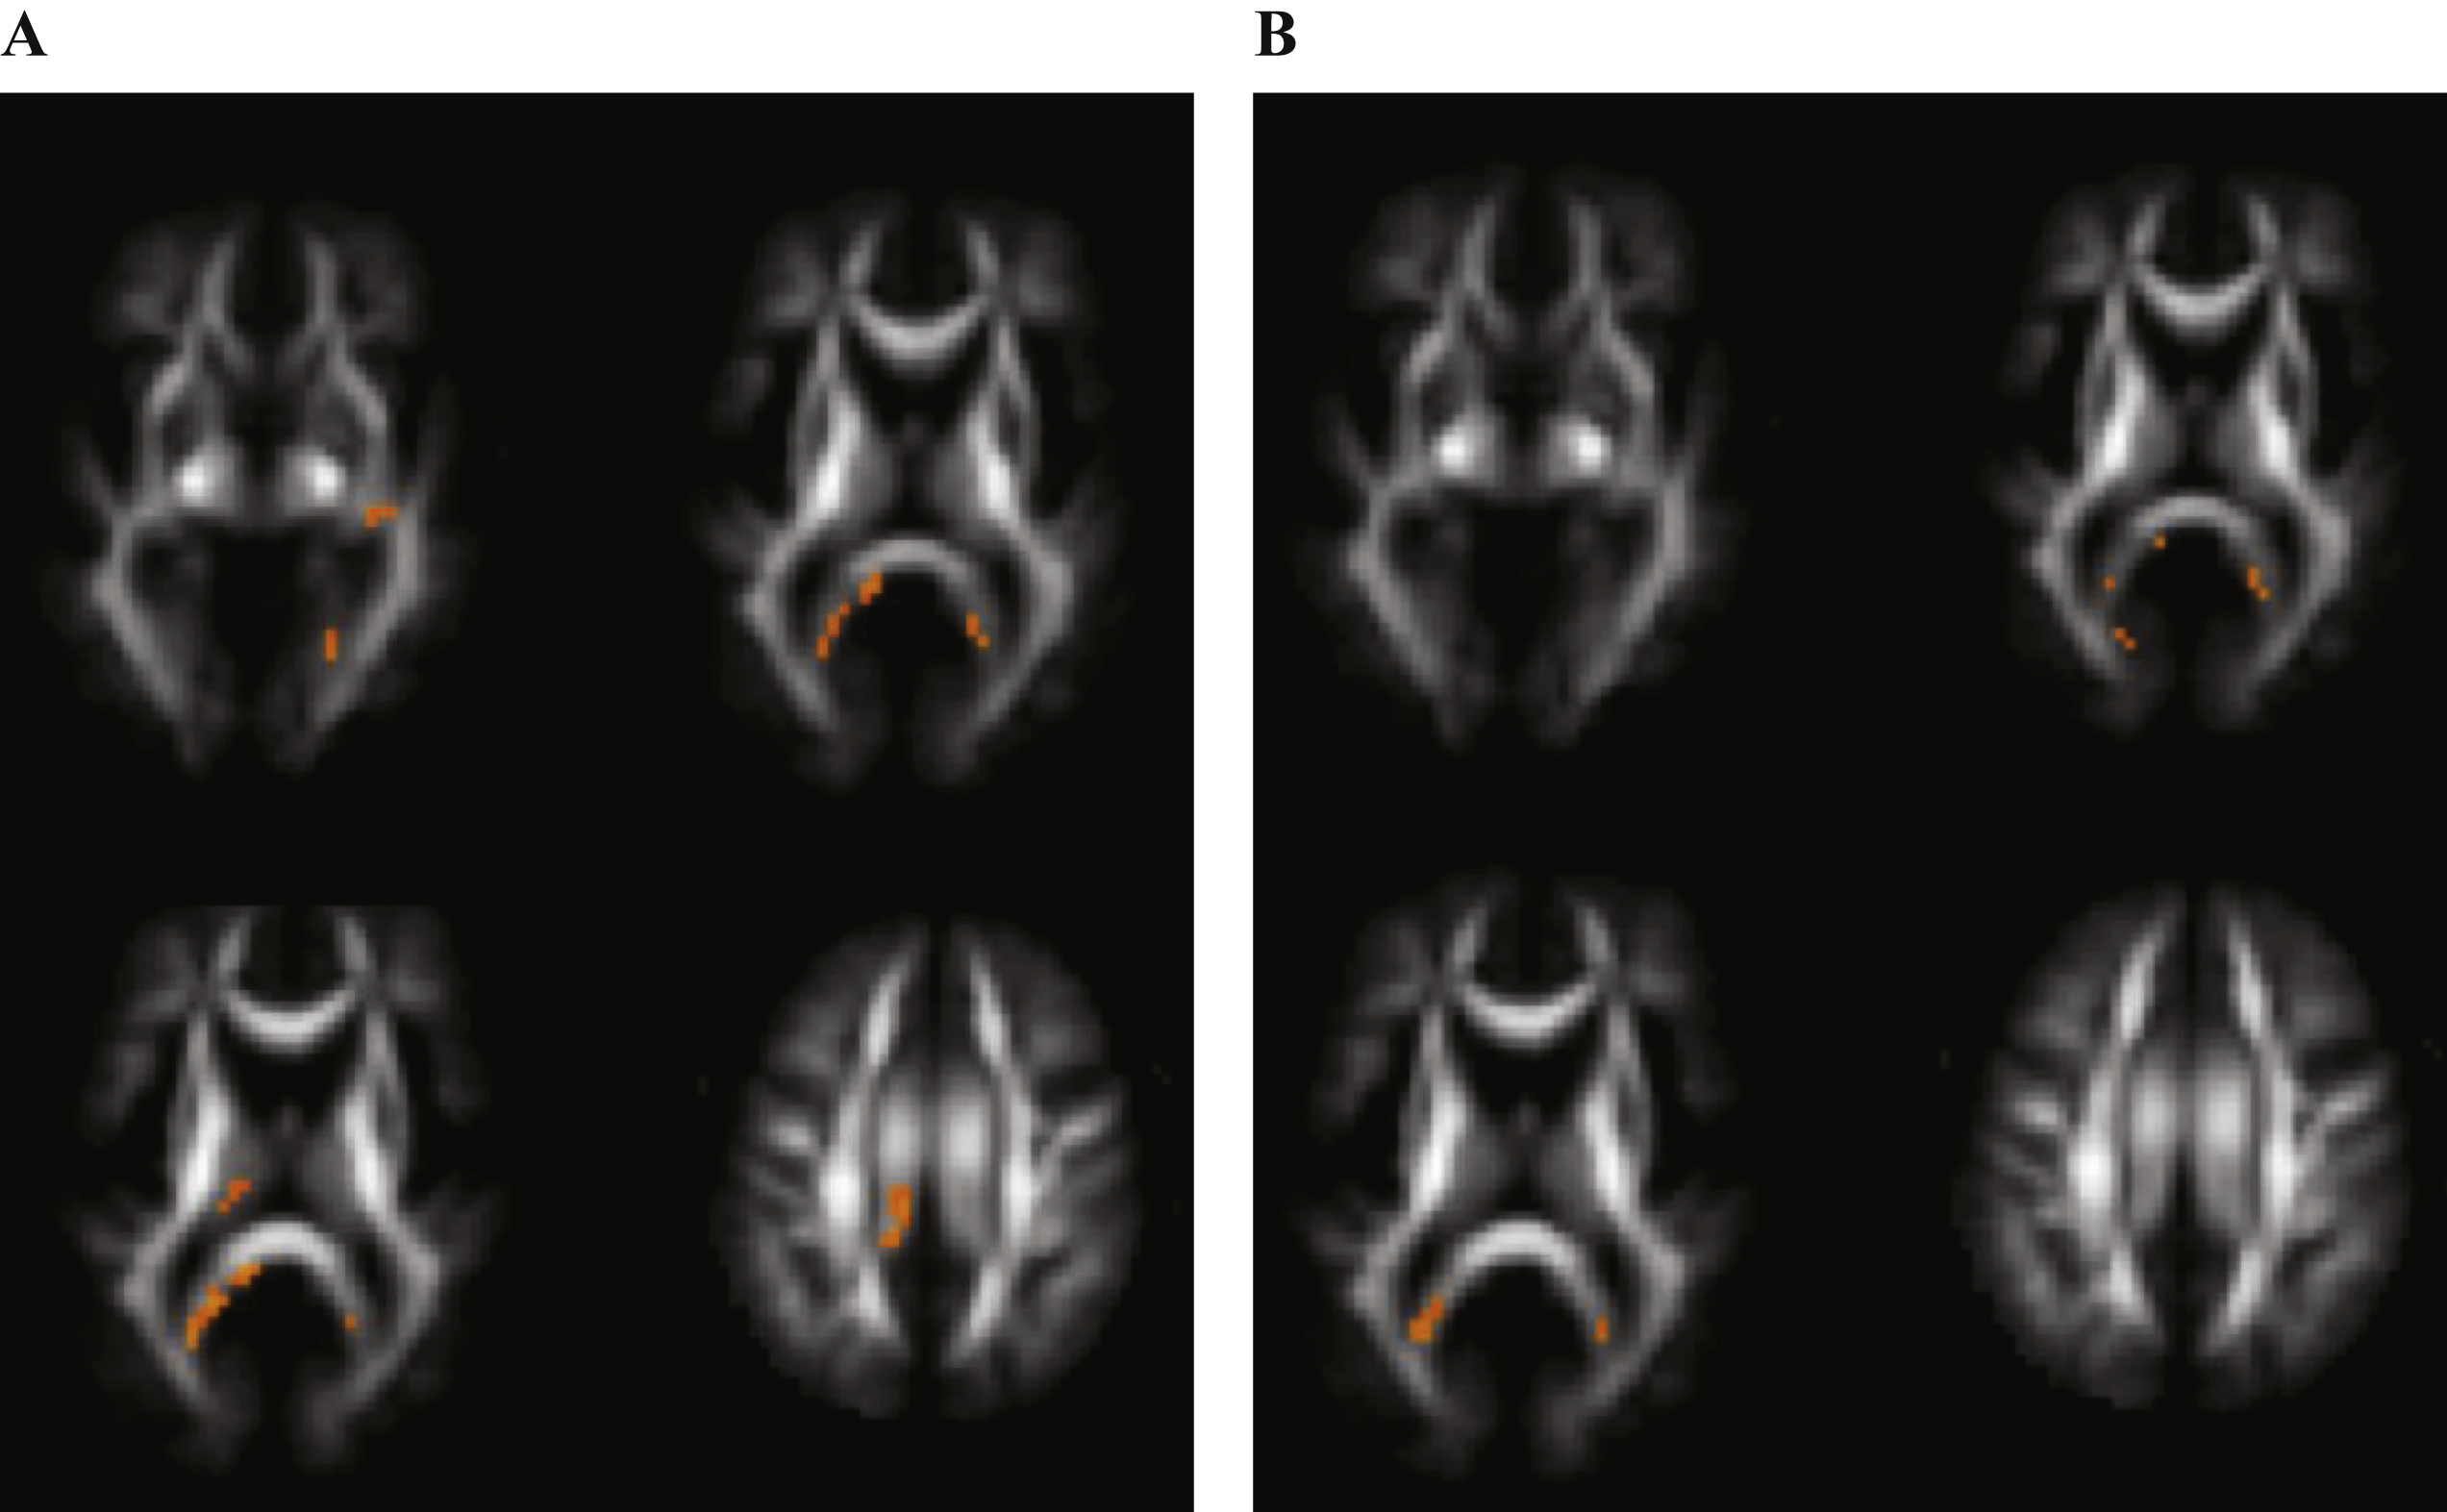
Table 1
Demographic, clinical and biomarker data of the population
| MCI | AD | CO | |
| N | 18 | 19 | 14 |
| F / M | 8 / 10 | 13 / 6 | 6 / 8 |
| Age | 74.9 (±8.7) | 72.8 (±8.9) | 69.7 (±7.5) |
| Age range | 49 –88 | 50 –88 | 59 –83 |
| MMSE (/30) | 28 (±1) *** n = 10 | 21 (±4) *** n = 13 | / |
| MoCA (/30) | / | / | 27 (±1) |
| % APOE ɛ4 carriers | 60 n = 10 | 69 n = 13 | / |
| CSF Aβ1 - 42 (pg/mL) | 560 (±152) n = 15 | 600 (±143) n = 11 | / |
| CSF T-tau (pg/mL) | 463 (±256) n = 15 | 605 (±284) n = 11 | / |
| CSF P-tau181P (pg/mL) | 61.6 (±28.0) n = 15 | 88.7 (±42.0) n = 11 | / |
| HCA (n) | 0 | 1 | 6 |
| HCA 1 (n) | 7 | 5 | 5 |
| HCA 2 (n) | 5 | 4 | 2 |
| HCA 3 (n) | 4 | 7 | 1 |
| HCA 4 (n) | 2 | 2 | 0 |
Data are presented as mean (± standard deviation), except for the age range (years), HCA scores (n), and APOE ɛ4 carriers (%). MMSE scores were only considered when the time lap between MMSE and the MRI scan was equal to or less than three months. An independent sample t-test was performed to compare the age, MMSE scores and CSF biomarker levels of the groups. Mann-Whitney U-tests were used to compare HCA and % APOE ɛ4 carriers between the groups. AD, Alzheimer’s disease; MCI, mild cognitive impairment; CO, control; n, number; MoCA, Montreal Cognitive Assessment; APOE, apolipoprotein E; CSF, cerebrospinal fluid; HCA, hippocampal atrophy. ***p < 0.001.
Table 2
Brain regions with one or more clusters reaching statistical significance (p < 0.05) after FWE correction on cluster level for multiple comparison in AD versus CO
| Brain region | Cluster level FWE corrected p value |
| FA | |
| Cerebellar peduncles | <0.001 |
| Cerebellar peduncles | 0.009 |
| Inferior longitudinal fasciculus | 0.016 |
| Cingulum | 0.021 |
| Splenium corpus callosum | 0.012 |
| MD | |
| Splenium corpus callosum | <0.001 |
| Inferior longitudinal fasciculus | 0.044 |
| MK | |
| Splenium corpus callosum | <0.001 |
| Cerebellar peduncles | <0.001 |
FA, fractional anisotropy; MD, mean diffusivity; MK, mean kurtosis.


