
Development of Immunoassays for the Quantitative Assessment of Amyloid-β in the Presence of Therapeutic Antibody: Application to Pre-Clinical Studies
Abstract
Utilizing decision making biomarkers in drug development requires thorough assay validation. Special considerations need to be taken into account when monitoring biomarkers using immunoassays in the presence of therapeutic antibodies. We have developed robust and sensitive assays to assess target engagement and proof of mechanism to support the clinical progression of a human monoclonal antibody against the neurotoxic amyloid-β (Aβ)42 peptide. Here we present the introduction of novel pre-treatment steps to ensure drug-tolerant immunoassays and describe the validation of the complete experimental procedures to measure total Aβ42 concentration (bound and unbound) in cerebrospinal fluid (CSF) and plasma, free Aβ42 concentration (unbound) in CSF, and Aβ40 concentration in CSF. The difference in composition of the matrices (CSF and plasma) and antigen levels therein, in combination with the hydrophobic properties of Aβ protein, adds to the complexity of validation. Monitoring pharmacodynamics of an Aβ42 specific monoclonal antibody in a non-human primate toxicology study using these assays, we demonstrated a 1500-fold and a 3000-fold increase in total Aβ42 in plasma, a 4-fold and 8-fold increase in total Aβ42 in CSF together with a 95% and 96% reduction of free Aβ42 in CSF following weekly intravenous injections of 10 mg/kg and 100 mg/kg, respectively. Levels of Aβ40 were unchanged. The accuracy of these data is supported by previous pre-clinical studies as well as predictive pharmacokinetic/pharmacodynamics modeling. In contrast, when analyzing the same non-human primate samples excluding the pre-treatment steps, we were not able to distinguish between free and total Aβ42. Our data clearly demonstrate the importance of thorough evaluation of antibody interference and appropriate validation to monitor different types of biomarkers in the presence of a therapeutic antibody.
INTRODUCTION
Irrespective of target and indication, developing decision making biomarker assays to monitor drug efficacy, target engagement, and proof of mechanism is an important part of drug development. To ensure that decisions are made on accurate data, thorough validation of the biomarker assays is vital. Performing such a validation using samples similar in composition and analyte concentration as expected in future clinical studies is key and will highlight any limitation(s) of the assay. These principles are equally important for both commercially available kits and internally developed assays. When the therapy is a monoclonal antibody or a vaccine triggering the endogenous production of antibodies, the decision-making biomarker is the same as the target, and the protein biomarker is quantified using antibody based assays, then the validation of the assay becomes even more important and complex. Interference of the therapeutic antibody in the immunoassay is likely and the degree of interference will depend on target concentration, exposure (therapeutic antibody) levels, specificity and affinity of the therapeutic antibody, as well as avidity, especially if the target protein is known to aggregate.
Alzheimer’s disease (AD) is the most common form of dementia and progressively develops through the spreading of amyloid and tau pathology in brain. According to the amyloid hypothesis [1], recently strengthened by the genetic findings of a family with a protective mutation [2], the formation and aggregation of the amyloid peptide amyloid-β (Aβ), is the key event driving the disease. Different therapeutic approaches have been taken to target amyloid pathology by either; preventing the production of Aβ by inhibiting or modulating the secretase cleavage enzymes (β orγ-secretases) [3, 4], by increasing the clearance through proteases responsible for amyloid degradation [5], or neutralizing Aβ or Aβ aggregates by active or passive immunization [6]. The most clinically advanced approach is the development of antibodies targeting Aβ, with two passive immunization programs having advanced to Phase III. Much has been learned from those two potential therapeutic agents with respect to modulation of Aβ [7, 8].
We have developed a therapeutic human monoclonal antibody targeting the C-terminal of Aβ42 (MEDI1814) that specifically binds to and removes from the circulation the peptide (monomer and low n-oligomers) and thus prevents it from further aggregation into more toxic oligomer species. To support the pre-clinical drug development of this large molecule, assays to monitor target engagement, mechanism of action, and specificity of the antibody have been developed for various animal species and in various matrices (brain, plasma, and cerebrospinal fluid (CSF)). Special considerations have been taken into account in assay development since the therapeutic antibody will be present in the samples and additionally the target antigen of the biomarker is the same as the drug target. In this particular case, we also had the challenge of having the same epitope for the therapeutic antibody as our main biomarker read out, Aβ42. For the proper understanding of pharmacokinetic (PK)/pharmacodynamics (PD) relationships and dose setting, we have developed drug-tolerant assays including pre-treatment steps to measure both target engagement, reflected by increased total levels of Aβ42 (Aβ42 unbound and bound to therapeutic antibody), as well as proof of mechanism (PoM), which we define as reduction in the free, unbound, levels of Aβ42. In addition, we wanted to confirm specificity of the therapeutic antibody, i.e., the absence of effect on free Aβ40 levels. We aimed to monitor both peripheral and central target engagement and developed assays fit for purpose for assessments in plasma and CSF. These different read outs and matrices required several different set ups in order to pass our internal validation criteria.
In this paper we also share data from a Good Laboratory Practice (GLP) toxicology study in non-human primates (NHP) dosed with MEDI1814 where biomarker analyses were added as exploratory read outs. We compare data obtained from the internally developed drug tolerant assays with commercially available ELISA assays where the pre-treatment steps are excluded. Monitoring efficacy in the NHP, we demonstrate a 3000-fold increase in total Aβ42 in plasma, 8-fold increase in CSF together with a reduction by 96% of free Aβ42 in CSF. Levels of Aβ40 were unaffected. Analyses without the pre-treatment step did not provide specificity for total versus free levels of Aβ42 and furthermore, the observed effects on Aβ were not dose dependent using this commercially available kit and method.
We clearly demonstrate the importance of thorough evaluation of antibody interference and proper validation to monitor different types of biomarkers in the presence of a therapeutic antibody.
MATERIALS AND METHODS
Free Aβ42 in CSF
Prior to ELISA analyses, Aβ42 bound to MEDI1814 is removed by immunoprecipitation (IP). The IP step is performed by transferring 50μL of a mixture of magnetic beads coupled with Protein A/Protein G (Dynabeads ® Protein A (Invitrogen, 10002D), Dynabeads ® Protein G (Invitrogen, 10004D)) to a96-well non skirted plate (VWR, cat no 10732–4828) (plate 1). The plate is placed on a plate magnet (Invitrogen, DynaMagtrademark −96 side. Cat no 123.31D) and the supernatant is removed. Beads are washed twice with 200μL Tris-buffered saline (TBS) (Sigma T6664) with 0.1% Tween (Sigma P2287), and the plate is then placed on ice. One-hundred micro liters (100μL) of CSF is added to each well and mixed up and down 10 times by pipetting, followed by incubation on ice for 10 min. The plate is placed on the plate magnet for 1 min and the CSF is transferred to a second plate prepared in the same way as plate 1 followed by incubation on ice for 10 min. The Protein A/Protein G beads co-precipitates Aβ42 bound to therapeutic antibodies while unbound “free” Aβ42 remains in the supernatant. Hence, following the placement of the plate on the magnet one aliquot of CSF is transferred to the commercially available human β-Amyloid 1–42 ELISA kit (80177 RUO, Innogenetics) for determination of free levels of Aβ42. Another aliquot of the CSF is transferred to the HIgG ELISA plate (Total human IgG kit, Cat no F160, Cygnus Technologies) for quality control of the IP step (to ensure complete removal of human IgG and thus complete removal of MEDI1814) by quantification of human IgG. A schematic illustration of the assay set up is in Fig. 1A. The Aβ1-42 ELISA analysis is performed according to the manufactures instructions. In brief, 100μL of standard, Quality control (QC) sample and CSF (1:5 dilution with sample buffer) is added in duplicate to the antibody coated plate. The plate is covered with adhesive sealer and incubated for 3 h at room temperature while shaking on an orbital plate shaker (200–300 rpm). After washing each well with 5×400μL wash buffer, 100μL of conjugate working solution (1 HS) is added to each well. The plate is covered with an adhesive sealer and incubated for 1 h at room temperature. After a second wash, 100μL conjugate working solution 2 is added to each well, the plate is covered and incubated for 30 min at room temperature. After the final wash, 100μL substrate working solution is added and incubation is performed in the dark for 30 min at room temperature. After stopping the reaction by adding 100μL Stop Solution the absorbance is read at 450 nm. The Soft Max Pro 5.2 software is used to evaluate the data. Quantification is performed by plotting the response of the standard curve as absorbance unit on the linear scale versus concentration on the logarithmic scale.A four parameter function is used for curve fitting.
Total Aβ42 levels in CSF
For determination of total Aβ42 levels in CSF, the CSF is heat treated to remove interfering MEDI1814 prior to ELISA analysis. The heat treatment precipitates proteins, including antibodies (e.g., MEDI1814) and thereby destroys their binding properties, while peptides (e.g. Aβ42) remain unaffected. This was performed by adding 50μL of CSF to each well of an uncoated polypropylene 96-well plate which is then covered with a heat resistant plate sealer and incubated at +99°C for 10 min. After cooling the plate on ice for 5 min, 200μL sample diluent is added to each well with CSF (5 times dilution). Determination of Aβ42 is performed using the human β-Amyloid 1–42 ELISA kit (80177 RUO, Innogenetics). One-hundred μL (100μL) of standard, QC sample and diluted CSF samples are loaded in duplicate to the antibody coated plate from Innogenetics. The ELISA analysis is performed according to the manufactures instructions (as described above). A schematic illustration of the assay set up is in Fig. 1B.
Total Aβ42 levels in plasma
For determination of total Aβ42 levels in plasma, magnetic beads (Dynabeads M-280 sheep anti mouse IgG; Invitrogen, 11202D) coated with the 6E10 antibody (which binds the N-terminal of Aβ; SIG-39320 Covance) are used to IP all forms of Aβ: bound to MEDI1814 and free. The coupling of 6E10 to magnetic beads is performed after washing the Dynabeads with PBS (PBS wo Ca/Mg, Gibco by Life technologies, 14200-067), with 0.1% BSA (Sigma Aldrich, A7906) and then incubating 4μg 6E10 antibodies/50μl beads with gentle tilting for 24 h at +4−8°C. Beads are washed once with wash buffer before use. For IP of total Aβ42 in plasma, 250μL beads are added to an Eppendorf tube (1.5 mL Safe-lockTM Tube, 0030 120.086, Eppendorf). The tube is placed on a magnet and the supernatant is removed before the beads are mixed with 200μL plasma sample, using a vortex, followed by incubation for 10 min at room temperature on a HulaMixerTM (15920D, Invitrogen). The tubes are placed on a magnet (Dynamag-2 Magnet, 12321D, Life Technologies) for 2 min and the supernatant is discarded. The subsequent heat treatment of the IP will denature the proteins and thereby destroy the binding properties of MEDI1814 while peptides (e.g., Aβ42) will remain unaffected. This step is performed by adding 300μL standard diluent (from the ELISA kit, 1.25 times dilution) followed by incubation at +99°C for 10 min. The tubes are placed on ice for 5 min, mixed using a vortex, and then placed on the magnet for 2 min. The supernatant is collected for Aβ42 analysis. The quantification of total Aβ42 is performed using the human β-Amyloid 1-42 ELISA kit (80177 RUO, Innogenetics). One-hundred μL (100μL) of standard, QC sample, and IP samples (analyzed at several separate dilutions to ensure data within the calibration curve) are loaded in duplicate to the antibody coated plate from Innogenetics. The ELISA analysis is performed according to the manufacturer’s instructions (as described above). A schematic illustration of the assay set up is in Fig. 1C.
Aβ40 levels in CSF
The Aβ40 analysis is performed using the High Sensitivity Human Amyloid β40 ELISA kit (Merck Millipore, EZHS40). The ELISA analysis is performed according to the manufacturer’s instructions. Briefly, 50μL of the antibody conjugate working solution is added to each well in the ELISA plate followed by the addition of 50μL of Calibration samples, QC samples, and CSF (10 times dilution in sample diluent). The plate is covered with plate sealer, mixed for 5 min on an orbital shaker (800 rpm/min) and incubated without shaking over night at +2−8°C. Each well is washed with 5×300μL wash buffer followed by the addition of 100μL of Enzyme Conjugate Working Solution. The plate is covered and incubated for 30 min at room temperature on an orbital shaker (800 rpm/min). After washing with 5×300μL wash buffer, 100μL Substrate Solution is added to each well. The plate is covered, incubated on a plate shaker for 5–20 min and then the reaction is stopped by adding 100μL Stop Solution. The absorbance is read at 450 nm (590 nm as reference). The Soft Max Pro 5.2 software is used to evaluate the data. Quantification is performed by plotting the response of the standard curve as absorbance unit on the linear scale versus concentration on the logarithmic scale. A four parameter function is used for curve fitting.
Method validation of drug-tolerant assays
We performed a validation to evaluate the performance of the drug-tolerant biomarker assays (specific pre-treatment steps followed by Innogenetics Aβ1-42 ELISA analyses) with emphasis on within plate imprecision, dilution linearity, drug tolerance, recovery after pre-treatment and spike recovery. The validation was performed using CSF or plasma samples spiked with Aβ1-40 (AmericanPeptide, 62-0-78) or Aβ1-42 (rPeptide A-1163-1), with or without MEDI1814 at various concentrations (please see below).
Calibration curve and high and low limit of quantification
Validation was performed to produce fit-for purpose assays (according to internal standards) and acceptance criteria were pre-specified. The coefficient of variation (CV) for paired measurements (duplicates) was ≤25% for acceptance (calibrators, QC samples, and test samples). Back calculated concentrations for calibrators should be within ±20% of their theoretical concentration (±25% at lower limit of quantification (LLOQ) and higher limit of quantification (HLOQ)) to be accepted. For each calibration curve, at least five calibration standards need to be approved. The LLOQ and HLOQ is determined for each plate and is defined as the lowest calibration standard within the acceptance criteria.
Within plate precision
Within plate precision was calculated from the analyses of three individual samples (CSF or plasma) and three replicates at one occasion.
Dilution linearity
Dilution linearity was assessed by comparing two or more different dilutions using pooled and/or individualsamples. For the CSF Aβ40 assay, we evaluated a 10-fold and 20-fold dilution using a pool of CSF. For the total Aβ42 plasma assay, we evaluated dilutional linearity at 39, 78, and 155 times dilution in a pool of plasma samples spiked with Aβ1-42 (n = 3). For the total and free CSF Aβ42 assays, we evaluated a 5-fold and a 10-fold dilution in three individual CSF samples.
Drug tolerance
To evaluate drug tolerance, we analyzed samples spiked with different concentrations of Aβ1-42 and MEDI1814 (see Supplementary Tables 1 and 2) where the spiked concentrations of Aβ1-42 and MEDI1814 were based on predictive modelling using data from previous pre-clinical studies (manuscript inpreparation).
Recovery
Recovery after the different pre-treatment steps (heat treatment, IP, or heat treatment followed by IP) was evaluated by comparing measured levels of Aβ42 before and after pre-treatment in individual plasma or CSF samples (n = 6). Spike recovery in the CSF assays was evaluated at two levels (500 and 1000 pg/mL) in three individual CSF samples for total and free Aβ42 and in one pool of CSF for Aβ40 assay. Spike recovery in the total Aβ42 plasma assay was evaluated at six different levels, ranging between 250 pg/mL and 200 ng/mL in a pool of plasma.
In addition, hook effect, cross reactivity, and drift was evaluated and is described below.
Method validation of commercially available ELISAs
We performed a validation to evaluate the performance of the ELISA assays (i.e., Innogenetics Aβ1-42 and Merck Millipore Aβ1-40) with emphasis on within- and between plate imprecision, hook effects, cross reactivity, and drift across the plates. This validation was performed using QC samples at two concentrations (20 and 250 pg/mL for Aβ42, 25 and 250 pg/mL for Aβ40), prepared in sample buffer provided in the ELISA kit.
Within and between plate precision
Within plate precision was calculated from the analyses of six replicates of each QC-sample (in duplicate) at one occasion. Between plate precision was calculated from the same QC samples at six (Innogenetics Aβ1-42) or four (Merck Millipore Aβ1-40) different ELISA plates, at different days, using two different ELISA lots.
Hook effect
Hook effect was evaluated by spiking Aβ42 in buffer up to 50μg/mL or Aβ40 up to 50 ng/mL.
Cross reactivity
Cross reactivity against Aβ1-42 was assessed in the Merck Millipore Aβ1-40 assay by analyzing samples spiked with Aβ40 at 100 pg/mL with or without different high concentrations (up to 50 ng/mL) of Aβ1-42. Cross reactivity against Aβ1-40 was assessed in the Innogenetics Aβ1-42 assay by analyzing samples with different high concentrations (up to 50 ng/mL) of Aβ1-40.
Drift
Finally, drift was assessed by analyzing QC samples at either end of the plate at five occasions (Innogenetics Aβ1-42) or by running the standard curve at both ends of the plate (Merck Millipore Aβ1-40).
Non-human primate samples
In the GLP toxicology study, male and female cynomolgus monkeys (Macaca fasicularis) were dosed with 0, 10, or 100 mg/kg of MEDI1814 (n = 5/sex/group) by 14 weekly intravenous doses followed by a 9 week treatment-free period (n = 2/sex/group) (manuscript in preparation). The study was conducted in compliance with ICH (International Conference on Harmonization of Technical Requirements for Registration of Pharmaceuticals for Human Use) (M3- Guidance on nonclinical safety studies for the conduct of human clinical trials and marketing authorization for pharmaceuticals, S4- Duration of chronic toxicity testing in animals (rodent and non-rodent toxicity testing), S6- Preclinical safety evaluation of biotechnology-derived pharmaceuticals and S3a- Note for guidance on toxico kinetics: the assessment of systemic exposure in toxicology studies), and EMA (European Medicines Agency) guideline on repeated dose toxicity (CPMP/SWP/1042/99) as well as GLP regulations. The biomarker analysis was added as an exploratory readout in this GLP toxicology study, hence the actual biomarker analyses were performed according to internal standards which were in the spirit of GLP.
Non-human primate CSF
CSF was sampled at termination (n = 6, 3/sex) and all samples were analyzed. The CSF was sampled from the cisterna magna and collected into pre-chilled polypropylene Eppendorf tubes (0.5 mL capacity, polypropylene) and immediately put on ice. Samples were centrifuged within 20 min from sampling at 1,800 g for 10 min, refrigerated at approximately +4°C, and transferred into pre-chilled Matrix tubes, 1.4 mL polypropylene (Thermo Scientific 4140). The CSF sample aliquots were snap–frozen on dry ice and stored immediately at −70 to −90°C pending analysis. The time between the end of centrifugation and snap–freezing in dry ice did not exceed 10 min.
Non-human primate plasma
Blood, sampled at eight different time points during the treatment period and four times during the treatment-free period, was sampled from the femoral vessels and collected into tubes with K2-EDTA, placed on ice and then centrifuged at 1,760 g at +4°C for 10 min, within 20 min after blood collection. Plasma was transferred into pre-chilled Matrix tubes, 1.4 mL polypropylene (Thermo Scientific 4140) and the plasma sample aliquots were snap-frozen on dry ice and stored immediately at −70 to −90°C pending analysis. For comparison between drug tolerant assays and the commercial ELISA, a subset of samples were analyzed; five out of 10 in the 0 and 100 mg/kg group and four out of six in the 10 mg/kg group.
RESULTS
Method validation of drug-tolerant assays
Calibration curve and high and low limit of quantification
Based on the performance of the calibration standards and using our acceptance criteria the LLOQ for the free and total Aβ42 in CSF and total Aβ42 in plasma was set to 16 pg/mL (n = 2 plates) and 8 pg/mL (n = 6 plates) using two different ELISA lots. The high limit of quantification (HLOQ) was set to 519 pg/mL (n = 8 plates) (Supplementary Table 3). Dilution and assay range is assay specific and they are presented in Table 1.
Within plate precision
Our data demonstrate a within plate precision <15% for all assays (Table 1) using appropriate matrices (i.e., plasma or CSF).
Dilution linearity
Our data shows that there was less than 12% deviation in our CSF-assays where two different dilutions were compared. The deviation in our plasma assay was at or below 22% (Table 1). Dilution linearity was furthermore investigated in samples from the treatment study, both in CSF and plasma samples. There was less than 3% deviation in study samples comparing 50 and 100 times dilution in the total CSF assay, and less than 22% deviation comparing 194 and 970 times dilution in the total plasma assay.
Drug tolerance
Drug tolerance of our assays was evaluated using the appropriate matrices. The CSF assays were shown to tolerate up to 4μg/mL (free Aβ42) or 5μg/mL (total Aβ42 and Aβ40) of MEDI1814 and up to 5 mg/mL in the plasma assay. Data are summarized in Table 1. Detailed validation data from drug tolerance is presented in Supplementary Tables 1 and 2.
Recovery
The pre-treatment (IP, heat treatment, or IP combined with heat treatment) did not affect the recovery of Aβ42 as shown by recovery and spike recovery data. Recovery data for each assay is presented in Table 1.
The effect window was calculated using information on endogenous levels in untreated animals and the analyses range of the assay (Table 1).
Method validation of commercially available ELISAs
Table 2 summarizes the validation data of the commercially available ELISA without pre-treatment steps.
Within- and between plate precision
Within- and between plate precision was shown to be at or below 15% and 16% for the Aβ42 ELISA, respectively. For the Aβ40 ELISA, the within plate precision was at or below 3% and the between plate at or below 4% . Data are shown in Table 2.
Hook effect
A hook effect in the Aβ42 ELISA highlights the need for analyzing samples at more than one dilution at the expected levels above 5 ng/mL of Aβ42. No hook effect up to 50 ng/mL was seen in the Aβ40 ELISA (Table 2).
Cross reactivity
No cross reactivity was found in the Aβ42 ELISA, evaluating of up to 25 ng/mL Aβ40. For the Aβ40 ELISA, no cross reactivity was seen at levels up to 50 ng/mL of Aβ42.
Drift
Comparing samples at the end of the plate with samples at the beginning, revealed less than 15% deviation in both assays.
Our validation suggests that we have developed robust, specific and accurate assays tolerating predicted clinical exposure concentrations of MEDI1814 and where the efficacy window will allow us to see predicted effects on Aβ42 and Aβ40.
In vivo study
Once the assays were optimized and validated they were applied to the samples from the GLP NHP toxicology study to assess target engagement and PoM. The levels of total Aβ42 measured in samples taken on day 94 increased 3,061-fold in plasma in the 100 mg/kg group and 1,512-fold in the 10 mg/kg group (Fig. 2A). The levels of total Aβ42 in CSF taken at the end of the study increased 8-fold and 4-fold, respectively (Fig. 2B). These data provide compelling evidence that the therapeutic antibody binds to its target and potentially prevents it from further aggregation. Analyzing free levels of Aβ42 in CSF resulted in a 95% and a 96% reduction at termination in the 100 and 10 mg/kg group, respectively (Fig. 2C), providing evidence for the mechanism of action (i.e., lowering of unbound Aβ42). No effect was seen on levels of Aβ40 in CSF showing the specificity to Aβ42 of the therapeutic antibody (Fig. 2D).
Quality control was performed during the study analysis. The CSF samples were analyzed at two different occasions where samples from the treatment-period and washout period was analyzed separately. No drift over the plates (<10% deviation of found concentration at the end of the plate compare to at the beginning) were shown by buffer QC samples analyzed at two different concentrations at either end of the plates (Supplementary Tables 4–6). In two of the 26 CSF samples analyzed for free Aβ42, the IP was not complete (i.e., there was still detectable human IgG levels in the supernatant after the IP) and the free Aβ42 data was consequently not reported from these animals. The performance of heat treatment in the total Aβ42 CSF assay was successfully shown by complete removal of the interfering effect of MEDI1814 (Table 3).
The plasma samples were analyzed at 19 different ELISA plates. Buffer QC samples analyzed at two concentration levels at each plate demonstrated good between plate precision (CV <10% ) (Supplementary Table 7). Two different batches of 6E10 coated beads were used for the collection of total Aβ42 from plasma in the study samples, and the performance test of the beads showed complete removal of the interfering effect of MEDI1814 (Table 4).
To be able to compare data generated by the drug-tolerant assay (including the internally developed pre-treatment steps) to data generated excluding the pre-treatment steps, we also analyzed the samples (second aliquot, no freeze-thaw) from the same NHP toxicology study using the ELISA assays. Levels of plasma Aβ42 were reduced by 91% in both groups (Fig. 3A) and CSF Aβ42 was reduced by 91% (100 mg/kg) and 90% (10 mg/kg) (Fig. 3B).
DISCUSSION
We present a novel approach for the development of drug-tolerant antibody-based assays to monitor target engagement (total Aβ42) and PoM (free Aβ42) in the presence of a therapeutic antibody. Assays were then applied to samples from a pre-clinical toxicology study in NHP. Peripheral and central target engagement was demonstrated by the 3,000-fold increase in plasma total Aβ42 and the 8-fold increase in CSF, at the highest dose at termination (day 94). Central PoM was demonstrated by the 96% reduction of free Aβ42 in CSF. No effect was seen on CSF Aβ1-40 providing evidence for the specificity of the therapeutic antibody to Aβ42. Our data agree well with the PK/PD modeled predictions and previous pre-clinical pharmacology results (manuscript in preparation) which corroborates the accuracy of our measurements. Together, these data provide confidence that the therapeutic antibody binds to its target specifically as well as confirming that binding its target leads to reduction of free Aβ42, the pathologically relevant peptide.
The importance of thorough validation, to ensure that assays are fit for purpose, was demonstrated by analyzing the same samples from the NHP toxicology study using commercially available ELISA assays with no pre-treatment steps. Using these assays, we were not able to differentiate between target engagement (total) and PoM (free) in CSF. In addition, and in contrast to the data obtained with our validated assay, the change in plasma Aβ42 was not dose-dependent and was difficult to interpret. A reduction of Aβ42 by 91% was achieved in CSF, suggesting near complete interference of the therapeutic antibody in this assay. Based on previous knowledge, interference of an antibody is not only highly dependent on the affinity of the antibody but may also depend on the exposure levels. High affinity antibodies will most likely interfere in the assay near 100% and free levels of Aβ will thus be measured. However, this interference may not be linear over different concentrations and even though subjects within a group are given the same dose, the exposure may vary, especially if a clearing anti-drug-antibody response is provoked. In early clinical single ascending dose studies (Phase 1), the dose given is intentionally increased between the different cohorts and this assay set up would be unable to detect group differences. If the affinity of the therapeutic antibody on the other hand is sub optimal, incomplete interference is likely and the result will be neither “total” nor “free”. For correct interpretation of the data, it is important to investigate thoroughly whether interference is present or not.
In the paper by Lachno et al., they have generated a “Solanezumab tolerant” assay measuring total Aβ1-40 or Aβ1-42 where the therapeutic antibody has been added in excess to all samples [9]. With this approach a “total” method resistant to different doses is also produced. However, in our experience, this approach is not feasible to support target engagement and PoM in toxicology studies where the exposure levels are much higher. We believe having a general assay set up that can be applied on both pre-clinical and clinical studies strengthens the translation between pre-clinical and clinical data. The biomarker strategy for the Bapineuzumab antibody is somewhat different and progression of the molecule was more dependent on cognition as a biomarker. The assay used to monitor Aβ42 in the Bapineuzumab Phase II trial was composed of 3D6 as capture antibody together with a C-terminal detecting antibody. 3D6 is the parent antibody of Bapineuzumab which makes it likely that Bapineuzumab interferes in the assay. No effect on Aβ42 in CSF is presented [10] although exposure in the CSF is reported to be 0.3% of plasma. This lack of effect on Aβ42 in CSF could be to due various reasons. The affinities for soluble Aβ42 may be too low and/or the antibody exposure in brain is too low, hence the lack of evidence for target engagement centrally. Or, there is some kind of interference in the assay, masking the effect. The first alternative is supported by the lack of effect on Aβx - 42 and Aβx - 40 where different capture antibodies are used. However, an effect on brain amyloid was reported [11]. Since no interference test or validation of the assays has been published, this can only be speculated on. Although target engagement, measured by total Aβ in CSF, was not seen, effects on total tau and p-tau (tau phosphorylated at 181) were reported. To our knowledge, there were no biomarker analyses to confirm target engagement in CSF in the Phase III trial, but effects on amyloid PET and total-tau in CSF were explored [12]. The relationship between these different biomarkers is still unclear in the context of the therapeutic intervention. These observations highlight the importance of performing and publishing the validation steps in order to ensure correct interpretation of the data.
In another study with the therapeutic antibody GSK933776 which binds to the N-terminal of Aβ, total CSF levels of Aβ42 were reported to decrease in patients with mild AD [13]. In this study, levels of Aβ42 were measured using the Innogenetics kit but where the detecting antibody 3D6 was replaced by 3D5 which binds amino acid 1 of Aβ. In the paper, it is only stated that there is no interference since the therapeutic antibody binds a separate epitope compared to 3D5. It may very well be that this was tested, but the findings were not published. In our experience, theoretical assumptions are not always valid and antibodies may not only interfere with the target antigen but also, unexpectedly, with the secondary antibodies in the ELISA kit.
Attempts have also been made to measure free Aβ. In the paper by Farlow et al., where biomarker effects were evaluated after treatment with Solanezumab, IP using Protein G was used to measure free Aβ [14]. However, no control step for the removal of IgG’s is described. They report a decrease in free Aβ1-40 but an increase in free Aβ1-42. Incomplete removal of Solanezumab may produce inaccurate data. This also emphasizes the need for reporting detailed descriptions of the assays and validation steps in any publication dealing with quantitative biomarker work for the reader to understand the strengths and the limitations of the assays being used.
For the Aβ1-40 analyses, we started to work with one ELISA kit obtained from Life Technologies (KHB3481) and tested interference of the therapeutic antibody as well as cross reactivity to Aβ42 at the very high expected Aβ42 concentrations. Cross reactivity was not seen at physiologically relevant levels of Aβ42 in that assay, as expected, but at high levels of Aβ42, interference was apparent and another Aβ40 ELISA (i.e., Merck) was chosen. In the Life Technologies ELISA, cross reactivity was seen as a false reduction of signal which would have been interpreted as areduction in Aβ40. This strongly supports the importance of performing the validation under circumstances mimicking the future study exposures which highlights the need for accurate model-based predictions. It also suggests that interference testing should be performed in ALL immunoassays applied on study samples where subjects have been treated with therapeutic antibody or vaccine. Even though the therapeutic antibody should not interact with the protein biomarker itself, it may interfere with the secondary antibodies in the ELISA kit and if doses are high, cross reactivity to unexpected antigens may be the result.
In order to fully understand the shift in protein biomarkers and further increase our understanding as we progress passive immunization as a therapeutic approach, we believe it is key to monitor protein biomarker changes with properly validated assays to ensure that assays are fit for purpose. The awareness of the validation aspect has grown in the last years but still needs to be emphasized. We believe that the approach taken in the present study to develop the assays measuring free and total antigen in the presence of a therapeutic antibody is a generally relevant strategy to deal with interference of therapeutic antibodies. The novelty introduced is that we have exploited the heat resistance of peptides. Using these novel assays, we have demonstrated that MEDI1814 is able to engage with its target centrally and, as a consequence, reduce the levels of free CSF Aβ42.
To conclude, we would like to encourage thorough evaluation of antibody interference and reporting of validation in order to disclose any limitations of biomarker assays. This would ensure correct interpretation of biomarker data to support the development of disease modifying immunotherapies for AD.
DISCLOSURE STATEMENT
Authors’ disclosures available online (http://j-alz.com/manuscript-disclosures/14-2988r2).
Appendices
The supplementary material is available in the electronic version of this article: http://dx.doi.org/10.3233/JAD-142988.
REFERENCES
1 | Hardy J, Selkoe DJ(2002) The amyloid hypothesis of Alzheimer’s disease: Progress and problems on the road to therapeuticsScience297: 353356 |
2 | Jonsson T, Atwal JK, Steinberg S, Snaedal J, Jonsson PV, Bjornsson S, Stefansson H, Sulem P, Gudbjartsson D, Maloney J, Hoyte K, Gustafson A, Liu Y, Lu Y, Bhangale T, Graham RR, Huttenlocher J, Bjornsdottir G, Andreassen OA, Jonsson EG, Palotie A, Behrens TW, Magnusson OT, Kong A, Thorsteinsdottir U, Watts RJ, Stefansson K(2012) A mutation in APP protects against Alzheimer’s disease and age-related cognitive declineNature488: 9699 |
3 | Ghosh AK, Brindisi M, Tang J(2012) Developing beta-secretase inhibitors for treatment of Alzheimer’s diseaseJ Neurochem120: Suppl 17183 |
4 | Pettersson M, Stepan AF, Kauffman GW, Johnson DS(2013) Novel gamma-secretase modulators for the treatment of Alzheimer’s disease: A review focusing on patents from 2010 to 2012Expert Opin Ther Pat23: 13491366 |
5 | Mawuenyega KG, Sigurdson W, Ovod V, Munsell L, Kasten T, Morris JC, Yarasheski KE, Bateman RJ(2010) Decreased clearance of CNS beta-amyloid in Alzheimer’s diseaseScience330: 1774 |
6 | Jindal H, Bhatt B, Sk S, Malik JS(2014) Alzheimer disease immunotherapeutics: Then and nowHum Vaccin Immunother10: 27412743 |
7 | Imbimbo BP, Ottonello S, Frisardi V, Solfrizzi V, Greco A, Seripa D, Pilotto A, Panza F(2012) Solanezumab for the treatment of mild-to-moderate Alzheimer’s diseaseExpert Rev Clin Immunol8: 135149 |
8 | Kerchner GA, Boxer AL(2010) BapineuzumabExpert Opin Biol Ther10: 11211130 |
9 | Lachno DR, Evert BA, Vanderstichele H, Robertson M, Demattos RB, Konrad RJ, Talbot JA, Racke MM, Dean RA(2013) Validation of assays for measurement of amyloid-beta peptides in cerebrospinal fluid and plasma specimens from patients with Alzheimer’s disease treated with solanezumabJ Alzheimers Dis34: 897910 |
10 | Blennow K, Zetterberg H, Rinne JO, Salloway S, Wei J, Black R, Grundman M, Liu EInvestigators AAB(2012) Effect of immunotherapy with bapineuzumab on cerebrospinal fluid biomarker levels in patients with mild to moderate Alzheimer diseaseArch Neurol69: 10021010 |
11 | Rinne JO, Brooks DJ, Rossor MN, Fox NC, Bullock R, Klunk WE, Mathis CA, Blennow K, Barakos J, Okello AA, Rodriguez Martinez de Liano S, Liu E, Koller M, Gregg KM, Schenk D, Black R, Grundman M(2010) 11C-PiB PET assessment of change in fibrillar amyloid-beta load in patients with Alzheimer’s disease treated with bapineuzumab: A phase 2, double-blind, placebo-controlled, ascending-dose studyLancet Neurol9: 363372 |
12 | Salloway S, Sperling R, Fox NC, Blennow K, Klunk W, Raskind M, Sabbagh M, Honig LS, Porsteinsson AP, Ferris S, Reichert M, Ketter N, Nejadnik B, Guenzler V, Miloslavsky M, Wang D, Lu Y, Lull J, Tudor IC, Liu E, Grundman M, Yuen E, Black R, Brashear HRBapineuzumab, Clinical Trial I(2014) Two phase 3 trials of bapineuzumab in mild-to-moderate Alzheimer’s diseaseN Engl J Med370: 322333 |
13 | Leyhe T, Andreasen N, Simeoni M, Reich A, von Arnim CA, Tong X, Yeo A, Khan S, Loercher A, Chalker M, Hottenstein C, Zetterberg H, Hilpert J, Mistry P(2014) Modulation of beta-amyloid by a single dose of GSK933776 in patients with mild Alzheimer’s disease: A Phase I studyAlzheimers Res Ther6: 19 |
14 | Farlow M, Arnold SE, van Dyck CH, Aisen PS, Snider BJ, Porsteinsson AP, Friedrich S, Dean RA, Gonzales C, Sethuraman G, DeMattos RB, Mohs R, Paul SM, Siemers ER(2012) Safety and biomarker effects of solanezumab in patients with Alzheimer’s diseaseAlzheimers Dement8: 261271 |
Figures and Tables
Fig.1
A schematic illustration of the assay set up to measure free Aβ42 in CSF (A), total Aβ42 in CSF (B), and total Aβ42 in plasma (C).
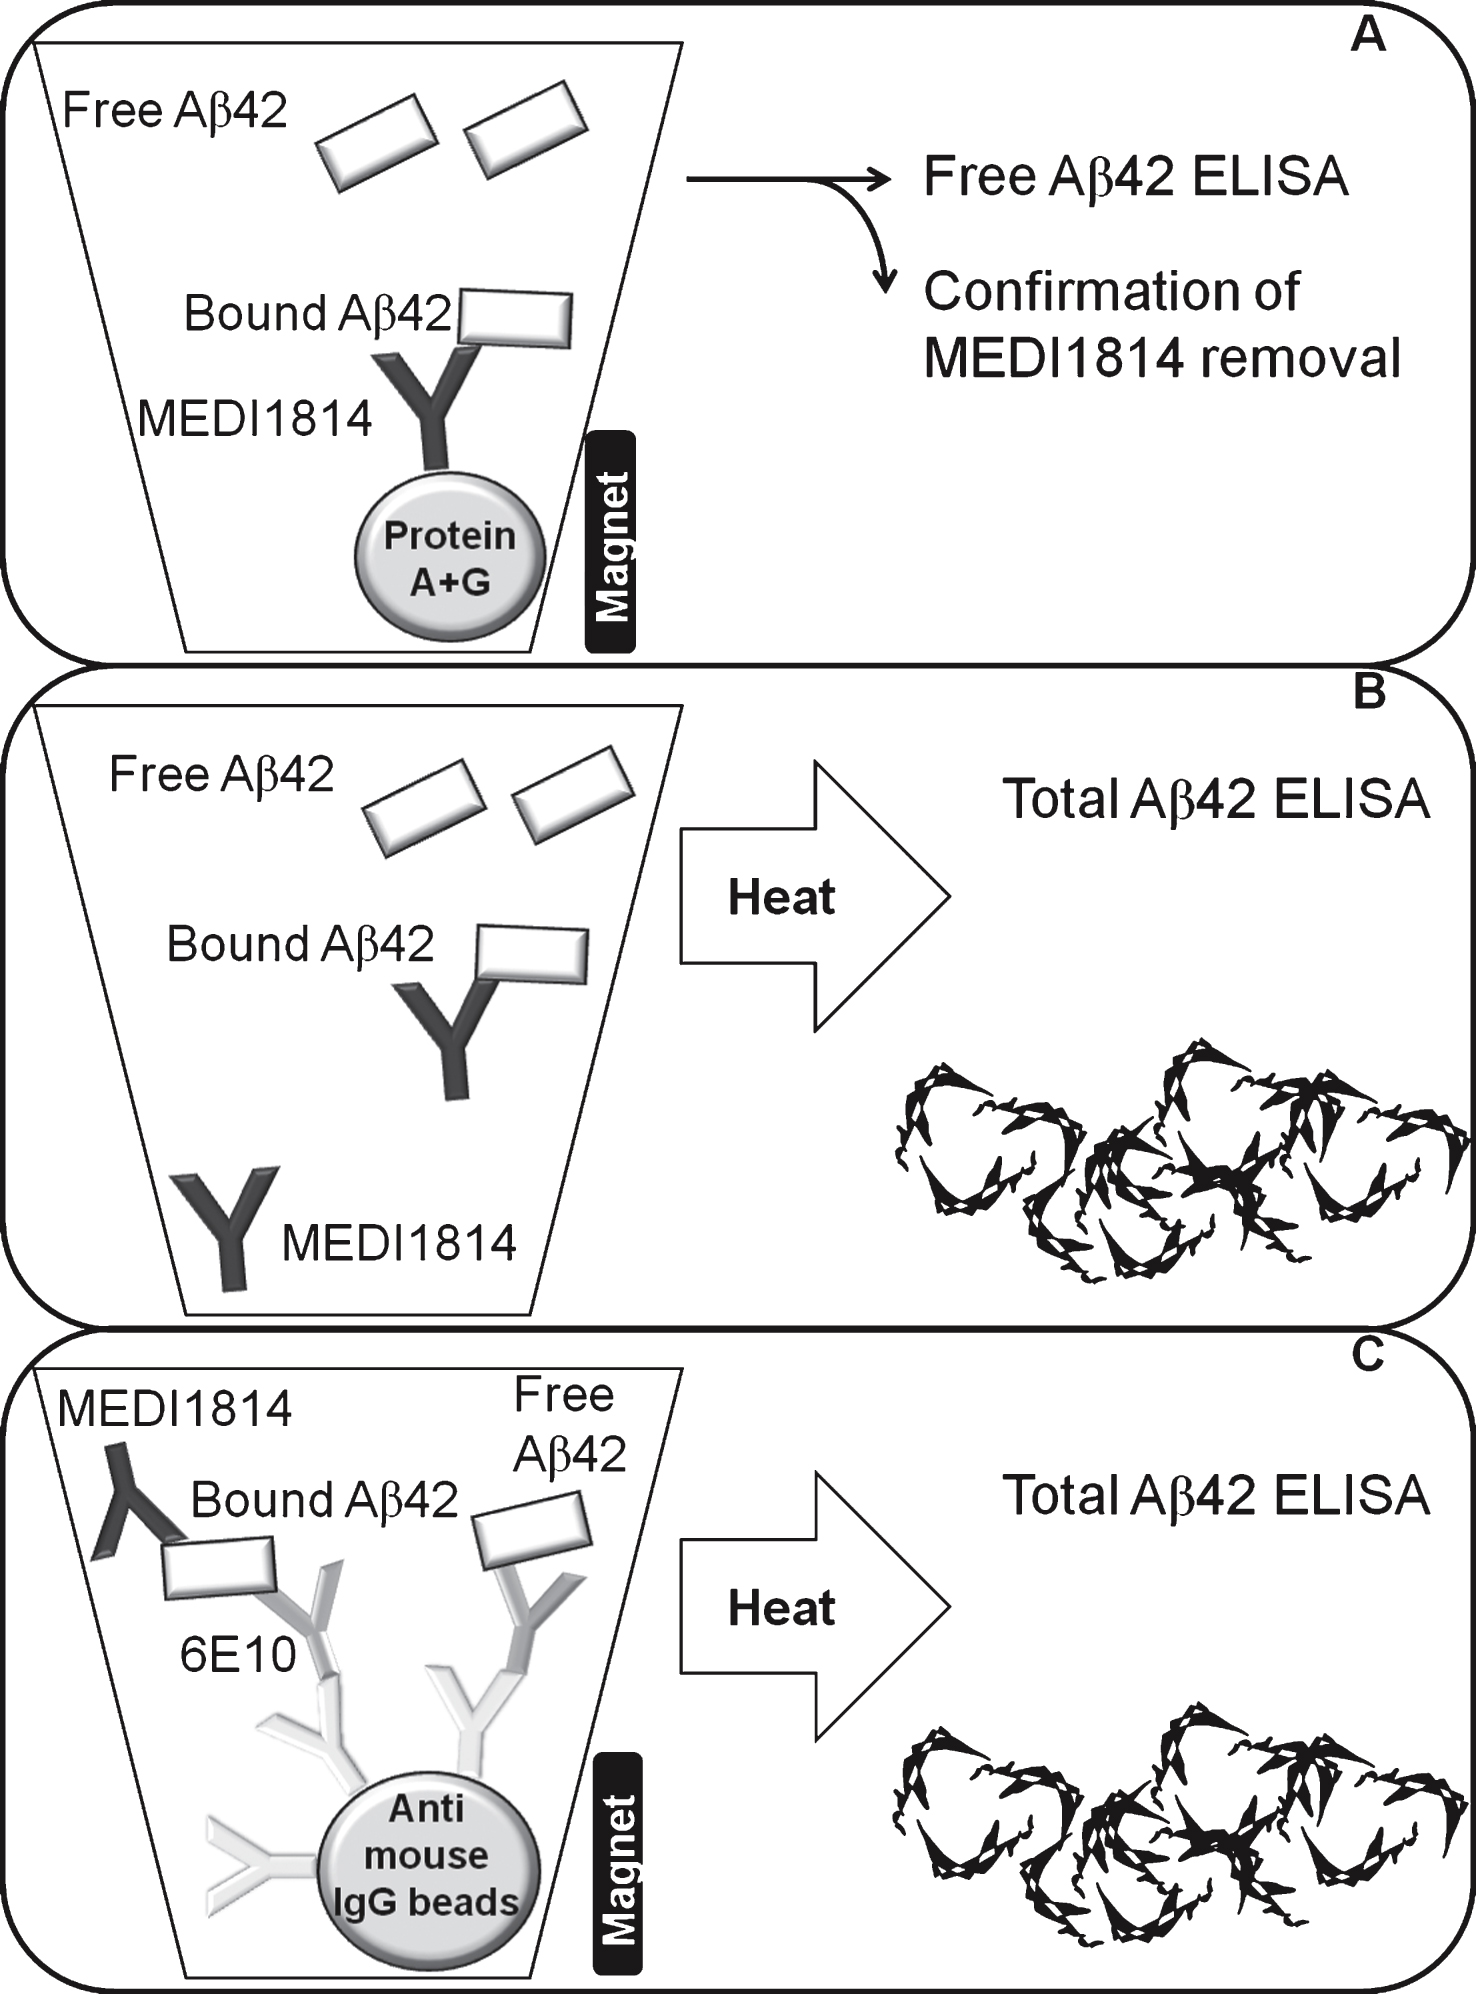
Fig.2
illustrates the increase of total Aβ42 in plasma (A) over time and total Aβ42 in cerebrospinal fluid (CSF) (B), the reduction of free Aβ42 in CSF (C) as well as Aβ40 in CSF (D) at termination, after treatment with 10 mg (grey circle) or 100 mg (closed circle or squares for wash out samples) therapeutic antibody or placebo (open circle or squares for wash out samples). Assessment of Aβ levels were performed using the in house developed and validated assays. wo, wash out samples after last dose (d94).
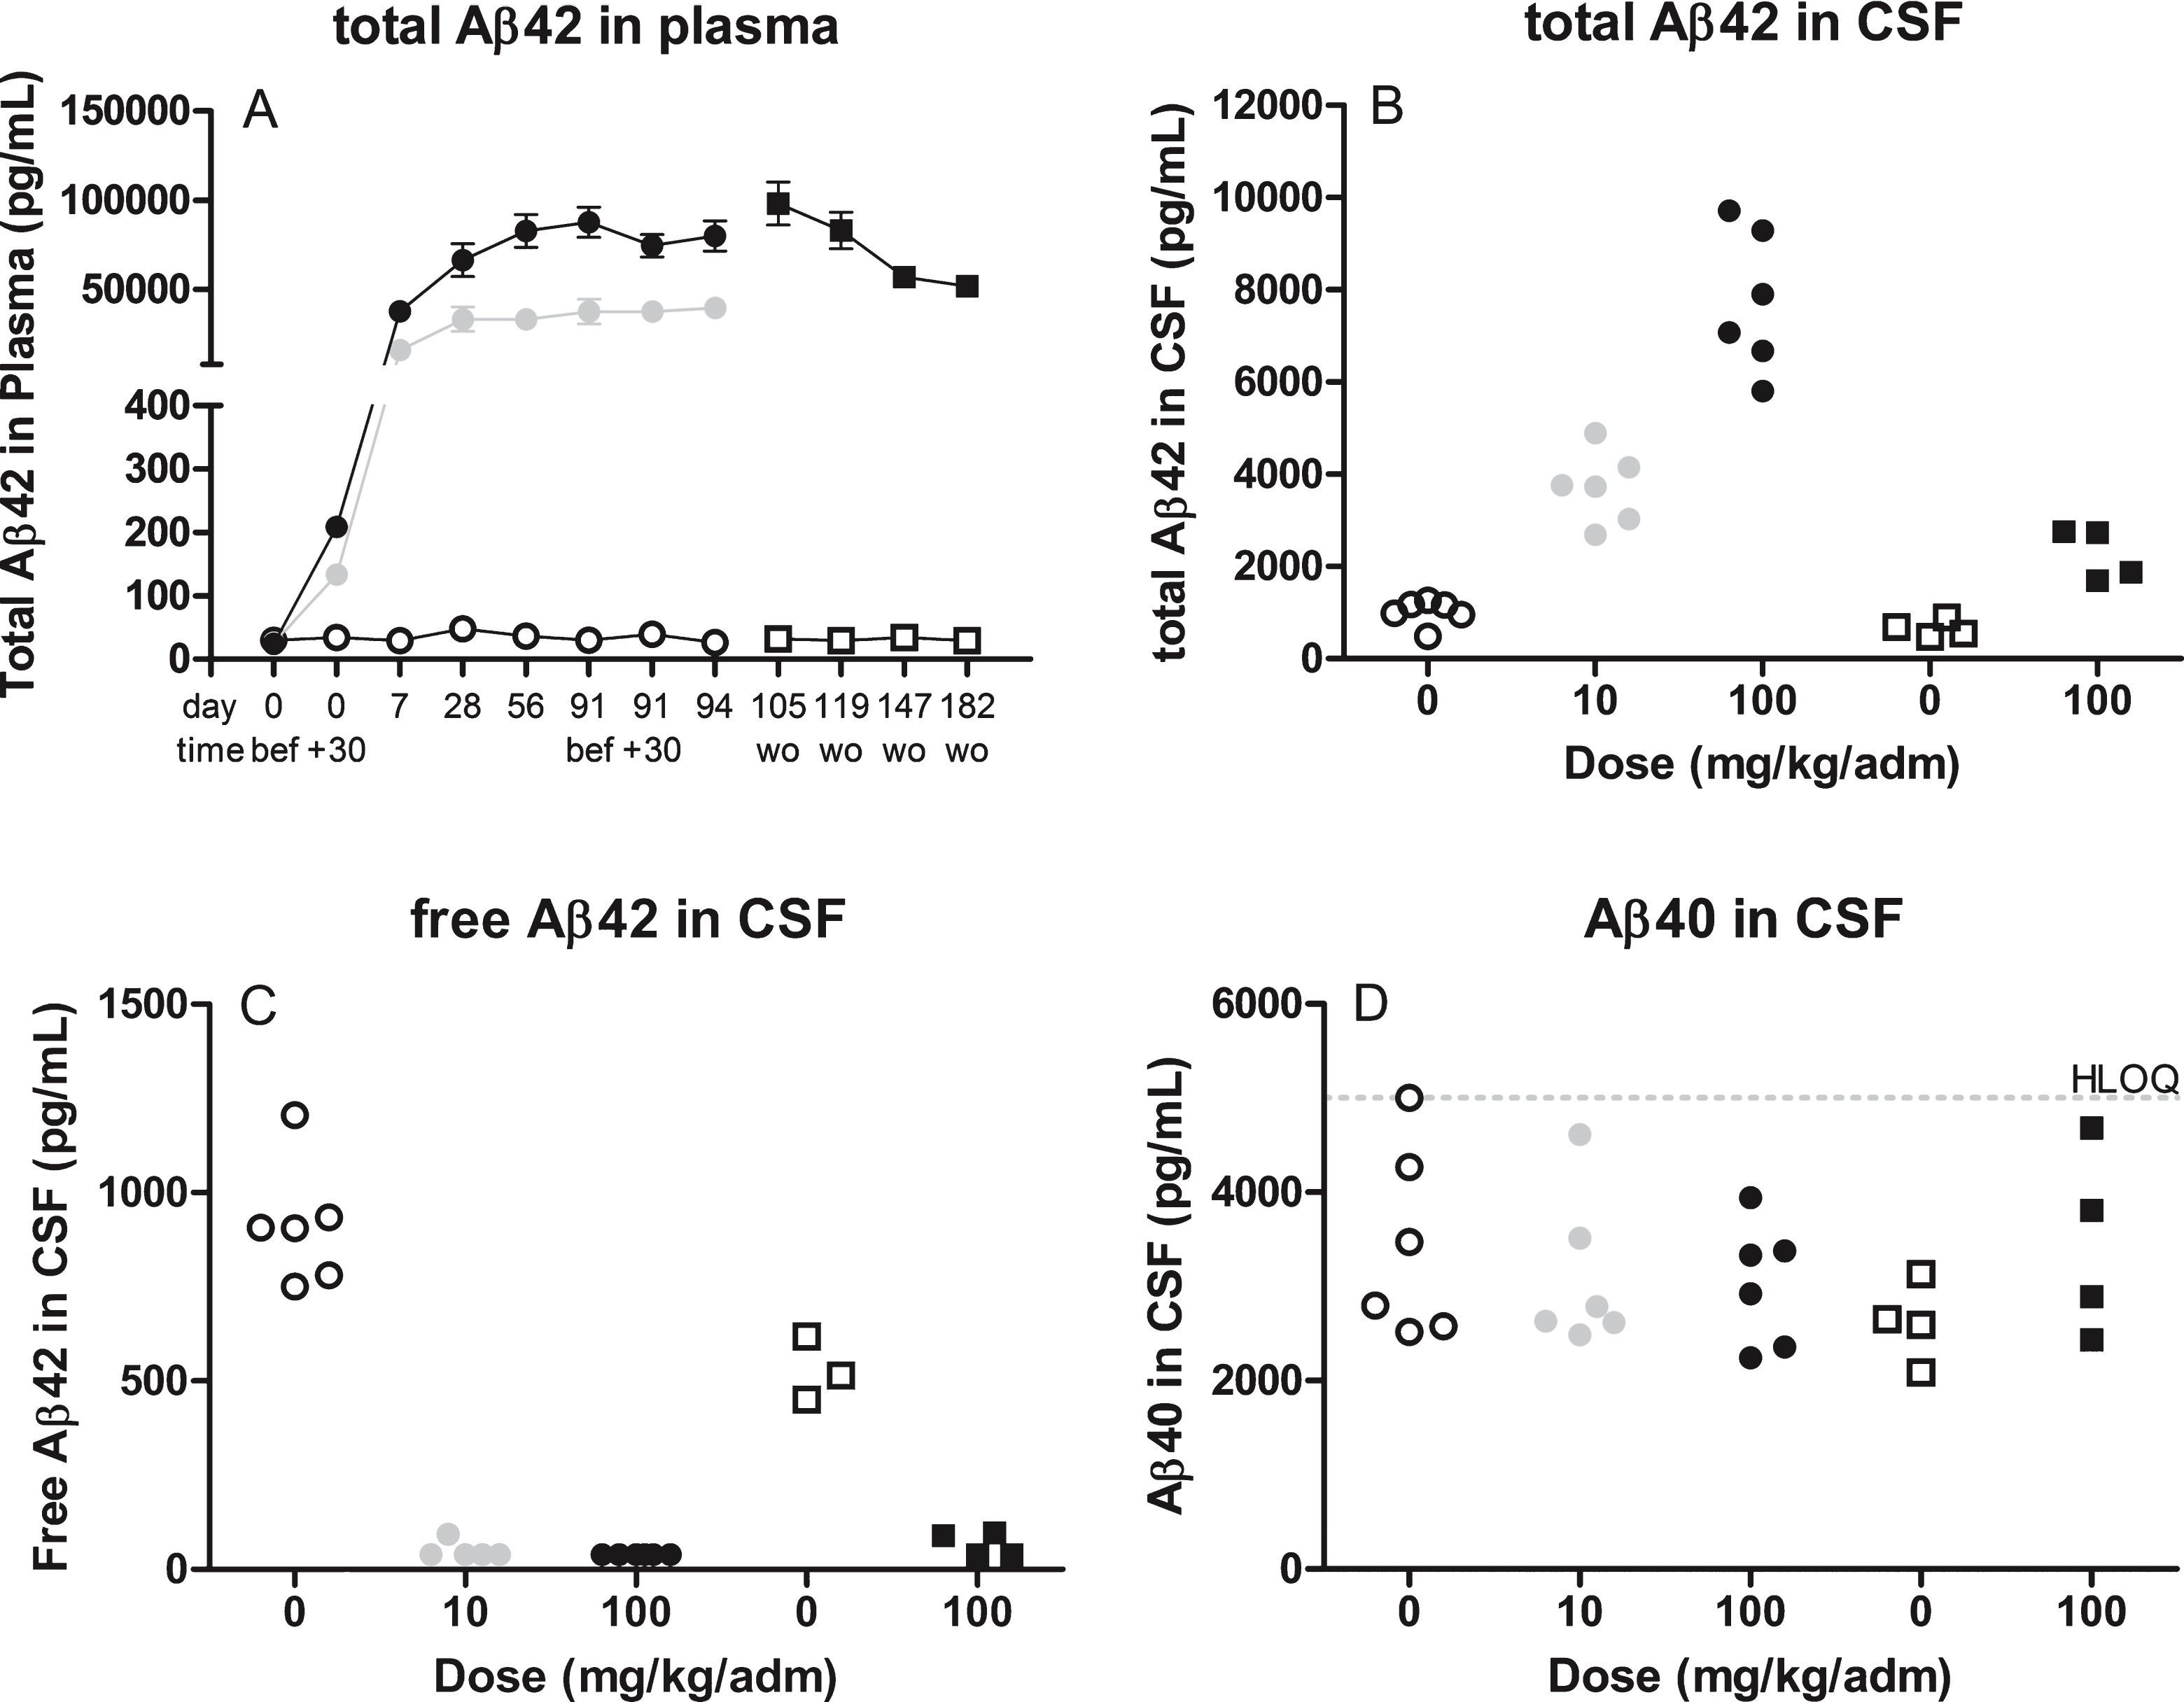
Fig.3
illustrates the levels of Aβ42 in plasma (A) over time or cerebrospinal CSF (B) at termination after treatment with 10 mg (grey circle) or 100 mg (closed circle or squares for wash out samples) therapeutic antibody or placebo (open circle or squares for wash out samples). Assessment of Aβ levels were performed using commercially available assays without prior pretreatment steps. wo, wash out samples after last dose (d94).
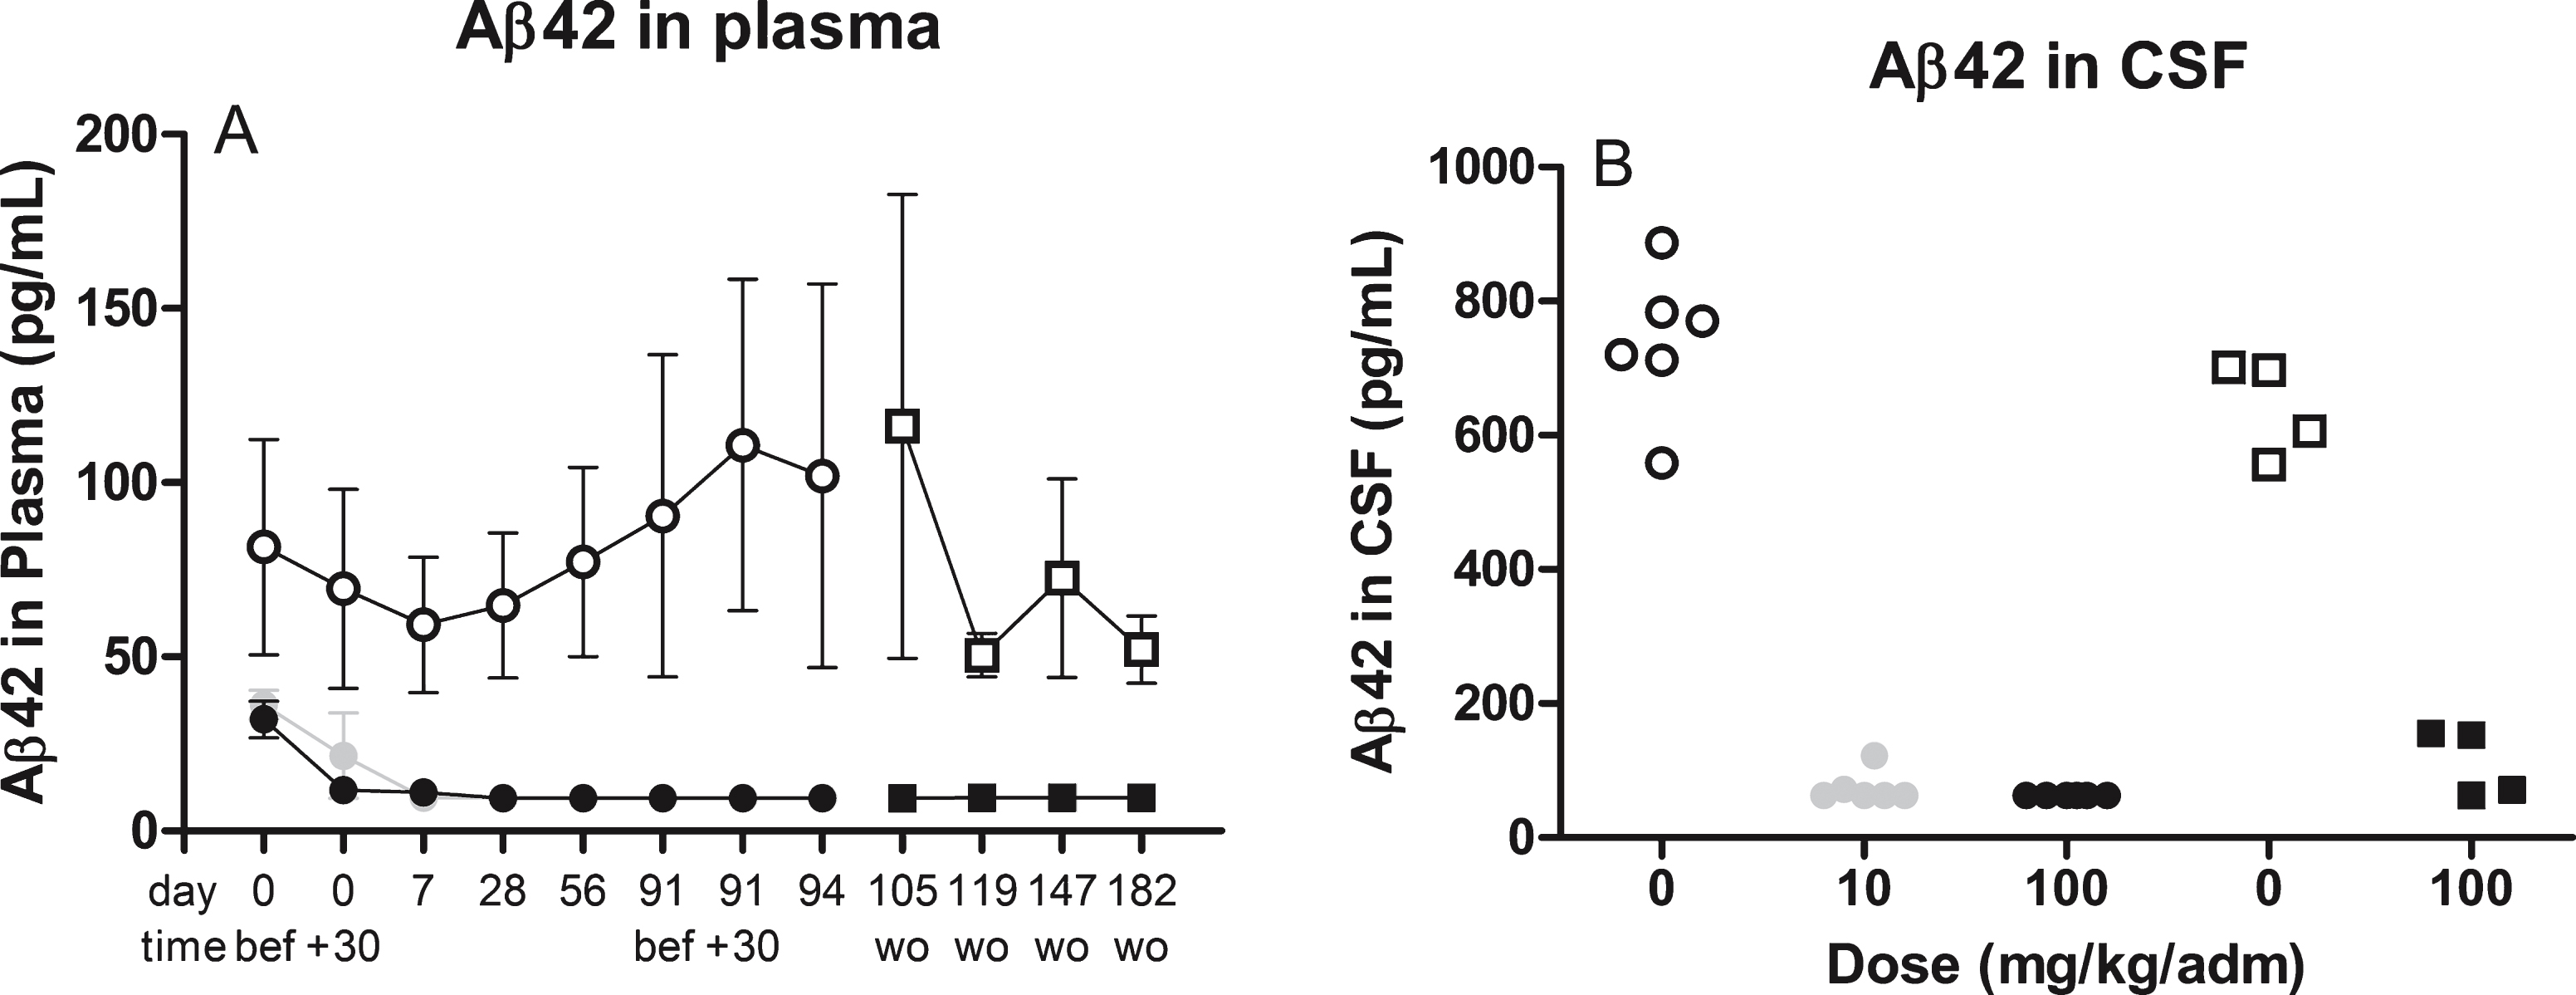
Table 1
Validation characteristics for the complete experimental set up, including pre-treatment steps for the four drug-tolerant assays developed internally
| Validation parameters | Total Aβ42 in CSF | Samples (n) | Free Aβ42 in CSF | Samples (n) | Aβ40 in CSF | Samples (n) | Total Aβ42 in plasma | Samples (n) |
| Pre-treatment | heat-treatment | – | IP | – | no | – | IP+heat | – |
| Levels in untreated | 504–1025 | 6 | 354–1103 | 6 | 1277–3045 | 4 | 27–37 | 6 |
| animals (pg/mL) | ||||||||
| Levels in vehicle | 478–1266 | 10 | 451–1206 | 10 | 2086–5000 | 10 | 12–61 | 56 |
| treated (pg/mL) | ||||||||
| Calibration standard range (pg/mL) | 8–519 | – | 8–519 | – | 16–500 | – | 8–519 | – |
| Dilution factor for plasma/CSF | 5–50 | – | 5 | – | 10 | – | 1,25–970 | – |
| Lower limit of quantification (pg/mL) | 8 | – | 8 | – | 16 | – | 8 | – |
| Sample analysis range (pg/mL)1 | 40–25950 | – | 40–2595 | – | 160–5000 | – | 10–503430 | – |
| Within place imprecision (3 replicates) | ≤11% | 3 | ≤14% | 3 | ≤11% | 3 | ≤12% | 3 |
| Dilutional linearity2 | ≤6% | 3 | ≤9% | 3 | 11% | 1 | ≤22% | 2 |
| Max tested MEDI1814 conc | 5μg/ml | – | 4μg/ml | – | 5μg/mL | – | 5 mg/mL | – |
| Recovery after pre-treatment (average) | 113% | 6 | 102% | 6 | na | – | 74% | 6 |
| Spike recovery (average) | 83% | 5 | 71% | 6 | 96% | 2 | 90% | 7 |
| Effect window3 | ×24 fold increase | – | >88% decrease | – | na | – | ×13605 fold increase | – |
1calculated using calibration standard range×sample dilution. 2deviation between two (CSF) or three (plasma) dilutions. 3calculated using sample analysis range and levels in untreated animals.
Table 2
Validation characteristics for the ELISA assays using quality controls (QC) samples prepared in sample diluent provided by the kit
| Validtion parameters | Aβ42 ELISA | Samples (n) | Aβ40 ELISA | Samples (n) | ||
| QC 20-pg/mL | QC 250 pg/mL | QC 25 pg/mL | QC 250 pg/mL | |||
| Within plate imprecision, CV (% ) | 15 | 8 | 6 | 3 | 2 | 6 |
| Between plate imprecision, CV (% ) | 16 | 5 | 6 | 4 | 6 | 4 |
| Drift across the plate | no drift detected (<13% deviation) | 6 | no drift detected (≤7% deviation) | 6 | ||
| Crossreactivity | no (at <25 ng/mL Aβ40) | – | no (at <50 ng/mL Aβ42 | – | ||
| Hook | hook at >5 ng/mL | – | no hook <50 ng/mL | – | ||
Table 3
The quality control samples for the heat treatment procedure in the assay measuring total Aβ42 in cerebrospinal fluid during the analyses of study samples (n = 2 plates) from the toxicology study in non-human primates (Macaca fasicularis) shows the successful removal of the interference effect of MEDI 1814
| Spiked conc | Treatment | Found Aβ42 conc | ||
| Aβ42 (pg/mL) | MEDI 1814 (μg/mL) | heat | pg/mL | % recovery |
| 2000 | 0 | – | 1720 | 86 |
| 2000 | 2 | – | <390 | <20 |
| 2000 | 2 | + | 1717 | 86 |
Table 4
Quality control test of the two different 6E10-beads batches demonstrated a total removal of the interfering effect of MEDI1814 at a concentration of 5000μg/mL
| Bead batch | NHP plasma spiked conc | Found Aβ42 conc (from spike) | ||||
| Aβ42 | MEDI 1814 | pre-treatment | heat treated | |||
| (pg/mL) | (μg/mL) | pg/mL | % | pg/mL | % | |
| 1 | 20000 | 5000 | <304 | <2 | 17898 | 88 |
| 1 | 20000 | 0 | 16821 | 84 | 17637 | 88 |
| 2 | 20000 | 5000 | <304 | <2% | 19502 | 98 |
| 2 | 20000 | 0 | 22593 | 113 | 19378 | 97 |


