
The Effect of Computerized Cognitive Training, with and without Exercise, on Cortical Volume and Thickness and Its Association with Gait Speed in Older Adults: A Secondary Analysis of a Randomized Controlled Trial
Abstract
Background:
Slower walking is associated with changes in cortical volume and thickness. Computerized cognitive training (CCT) and exercise improve cortical volume and thickness and thus, may promote gait speed. Slowing of gait is predictive of Alzheimer’s disease.
Objective:
To examine: 1) the effect of CCT, with or without physical exercise, on cortical volume and thickness and; 2) the association of changes in cortical volume and thickness with changes in gait speed.
Methods:
A subset of 124 adults (n = 53), aged 65–85 years, enrolled in an 8-week randomized controlled trial and completed T1-weighted MRI and 4-meter walk at baseline and 8 weeks. Participants were randomized to: 1) active control (BAT; n = 19); 2) CCT (n = 17); or 3) CCT preceded by exercise (Ex-CCT; n = 17). Change in cortical volume and thickness were assessed and compared across all groups using Freesurfer.
RESULTS:
BAT versus CCT increased left rostral middle frontal gyrus volume (p = 0.027) and superior temporal gyrus thickness (p = 0.039). Ex-CCT versus CCT increased left cuneus thickness (p < 0.001) and right post central gyrus thickness (p = 0.005), and volume (p < 0.001). Ex-CCT versus BAT increased left (p = 0.001) and right (p = 0.020) superior parietal gyri thickness. There were no significant between-group differences in gait speed (p > 0.175). Increased left superior parietal volume (p = 0.036, r = 0.340) and thickness (p = 0.002, r = 0.348), right post central volume (p = .017, r = 0.341) and thickness (p = 0.001, r = 0.348), left banks of superior temporal sulcus thickness (p = 0.002, r = 0.356), and left precuneus thickness (p < 0.001, r = 0.346) were associated with increased gait speed.
CONCLUSIONS:
CCT with physical exercise, but not CCT alone, improves cortical volume and thickness in older adults. These changes may contribute to the maintenance of gait speed in aging.
INTRODUCTION
Gait speed is the “6th vital sign” in older adults as it predicts functional status and general health outcomes [1]. Low gait speed is significantly correlated with decreased survival rates compared with older adults with higher gait speed [2]. Notably, gait speed is a valid, reliable and sensitive measure in both clinical and research settings [1].
Changes in gait speed are associated with changes in cognitive function, brain morphometry (i.e., volume and thickness), and brain function. Evidence suggests these associations are bidirectional. For example, slowing of gait speed is predictive of mild cognitive impairment [3] and Alzheimer’s disease [4] while smaller volumes of hippocampus, total gray matter, parietal gray matter, parietal white matter, temporal gray matter, and temporal white matter is predictive of slowing of gait speed over 4 years [5]. Global cortical thickness and region-specific cortical thickness (e.g., precuneus and precentral gyrus) is associated with factors contributing to gait speed (i.e., gait rhythm, pace, gait symmetry and gait variability) [6, 7]. Thus, maintaining brain volume and cortical thickness may be critical in preserving gait speed in older adults.
Randomized controlled trials (RCT) show that physical exercise can maintain or improve brain morphometry [8, 9]. Structured aerobic exercise, including walking, is shown to increase hippocampal volume [9–11]. Lower hippocampal volume is associated with lower gait speed [12]. Observationally, longer daily physical exercise duration is associated with increased global cortical thickness [13]. A 6-month pilot study showed that structured physical exercise increased cortical thickness in the pericalcarine area, left superior parietal, rostral middle frontal, and lateral occipital gyri [14].
Systematic review and RCT studies provide evidence which shows that computerized cognitive training (CCT) may also improve cortical volume [15] and thickness [16]. Over the last two decades there has been exponential growth in research and commercial interest in CCT to improve cognitive outcomes [15]. Computerized cognitive training programs include tasks and games that target specific cognitive processes, such as executive functions and memory [17]. Given the contribution of executive functions to gait speed and performance [18], it has been proposed that CCT could also benefit mobility outcomes such as usual gait speed and dual-task gait speed [19, 20]. A systematic review and meta-analysis of 10 randomized controlled trials showed a small effect of cognitive-based interventions on dual-task gait speed [21], but not usual gait speed, and concluded additional studies are needed.
Combining CCT with physical exercise may magnify benefits for the brain, and thereby, mobility in older adults. However, the effect of CCT, with or without physical exercise, on cortical volume and thickness and their relationship with gait speed is not well examined.
The objective of this study is to determine if CCT, with or without physical exercise, promotes changes in cortical volume and thickness, and if those changes are related to changes in usual gait speed. We hypothesized that combining CCT with physical exercise would increase cortical volume and thickness more than CCT alone or an active control. We also hypothesized that increases in cortical volume and thickness will be associated with increases in gait speed.
METHODS
Ethical approval
Ethics was approved by the University of British Columbia Clinical Research Ethics Board (H14-02438) and Vancouver Coastal Health Research Institute (V14-02438) ethics board. All participants provided written informed consent prior to study enrollment.
Study design
This is a secondary analysis of an 8-week, 3-arm RCT in which 124 participants were enrolled and randomized to: 1) Balanced on Toned (BAT; active control; n 41), 2) CCT (n = 41), or 3) Physical exercise plus CCT (Ex-CCT; n = 42). The study is registered at ClinicalTrials.gov (NCT02564809) [22] and the study protocol [22] and primary findings [23] are published.
Participants
Recruitment took place in the Metro Vancouver community through newspaper advertisements, and flyers at local community centres. Recruitment procedures are detailed in the published protocol [22].
The study include those who: 1) were aged between 65 and 85 years; 2) completed high school education; 3) lived in their own home; 4) had acceptable visual and auditory acuity and could read, write, and speak English; 5) had preserved general cognitive function indicated by a Mini-Mental State Examination (MMSE) score ≥24/30 [24]; 6) scored > 6/8 on the Lawton and Brody Instrumental Activities of Daily Living Scale [25]; 7) were not on a fixed dose of anti-dementia medications; 8) were able to walk independently; 9) could engage in 15 min of brisk walking based on the Physical Activity Readiness Questionnaire [26]; and 10) provided informed consent. The study excluded those who: 1) were diagnosed with dementia of any type; 2) were clinically suspected to have a neurodegenerative disease; 3) had clinically significant peripheral neuropathy or severe musculoskeletal or joint disease that impaired mobility, as determined by a physician; 4) were taking medications that could negatively affect cognitive function; and 5) were planning to participate, or enrolled in, a concurrent clinical drug trial.
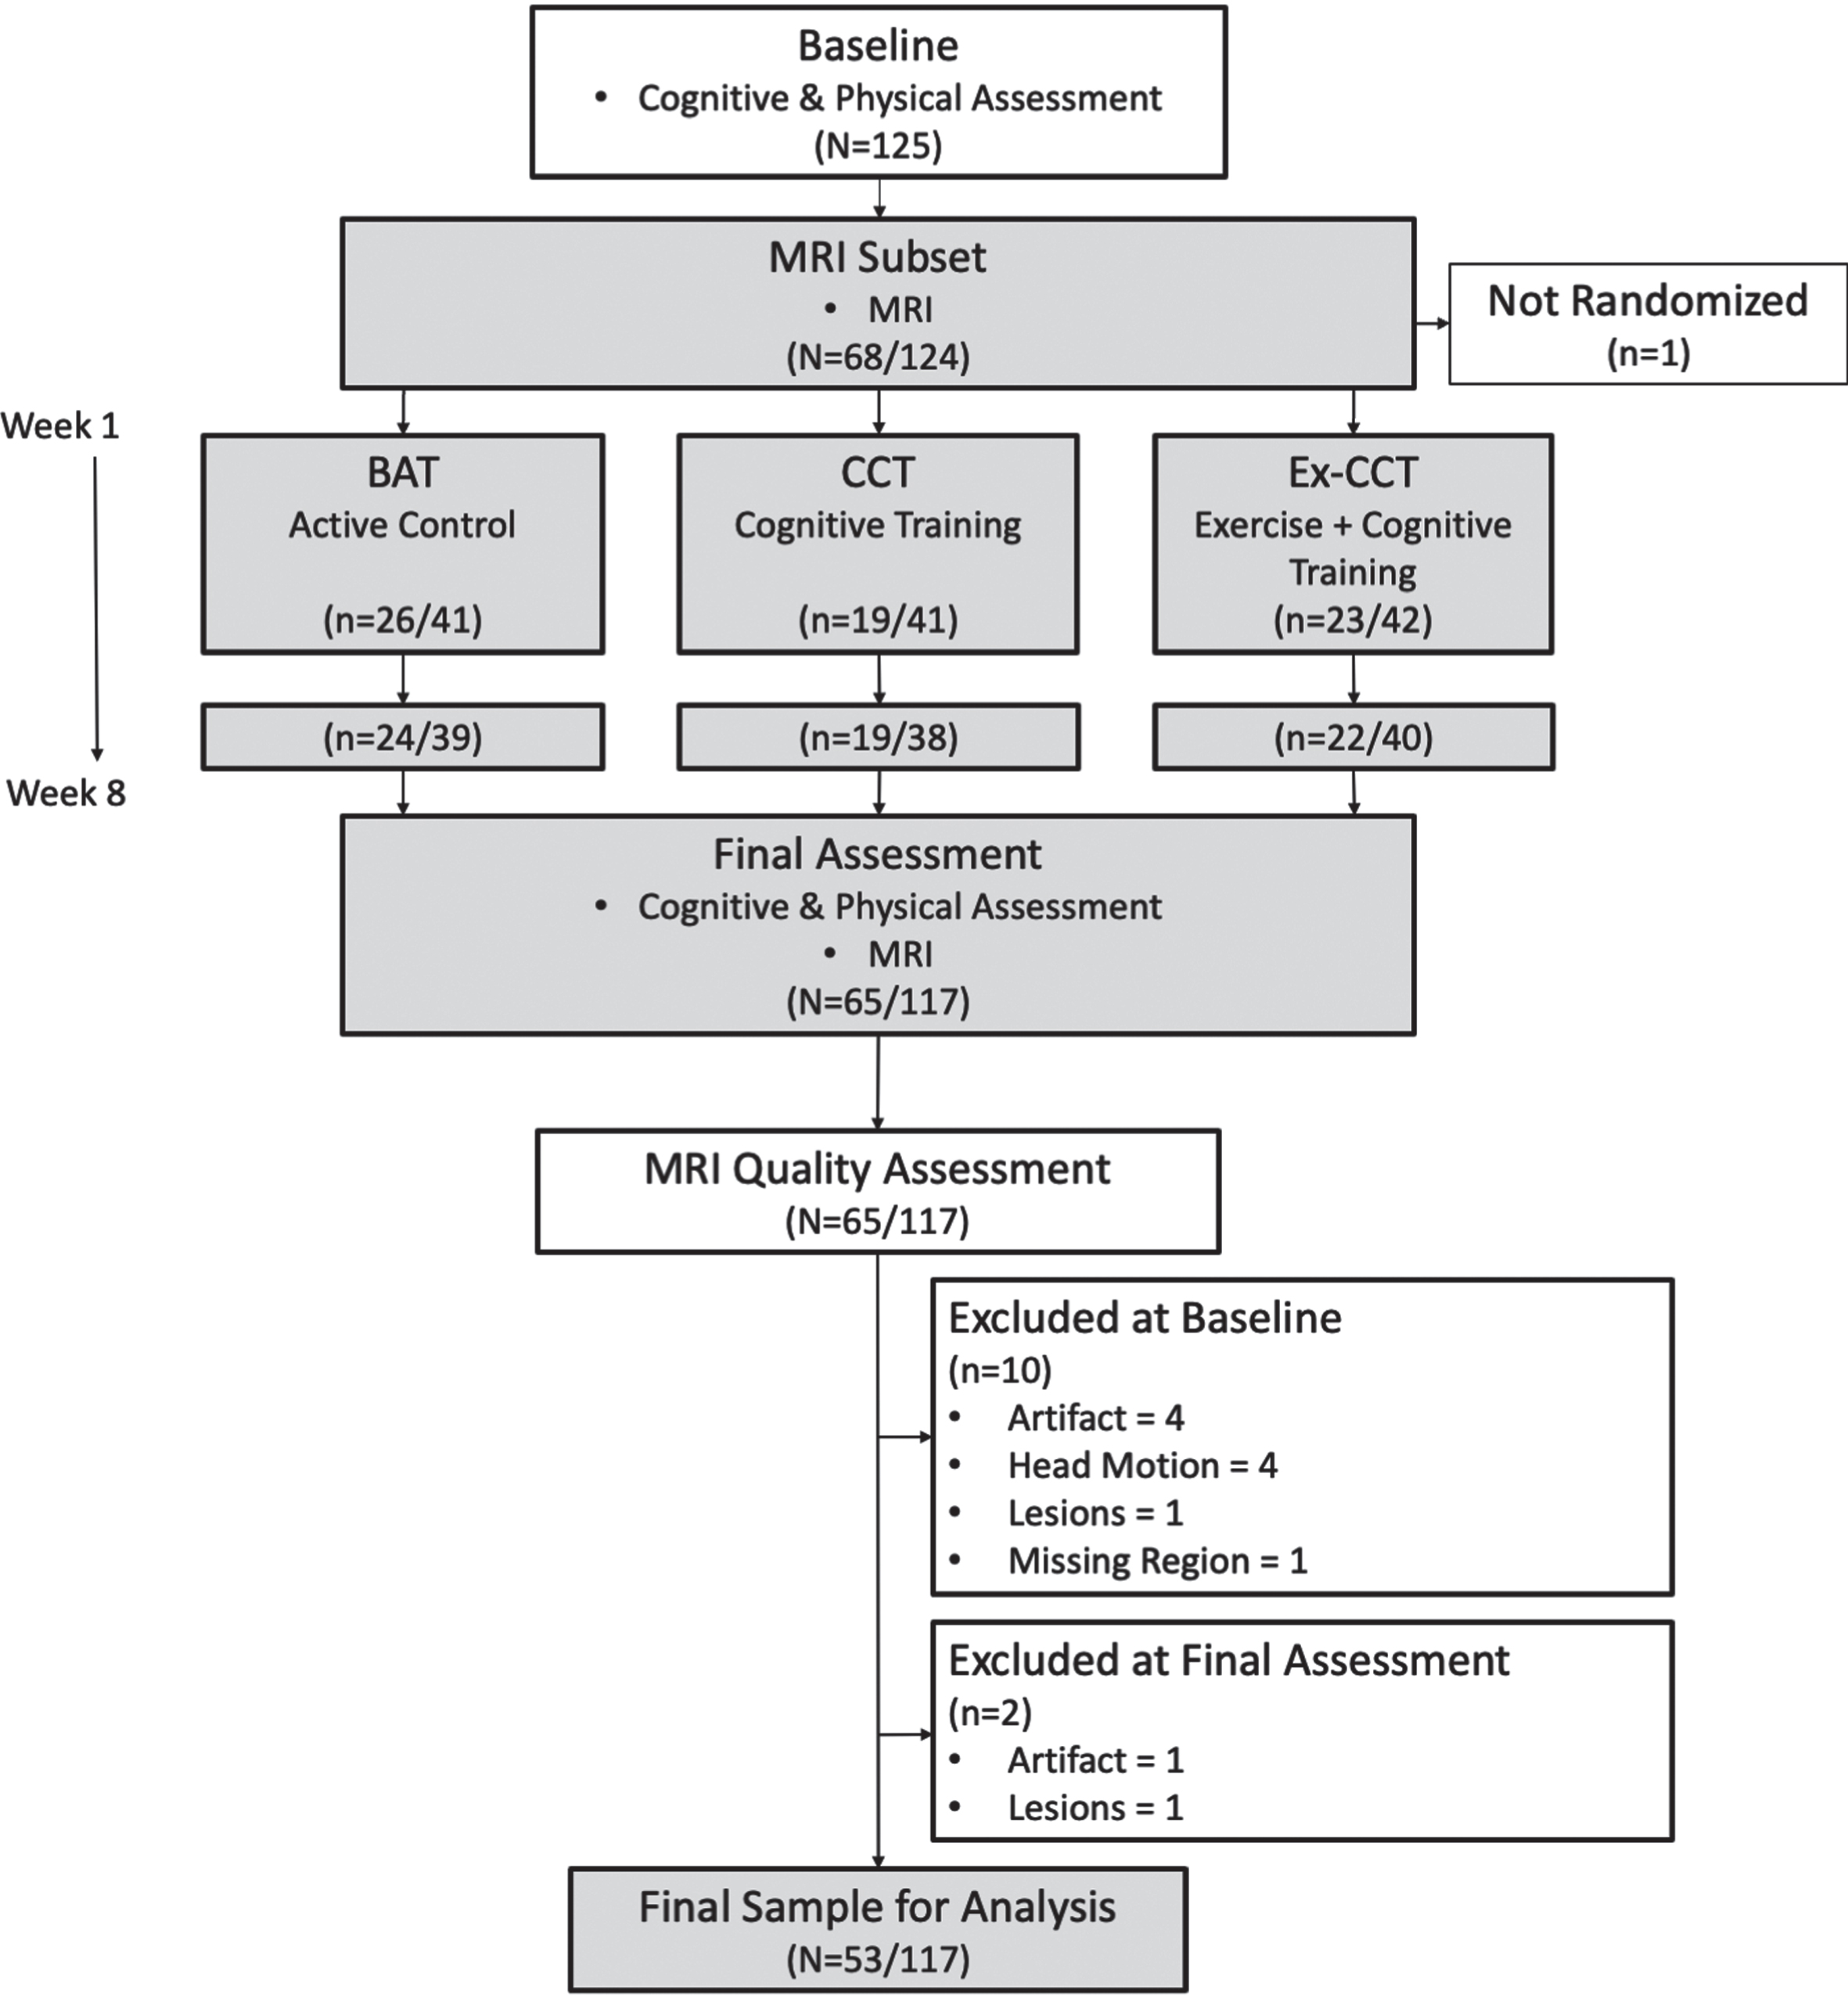
This secondary analysis included 53 of 124 participants who were enrolled in this RCT; all 53 participants underwent magnetic resonance imaging (MRI) (Fig. 1). Individuals who did not meet the specific scanning requirements of the University of British Columbia (UBC) MRI Research Centre were excluded. Specifically, anyone with a pacemaker, brain aneurysm clip, cochlear implant, surgery within the past 6 weeks, electrical stimulator for nerves or bones, implanted infusion pump, history of any eye injury involving metal fragments, artificial heart valve, orthopedic hardware, other metallic prostheses, coil, catheter or filter in any blood vessel, ear or eye implant, bullets, or other metallic fragments were excluded.
Fig. 1
Study design and flow of procedures. Fractions indicate proportion of participants in MRI subset to total sample size.
Measurement
All participants were assessed at baseline and after 8 weeks (i.e., trial completion). The subset of 53 participants included in this secondary analysis underwent MRI at the UBC MRI Research Center.
Descriptive variables
General health history, demographics, socioeconomic status, and education were ascertained by a structured questionnaire. Global cognition was assessed using the Montreal Cognitive Assessment (MoCA) [27]. The Functional Comorbidity Index estimated the degree of comorbidity associated with physical functioning [28]. Current physical activity was assessed with the Physical Activity Scale for the Elderly (PASE) [29, 30]. The PASE is a 12-item questionnaire that assesses the amount of time spent per day in the previous week on leisure activity time (light, moderate, and strenuous activities), household work, and time spent volunteering.
Gait speed
Usual gait speed was assessed using the 4-meter walk component of the Short Physical Performance Battery (SPPB) [31]. Individuals were given a dynamic start and were instructed to start walking a before the start of the 4-meter walk test distance. Individuals were instructed to walk at their usual gait speed past the 4-meter mark and timed with a handheld stopwatch. Two trials were completed by participants and the faster time was used to calculate gait speed. Gait speed in meters per second (m/s) was calculated by dividing 4-meters by the time it took to walk 4 meters in seconds.
Magnetic resonance imaging
Structural MRI data acquisition
MRI was conducted at the UBC MRI Research Centre using a Philips Achieva 3.0T MRI scanner with eight-channel sensitivity encoding head coil (SENSE factor = 2.4) and parallel imaging. 3D T1-weighted anatomical scans were collected using the following parameters: TE = 3.6 ms, shot TR = 7.7 ms, TI = 808 ms, flip angle θ = 8°, FOV = 256×200×170 mm, transverse orientation, 170 slices, acquired and reconstructed voxel = 1×1×1 mm.
T1-weighted image processing
T1-weighted brain images were segmented and analyzed using FreeSurfer (http://www.freesurfer.net), version 7.1.1. [32]. FreeSurfer is developed at the Martinos Center for Biomedical Imaging by Laboratory for Computational Neuroimaging (http://surfer.nmr.mgh.harvard.edu/).
To provide reliable volume and thickness estimates, T1-weighted images acquired at baseline and trial completion were automatically processed with FreeSurfer’s recon-all longitudinal stream [32]. An unbiased within-subject template space and image [33] was created using a robust, inverse consistent registration [34]. Processing steps including skull stripping, Talairch transforms, atlas registration and spherical surface maps and parcellation were initialized with common information from the within-subject template. This step significantly increases statistical power [32]. Images were visually inspected for segmentation errors, and all errors were corrected appropriately.
Randomization
The randomization sequence was generated by an independent member of the team using computer software (http://www.randomization.com). Blocked randomization was used, with a block size of 12. Group allocation was concealed from the study coordinator. After enrolment, performed by a research assistant, and completion of the baseline assessment, the study coordinator sent a list of participant identification numbers to the independent member responsible for the randomization. The independent member provided the study coordinator with the group assignment for the enrolled participants. After completion of baseline assessment at the Vancouver General Hospital, the participants were informed of their group assignment. Outcome assessors were blinded to treatment allocation.
Sample size
The required sample size was estimated based on the work of Diamond and colleagues [35]. Sample sizes were calculated for the parent study using predictions of change in the primary outcome, Rey Auditory Verbal Learning Test [23]. We predicted a mean change of –0.31 for the BAT group, 0.31 for the CCT group, and 0.40 for the Ex-CCT group. With a pooled standard deviation of 1.1 and alpha of 0.05, 36 participants per group were required to achieve a power of 0.80. We accommodated a 10% dropout rate for a total required sample size of 120 (i.e., 40 BAT, 40 CCT, and 40 Ex-CCT. This secondary analysis should be viewed as hypothesis-generating for future studies, as the statistical power for this analysis is not pre-specified.
Experimental groups
A description of each experimental group is provided below. More details are in the published protocol [22]. Each experimental group met in-person 3x/week for 8 weeks and classes were delivered by the research team at the Djavad Mowafaghian Centre for Brain Health at UBC or the Centre for Aging SMART at Vancouver Coastal Health [23].
Balanced and toned
The BAT group served as an active control in this trial. BAT in-person classes were 3x/week, with each session being 1 h. Each week, BAT participants received 1 session of sham cognitive training (e.g., casual online games), 1 h of sham physical exercise training (e.g., stretching exercises, range of motion exercises, core strength exercises, balance exercises, and relaxation techniques), and 1 h of brain health education. For the first 4 weeks participants attended educational classes (e.g., lectures on sleep and goal setting). For the final 4 weeks participants were asked to complete homework for an educational project (e.g., creating an individual photo book).
Computerized cognitive training
CCT in-person classes were 3x/week, with each session being 1 h. CCT participants were also asked to complete 1 h of CCT, 3x/week, at home at the same time on days that they were not in-person. The FitBrains® program was used for CCT; this program is no longer commercially available.
Exercise plus computerized cognitive training
For each in-person session, Ex-CCT participants completed 15 min of brisk walking at a moderate intensity (i.e., 13–14 rating on the Borg Rating of Perceived Exertion Scale 6–20) [36], immediately prior to 45 min of FitBrains® training. At home, Ex-CCT participants were asked to repeat the same 1 h training 3x/week at the same time on days that they were not in-person. The Borg Rating of Perceived Exertion Scale has a strong relationship with both heart rate and exercise intensity [37].
Adherence
Attendance was recorded for in-person session and the completion of assigned home-based activities (i.e., brisk walking and CCT) were tracked by diaries. At-home CCT was also tracked by the FitBrains® app. Adherence for both in-person and home-based sessions were reported as the percentage of expected sessions completed.
Adverse events
Adverse events through the study were recorded including musculoskeletal pain or discomfort following the sham exercise portion (i.e., BAT) and the 15 min of brisk walking (i.e., Ex-FBT). Participants were monitored for shortness of breath during the sham exercise and brisk walks.
Statistical analyses
Mean values, standard deviations, and distribution of participant characteristics and measures were analyzed using R version 4.0.4 [38] in RStudio 2021.09.2 Build 382 [39]. Differences in participant characteristics between non-MRI participants from the parent study and the MRI participants were analyzed using the R package tableone (0.13.0) [40].
Surface-based statistical analysis was employed to examine between-group differences in cortical volume and thickness over time. These analyses followed FreeSurfer’s Two-Stage Model approach [32]. Stage one reduces temporal data within each subject to a single statistic (e.g., a “change score”); in this case, symmetrized percent change. At this stage, data were smoothed using a 10 mm full-width half-maximum kernel and resampled onto FreeSurfer’s fsaverage template. Stage two of this model compares cortical thickness and volume (i.e., symmetrized percent change) between-groups via FreeSurfer’s mri_glmfit command (i.e., General Linear Model). For the present study, analyses were controlled for covariates, specifically age, sex, and MoCA score within mri_glmfit [32]. Three model matrices were built to compare experiment groups. That is, BAT versus CCT, CCT versus Ex-CCT, and BAT versus Ex-CCT. Cluster-wise correction using Monte Carlo simulations [41] was then applied to address multiple comparisons, using both hemispheres (i.e., two spaces), with a vertex-wise threshold set at –log10(p)=1.3, and cluster-wise threshold set at an alpha of 0.050. Mean, minimum, and maximum Cohen’s d of each significant cluster was calculated with FreeSurfer’s mri_segstats to determine and interpret effect size (i.e., d = 0.2 (small); d = 0.5 (medium); d = 0.8 (large) [42].
Analyses of covariance were used to determine between-group differences in gait speed at 8 weeks, controlling for baseline gait speed, using R version 4.0.4 [38] in RStudio 2021.09.2 Build 382 [39]. Specifically, two-tailed simple contrasts were conducted between: 1) BAT versus CCT; 2) CCT versus Ex-CCT; and 3) BAT versus Ex-CCT with the R package car (3.0–13) at an alpha of 0.050.
Correlations of cortical volume and thickness with change in gait speed were conducted in FreeSurfer. Partial correlations between change in gait speed and significant changes in cortical volume and thickness (i.e., significant clusters with symmetrized percent change from Two-Stage Model) were performed via mri_glmfit. Models were adjusted for group allocation, age, sex, and MoCA. Like the main analysis, cluster-wise correction with Monte Carlo simulations was applied, adjusting for both hemispheres, at –log10(p)=1.3 vertex-wise and cluster-wise threshold set at an alpha of 0.050. Mean, minimum, and maximum partial correlation coefficient’s of each significant cluster was calculated with FreeSurfer’s mri_segstats to determine the strength of the correlation (i.e., r = 0.00 –0.10 (negligible); r = 0.10 –0.39 (weak); r = 0.40 –0.69 (moderate); r = 0.70 –0.89 (strong); r = 0.90 –1.00 (very strong) [43].
RESULTS
One hundred twenty-four community dwelling healthy older adults were enrolled and randomized in the parent study, with 117 participants completing the 8-week RCT. Sixty-five participants completed MRI at baseline and trial completion. All MRI scans were manually edited for quality assurance to determine segmentation accuracy with FreeSurfer’s recon-all pipeline; this resulted in the exclusion of 12 participants from this secondary analysis (Fig. 1). Specifically, 10 participants were excluded at baseline (see Fig. 1) due to the presence of artifacts affecting segmentation (n = 4), excessive head motion (n = 4), excessive white matter hyperintensities impacting cortical segmentation (n = 1), or missing data resulting in the loss of the frontal lobe (n = 1). At 8 weeks, 2 participants were excluded due to the presence of artifacts (n = 1) or excessive white matter hyperintensities impacting cortical segmentation (n = 1). Thus, 53 participants were included in this analysis.
Adherence
Adherence for in-person sessions was 95.8% for the BAT group, 89.5% for the Ex-CCT group, and 91.42% for the CCT group. Adherence for home-based sessions was 90.9% for the Ex-CCT group and 94.1% for the CCT group.
Participant characteristics
Overall, the majority of the MRI subset participants were female (56.6%), highly educated, and less than half presented with mild cognitive impairment determined by a MoCA score < 26/30 [27]. As shown in Table 1, MRI participant characteristics at baseline were similar among all three groups.
Table 1
MRI participant subset baseline characteristics
| Measureϖ | BAT n = 19 | Ex-CCT n = 17 | CCT n = 17 |
| Age (y) | 71.89 (5.91) | 71.71 (3.72) | 71.06 (4.88) |
| Sex=Male (%) | 9 (47.4) | 8 (47.1) | 6 (35.3) |
| Education (%) | |||
| High School Education | 2 (10.5) | 1 (5.9) | 1 (5.9) |
| Trades | 1 (5.3) | 2 (11.8) | 0 (0.0) |
| Some University | 2 (10.5) | 6 (35.3) | 6 (35.3) |
| University Degree | 14 (73.7) | 8 (47.1) | 10 (58.8) |
| BMI (kg/m2) | 25.35 (5.16) | 26.65 (5.02) | 25.74 (4.49) |
| MMSE (/30) | 28.05 (1.72) | 28.71 (1.36) | 29.24 (0.83) |
| MoCA (/30) | 24.84 (3.69) | 26.00 (3.55) | 27.12 (2.69) |
| MCI (%) | 10 (52.6) | 7 (41.2) | 5 (29.4) |
| Gait Speed (m/s) | 1.24 (0.29) | 1.29 (0.25) | 1.21 (0.18) |
| Six Minute Walk (m) | 500.37 (95.05) | 532.65 (89.63) | 520.29 (111.32) |
| SPPB (/12) | 10.95 (0.91) | 11.12 (0.78) | 11.06 (0.90) |
| PASE (/793) | 109.07 (48.19) | 128.77 (48.04) | 114.81 (43.05) |
Displayed values indicate Mean (SD) or n (%); BAT, Balance and Toned; Ex-CCT, Exercise with Fit Brains; CCT, Fit Brains. ϖ Higher scores reflect better performance: MMSE, Mini-Mental State Exam; MoCA, Montreal Cognitive Assessment; MCI, mild cognitive impairment, defined as < 26/30 MoCA [27]; SPPB, Short Physical Performance Battery; PASE, Physical Activity Scale for the Elderly.
Supplementary Table 1 compares the MRI subset to non-MRI participants at baseline. There were significant differences in mean MoCA scores (t(122)=2.51, p = 0.013), where MRI participants had a higher mean score (M = 25.94, SD = 3.42) than non-MRI participants (M = 24.44, SD = 3.22). There was also a significant difference in mean SPPB scores (t(122)=2.26, p = 0.026), with MRI participants (M = 11.04, SD = 0.85) having a higher mean score than non-MRI participants (M = 10.62, SD = 1.13).
Cortical volume and thickness
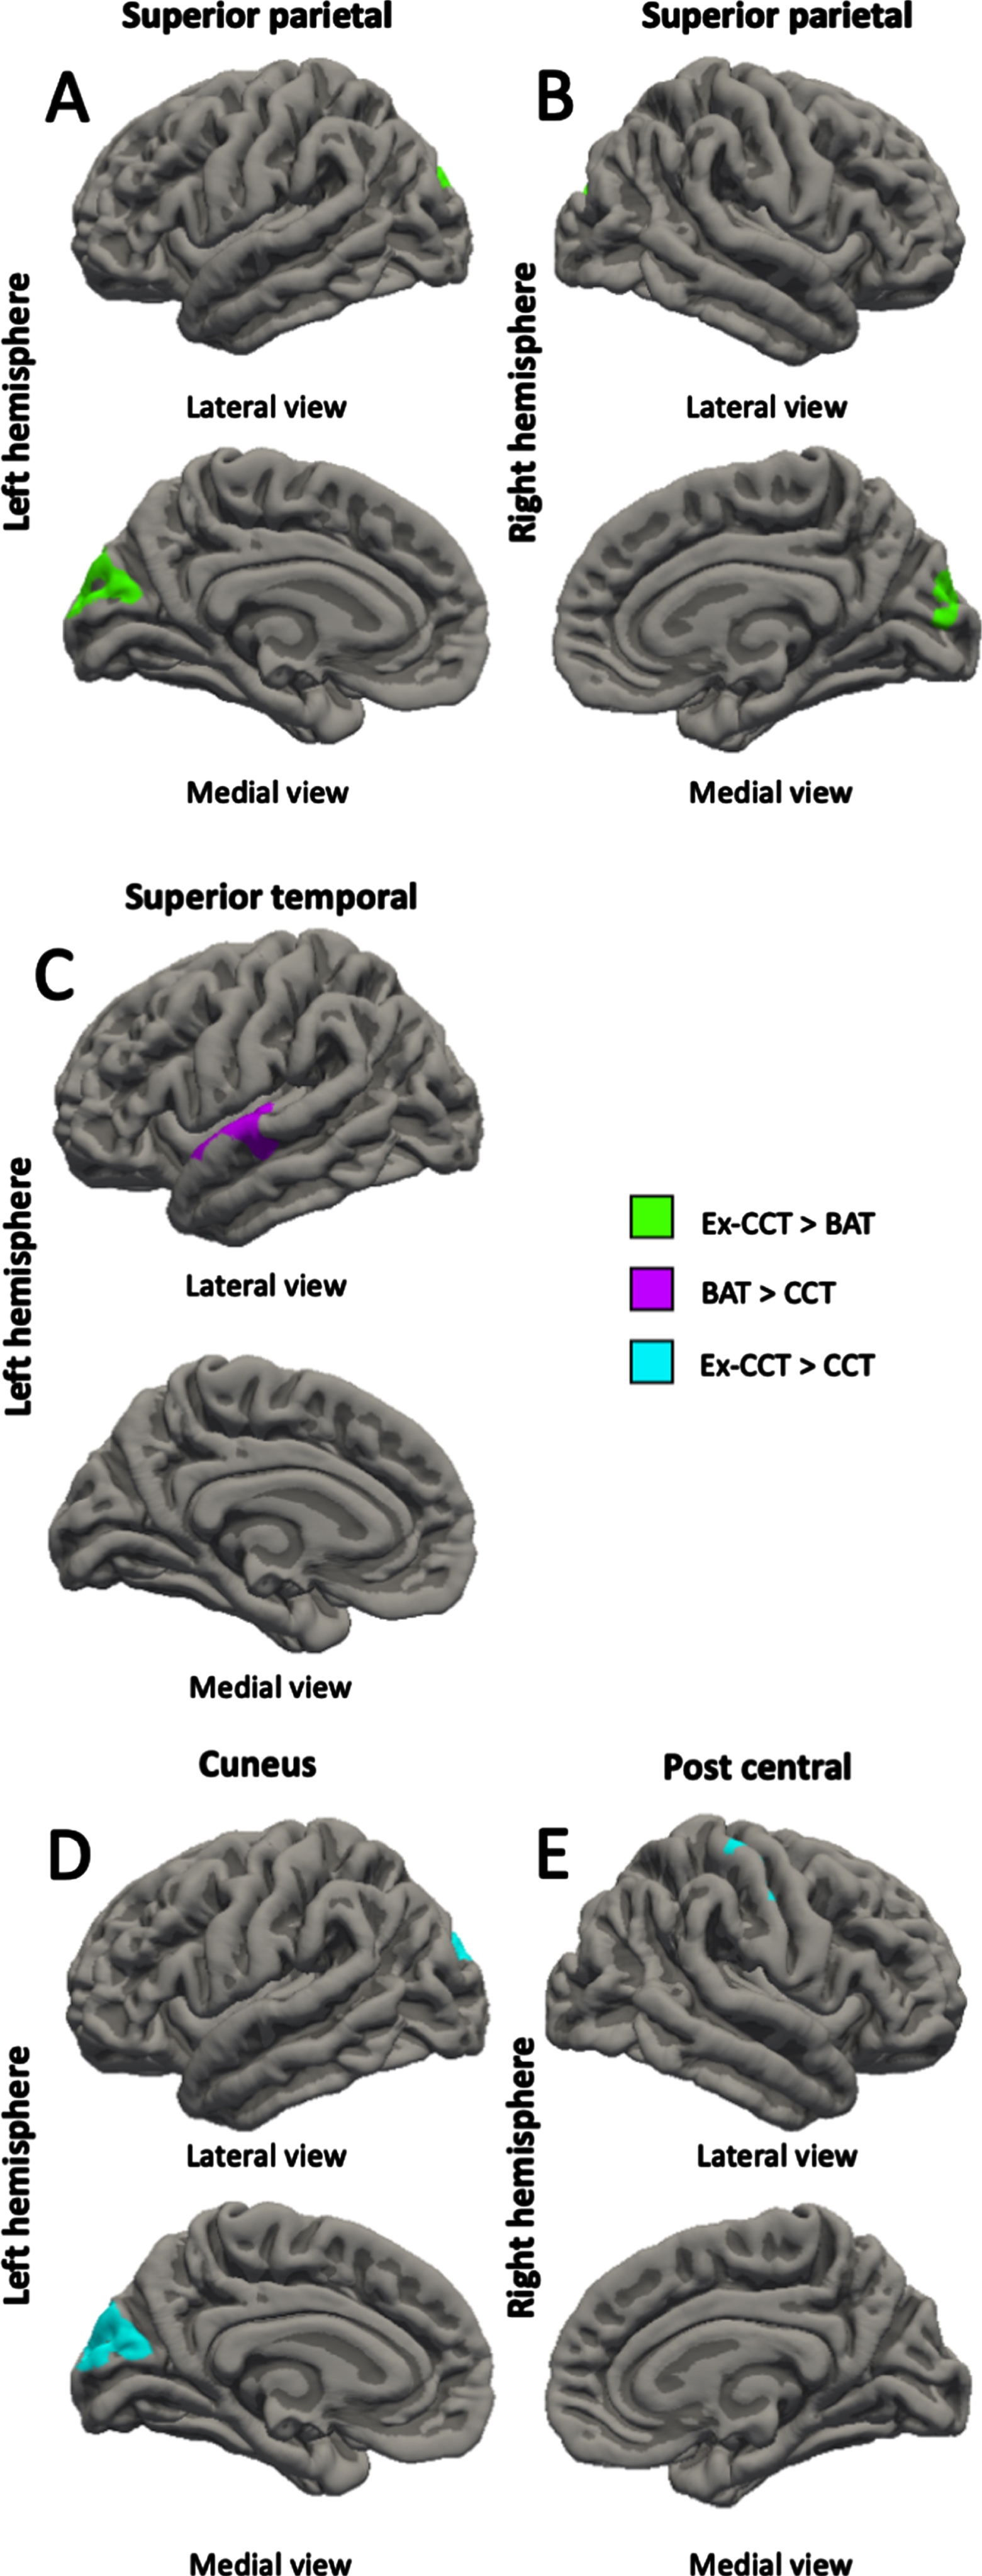
Compared with the CCT group, the BAT group showed increased left rostral middle frontal gyrus volume (cluster size = 553.51 mm3, cluster-wise p = 0.027, mean Cohen’s d = 17.516, min Cohen’s d = 13.583, max Cohen’s d = 25.387; Fig. 2A) and left superior temporal gyrus thickness (cluster size = 525.58 mm2, cluster-wise p = 0.039, mean Cohen’s d = 17.301, min Cohen’s d = 13.573, max Cohen’s d = 24.257; Fig. 3C) at trial completion. Compared with the CCT group, the Ex-CCT group had increased left cuneus thickness (cluster size = 1062.12 mm2, cluster-wise p < 0.001, mean Cohen’s d = 23.374, min Cohen’s d = 15.825, max Cohen’s d = 36.156; Fig. 3D) and right post central gyrus thickness (cluster size = 714.85 mm2, cluster-wise p = 0.005, mean Cohen’s d = 22.443, min Cohen’s d = 15.824, max Cohen’s d = 41.109; Fig. 3E) and volume (cluster size = 1030.08 mm3, cluster-wise p < 0.001, mean Cohen’s d = 22.335, min Cohen’s d = 15.834, max Cohen’s d = 37.935; Fig. 2B). Compared the BAT group, the Ex-CCT had increased cortical thickness in the left (cluster size = 900.23 mm2, cluster-wise p = 0.001, mean Cohen’s d = 20.206, min Cohen’s d = 14.568, max Cohen’s d = 31.624; Fig. 3A) and right (cluster size = 681.95 mm2, cluster-wise p = 0.020, mean Cohen’s d = 20.721, min Cohen’s d = 14.571, max Cohen’s d = 38.249; Fig. 3B) superior parietal gyri extending into the cuneus.
Fig. 2
Between-group differences (α< 0.05) in: A) left rostral middle frontal volume; and B) right post central volume, controlling for age, sex, and MoCA.
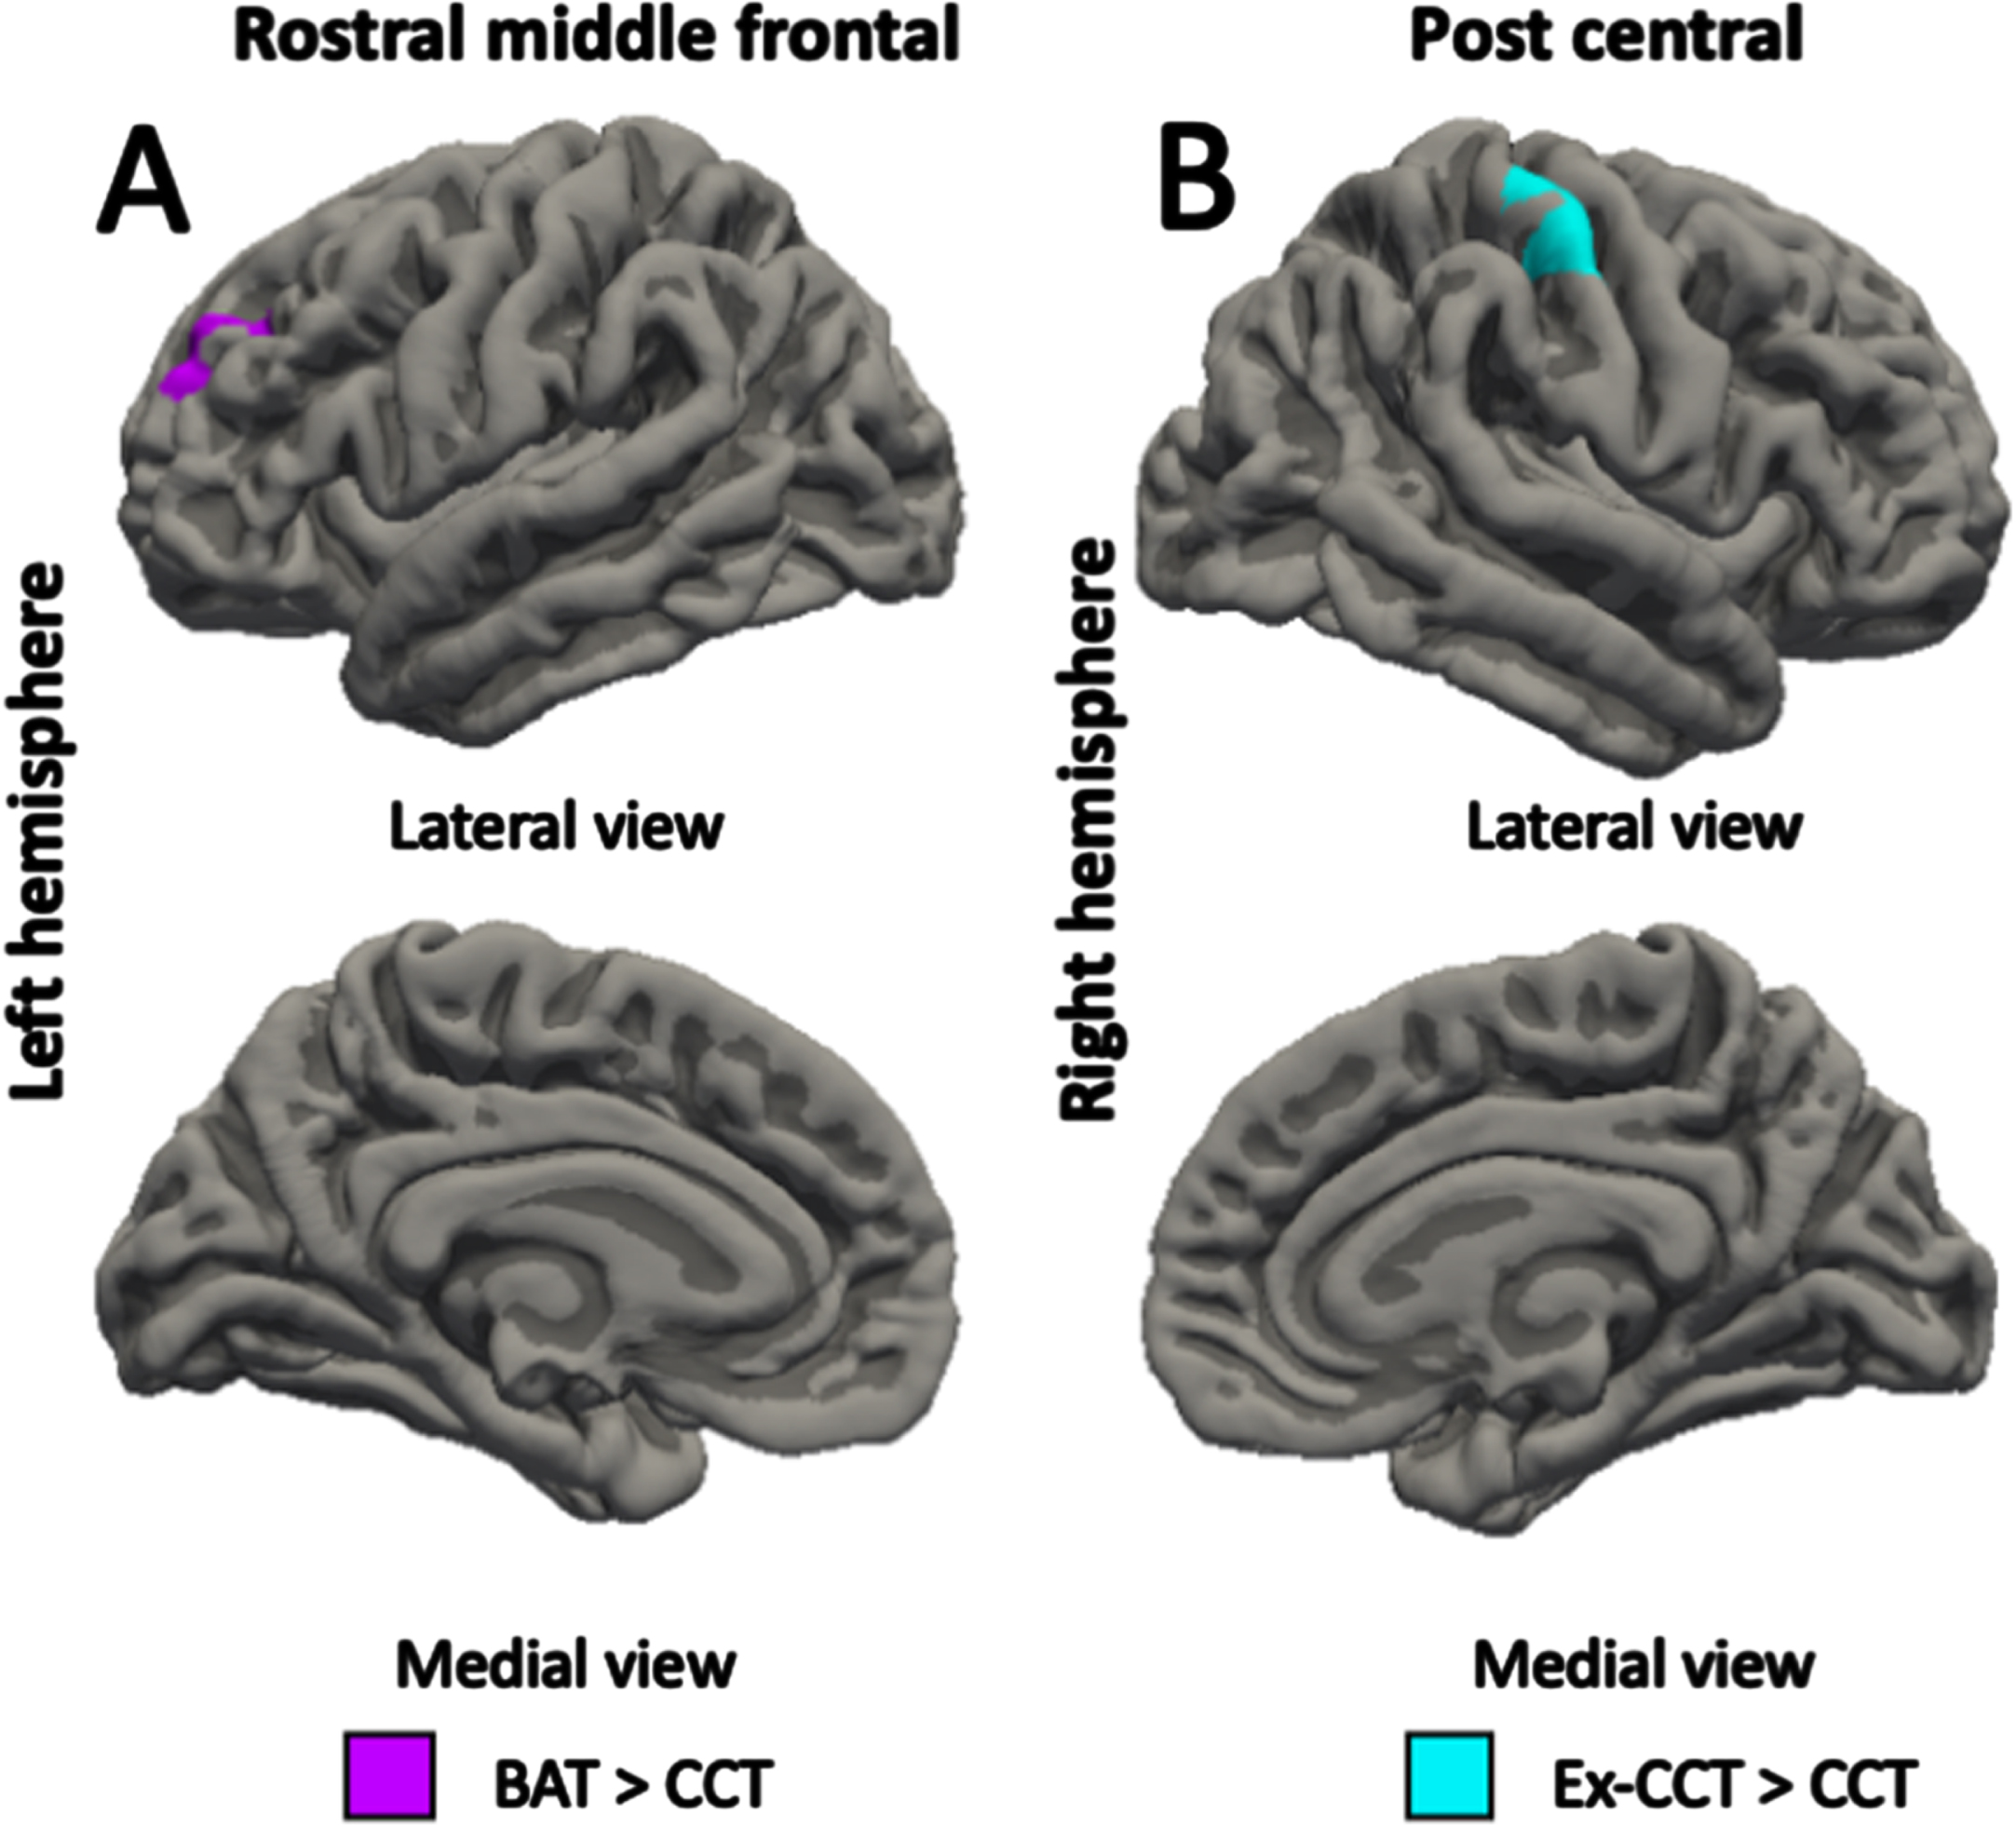
Fig. 3
Between-group differences (α< 0.05) in: A) left superior parietal thickness; B) right superior parietal thickness; C) left superior temporal thickness; D) left cuneus thickness; and E) right post central thickness, controlling for age, sex, and MoCA.
Gait speed
At 8 weeks, there were no significant between-group differences in gait speed: 1) BAT versus CCT (F(2, 33)=1.200, p = 0.282); 2) CCT versus Ex-CCT (F(2, 31)=1.931, p = 0.175); and 3) BAT versus Ex-CCT (F(2, 33)=1.78, p = 0.675).
Correlation of cortical change and gait speed
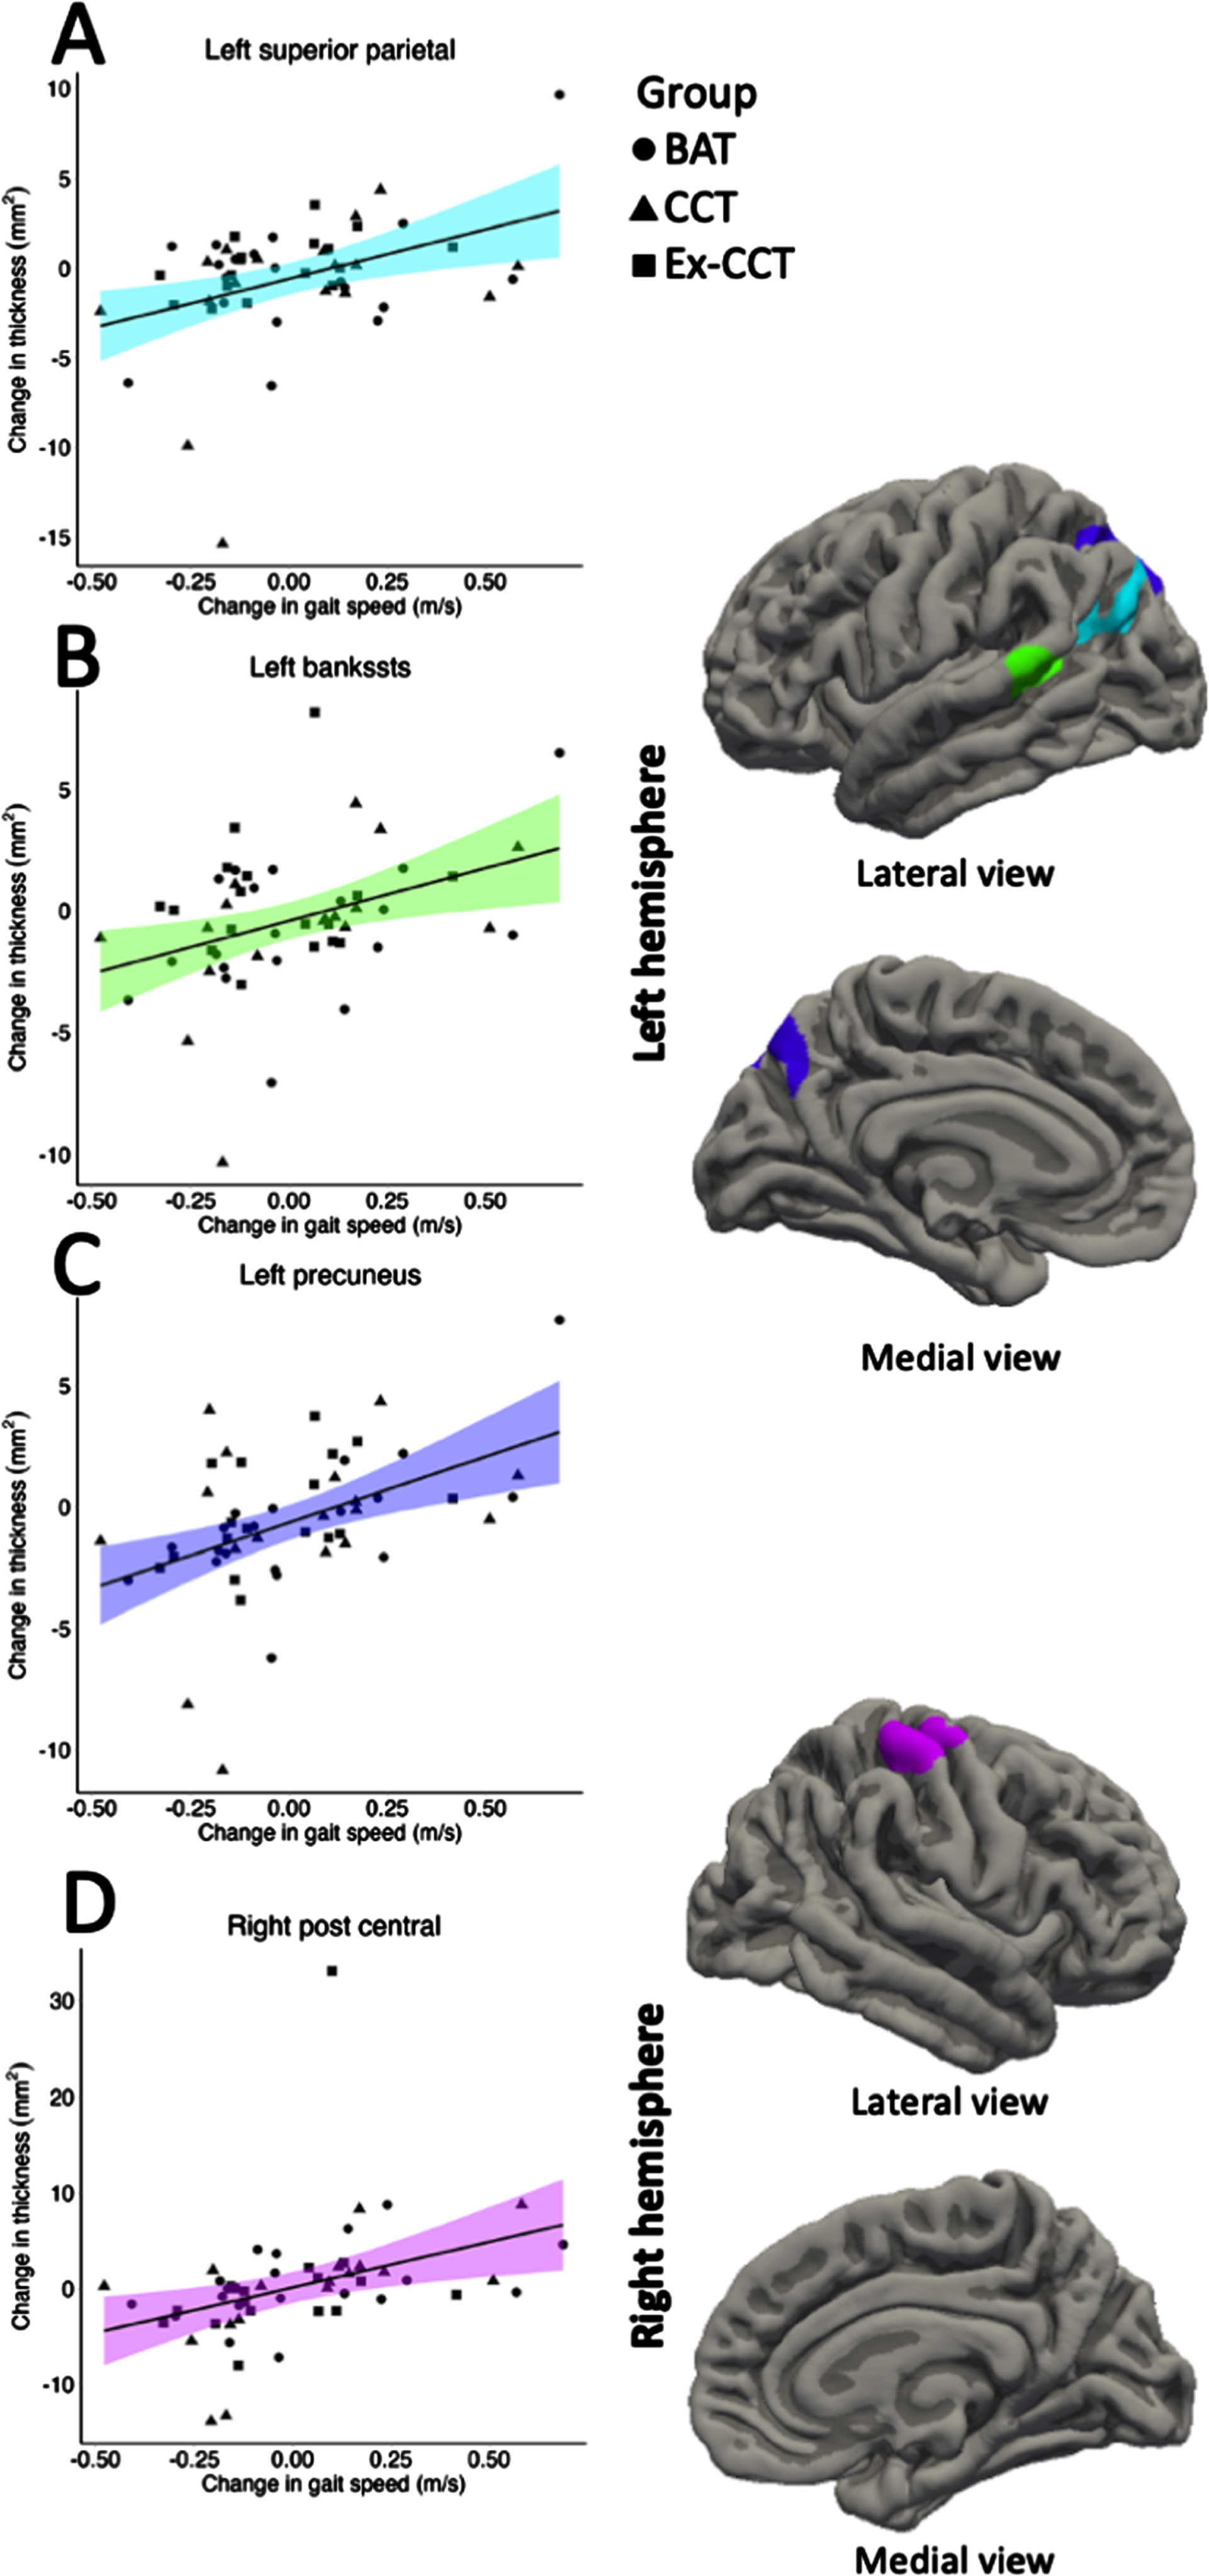
Increased gait speed was significantly and positively correlated with increased: 1) left superior parietal volume (cluster size = 618.42 mm3, cluster-wise p = 0.036, mean r = 0.340, min r = 0.288, max r = 0.434; Fig. 4) and thickness (cluster size = 841.27 mm2, cluster-wise p = 0.002, mean r = 0.348, min r = 0.287, max r = 0.459; Fig. 5), right post central gyrus volume (cluster size = 697.26 mm3, cluster-wise p = 0.017, mean r = 0.341, min r = 0.287, max r = 0.434; Fig. 4) and thickness (cluster size = 697.52 mm2, cluster-wise p = 0.001, mean r = 0.348, min r = 0.288, max r = 0.458; Fig. 5), left banks of superior temporal sulcus (bankssts) thickness (cluster size = 629.84 mm2, cluster-wise p = 0.002, mean r = 0.356, min r = 0.288, max r = 0.498; Fig. 5), and left precuneus thickness (cluster size = 1028.94 mm2, cluster-wise p < 0.001, r = 0.346, min r = 0.287, max r = 0.484; Fig. 5).
Fig. 4
Significant correlation (α< 0.05) between: A) change in left superior parietal volume; and B) change in right post central volume with change in gait speed, controlling for age, sex, and MoCA.
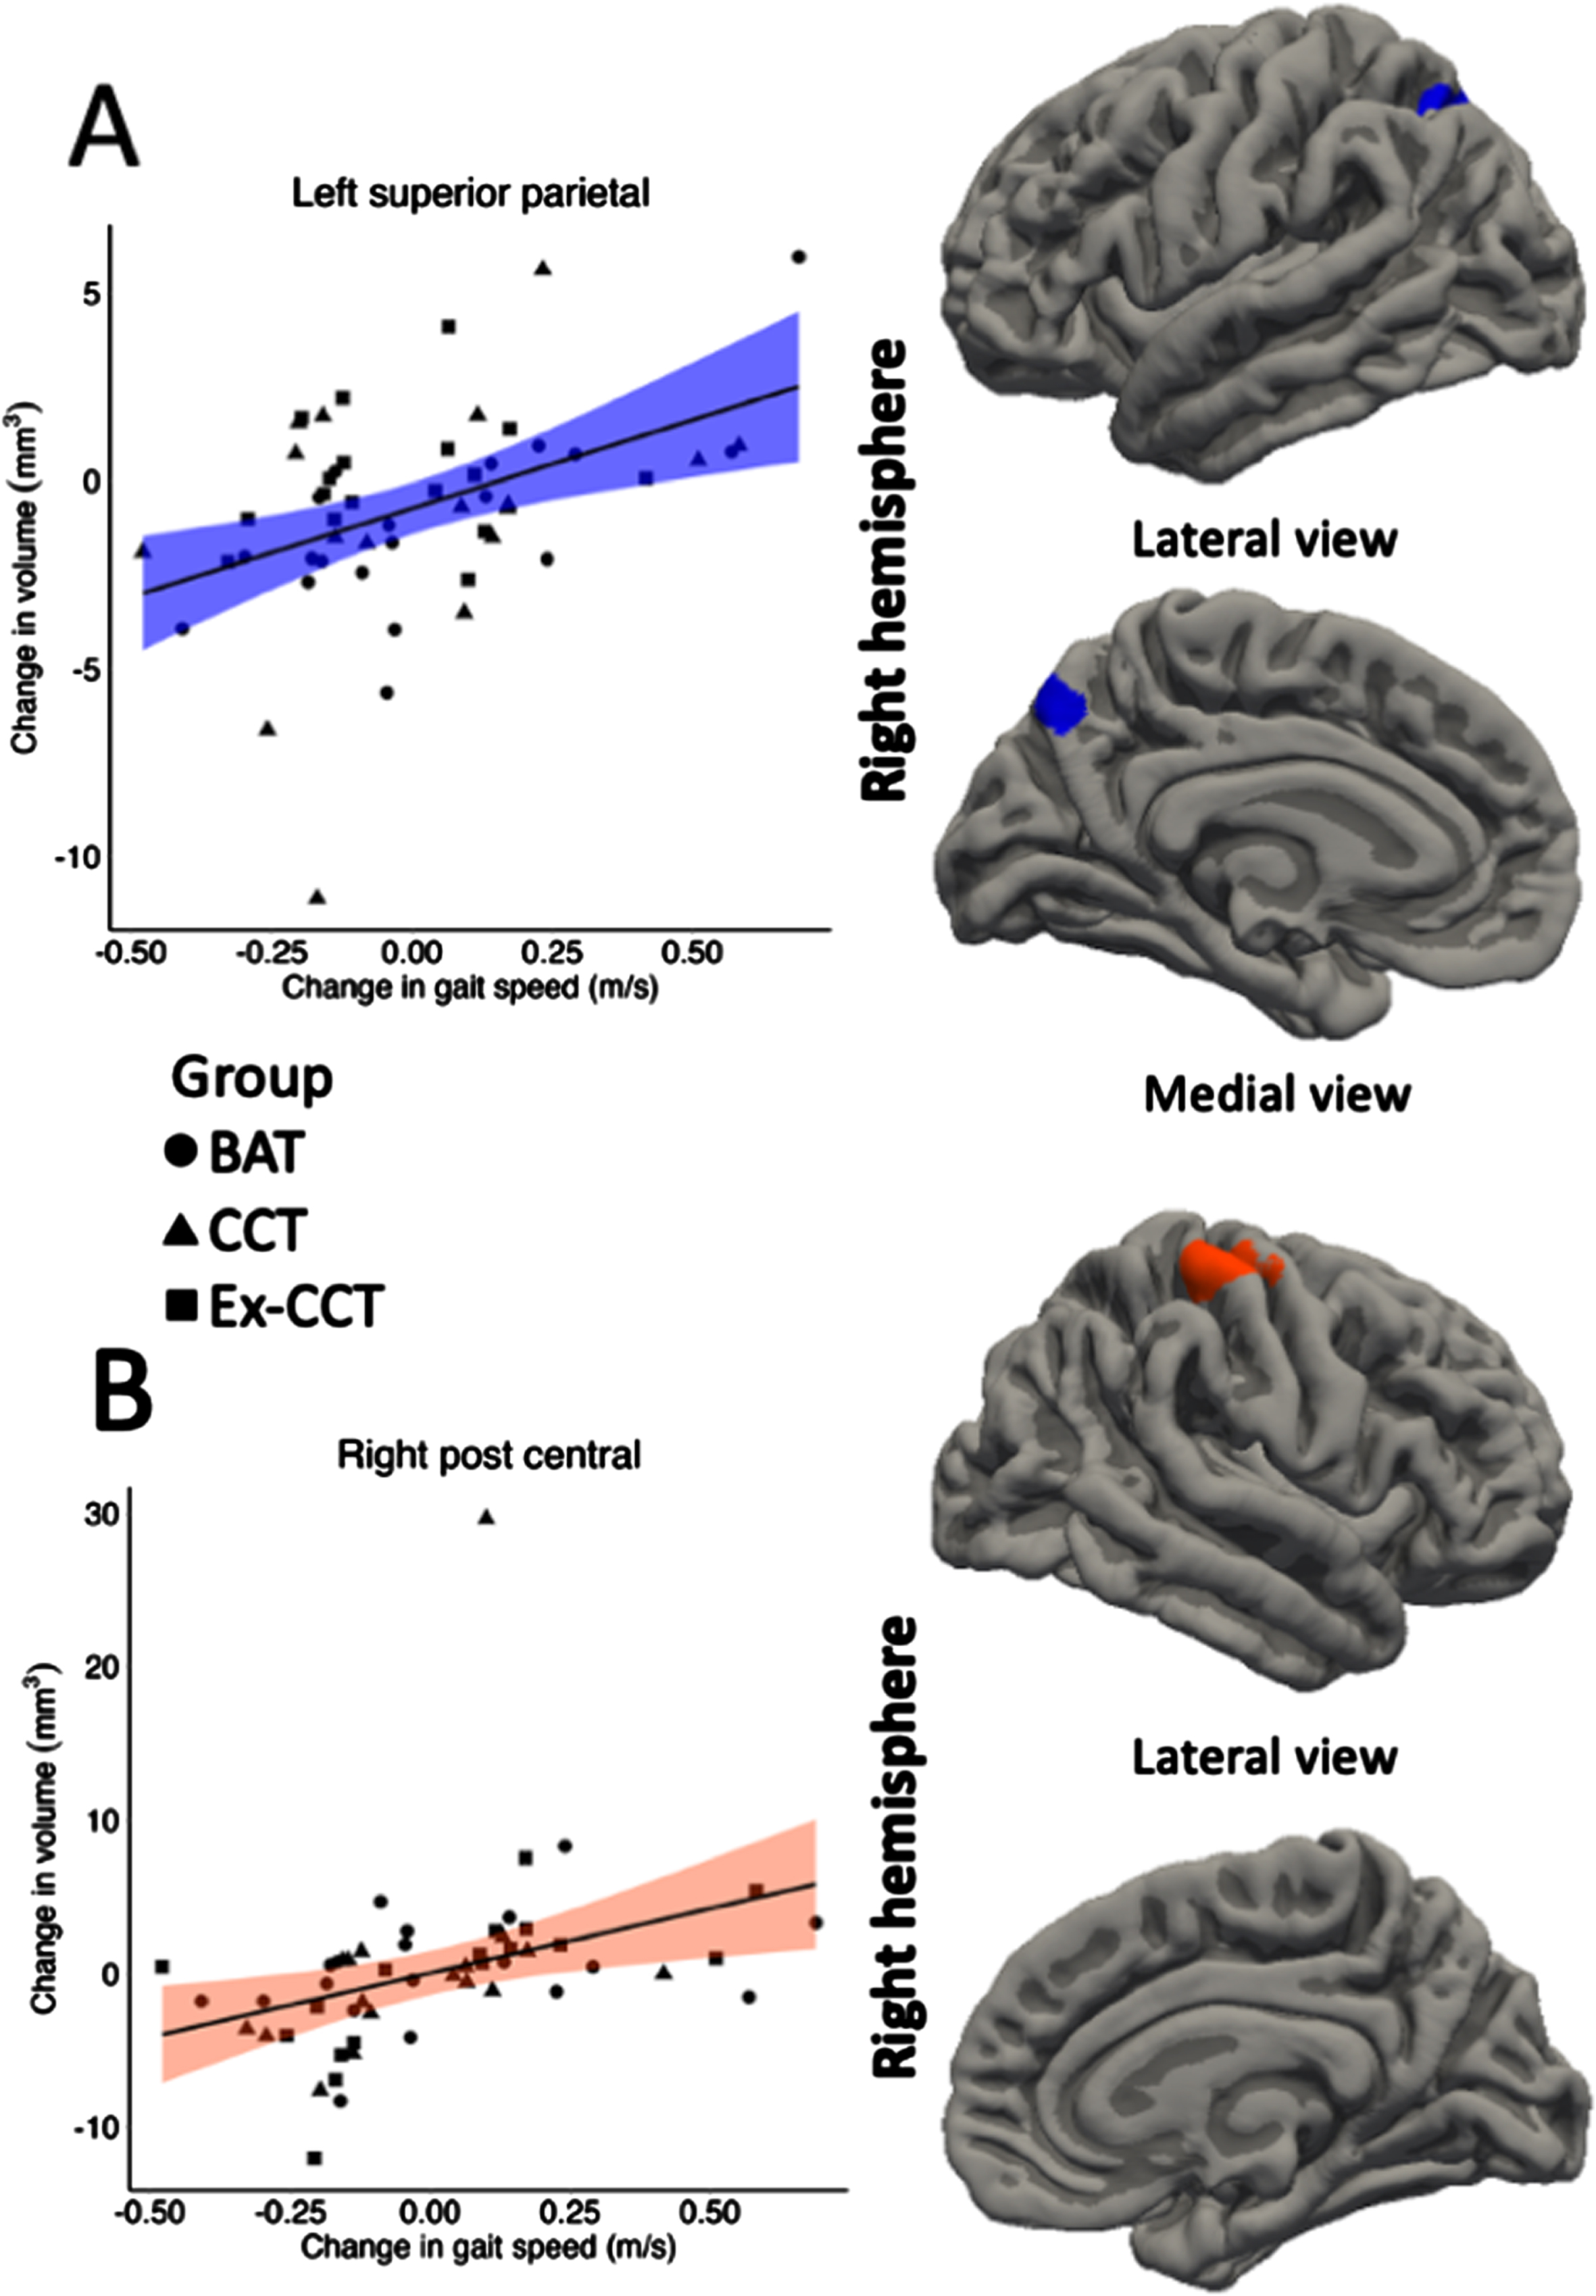
Fig. 5
Significant correlation (α< 0.05) between: A) change in left superior parietal thickness; B) change left bankssts thickness; C) change in left precuneus thickness; and D) change in right post central thickness with change in gait speed, controlling for age, sex, and MoCA.
DISCUSSION
Eight weeks of CCT with physical exercise can positively impact cortical volume and thickness in community-dwelling older adults. Contrary to our hypothesis, CCT alone was inferior to active control in promoting cortical volume and thickness outcomes. Increased cortical volume and thickness of the superior parietal and post central gyri, cortical thickness of the bankssts, and precuneus gyri was significantly associated with increased gait speed. To our knowledge, no prior studies have examined the effects of CCT, with or without physical exercise, on cortical volume and thickness and whether these changes are associated with changes in gait speed.
CCT with physical exercise increased cortical thickness of the left and right superior parietal gyri compared with active control. The left superior parietal gyrus contributes to the executive processes of working memory, set shifting, and response inhibition [44]. This finding supports our prior publication of the parent study [23] that showed CCT with physical exercise, compared with active control, improved set shifting, as measured with the Trail Making Test [45] and National Institute of Health (NIH) Toolbox Dimensional Card Sorting Test [46], and response inhibition, as measured by Stroop Colour-Word Test [47] and NIH Toolbox Flanker Inhibitory Control and Attention Test [46].
CCT with physical exercise was also superior to CCT alone. Compared with CCT alone, CCT with physical exercise increased cuneus volume and post central gyri volume and thickness. These findings concur and extend the results of Lampit and colleagues [48]; they showed 12 weeks of CCT significantly increased grey matter density in the right post central gyrus compared with control. Our current finding suggests adding physical exercise (i.e., brisk walking) to CCT may magnify the benefits of CCT. Although the benefits of aerobic exercise on cortical volume and thickness are documented [8, 11, 13, 49, 50], 15 min of brisk walking 6x/week (i.e., 3 in-person, 3 at-home) may not be of sufficient dose to elicit cortical changes on its own. In this study, the brisk walk may have acted as a primer to CCT [51]. Exercise priming uses the neural stimulating effects of physical exercise to assist with learning, memory, and skill retention of a task [51]. It is suggested that physical exercise increases oxygenation and blood flow to the brain, enhances neuroplasticity through upregulation of neurotrophic factors, or illicit a neuroendocrine response which increases arousal and attention [51]. The guided plasticity framework suggests that while physical exercise facilitates plastic changes in the brain (i.e., increased cell proliferation and synaptic plasticity) [52] through increased neurotropic factors [53], cognitive activity guides those plastic changes by promoting survival of new cells and regulating synaptic change [52].
A significant increase in left rostral middle frontal gyrus volume and superior temporal gyrus thickness at 8 weeks in the active control group compared with CCT alone group was unexpected. We provided two possible explanations. First, due to the nature and time requirement of the CCT alone invention, participants may have increased their sedentary time (i.e., sitting time) which may have negatively impacted their brain health [54]. Second, the active control received balance training which may increase cortical thickness [55]. Rogge and colleagues [55] observed increased left superior temporal gyrus thickness following 12 weeks of balance training in healthy adults aged 19–67 years [55]. Thus, it is plausible that balance training can increase rostral middle frontal gyrus volume [8, 49, 56].
Increased cortical volume and thickness of the superior parietal and post central gyri and cortical thickness of the bankssts, and precuneus was significantly correlated with improved gait. Importantly, positive correlations of increased cortical volume and thickness and gait speed overlapped with CCT, combined with physical exercise, induced increase in left superior parietal and right post central gyri volume and thickness. Both regions play an important role in gait speed [57] and motor planning ability [58]. Atrophy of the superior parietal gyrus is associated with a decline in gait speed [57].
Atrophy of the superior parietal gyrus is associated with a decline in gait speed [57]. The primary role of the post central gyrus is processing somatosensory information including proprioception, touch, and pain [59]. While the post central gyrus is not directly responsible for gait speed or mobility, it plays a role in the overall sensorimotor integration required for motor function through feedback from the motor cortex [60].
Although we did find correlations between several regions of cortical volume and thickness, there were no significant between group differences in gait speed at trial completion. Thus, changes in these regions may not fully explain gait outcomes. Many factors contribute to gait speed, such as age, body mass index, muscle strength [61, 62], balance [63], cardiovascular health [64], pain [65], and range of motion of joints [62].
There are several limitations with this study. First, this is a secondary analysis among a subset of 53 participants with high quality T1 MRI. Thus, this study may have been underpowered and prone to Type II error. Second, the lack of benefits to cortical volume and thickness following of CCT alone may be due to the short intervention period (i.e., 8 weeks). However, at the study design stage, we referred to prior CCT trials, including the trial by Engvig and colleagues [66]. They demonstrated significant changes in cortical volume after 8 weeks of CCT compared with a no-training control group [66]. Third, we did not collect data on the 24-h activity cycle (i.e., time spent in physical activity, sleep, and sedentary behaviour over 24 h) and thus, cannot determine whether differences in physical activity, sleep, or sedentary behaviour may have contributed to the results. Fourth, measurement of behaviours outside the intervention were limited. We used PASE as an indicator of physical activity engagement however total PASE score is a self-reported measure and may be prone to reporting bias and accuracy [67]. Further, we did not collect other factors (e.g., nutrition) that may impact health outcomes. Fifth, although 4-meter gait speed is shown to be a sensitive, valid, and reliable measure of mobility [1], evidence show that lab-based gait speed may not reflect gait speed during daily living (daily gait speed) [68, 69]. Specifically, daily gait speed may be significantly lower than lab-based gait speed. Nevertheless, lab-based gait speed has ecological validity as a clinical marker of functional status in older adults [70]. Future studies should include additional parameters of gait, such as gait variability. Sixth, although the Borg Rating of Perceived Exertion Scale has a strong relationship with heartrate and exercise intensity [37], it is a subjective scale and thus is prone to reporting bias. Therefore, using a secondary objective metric (i.e., heart rate) to track exertion would be beneficial to ensure that participants are meeting their prescribed training intensity. Finally, due to the 3-arm study design, it is unclear if the observed benefits of CCT with physical exercise on cortical volume and thickness are due to CCT combined with physical exercise, or primarily due to physical exercise.
Finally, due to the 3-arm study design, it is unclear if the observed benefits of CCT with physical exercise on cortical volume and thickness are due to CCT combined with physical exercise, or primarily due to physical exercise. A 2x2 factorial trial is needed to determine the individual as well as the interactive effect of CCT and physical exercise on brain outcomes.
In conclusion, 8 weeks of CCT preceded by a bout of physical exercise can induce structural changes in the brain. Moreover, even a small dose of low-intensity physical exercises, such as stretching exercises, range of motion exercises, core strength exercises, and balance exercises, may positively impact the brain. Secondly, changes in cortical volume and thickness following CCT, combined with physical exercise, overlap with changes to cortical volume and thickness associated with gait speed. Thus, CCT preceded by 15 min of brisk walking may be a viable way to promote brain health among older adults who are unable to achieve current physical exercise recommendations [71] due to limited mobility or fitness.
AUTHOR CONTRIBUTIONS
Ryan G Stein (Formal analysis; Investigation; Methodology; Writing – original draft; Writing – review & editing); Lisanne F ten Brinke (Conceptualization; Data curation; Funding acquisition; Investigation; Methodology; Writing – review & editing); Nárlon Cassio Boa Sorte Silva (Methodology; Writing – review & editing); Chun Liang Hsu (Data curation; Methodology; Writing – review & editing); Todd C Handy (Supervision; Writing – review & editing); Ging-Yuek Hsiung (Supervision; Writing – review & editing); Teresa Liu-Ambrose (Conceptualization; Funding acquisition; Methodology; Project administration; Resources; Supervision; Writing – review & editing).
ACKNOWLEDGMENTS
We thank the participants for their time and dedication.
RGS is a Vascular Trainee PhD Scholar. TLA is a Canada Research Chair (Tier 1) in Healthy Aging. NCBSS is supported by fellowships from the Canadian Institutes of Health Research, Michael Smith Health Research BC, and Canadians for Leading Edge Alzheimer Research.
FUNDING
This work was supported by a grant provided by Rosetta Stone Canada to the University of British Columbia. They provided the FitBrains® program and technical support for the program. Rosetta Stone Canada had no role in study design, study management, data collection, data analysis, data interpretation, and manuscript drafting, manuscript review for important intellectual content, or the decision to submit and publish the manuscript.
CONFLICT OF INTEREST
The authors have no conflict of interest to report.
DATA AVAILABILITY
The data supporting the findings of this study are available on request from the corresponding author. The data are not publicly available due to privacy or ethical restrictions.
SUPPLEMENTARY MATERIAL
[1] The supplementary material is available in the electronic version of this article: https://dx.doi.org/10.3233/ADR-230206.
REFERENCES
[1] | Middleton A , Fritz SL , Lusardi M ((2015) ) Walking speed: The functional vital sign. J Aging Phys Act 23: , 314–322. |
[2] | Studenski S , Perera S , Patel K , Rosano C , Faulkner K , Inzitari M , Brach J , Chandler J , Cawthon P , Connor EB , Nevitt M , Visser M , Kritchevsky S , Badinelli S , Harris T , Newman AB , Cauley J , Ferrucci L , Guralnik J ((2011) ) Gait speed and survival in older adults. JAMA 305: , 50–58. |
[3] | Mielke MM , Roberts RO , Savica R , Cha R , Drubach DI , Christianson T , Pankratz VS , Geda YE , Machulda MM , Ivnik RJ , Knopman DS , Boeve BF , Rocca WA , Petersen RC ((2012) ) Assessing the temporal relationship between cognition and gait: Slow gait predicts cognitive decline in the mayo clinic study of aging. J Gerontol A Biol Sci Med Sci 68: , 929–937. |
[4] | Grande G , Triolo F , Nuara A , Welmer A-K , Fratiglioni L , Vetrano DL ((2019) ) Measuring gait speed to better identify prodromal dementia. Exp Gerontol 124: , 110625. |
[5] | Lee S , Kim EY , Shin C ((2019) ) Longitudinal association between brain volume change and gait speed in a general population. Exp Gerontol 118: , 26–30. |
[6] | Maidan I , Mirelman A , Hausdorff JM , Stern Y , Habeck CG ((2021) ) Distinct cortical thickness patterns link disparate cerebral cortex regions to select mobility domains. Sci Rep 11: , 6600. |
[7] | Byun S , Lee HJ , Kim JS , Choi E , Lee S , Kim TH , Kim JH , Han JW , Kim KW ((2023) ) Exploring shared neural substrates underlying cognition and gait variability in adults without dementia. Alzheimers Res Ther 15: , 206. |
[8] | Colcombe SJ , Erickson KI , Scalf PE , Kim JS , Prakash R , McAuley E , Elavsky S , Marquez DX , Hu L , Kramer AF ((2006) ) Aerobic exercise training increases brain volume in aging humans. J Gerontol A Biol Sci Med Sci 61: , 1166–1170. |
[9] | Firth J , Stubbs B , Vancampfort D , Schuch F , Lagopoulos J , Rosenbaum S , Ward PB ((2018) ) Effect of aerobic exercise on hippocampal volume in humans: A systematic review and meta-analysis. Neuroimage 166: , 230–238. |
[10] | Erickson KI , Voss MW , Prakash RS , Basak C , Szabo A , Chaddock L , Kim JS , Heo S , Alves H , White SM , Wojcicki TR , Mailey E , Vieira VJ , Martin SA , Pence BD , Woods JA , McAuley E , Kramer AF ((2011) ) Exercise training increases size of hippocampus and improves memory. Proc Natl Acad Sci U S A 108: , 3017–3022. |
[11] | ten Brinke LF , Bolandzadeh N , Nagamatsu LS , Hsu CL , Davis JC , Miran-Khan K , Liu-Ambrose T ((2015) ) Aerobic exercise increases hippocampal volume in older women with probable mild cognitive impairment: A 6-month randomised controlled trial. Br J Sports Med 49: , 248–254. |
[12] | Tajimi T , Furuta Y , Hirabayashi N , Honda T , Hata J , Ohara T , Shibata M , Nakao T , Kitazono T , Nakashima Y , Ninomiya T ((2023) ) Association of gait speed with regional brain volumes and risk of dementia in older Japanese: The Hisayama study. Arch Gerontol Geriatr 106: , 104883. |
[13] | Lee JS , Shin HY , Kim HJ , Jang YK , Jung N-Y , Lee J , Kim YJ , Chun P , Yang J-J , Lee J-M , Kang M , Park K-C , Na DL , Seo SW ((2016) ) Combined effects of physical exercise and education on age-related cortical thinning in cognitively normal individuals. Sci Rep 6: , 24284. |
[14] | Bashir S , Al-Sultan F , Jamea AA , Almousa A , Alzahrani MS , Alhargan FA , Abualait T , Yoo WK ((2021) ) Physical exercise and cortical thickness in healthy controls: A pilot study. Eur Rev Med Pharmacol Sci 25: , 7375–7379. |
[15] | ten Brinke LF , Davis JC , Barha CK , Liu-Ambrose T ((2017) ) Effects of computerized cognitive training on neuroimaging outcomes in older adults: A systematic review. BMC Geriatr 17: , 139. |
[16] | Jiang L , Cao X , Li T , Tang Y , Li W , Wang J , Chan RC , Li C ((2016) ) Cortical thickness changes correlate with cognition changes after cognitive training: Evidence from a Chinese community study. Front Aging Neurosci 8: , 118. |
[17] | Hill NT , Mowszowski L , Naismith SL , Chadwick VL , Valenzuela M , Lampit A ((2017) ) Computerized cognitive training in older adults with mild cognitive impairment or dementia: A systematic review and meta-analysis. Am J Psychiatry 174: , 329–340. |
[18] | Beauchet O , Annweiler C , Montero-Odasso M , Fantino B , Herrmann FR , Allali G ((2012) ) Gait control: A specific subdomain of executive function? J Neuroeng Rehabil 9: , 12. |
[19] | Marusic U , Verghese J , Mahoney JR ((2022) ) Does cognitive training improve mobility, enhance cognition, and promote neural activation? Front Aging Neurosci 14: , 845825. |
[20] | Blackwood J , Gore S ((2020) ) Effects of computerized cognitive training on physical mobility in community-dwelling older adults with cardiovascular disease: A pilot study. Cardiopulm Phys Ther J 31: , 105–112. |
[21] | Marusic U , Verghese J , Mahoney JR ((2018) ) Cognitive-based interventions to improve mobility: A systematic review and meta-analysis. J Am Med Dir Assoc 19: , 484–491.e483. |
[22] | ten Brinke LF , Best JR , Crockett RA , Liu-Ambrose T ((2018) ) The effects of an 8-week computerized cognitive training program in older adults: A study protocol for a randomized controlled trial. BMC Geriatr 18: , 31. |
[23] | ten Brinke LF , Best JR , Chan JLC , Ghag C , Erickson KI , Handy TC , Liu-Ambrose T ((2019) ) The effects of computerized cognitive training with and without physical exercise on cognitive function in older adults: An 8-week randomized controlled trial. J Gerontol A Biol Sci Med Sci 75: , 755–763. |
[24] | Folstein MF , Folstein SE , McHugh PR ((1975) ) “Mini-mental state”. Apractical method for grading the cognitive state of patients for theclinician. J Psychiatr Res 12: , 189–198. |
[25] | Lawton MP , Brody EM ((1969) ) Assessment of older people: Self-maintaining and instrumental activities of daily living. Gerontologist 9: , 179–186. |
[26] | Adams R ((1999) ) Revised Physical Activity Readiness Questionnaire. Can Fam Physician 45: 992, 995, 1004–1005. |
[27] | Nasreddine ZS , Phillips NA , Bedirian V , Charbonneau S , Whitehead V , Collin I , Cummings JL , Chertkow H ((2005) ) The Montreal Cognitive Assessment, MoCA: A brief screening tool for mild cognitive impairment. J Am Geriatr Soc 53: , 695–699. |
[28] | Groll DL , To T , Bombardier C , Wright JG ((2005) ) The development of a comorbidity index with physical function as the outcome. J Clin Epidemiol 58: , 595–602. |
[29] | Washburn RA , Smith KW , Jette AM , Janney CA ((1993) ) The Physical Activity Scale for the Elderly (PASE): Development and evaluation. J Clin Epidemiol 46: , 153–162. |
[30] | Washburn RA , McAuley E , Katula J , Mihalko SL , Boileau RA ((1999) ) The physical activity scale for the elderly (PASE): Evidence for validity. J Clin Epidemiol 52: , 643–651. |
[31] | Guralnik JM , Ferrucci L , Simonsick EM , Salive ME , Wallace RB ((1995) ) Lower-extremity function in persons over the age of 70 years as a predictor of subsequent disability. N Engl J Med 332: , 556–561. |
[32] | Reuter M , Schmansky NJ , Rosas HD , Fischl B ((2012) ) Within-subject template estimation for unbiased longitudinal image analysis. Neuroimage 61: , 1402–1418. |
[33] | Reuter M , Fischl B ((2011) ) Avoiding asymmetry-induced bias in longitudinal image processing. Neuroimage 57: , 19–21. |
[34] | Reuter M , Rosas HD , Fischl B ((2010) ) Highly accurate inverse consistent registration: A robust approach. Neuroimage 53: , 1181–1196. |
[35] | Diamond K , Mowszowski L , Cockayne N , Norrie L , Paradise M , Hermens DF , Lewis SJG , Hickie IB , Naismith SL ((2015) ) Randomized controlled trial of a healthy brain ageing cognitive training program: Effects on memory, mood, and sleep. J Alzheimers Dis 44: , 1181–1191. |
[36] | Carvalho VO , Bocchi EA , Guimar , Atilde , Es GV ((2009) ) The Borg Scale as an important tool of self-monitoring and self-regulation of exercise prescription in heart failure patients during hydrotherapy. Circ J 73: , 1871–1876. |
[37] | Stamford BA ((1976) ) Validity and reliability of subjective ratings of perceived exertion during work. Ergonomics 19: , 53–60. |
[38] | Team RC (2022) R: A language and environment for statistical computing. R Foundation for Statistical Computing. |
[39] | Team R (2022) RStudio: Integrated development environment for R. RStudio. |
[40] | Yoshida K , Bartel A (2021) tableone: Create ‘Table 1’ to describe baseline characteristics with or without propensity score weights. R package version 0.13.0. |
[41] | Johansen AM (2010) Monte Carlo Methods. In International Encyclopedia of Education (Third Edition), Peterson P, Baker E, McGaw B, eds. Elsevier, Oxford, pp. 296-303. |
[42] | Lakens D ((2013) ) Calculating and reporting effect sizes to facilitate cumulative science: A practical primer for t-tests and ANOVAs. Front Psychol 4: , 863. |
[43] | Schober P , Boer C , Schwarte LA ((2018) ) Correlation coefficients: Appropriate use and interpretation. Anesth Analg 126: , 1763–1768. |
[44] | Niskanen E , Könönen M , Määttä S , Hallikainen M , Kivipelto M , Casarotto S , Massimini M , Vanninen R , Mervaala E , Karhu J , Soininen H ((2011) ) New insights into Alzheimer’s diseaseprogression: A combined TMS and structural MRI study. PloS One 6: , e26113. |
[45] | Spreen O , Strauss E (1998) A compendium of neurological tests. Oxford University Press, Inc., New York. |
[46] | Weintraub S , Bauer PJ , Zelazo PD , Wallner-Allen K , Dikmen SS , Heaton RK , Tulsky DS , Slotkin J , Blitz DL , Carlozzi NE , Havlik RJ , Beaumont JL , Mungas D , Manly JJ , Borosh BG , Nowinski CJ , Gershon RC ((2013) ) I. NIH Toolbox Cognition Battery (CB): Introduction and pediatric data. Monogr Soc Res Child Dev 78: , 1–15. |
[47] | Trenerry M , Crosson B , DeBoe J , Leber W (1989) Stroop Neuropsychological Screening Test. Psychological Assessment Resources, Odessa, FL. |
[48] | Lampit A , Hallock H , Suo C , Naismith SL , Valenzuela M ((2015) ) Cognitive training-induced short-term functional and long-term structural plastic change is related to gains in global cognition in healthy older adults: A pilot study. Front Aging Neurosci 7: , 14. |
[49] | Bugg JM , Head D ((2011) ) Exercise moderates age-related atrophy of the medial temporal lobe. Neurobiol Aging 32: , 506–514. |
[50] | Suzuki T , Shimada H , Makizako H , Doi T , Yoshida D , Ito K , Shimokata H , Washimi Y , Endo H , Kato T ((2013) ) A randomized controlled trial of multicomponent exercise in older adults with mild cognitive impairment. PloS One 8: , e61483–e61483 |
[51] | Sivaramakrishnan A , Zuhl M , Mang CS ((2022) ) Exercise priming: The use of physical exercise to support motor and cognitive function. Front Psychol 13: , 1043611. |
[52] | Fissler P , Küster O , Schlee W , Kolassa I-T (2013) Chapter 16 –Novelty interventions to enhance broad cognitive abilities and prevent dementia: Synergistic approaches for the facilitation of positive plastic change. In Progress in Brain Research, Merzenich MM, Nahum M, Van Vleet TM, eds. Elsevier, pp. 403-434. |
[53] | Tait JL , Duckham RL , Milte CM , Main LC , Daly RM ((2017) ) Influence of sequential vs. simultaneous dual-task exercise training on cognitive function in older adults. Front Aging Neurosci 9: , 368. |
[54] | Siddarth P , Burggren AC , Eyre HA , Small GW , Merrill DA ((2018) ) Sedentary behavior associated with reduced medial temporal lobe thickness in middle-aged and older adults. PloS One 13: , e0195549. |
[55] | Rogge A-K , Röder B , Zech A , Hötting K ((2018) ) Exercise-induced neuroplasticity: Balance training increasescortical thickness in visual and vestibular cortical regions. Neuroimage 179: , 471–479. |
[56] | Colcombe SJ , Erickson KI , Raz N , Webb AG , Cohen NJ , McAuley E , Kramer AF ((2003) ) Aerobic fitness reduces brain tissue loss in aging humans. J Gerontol A Biol Sci Med Sci 58: , M176–M180. |
[57] | Tian Q , Studenski SA , Montero-Odasso M , Davatzikos C , Resnick SM , Ferrucci L ((2021) ) Cognitive and neuroimaging profiles of older adults with dual decline in memory and gait speed. Neurobiol Aging 97: , 49–55. |
[58] | DiSalvio NL , Rosano C , Aizenstein HJ , Redfern MS , Furman JM , Jennings JR , Whitney SL , Sparto PJ ((2020) ) Gray matter regionsassociated with functional mobility in community-dwelling olderadults. J Am Geriatr Soc 68: , 1023–1028. |
[59] | DiGuiseppi J , Tadi P (2023) Neuroanatomy, postcentral gyrus. In StatPearls, StatPearls Publishing, Treasure Island (FL). |
[60] | Rolls ET , Deco G , Huang C-C , Feng J ((2023) ) Prefrontal and somatosensory-motor cortex effective connectivity in humans. Cereb Cortex 33: , 4939–4963. |
[61] | Pinter D , Ritchie SJ , Gattringer T , Bastin ME , Hernández M , Corley J , Maniega SM , Pattie A , Dickie DA , Gow AJ , Starr JM , Deary IJ , Enzinger C , Fazekas F , Wardlaw J ((2018) ) Predictors of gait speedand its change over three years in community-dwelling older people. Aging (Albany NY) 10: , 144–153. |
[62] | Anderson DE , Madigan ML ((2014) ) Healthy older adults have insufficient hip range of motion and plantar flexor strength to walk like healthy young adults. J Biomech 47: , 1104–1109. |
[63] | Osoba MY , Rao AK , Agrawal SK , Lalwani AK ((2019) ) Balance and gait in the elderly: A contemporary review. Laryngoscope Investig Otolaryngol 4: , 143–153. |
[64] | Fiser WM , Hays NP , Rogers SC , Kajkenova O , Williams AE , Evans CM , Evans WJ ((2010) ) Energetics of walking in elderly people: Factors related to gait speed. J Gerontol A Biol Sci Med Sci 65A: , 1332–1337. |
[65] | Taylor JL , Parker LJ , Szanton SL , Thorpe RJ ((2018) ) The association of pain, race and slow gait speed in older adults. Geriatr Nurs 39: , 580–583. |
[66] | Engvig A , Fjell AM , Westlye LT , Moberget T , Sundseth O , Larsen VA , Walhovd KB ((2010) ) Effects of memory training on cortical thickness in the elderly. Neuroimage 52: , 1667–1676. |
[67] | Falck RS , McDonald SM , Beets MW , Brazendale K , Liu-Ambrose T ((2016) ) Measurement of physical activity in older adult interventions: A systematic review. Br J Sports Med 50: , 464–470. |
[68] | Van Ancum JM , van Schooten KS , Jonkman NH , Huijben B , van Lummel RC , Meskers CGM , Maier AB , Pijnappels M ((2019) ) Gait speed assessed by a 4-m walk test is not representative of daily-life gait speed in community-dwelling adults. Maturitas 121: , 28–34. |
[69] | Takayanagi N , Sudo M , Yamashiro Y , Lee S , Kobayashi Y , Niki Y , Shimada H ((2019) ) Relationship between daily and in-laboratory gait speed among healthy community-dwelling older adults. Sci Rep 9: , 3496. |
[70] | Verghese J , Wang C , Holtzer R ((2011) ) Relationship of clinic-based gait speed measurement to limitations in community-based activities in older adults. Arch Phys Med Rehabil 92: , 844–846. |
[71] | U.S. Department of Health and Human Services (2018) Physical Activity Guidelines for Americans, 2nd edition. https://health.gov/paguidelines/second-edition/pdf/Physical_Activity_Guidelines_2nd_edition.pdf |


