
Causal Relationship Between Ferritin and Neuropsychiatric Disorders: A Two-Sample Mendelian Randomization Study
Abstract
Background:
Previous observational research has indicated a correlation between ferritin levels and neuropsychiatric disorders, although the causal relationship remains uncertain.
Objective:
The objective of this study was to investigate the potential causal link between plasma ferritin levels and neuropsychiatric disorders.
Methods:
A two-sample Mendelian randomization (MR) study was conducted, wherein genetic instruments associated with ferritin were obtained from a previously published genome-wide association study (GWAS). Summary statistics pertaining to neuropsychiatric disorders were derived from five distinct GWAS datasets. The primary MR analysis employed the inverse variance weighted (IVW) method and was corroborated by additional methods including MR-Egger, weighted median, simple mode, and weighted mode. Sensitivity analyses were employed to identify potential pleiotropy and heterogeneity in the results.
Results:
The fixed effects IVW method revealed a statistically significant causal relationship between plasma ferritin level and the occurrence of Alzheimer’s disease (odds ratio [OR] = 1.06, 95% confidence interval [CI]: 1.00–1.12, p = 0.037), as well as Parkinson’s disease (OR = 1.06, 95% CI: 1.00–1.13, p = 0.041). Various sensitivity analyses were conducted, which demonstrated no substantial heterogeneity or pleiotropy. Conversely, no compelling evidence was found to support a causal association between ferritin and amyotrophic lateral sclerosis, schizophrenia, or major depressive disorder.
Conclusions:
This MR study provides evidence at the genetic level for a causal relationship between plasma ferritin and an increased risk of Alzheimer’s disease and Parkinson’s disease. The exact genetic mechanisms underlying this connection necessitate further investigation.
INTRODUCTION
Ferritin, a protein responsible for storing iron, is a spherical protein with a molecular weight of 480 kDa, comprising of ferritin heavy chain and ferritin light chain [1]. Ferritin is a critical component in maintaining iron homeostasis by storing and releasing iron [2]. The ferritin-iron complex plays a pivotal role in numerous biological processes, encompassing DNA synthesis, oxidative stress response, cellular iron homeostasis, and mitochondrial respiration, thereby constituting a significant etiological factor in neurological disorders [3].
Ferritin is predominantly accumulated within the senile plaques of Alzheimer’s disease (AD) and in neurons harboring neuromelanin within Lewy bodies of Parkinson’s disease (PD) [4]. Previous research has demonstrated that individuals afflicted with neurodegenerative disorders exhibit distinct levels of ferritin in their cerebrospinal fluid compared to healthy individuals, with elevated ferritin levels observed in patients diagnosed with AD and amyotrophic lateral sclerosis (ALS) [5, 6]. According to a report, elevated ferritin levels have been identified as a novel peripheral blood biomarker in individuals diagnosed with schizophrenia [7]. Previous study revealed that patients with major depressive disorder (MDD) exhibited lower levels of ferritin light chain compared to those in the control group [8]. These results suggest that ferritin plays a significant role in neuropsychiatric disorders and holds potential as a biomarker for such conditions.
Observational studies have indicated a potential correlation between ferritin levels and the occurrence of neurodegenerative and psychiatric disorders. However, the exact causal relationship remains uncertain. Mendelian randomization (MR), a novel epidemiological approach that adheres to the principles of random allocation and free combination as dictated by genetic laws, can be considered as a natural form of randomized controlled trial [9]. By employing genetic variations as instrumental variables (IVs) to examine causality between the exposure and outcome, MR offers a valuable means of analysis [10]. It avoids the influence of reverse causality or potential confounding factors in observational studies [11]. The aim of this study was to investigate the causal relationship between ferritin and neuropsychiatric disorders using a two-sample MR analysis.
MATERIALS AND METHODS
Study design
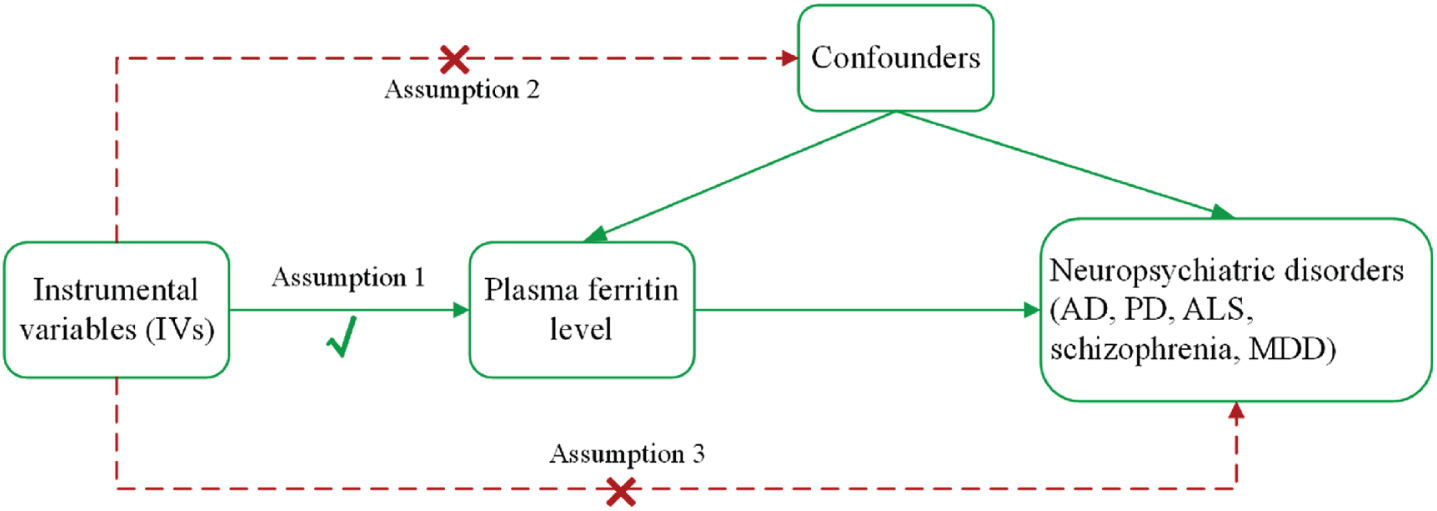
In this study, we performed a two-sample MR analysis to investigate a causal relationship between plasma ferritin levels and neuropsychiatric disorders (AD, PD, ALS, schizophrenia, and MDD). The main design of this MR study is presented in Fig. 1. For the reliability of MR results, the MR analysis needs to meet three main assumptions [9]: the genetic variants used as IVs are strongly related to exposure (plasma ferritin level) with genome-wide significance; the genetic variants are not related to any confounding factors that affect exposure and outcomes; and the genetic variants only affect outcomes through exposure. This study adhered to the Strengthening the Reporting of Observational Studies in Epidemiology–Mendelian randomization (STROBE-MR) guidelines [12] (see Supplementary Material).
Fig. 1
The main assumptions and study design of the Mendelian randomization analysis of plasma ferritin and neuropsychiatric disorders. AD, Alzheimer’s disease; ALS, amyotrophic lateral sclerosis; MDD, major depressive disorder; PD, Parkinson’s disease.
Data source
In this study, we procured genome-wide association study (GWAS) summary data pertaining to plasma ferritin and neuropsychiatric disorders from previously published studies (Table 1). The genetic variants associated with plasma ferritin were sourced from extensive GWAS conducted on individuals of European ancestry [13], encompassing a sample size of 3,301 participants from the INTERVAL study. The summary data of AD were acquired from GWAS of 63,926 European individuals, conducted by the International Genomics of Alzheimer’s Project consortium [14]. Summary statistical data for PD were extracted from International Parkinson’s Disease Genomics Consortium [15], including 482,730 European individuals. Genetic variants associated with ALS were obtained from Project MinE [16], which comprised 12,577 cases and 23,475 controls of European ancestry. For the schizophrenia summary dataset, 33,640 cases and 43,456 control of European ancestry genetic variants were obtained from the Psychiatric Genomics Consortium (PGC) [17]. The summary data for MDD used in this MR study were also obtained from the PGC [18], including 59,851 cases and 113,154 controls of European ancestry. Since this is a secondary analysis of data obtained from previously published GWAS data above, no ethical approvals were required.
Table 1
Characteristics of GWAS datasets used for Mendelian randomization analysis
| Phenotype | GWAS ID | Consortium | Sample size | Population | Journal | References |
| (cases/controls) | ||||||
| Plasma ferritin | prot-a-1148 | – | 3,301 | European | Nature | Sun et al., 2018 [13] |
| AD | ieu-b-2 | IGAP | 21,982/41,944 | European | Nat Genet | Kunkle et al., 2019 [14] |
| PD | ieu-b-7 | IPDGC | 33,674/449,056 | European | Lancet Neurol | Nalls et al., 2019 [15] |
| ALS | ieu-a-1085 | Project MinE | 12,577/23,475 | European | Nat Genet | van Rheenen et al., 2016 [16] |
| Schizophrenia | ieu-b-42 | PGC | 33,640/43,456 | European | Nat Genet | Ripke et al., 2013 [17] |
| MDD | ieu-a-1188 | PGC | 59,851/113,154 | European | Nat Genet | Wray et al., 2018 [18] |
AD, Alzheimer’s disease; ALS, amyotrophic lateral sclerosis; GWAS, genome wide association studies; IGAP, International Genomics of Alzheimer’s Project; IPDGC, International Parkinson’s Disease Genomics Consortium; MDD, major depressive disorder; PD, Parkinson’s disease; PGC, Psychiatric Genomics Consortium.
Single-nucleotide polymorphism selection
First, plasma ferritin level was used as the exposure, and five SNPs with a genome-wide significance threshold (p < 5×10⁻⁸) were selected as genetic instruments to investigate the effect on outcomes. Then, linkage disequilibrium [19] (r2 > 0.01, kb < 10000) was performed to ensure that the genetic variants were independent. Furthermore, F statistic was used to measure the strength of IVs and F statistic > 10 suggests strong instruments [20]. The F statistic of each SNP in this MR study were calculated based on formula: F statistic = R2×(N – 2)/(1 – R2), R2 = 2×EAF×(1 – EAF)×β2. We calculated the F-statistic of these SNPs (ranging from 30.1 to 307.2), indicating they were strong instruments for this MR analyses. Finally, each SNP was searched in PhenoScanner database [21] (http://www.phenoscanner.medschl.cam.ac.uk/) to assess whether these SNPs were associated with confounding factors. The power calculation was performed using the online power calculator (https://sb452.shinyapps.io/power) [22].
Statistical analyses
The two-sample MR package were conducted to estimate the causal relationship between exposures and outcomes, and inverse variance weighted (IVW) was used as the primary MR analysis [23]. In addition, we used the MR-Egger, weighted median, simple mode and weighted mode for additional analysis. Sensitivity analyses were conducted to assess heterogeneity and pleiotropy using the Cochran Q heterogeneity test [24], Egger intercept test [25], MR pleiotropy residual sum and outlier (MR-PRESSO) global test [26], and leave-one-out test [27]. The sensitivity analyses ensure the stability of this study results. In addition, MR-Steiger test was used to validate the causal direction between exposure and outcomes[28]. The statistical analyses were conducted using R (version 4.2.1), and causal associations were deemed significant if the two-sided p-values < 0.05. The odds ratios (OR) and 95% confidence intervals (CIs) were utilized to report the MR estimates.
RESULTS
This study employed a two-sample MR to examine the causal association between ferritin and neuropsychiatric disorders. Plasma ferritin levels were used as exposure variable, matched to 4 available SNPs for AD and MDD outcomes, and 5 SNPs for PD, ALS, and schizophrenia. These SNPs, serving as genetic instruments, exhibited a strong and statistically significant association with the exposure variable (plasma ferritin) at a genome-wide significance level (p < 5×10⁻⁸). The detailed characteristics of these SNPs can be found in Table 2. The primary estimates of the causal effects obtained through the MR analysis are presented in Table 3 and Fig. 2. This study exposure and outcome data were collected separately from different databases belonging to different consortium (see Table 1). Secondly, we calculated the deviation (https://sb452.shinyapps.io/overlap/) and there was no obvious overlap in the samples.
Table 2
Genetic variants significantly associated with ferritin
| SNPs | Nearby gene | EA | OA | EAF | β-exposure | se-exposure | p-exposure | R2 | F-statistic |
| rs217181 | TXNL4B | T | C | 0.196 | 0.524 | 0.030 | 7.4×10–69 | 0.085 | 307.25 |
| rs10492823 | PKD1L3 | C | G | 0.128 | 0.386 | 0.036 | 3.1×10⁻²⁶ | 0.033 | 112.34 |
| rs79570224 | LINC01572 | C | T | 0.081 | 0.391 | 0.045 | 5.3×10⁻¹⁸ | 0.022 | 74.68 |
| rs241775 | TMEM97 | T | C | 0.478 | –0.163 | 0.024 | 1.8×10⁻¹¹ | 0.013 | 45.01 |
| rs79031610 | LINC01572 | T | C | 0.098 | –0.237 | 0.043 | 4.1×10–08 | 0.009 | 30.10 |
EAF, effect allele frequency; EA, effect allele; OA, other allele; SNPs, single-nucleotide polymorphisms; SE, standard error. The threshold was set at p < 1×10⁻⁵.
Table 3
Main MR results of the effect of ferritin on neuropsychiatric disorders
| AD | PD | ALS | Schizophrenia | MDD | ||||||
| SNPs | OR (95% CI) | p | OR (95% CI) | p | OR (95% CI) | p | OR (95% CI) | p | OR (95% CI) | p |
| rs217181 | 1.04 (1.00–1.08) | 0.026 | 1.05 (1.01–1.09) | 0.028 | 1.00 (1.00–1.01) | 0.279 | 1.00 (0.97–1.03) | 0.950 | 0.99 (0.97–1.01) | 0.190 |
| rs10492823 | 1.00 (0.96–1.04) | 0.932 | 1.02 (0.97–1.07) | 0.422 | 1.01 (1.00–1.02) | 0.064 | 1.01 (0.98–1.04) | 0.687 | 1.01 (0.99–1.04) | 0.243 |
| rs79570224 | 0.99 (0.94–1.05) | 0.752 | 1.04 (0.97–1.11) | 0.266 | 0.99 (0.98–1.01) | 0.274 | 1.02 (0.98–1.06) | 0.315 | 1.01 (0.98–1.04) | 0.708 |
| rs241775 | 0.99 (0.97–1.02) | 0.613 | 1.02 (0.98–1.05) | 0.351 | 0.99 (0.98–1.00) | 0.007 | 1.00 (0.98–1.02) | 0.766 | 1.00 (0.98–1.01) | 0.593 |
| rs79031610 | 0.97 (0.92–1.03) | 0.355 | 1.01 (0.94–1.08) | 0.758 | 1.01 (1.00–1.02) | 0.142 | 1.04 (1.00–1.08) | 0.080 | 1.01 (0.99–1.04) | 0.321 |
AD, Alzheimer’s disease; ALS, amyotrophic lateral sclerosis; CI, confidence interval; MDD, major depressive disorder; OR, odds ratio; PD, Parkinson’s disease.
Fig. 2
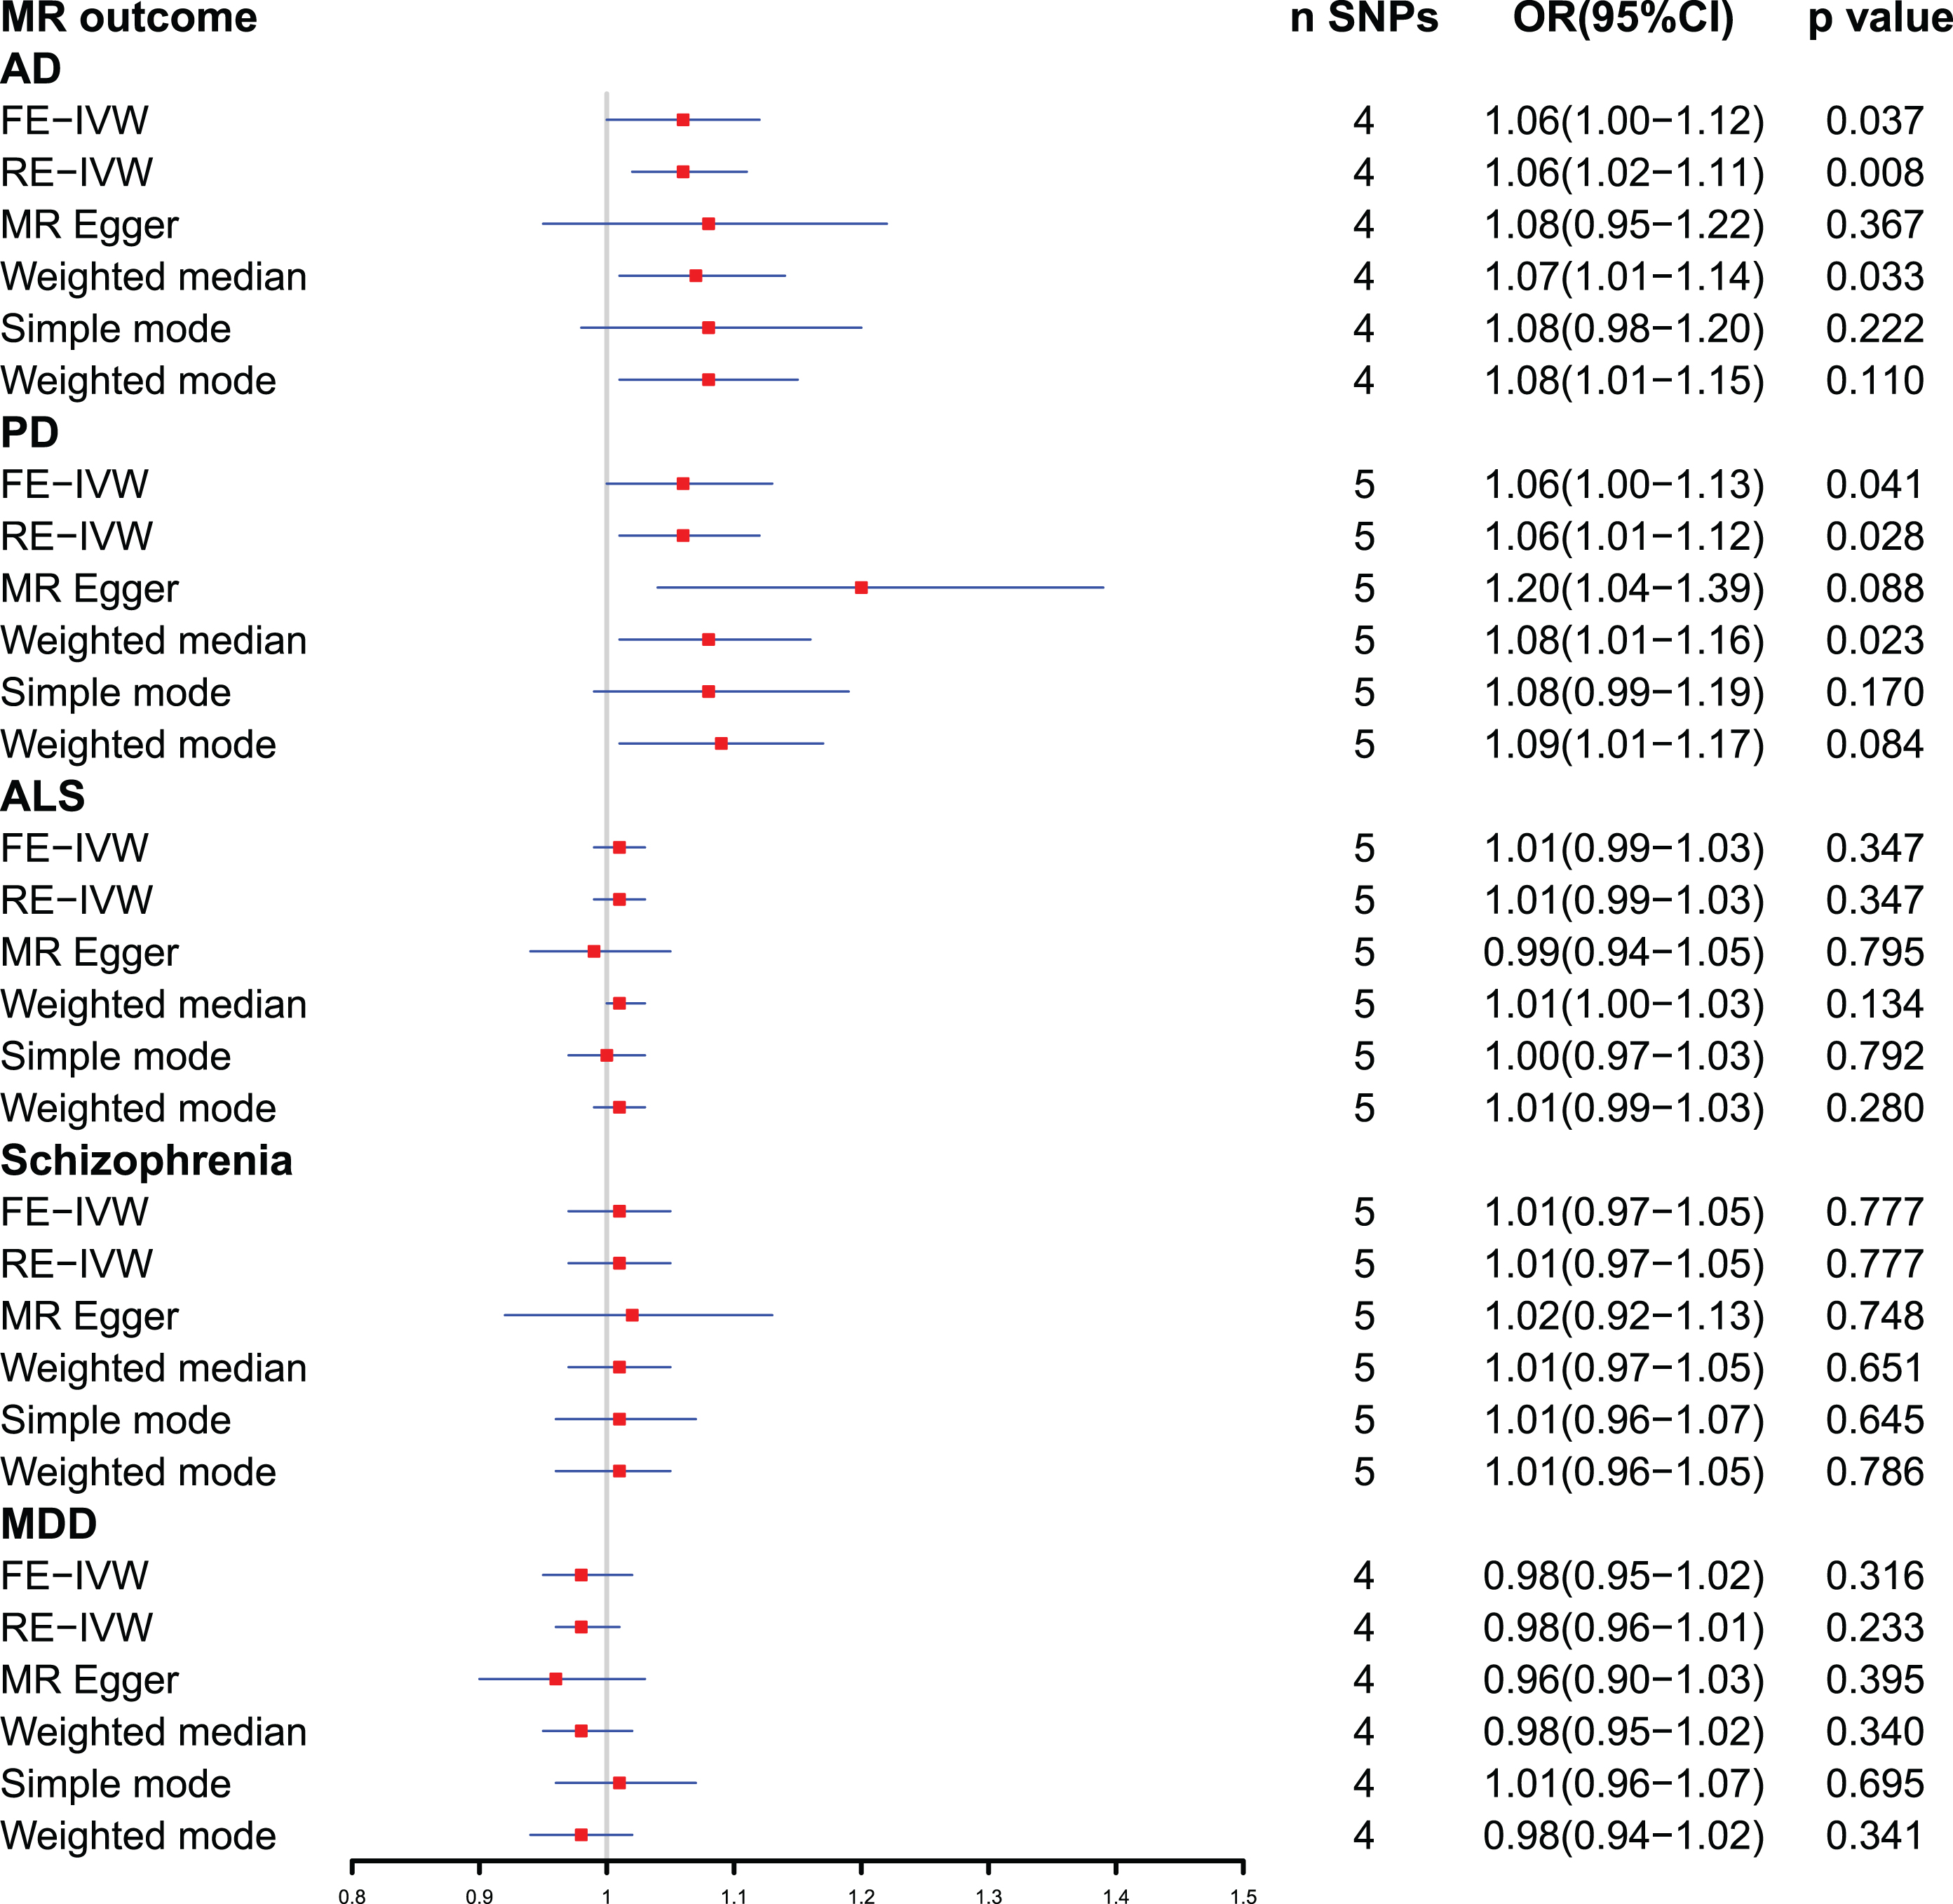
Forest plot of Mendelian randomization analysis between plasma ferritin level and neuropsychiatric disorders. AD, Alzheimer’s disease; ALS, amyotrophic lateral sclerosis; CI, confidential interval; FE-IVW, fixed effects-inverse variance weighted; MDD, major depressive disorder; MR, Mendelian randomization; OR, odds ratio; PD, Parkinson’s disease; RE-IVW, random effects-inverse variance weighted; SNPs, single-nucleotide polymorphisms.
Effect of plasma ferritin level on risk of AD
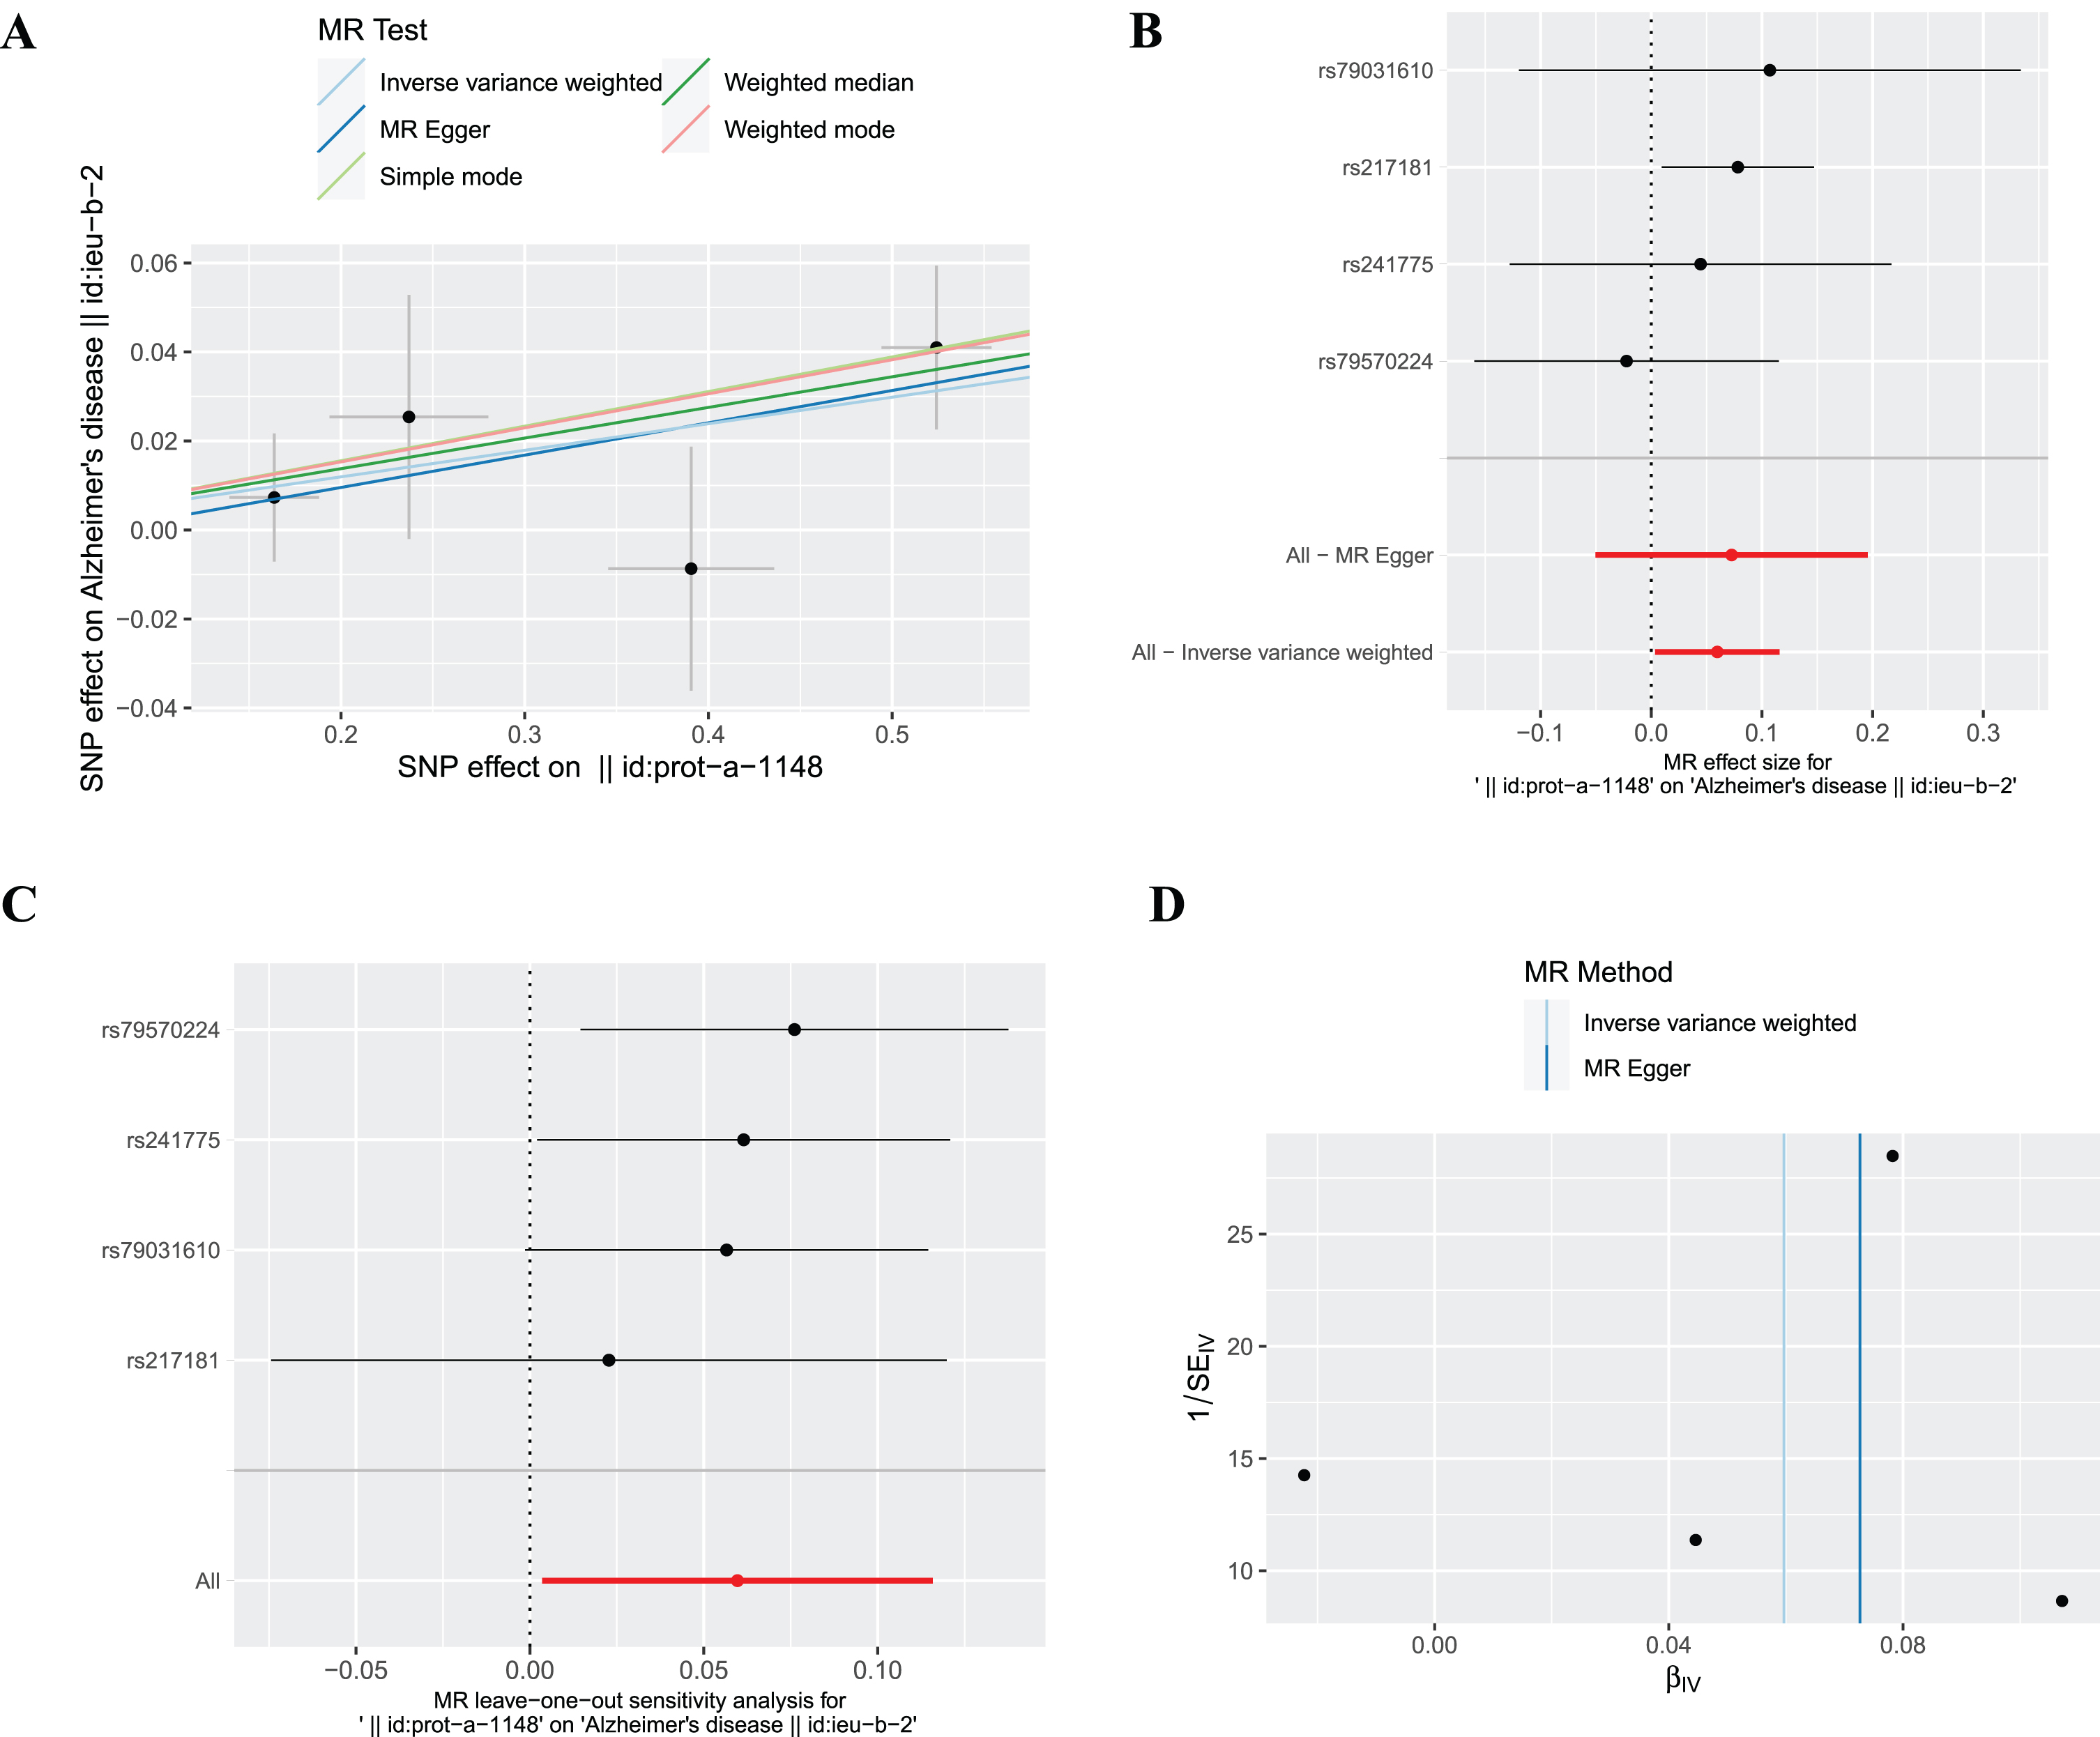
The SNP (rs10492823) with intermediate allele frequency palindrome was removed and 4 SNPs were included in MR analysis of plasma ferritin levels and AD. As shown in Fig. 2, the fixed effects IVW method indicated causal relationship between plasma ferritin level and AD [odds ratio (OR) = 1.06, 95% confidence interval (CI):1.00–1.12, p = 0.037], and statistical power value was 71.3%. Random effects IVW also showed a causal effect of plasma ferritin on AD (OR = 1.06, 95% :1.02–1.11, p = 0.008). In addition, the weighted median supported the above results (OR = 1.07, 95% :1.01–1.14, p = 0.033). This evidence suggested that each standard deviation increase in plasma ferritin level was associated with an increased risk of AD. The scatterplots and forest plots visually showed an increased risk of AD as plasma ferritin level rise (Fig. 3A, B). In the sensitivity analyses (Table 4), Cochran’s Q test demonstrated no heterogeneity (Q-value = 1.842, p = 0.606), and MR-Egger intercept test showed no pleiotropic effects (intercept = – 0.005, p = 0.838). The MR-PRESSO test detected no SNP with potentially pleiotropic outlier (p = 0.599). The Steiger direction test results showed that the causal direction was valid (Steiger-p = 1.3×10–83) and there was no reverse causal relationship. The leave-one-out plot showed that the results were robust and that the causal effect of plasma ferritin level on AD was not driven by any single SNP (Fig. 3C). The funnel chart showed the overall symmetry between SNPs (Fig. 3D).
Fig. 3
The causal effect of ferritin on AD. (A) Scatter plot, (B) Forest plot, (C) Leave one out plot and (D) Funnel plot. MR, Mendelian randomization; SNPs, single-nucleotide polymorphisms.
Effect of plasma ferritin level on risk of PD
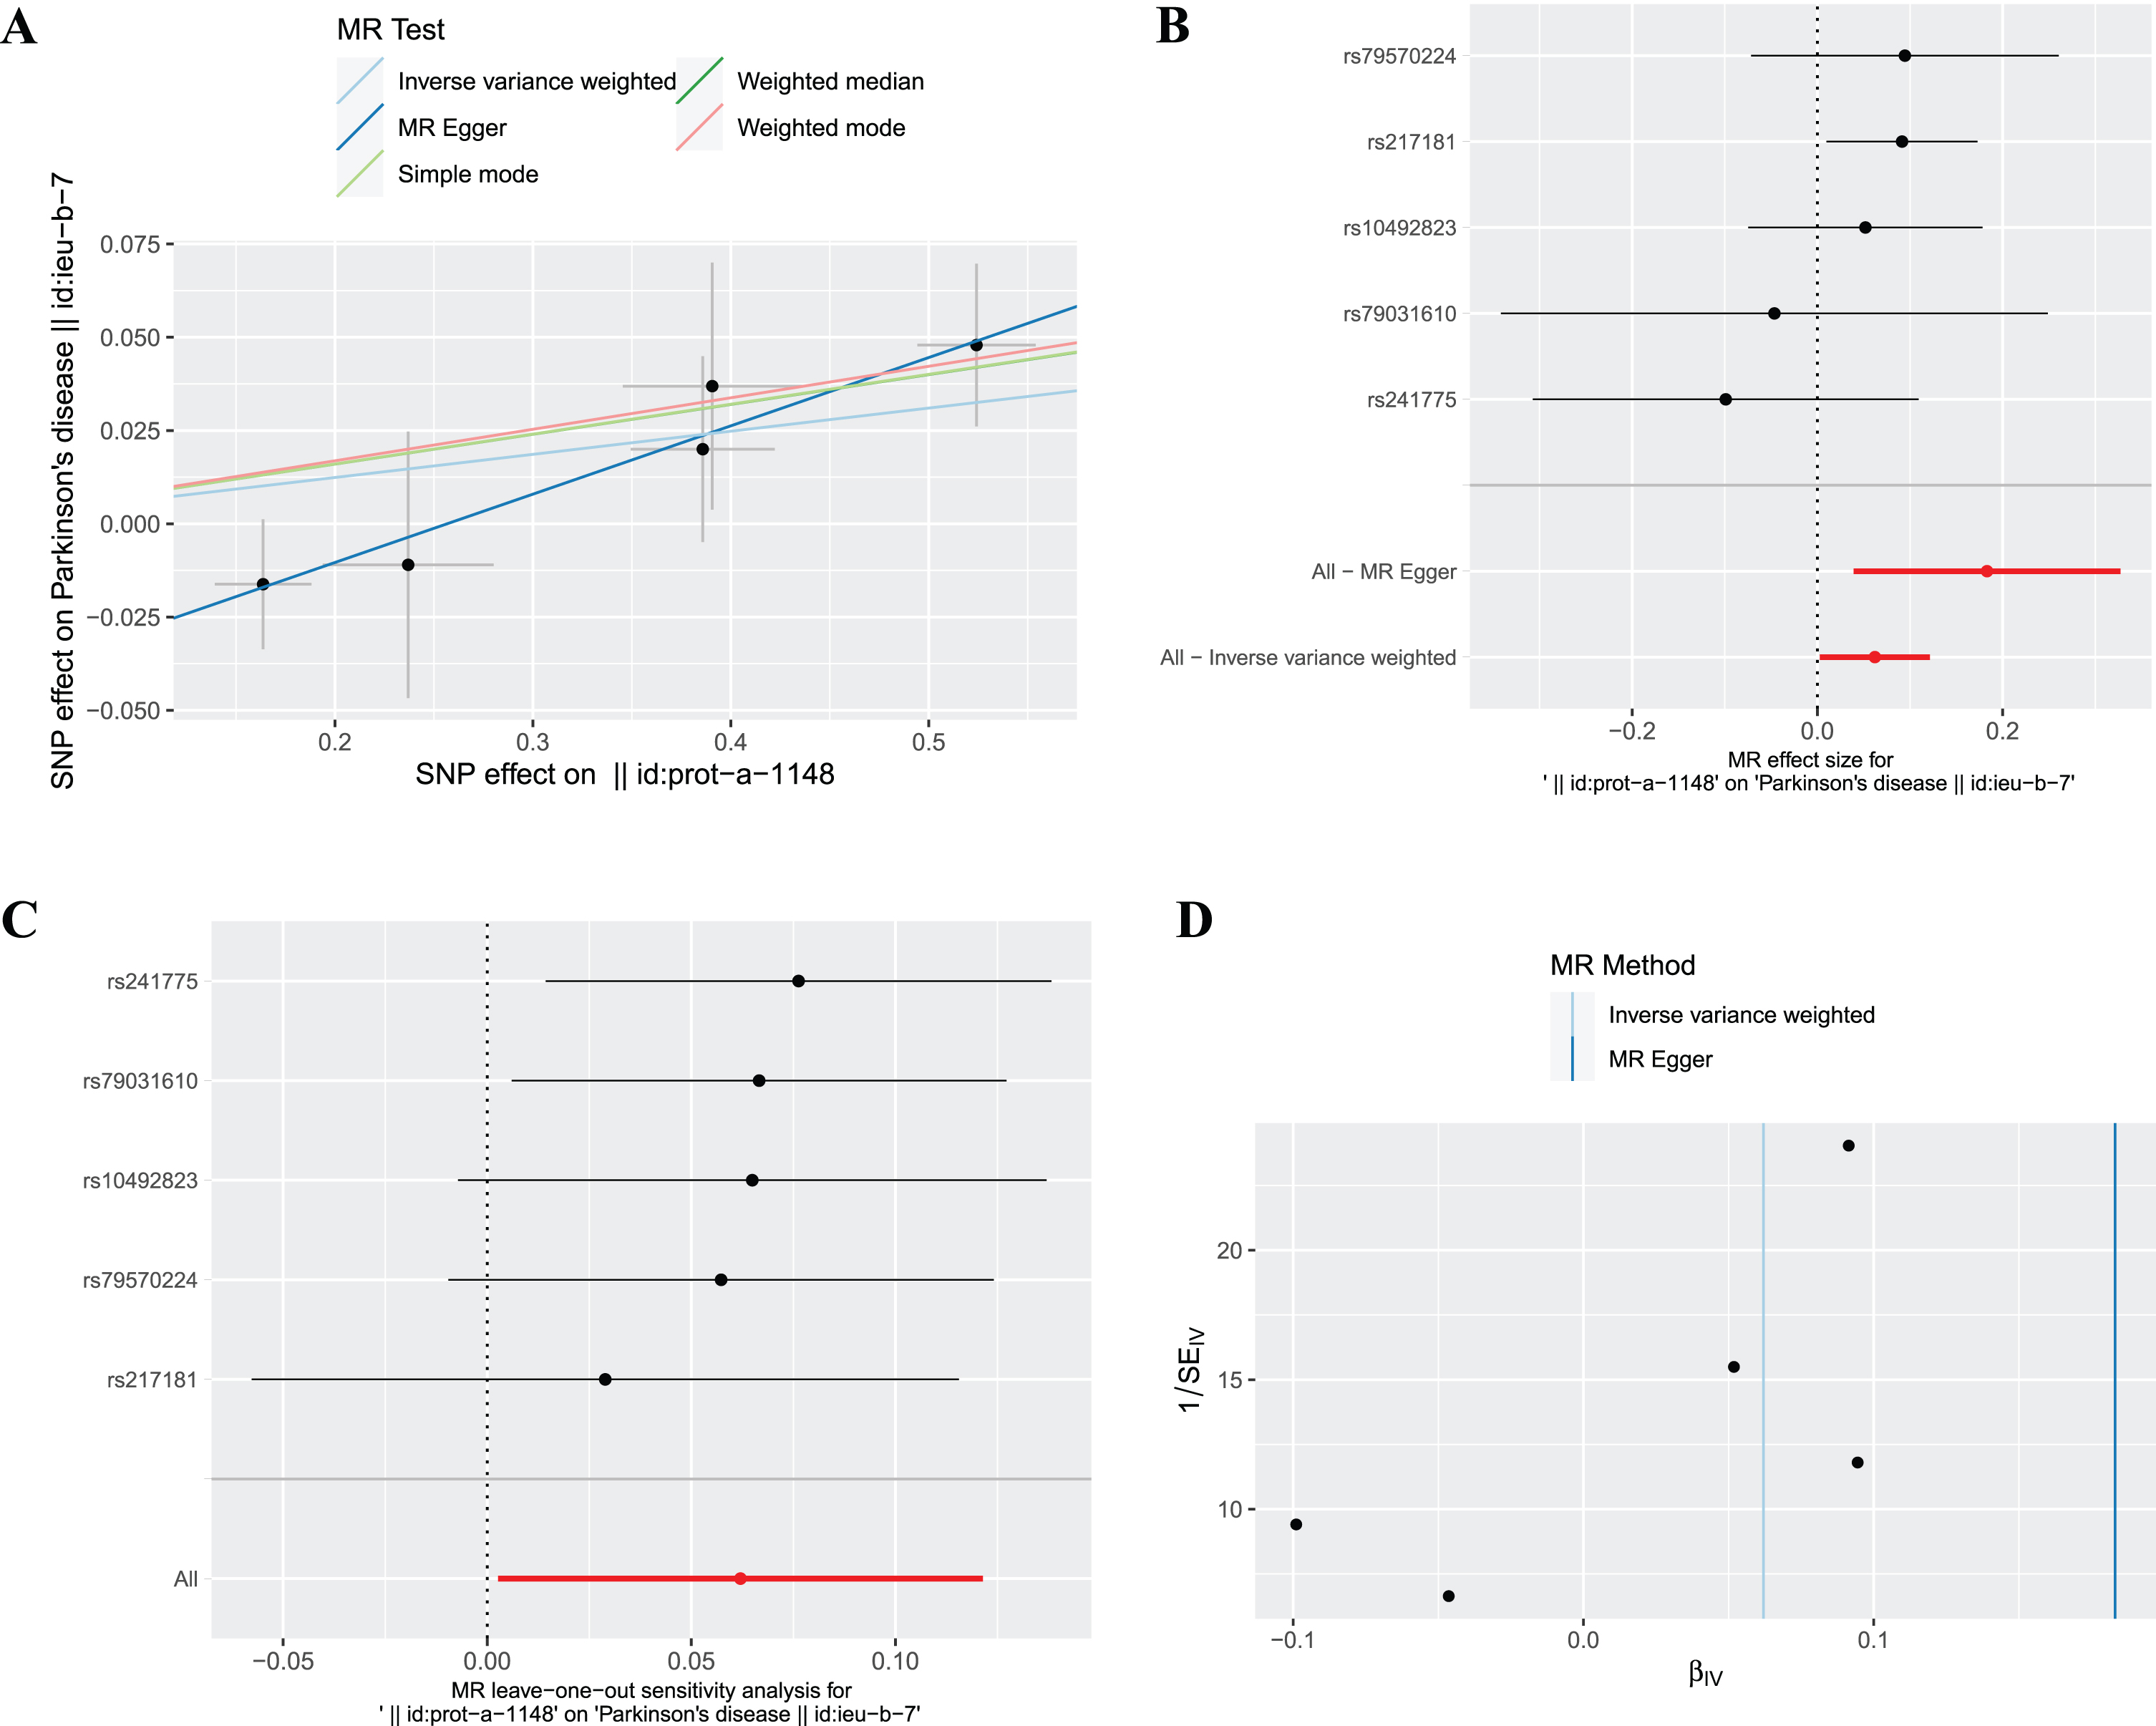
The fixed effects IVW results in Fig. 2 demonstrated that the causal effect of plasma ferritin level on PD was significant (OR = 1.06, 95% : 1.00–1.13, p = 0.041), and statistical power value was 98.6%. This causal effect was also confirmed by random effects IVW model (OR = 1.06, 95% :1.01–1.12, p = 0.028). In addition, this causal association was consistent using the weighted median method (OR = 1.08, 95% :1.01–1.16, p = 0.023). Scatter plots and forest plots show a positive correlation between plasma ferritin level and PD risk (Fig. 4A, B). In the sensitivity analyses (Table 4), the MR-Egger analysis and Cochran’s Q test showed that there was no horizontal pleiotropic (intercept =–0.047, p = 0.168) or heterogeneity (Q-value = 3.482, p = 0.481) about plasma ferritin level on PD. The MR-PRESSO global test revealed no evidence for horizontal pleiotropic effects of the IVs (p = 0.509). The Steiger test results showed that the causal direction was valid (Steiger-p = 1.1×10–86). By leave-one-out analysis, the causal effect of plasma ferritin level on AD were robust (Fig. 4C). There was no evidence of asymmetry on the funnel plot (Fig. 4D).
Fig. 4
The causal effect of ferritin on PD. (A) Scatter plot, (B) Forest plot, (C) Leave one out plot and (D) Funnel plot. MR, Mendelian randomization; SNPs, single-nucleotide polymorphisms.
Effect of plasma ferritin level on risk of ALS, schizophrenia, and MDD
The primary outcome IVW analysis (Fig. 2) showed no causal association between ferritin and ALS (OR = 1.01, 95% :0.99–1.03, p = 0.347), schizophrenia (OR = 1.01, 95% :0.97–1.05, p = 0.777), and MDD (OR = 0.98, 95% :0.95–1.02, p = 0.316). In the sensitivity analyses (Table 4), there was no pleiotropy for the relationship between the SNPs and risk of ALS (intercept = 0.007, p = 0.528), schizophrenia (intercept =–0.005, p = 0.802), and MDD (intercept = 0.008, p = 0.560). The results indicated heterogeneity for ALS (Q-value = 12.421, p = 0.014), while there was no heterogeneity in schizophrenia (Q-value = 4.242, p = 0.374) and MDD (Q-value = 2.122, p = 0.547). The MR-PRESSO test detected no SNP with potentially pleiotropic outlier for ALS (p = 0.081), schizophrenia (p = 0.537), and MDD (p = 0.589). The MR Steiger test validated that the directionality was valid for ALS (p = 1.5×10–77), schizophrenia (p = 8.9×10–88), and MDD (p = 4.0×10–89).
Table 4
Results of potential pleiotropy and heterogeneity assessments
| Outcomes | Egger intercept test | Cochrane’s Q test | MR-PRESSO global test | MR-Steiger test | ||
| Intercept | p | Q-value | p | p | p | |
| AD | –0.005 | 0.838 | 1.842 | 0.606 | 0.599 | 1.3×10–83 |
| PD | –0.047 | 0.168 | 3.482 | 0.481 | 0.509 | 1.1×10–86 |
| ALS | 0.007 | 0.528 | 12.421 | 0.014 | 0.081 | 1.5×10–77 |
| Schizophrenia | –0.005 | 0.802 | 4.242 | 0.374 | 0.537 | 8.9×10–88 |
| MDD | 0.008 | 0.560 | 2.122 | 0.547 | 0.589 | 4.0×10–89 |
AD, Alzheimer’s disease; ALS, amyotrophic lateral sclerosis; MDD, major depressive disorder; MR-PRESSO, MR-pleiotropy residual sum and outlier; PD, Parkinson’s disease.
DISCUSSION
The present study employed a two-sample MR approach to evaluate the causal association between plasma ferritin levels and neuropsychiatric disorders. The findings of this investigation revealed that genetically predicted elevated plasma ferritin was significantly linked to an increased susceptibility to AD and PD. However, no causal effect of plasma ferritin on other neuropsychiatric disorders, including ALS, schizophrenia, and MDD was observed. These results underscore the utility and convenience of human plasma proteins as biomarkers in clinical settings and hold substantial implications for the advancement of neurodegenerative disease biomarker research.
Plasma or serum ferritin concentrations serve as indicators of iron stores, whereby low ferritin levels signify iron deficiency and high ferritin levels signify iron overload [29]. The elevation in ferritin levels leads to the release of surplus iron ions, thereby inducing oxidative stress via the generation of oxygen radicals [30]. These free radicals play a significant role in the process of lipid peroxidation within cell membranes, resulting in heightened fluidity of the membranes, disturbances in calcium homeostasis, and ultimately culminating in cellular demise. As individuals age, there is a gradual accumulation of iron within the brain, predominantly in regions including the putamen, globus pallidus, substantia nigra, caudate nucleus, and cortex, which are closely linked to the development of neurodegenerative disorders [31, 32]. This MR analysis further established a causal relationship between plasma ferritin and the occurrence of neurodegenerative diseases (AD and PD) at the genetic level. Investigating the role of ferritin in regulating iron homeostasis in neurodegenerative diseases may yield novel therapeutic targets and insights for the management of these conditions.
AD is a progressive neurodegenerative disorder distinguished by the deposition of amyloid-β and hyperphosphorylation of tau [33]. Prior research has substantiated the involvement of ferritin in the pathophysiological mechanisms of AD. Notably, a substantial presence of ferritin has been observed surrounding senile plaques in AD patients, which has been found to facilitate the accumulation of amyloid-β and augment the quantity and size of senile plaques [34]. Our study confirms the findings of previous observational studies at the genetic level. The influence of ferritin on AD may be attributed to its involvement in ferritinophagy. Impairment of ferritinophagy disrupts the equilibrium of iron, subsequently initiating detrimental oxidative stress and facilitating the progression of pathological changes [35]. The potential role of ferritinophagy in the pathogenesis of neurodegenerative diseases, particularly AD, should be given significant attention due to its ability to induce ferroptosis through the promotion of iron accumulation and reactive oxygen species [36]. This novel form of autophagic and caspase-independent cell death [37], known as ferritinophagy-mediated ferroptosis, is considered a key mechanism in the development of AD [38]. Therefore, further investigation into the mechanism by which ferritinophagy impacts the physiological processes of AD is warranted.
PD is a neurodegenerative disorder that is distinguished by the degeneration of dopaminergic neurons in the substantia nigra, accompanied by the formation of Lewy bodies and the aggregation of α-synuclein [39]. Notably, a significant accumulation of ferritin has been observed in the neuromelanin of dopaminergic neurons, suggesting its potential involvement in the regulation of iron metabolism within these neurons [40]. Moreover, the ratio of heavy chain ferritin to light chain ferritin in the caudate nucleus and putamen of PD patients was found to be higher compared to the elderly control group [41]. Proteomic analysis of the substantia nigra pars compacta tissue in patients with PD showed elevated levels of ferritin light chain compared with control [42]. Studies have shown that ferritin structure (heavy and light chain ferritin concentrations) changes in the substantia nigra of PD patients, making iron more easily released and free iron increased, resulting in dysregulation of iron homeostasis [43]. Iron mediated oxidative stress and iron metabolism disorder may be one of the important pathological mechanisms of dopaminergic neuron degeneration [44]. Excess free iron enters cells to produce reactive oxygen species (including peroxide, superoxide, hydroxyl radicals, etc.), causing oxidative damage and promoting the aggregation of α-synapses, leading to the degeneration of dopaminergic neurons in substantia nigra [31, 45]. In this study, we identified that the risk of PD increased with genetically predicted increasing ferritin levels, this suggests that ferritin levels may be a risk factor for PD.
This study has some limitations. First, there are only a few SNPs associated with plasma ferritin at a genome-wide significance level (p < 5×10⁻⁸), which cannot reliably detect the pleiotropy and heterogeneity with alternative additional MR methods. This result was not validated in larger GWAS studies and more available SNPs in the up- to-date GWASs should be used to confirm this conclusion in the future. Second, despite the causal relationship, the risk of developing degenerative diseases (AD and PD) is time-dependent. The timing of clinical intervention based on the causal outcome of MR studies needs to be carefully considered. Third, MR is insensitive to the confounding factors of environmental exposure and lacks multivariate correction. We cannot fully assess the relationship between individual genetic variation and potential confounding factors, so these findings require further in vitro and in vivo validation. Finally, the MR analysis of this study was based on data from patients of European ancestry, and there were differences in incidence and pathogenesis in different ethnic populations. Therefore, our findings were carefully applied to other ethnic groups.
Conclusion
This MR study provides evidence at the genetic level for a causal relationship between plasma ferritin and an increased risk of AD and PD. The exact genetic mechanisms underlying this connection necessitate further investigation.
ACKNOWLEDGMENTS
We thank all the consortium associated with this study for making their data publicly available and easily accessible, and thank the support of STI2030-Major Project (No.2021ZD0201802) of China.
FUNDING
This study was supported by the STI2030-Major Projects (No. 2021ZD0201802).
CONFLICT OF INTEREST
The authors have no conflict of interest to report.
DATA AVAILABILITY
All statistic data relevant to this study were obtained from publicly reported and online data sources (https://gwas.mrcieu.ac.uk/), further inquiries can be obtained from the corresponding authors.
SUPPLEMENTARY MATERIAL
[1] The supplementary material is available in the electronic version of this article: https://dx.doi.org/10.3233/ADR-230136.
REFERENCES
[1] | Zhang J , Chen X , Hong J , Tang A , Liu Y , Xie N , Nie G , Yan X , Liang M ((2021) ) Biochemistry of mammalian ferritins in the regulation of cellular iron homeostasis and oxidative responses, Sci China Life Sci 64: , 352–362. |
[2] | Bradley JM , Le Brun NE , Moore GR ((2016) ) Ferritins: Furnishing proteins with iron. J Biol Inorg Chem 21: , 13–28. |
[3] | Hentze MW , Muckenthaler MU , Galy B , Camaschella C ((2010) ) Two to tango: Regulation of Mammalian iron metabolism. Cell 142: , 24–38. |
[4] | Raha AA , Biswas A , Henderson J , Chakraborty S , Holland A , Friedland RP , Mukaetova-Ladinska E , Zaman S , Raha-Chowdhury R ((2022) ) Interplay of ferritin accumulation and ferroportin loss in ageing brain: Implication for protein aggregation in Down syndrome dementia, Alzheimer’s, and Parkinson’s diseases. Int J Mol Sci 23: , 1060. |
[5] | Kuiper MA , Mulder C , van Kamp GJ , Scheltens P , Wolters EC ((1994) ) Cerebrospinal fluid ferritin levels of patients with Parkinson’s disease, Alzheimer’s disease, and multiple system atrophy. J Neural Transm Park Dis Dement Sect 7: , 109–114. |
[6] | Wang L , Li C , Chen X , Li S , Shang H ((2020) ) Abnormal serum iron-status indicator changes in amyotrophic lateral sclerosis (ALS) patients: A meta-analysis. Front Neurol 11: , 380. |
[7] | Scheiber C , Schulz T , Schneider JM , Bechter K , Schneider EM ((2022) ) Old and new biomarkers for infection, inflammation, and autoimmunity in treatment-resistant affective and schizophrenic spectrum disorders. Pharmaceuticals (Basel) 15: , 299. |
[8] | Wang Y , Li Y , Wu Z , Chen Z , Yu H , He Y , Tian Y , Lan T , Bai M , Chen X , Cheng K , Xie P ((2021) ) Ferritin disorder in the plasma and hippocampus associated with major depressive disorder. Biochem Biophys Res Commun 553: , 114–118. |
[9] | Emdin CA , Khera AV , Kathiresan S ((2017) ) Mendelian randomization. JAMA 318: , 1925–1926. |
[10] | Lawlor DA , Harbord RM , Sterne JA , Timpson N , Davey Smith G ((2008) ) Mendelian randomization: Using genes as instruments for making causal inferences in epidemiology. Stat Med 27: , 1133–1163. |
[11] | Sekula P , Del Greco MF , Pattaro C , Köttgen A ((2016) ) Mendelian randomization as an approach to assess causality using observational data. J Am Soc Nephrol 27: , 3253–3265. |
[12] | Skrivankova VW , Richmond RC , Woolf BAR , Yarmolinsky J , Davies NM , Swanson SA , VanderWeele TJ , Higgins JPT , Timpson NJ , Dimou N , Langenberg C , Golub RM , Loder EW , Gallo V , Tybjaerg-Hansen A , Davey Smith G , Egger M , Richards JB ((2021) ) Strengthening the Reporting of Observational Studies in Epidemiology using Mendelian randomization: The STROBE-MR Statement. JAMA 326: , 1614–1621. |
[13] | Sun BB , Maranville JC , Peters JE , Stacey D , Staley JR , Blackshaw J , Burgess S , Jiang T , Paige E , Surendran P , Oliver-Williams C , Kamat MA , Prins BP , Wilcox SK , Zimmerman ES , Chi A , Bansal N , Spain SL , Wood AM , Morrell NW , Bradley JR , Janjic N , Roberts DJ , Ouwehand WH , Todd JA , Soranzo N , Suhre K , Paul DS , Fox CS , Plenge RM , Danesh J , Runz H , Butterworth AS ((2018) ) Genomic atlas of the human plasma proteome. Nature 558: , 73–79. |
[14] | Kunkle BW , Grenier-Boley B , Sims R , Bis JC , Damotte V , Naj AC , Boland A , Vronskaya M , van der Lee SJ , Amlie-Wolf A , et al., ((2019) ) Genetic meta-analysis of diagnosed Alzheimer’s disease identifies new risk loci and implicates Aβ, tau, immunity and lipid processing. Nat Genet 51: , 414–430. |
[15] | Nalls MA , Blauwendraat C , Vallerga CL , Heilbron K , Bandres-Ciga S , Chang D , Tan M , Kia DA , Noyce AJ , Xue A , Bras J , Young E , von Coelln R , Simón-Sanchez J , Schulte C , Sharma M , Krohn L , Pihlstrøm L , Siitonen A , Iwaki H , Leonard H , Faghri F , Gibbs JR , Hernandez DG , Scholz SW , Botia JA , Martinez M , Corvol JC , Lesage S , Jankovic J , Shulman LM , Sutherland M , Tienari P , Majamaa K , Toft M , Andreassen OA , Bangale T , Brice A , Yang J , Gan-Or Z , Gasser T , Heutink P , Shulman JM , Wood NW , Hinds DA , Hardy JA , Morris HR , Gratten J , Visscher PM , Graham RR , Singleton AB ((2019) ) Identification of novel risk loci, causal insights, and heritable risk for Parkinson’s disease: A meta-analysis of genome-wide association studies. Lancet Neurol 18: , 1091–1102. |
[16] | van Rheenen W , Shatunov A , Dekker AM , McLaughlin RL , Diekstra FP , Pulit SL , van der Spek RA , Võsa U , de Jong S , Robinson MR , et al. ((2016) ) Genome-wide association analyses identify new risk variants and the genetic architecture of amyotrophic lateral sclerosis. Nat Genet 48: , 1043–1048. |
[17] | Ripke S , O’Dushlaine C , Chambert K , Moran JL , Kähler AK , Akterin S , Bergen SE , Collins AL , Crowley JJ , Fromer M , et al. ((2013) ) Genome-wide association analysis identifies 13 new risk loci for schizophrenia. Nat Genet 45: , 1150–1159. |
[18] | Wray NR , Ripke S , Mattheisen M , Trzaskowski M , Byrne EM , Abdellaoui A , Adams MJ , Agerbo E , Air TM , Andlauer TMF , et al. ((2018) ) Genome-wide association analyses identify 44 risk variants and refine the genetic architecture of major depression. Nat Genet 50: , 668–681. |
[19] | Machiela MJ , Chanock SJ ((2015) ) LDlink: A web-based application for exploring population-specific haplotype structure and linking correlated alleles of possible functional variants. Bioinformatics 31: , 3555–3557. |
[20] | Burgess S , Thompson SG ((2011) ) Avoiding bias from weak instruments in Mendelian randomization studies. Int J Epidemiol 40: , 755–764. |
[21] | Staley JR , Blackshaw J , Kamat MA , Ellis S , Surendran P , Sun BB , Paul DS , Freitag D , Burgess S , Danesh J , Young R , Butterworth AS ((2016) ) PhenoScanner: A database of human genotype-phenotype associations. Bioinformatics 32: , 3207–3209. |
[22] | Brion MJ , Shakhbazov K , Visscher PM ((2013) ) Calculating statistical power in Mendelian randomization studies. Int J Epidemiol 42: , 1497–1501. |
[23] | Hemani G , Zheng J , Elsworth B , Wade KH , Haberland V , Baird D , Laurin C , Burgess S , Bowden J , Langdon R , Tan VY , Yarmolinsky J , Shihab HA , Timpson NJ , Evans DM , Relton C , Martin RM , Davey Smith G , Gaunt TR , Haycock PC ((2018) ) The MR-Base platform supports systematic causal inference across the human phenome, Elife 7: , e34408. |
[24] | Bowden J , Del Greco MF , Minelli C , Zhao Q , Lawlor DA , Sheehan NA , Thompson J , Davey Smith G ((2019) ) Improving the accuracy of two-sample summary-data Mendelian randomization: Moving beyond the NOME assumption. Int J Epidemiol 48: , 728–742. |
[25] | Bowden J , Del Greco MF , Minelli C , Davey Smith G , Sheehan N , Thompson J ((2017) ) A framework for the investigation of pleiotropy in two-sample summary data Mendelian randomization. Stat Med 36: , 1783–1802. |
[26] | Verbanck M , Chen CY , Neale B , Do R ((2018) ) Detection of widespread horizontal pleiotropy in causal relationships inferred from Mendelian randomization between complex traits and diseases. Nat Genet 50: , 693–698. |
[27] | Hemani G , Bowden J , Davey Smith G ((2018) ) Evaluating the potential role of pleiotropy in Mendelian randomization studies, Hum Mol Genet 27: , R195–R208. |
[28] | Hemani G , Tilling K , Davey Smith G ((2017) ) Orienting the causal relationship between imprecisely measured traits using GWAS summary data, PLoS Genet 13: , e1007081. |
[29] | Garcia-Casal MN , Pasricha SR , Martinez RX , Lopez-Perez L , Peña-Rosas JP ((2021) ) Serum or plasma ferritin concentration as an index of iron deficiency and overload, Cochrane Database Syst Rev 5: , CD011817. |
[30] | Ferrali M , Signorini C , Caciotti B , Sugherini L , Ciccoli L , Giachetti D , Comporti M ((1997) ) Protection against oxidative damage of erythrocyte membrane by the flavonoid quercetin and its relation to iron chelating activity. FEBS Lett 416: , 123–129. |
[31] | Ward RJ , Zucca FA , Duyn JH , Crichton RR , Zecca L ((2014) ) The role of iron in brain ageing and neurodegenerative disorders. Lancet Neurol 13: , 1045–1060. |
[32] | Rodrigue KM , Haacke EM , Raz N ((2011) ) Differential effects of age and history of hypertension on regional brain volumes and iron. Neuroimage 54: , 750–759. |
[33] | Scheltens P , De Strooper B , Kivipelto M , Holstege H , Chetelat G , Teunissen CE , Cummings J , van der Flier WM ((2021) ) Alzheimer’s disease. Lancet 397: , 1577–1590. |
[34] | Fernandez T , Martínez-Serrano A , Cussó L , Desco M , Ramos-Gómez M ((2018) ) Functionalization and characterization of magnetic nanoparticles for the detection of ferritin accumulation in Alzheimer’s disease. ACS Chem Neurosci 9: , 912–924. |
[35] | Dixon SJ , Stockwell BR ((2014) ) The role of iron and reactive oxygen species in cell death. Nat Chem Biol 10: , 9–17. |
[36] | Hou W , Xie Y , Song X , Sun X , Lotze MT , Zeh HJ , 3rd , Kang R , Tang D ((2016) ) Autophagy promotes ferroptosis by degradation of ferritin. Autophagy 12: , 1425–1428. |
[37] | Gao M , Monian P , Pan Q , Zhang W , Xiang J , Jiang X ((2016) ) Ferroptosis is an autophagic cell death process. Cell Res 26: , 1021–1032. |
[38] | Quiles Del Rey M , Mancias JD ((2019) ) NCOA4-mediated ferritinophagy: A potential link to neurodegeneration. Front Neurosci 13: , 238. |
[39] | Dauer W , Przedborski S ((2003) ) Parkinson’s disease: Mechanisms and models. Neuron 39: , 889–909. |
[40] | Shamoto-Nagai M , Maruyama W , Yi H , Akao Y , Tribl F , Gerlach M , Osawa T , Riederer P , Naoi M ((2006) ) Neuromelanin induces oxidative stress in mitochondria through release of iron: Mechanism behind the inhibition of 26S proteasome. J Neural Transm (Vienna) 113: , 633–644. |
[41] | Connor JR , Snyder BS , Arosio P , Loeffler DA , LeWitt P ((1995) ) A quantitative analysis of isoferritins in select regions of aged, parkinsonian, and Alzheimer’s diseased brains. J Neurochem 65: , 717–724. |
[42] | Licker V , Turck N , Kövari E , Burkhardt K , Côte M , Surini-Demiri M , Lobrinus JA , Sanchez JC , Burkhard PR ((2014) ) Proteomic analysis of human substantia nigra identifies novel candidates involved in Parkinson’s disease pathogenesis. Proteomics 14: , 784–794. |
[43] | Koziorowski D , Friedman A , Arosio P , Santambrogio P , Dziewulska D ((2007) ) ELISA reveals a difference in the structure of substantia nigra ferritin in Parkinson’s disease and incidental Lewy body compared to control. Parkinsonism Relat Disord 13: , 214–218. |
[44] | Jiang H , Wang J , Rogers J , Xie J ((2017) ) Brain iron metabolism dysfunction in Parkinson’s disease. Mol Neurobiol 54: , 3078–3101. |
[45] | Shi L , Huang C , Luo Q , Rogers E , Xia Y , Liu W , Ma W , Zeng W , Gong L , Fang J , Tang L , Cheng A , Shi R , Chen Z ((2019) ) The association of iron and the pathologies of Parkinson’s diseases in MPTP/MPP(+)-induced neuronal degeneration in non-human primates and in cell culture. Front Aging Neurosci 11: , 215. |


