
Brain Representation of Animal and Non-Animal Images in Patients with Mild Cognitive Impairment and Alzheimer’s Disease
Abstract
Background:
In early Alzheimer’s disease (AD), high-level visual functions and processing speed are impacted. Few functional magnetic resonance imaging (fMRI) studies have investigated high-level visual deficits in AD, yet none have explored brain activity patterns during rapid animal/non-animal categorization tasks.
Objective:
To address this, we utilized the previously known Integrated Cognitive Assessment (ICA) to collect fMRI data and compare healthy controls (HC) to individuals with mild cognitive impairment (MCI) and mild AD.
Methods:
The ICA encompasses a rapid visual categorization task that involves distinguishing between animals and non-animals within natural scenes. To comprehensively explore variations in brain activity levels and patterns, we conducted both univariate and multivariate analyses of fMRI data.
Results:
The ICA task elicited activation across a range of brain regions, encompassing the temporal, parietal, occipital, and frontal lobes. Univariate analysis, which compared responses to animal versus non-animal stimuli, showed no significant differences in the regions of interest (ROIs) across all groups, with the exception of the left anterior supramarginal gyrus in the HC group. In contrast, multivariate analysis revealed that in both HC and MCI groups, several regions could differentiate between animals and non-animals based on distinct patterns of activity. Notably, such differentiation was absent within the mild AD group.
Conclusions:
Our study highlights the ICA task’s potential as a valuable cognitive assessment tool designed for MCI and AD. Additionally, our use of fMRI pattern analysis provides valuable insights into the complex changes in brain function associated with AD. This approach holds promise for enhancing our understanding of the disease’s progression.
INTRODUCTION
Alzheimer’s disease (AD) is recognized to affect not only memory but also sensory systems, including vision, olfaction, and audition in its early stages [1, 2]. Evidence supports the association between aging, AD, and the impairment of sensory systems and cognitive functions [3]. Albers et al. [2] underscore that the visual system is particularly vulnerable, with AD-related pathology detected in key brain regions responsible for visual processing, encompassing the subcortical visual center, primary visual cortex, visual association cortex, and the higher-order visual association cortex within the inferior temporal gyrus. Although primary visual cortex exhibits fewer tangles and plaques, these pathological features become markedly prevalent in the visual association cortex adjacent to it, showing a twentyfold increase, and doubling again in the higher-order visual association cortex. Within the context of AD, the visual association areas manifest more pronounced effects of neurodegeneration compared to the primary visual areas [4, 5]. According to Bouras et al. [6] and Arnold et al. [7], the ventral stream of the visual system presents more severe pathology in AD patients. Notably, the inferior temporal cortex reveals a greater density of neurofibrillary tangles than the parietal cortex. These observations were further corroborated by an independent study [8] employing PET scans, indicating a more pronounced impairment in the functioning of the ventral stream than the dorsal stream in AD patients. Jackson [5] stated that deficits in higher-order visual processing have a more substantial impact on symptoms in individuals with AD compared to deficits solely in sensory visual visibility. While both the ventral and dorsal visual pathways, responsible for object recognition and spatial localization respectively, are impacted, the ventral visual system’s impairment is believed to be more severe than that of the dorsal visual pathway [9–11].
This study investigated the impact of ventral visual pathway impairment, responsible for high-level visual processing like object categorization, using an animal spotting task. To date, only two studies have investigated animal spotting in natural scenes in individuals with AD, and both were designed as behavioral tasks without the use of functional magnetic resonance imaging (fMRI) to measure brain activity. In these tasks, participants were instructed to either saccade or manually respond to images that contained animals [12, 13].
The pivotal role of processing speed in cognitive integration and daily functioning is well documented. Studies have shown that slowing of processing speed can lead to impairment in various cognitive domains in both healthy older adults [14–18] and those with mild cognitive impairment (MCI) or mild AD [19–25]. While tasks without time constraints may yield normal performance, the introduction of time limits could reveal impairments [23]. More complex and demanding tasks may be more sensitive in detecting processing speed impairment and aiding in diagnosis. Therefore, it is recommended to evaluate processing speed along with other cognitive domains in patients who report memory impairment and difficulties in daily activities.
The majority of fMRI studies conducted on AD have focused on either resting state [26–31] or task-based fMRI with a focus on memory [32–36]. Only a limited number of task-based fMRI studies have investigated how AD affects visual processing, such as studies on face-matching [37, 38], color-task and male/female face-test [39], or passive viewing of face-photos [40, 41], all employing blocked design tasks.
The Integrated Cognitive Assessment (ICA) represents a rapid visual animacy categorization task. Participants are presented with natural scenes containing animals and non-animals, and their task is to rapidly and accurately determine whether each image represent an animal.
ICA has been tested as a behavioral measure among individuals with mild cognitive impairment and mild AD, revealing significantly lower test scores compared to healthy older adults [42–44]. Additionally, our previous study utilizing electroencephalogram to examine the temporal dynamics of animacy processing during the ICA test disclosed a significant delay in animacy processing among MCI patients in comparison to healthy controls (HC) [45, 46].
This study aims to investigate the specific brain regions that exhibit activation in response to the ICA test and identify disparities not only in the level of brain activity but also in the patterns characterizing each group’s response to images of animal and non-animal. To achieve this, we employed both univariate and multivariate pattern analysis (MVPA) techniques. MVPA allows us to access information decoded from patterns of brain activity, providing insights beyond simpler univariate measures that indicate the overall engagement of a cortical region [47–50]. Additionally, our exploration extends to evaluating the feasibility of distinguishing individuals across the HC, MCI, and mild AD groups based on their unique brain activity patterns. Through this comprehensive approach, our study aims to enhance our understanding of the brain’s response to the ICA test and uncover potential variations across diverse cognitive states.
METHODS
Subject recruitment
In our study, a total of 45 participants were recruited, consisting of 20 HCs, 15 with MCI, and 10 with mild AD. All groups were matched for age, education, and gender, as outlined in Table 1. The study was approved by the local ethics committee at the Royan Institute where all participants were visited and signed a written consent form in accordance with the Declaration of Helsinki. Diagnosis for all participants met the criteria by the National Institute on Aging and Alzheimer’s Association (NIA-AA) diagnostic guidelines [51, 52], confirmed by a dementia neurologist. All participants took a comprehensive medical history and extensive battery of pen-paper neuropsychiatric tests, all of which have been validated within the Iranian population. These tests encompassed the Montreal Cognitive Assessment (MoCA) [53, 54], the Addenbrooke’s Cognitive Examination-Revised (ACE-R) [55–57], the Mini-Mental State Examination (MMSE) [58, 59], the Geriatric Depression Scale-30 (GDS) [60, 61], the Neuropsychiatric Inventory Questionnaire (NPI-Q) [62–64], the Bristol Activities of Daily Living Scale (BADLS) [65], and our designed test, the ICA [42], which was administered on an iPad. For description of each neuropsychiatric test, please refer to the Supplementary Material.
Table 1
Subjects demographics
| ANOVA | |||||
| Characteristics | HC | MCI | mild AD | F | p |
| Total number | 20 | 15 | 10 | – | – |
| Age, y, mean (std) | 63.9 (6.5) | 63.5 (7.2) | 68 (9.6) | 1.27 | 0.29 |
| Education, y, mean (std) | 14.6 (4.2) | 15.3 (5.4) | 13 (5.3) | 0.70 | 0.50 |
| Gender, % female | 60 | 53 | 50 | 0.15 | 0.86 |
Exclusion criteria for all three groups were a history of major neurological disorders such as seizure, cerebrovascular disease, Parkinson’s disease; major neuropsychiatric diseases including moderate and severe depression, anxiety disorders, psychotic disorders, and GDS score> = 20; major heart diseases such as ischemic heart disease and heart failure; hypothyroidism or hyperthyroidism, and total thyroidectomy; cancer; visual impairment such as retinal detachment problem and unilateral blindness; opioid and heavy alcohol abuse; individuals diagnosed with subjective cognitive impairment and moderate or severe AD; hand, neck, or head tremor; not currently on any medication that interfere with the study; and presence of a pacemaker or metals in the body. In the MCI and mild AD groups, any subject with a history of using cognitive enhancing drugs (e.g., cholinesterase inhibitors) for less than 2 months at the time of final diagnosis was excluded. Inclusion criteria comprised an age range of 50 to 90 and overall good health. All subjects possessed normal eyesight or corrected-to-normal eyesight.
Study test: Integrated cognitive assessment
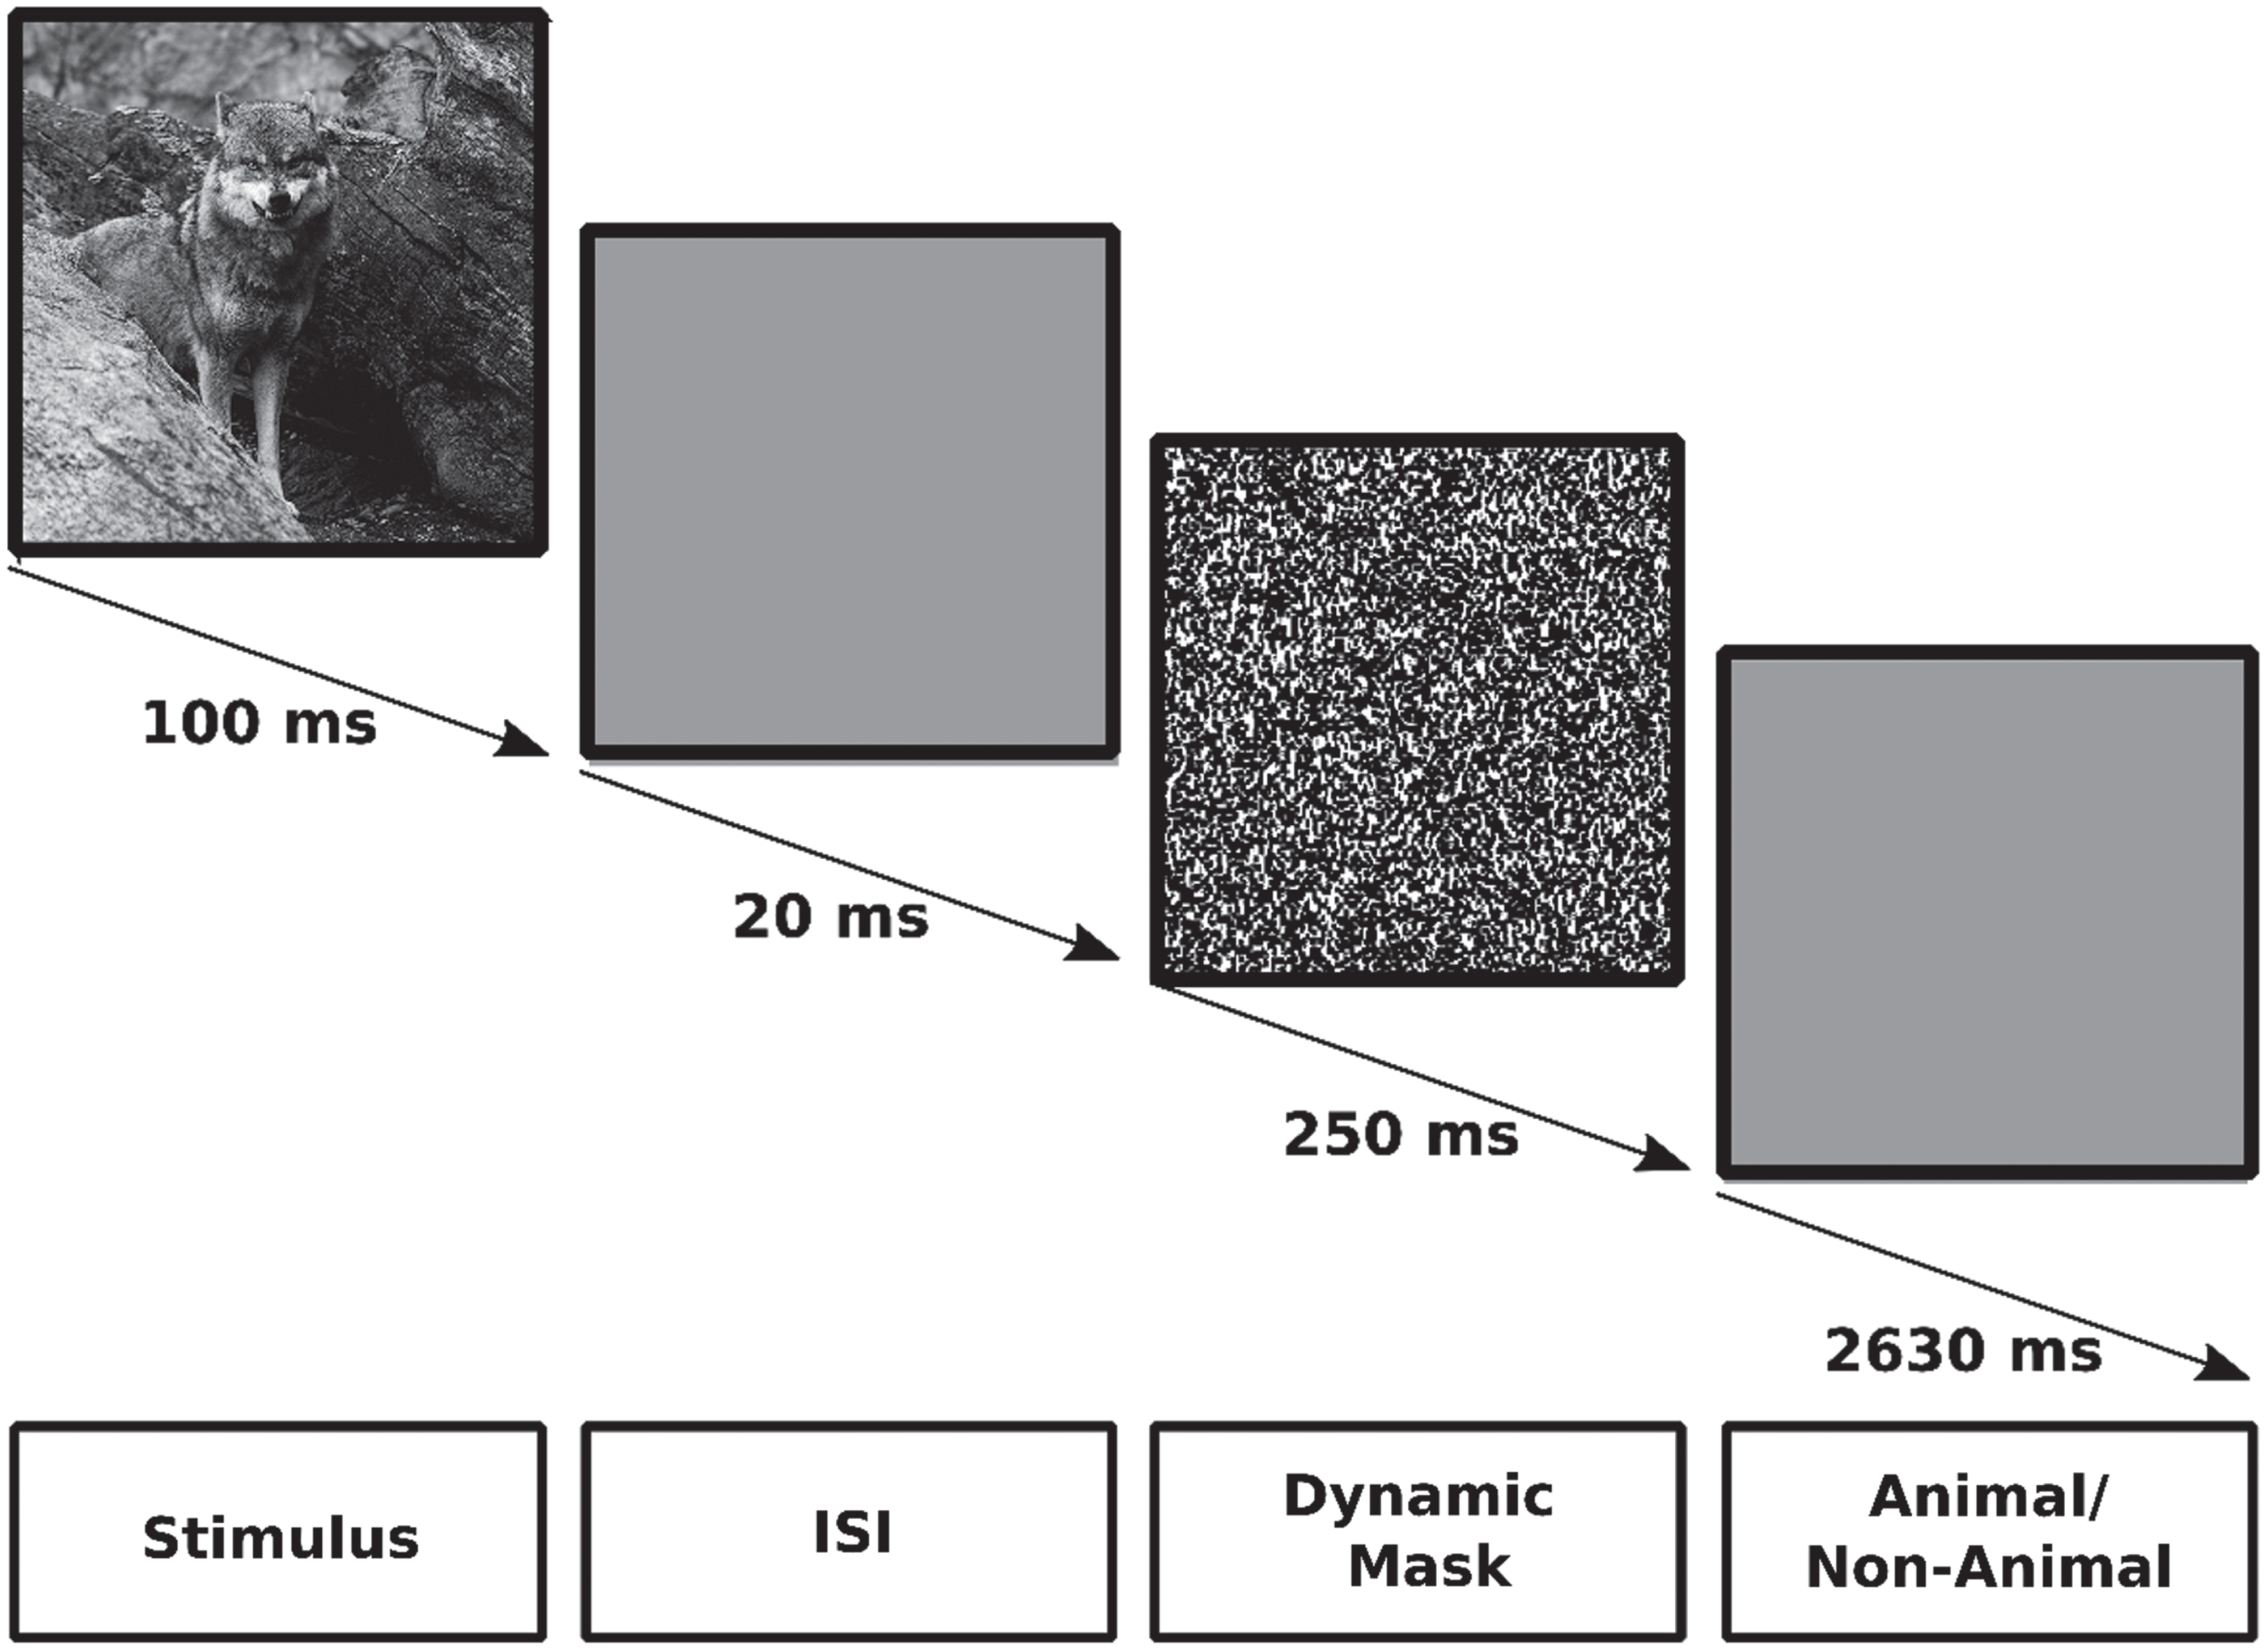
The fMRI task employed in this study was the previously established ICA test [42, 43, 45, 66]. This task employs an event-related design and is a rapid visual categorization task. During the task, participants are presented with gray scale images of animal and non-animal within natural scenes, arranged in random order and across four levels of difficulty. Each participant underwent a single session of fMRI scanning while performing the ICA test. The session consisted of 10 runs, each comprising 47 trials encompassing 16 animal images, 16 non-animal images, and 15 null trials. Each trial was presented for 100 ms, followed by a 20 ms inter-stimulus interval (ISI), followed by a 250 ms dynamic mask, followed by a 2630 ms response time, as depicted in Fig. 1. Each trial was presented at the center of the screen with a 7° visual angle. Participants were instructed to respond by pressing the right or left handle, indicating the presence or absence of an animal in the presented image, respectively.
Fig. 1
The ICA test. Each trial was shown for 100 ms, followed by a 20 ms inter-stimulus interval (ISI), followed by a 250 ms dynamic mask, followed by a 2630 ms response time in which participants should decide if there was an animal in the presenting image or not.
Before conducting the fMRI session, the ICA test was also given to participants on an iPad in the same session as the neuropsychiatric tests. The ICA test on the iPad was identical to the one given during the fMRI scan, but was shorter, lasting 5 min, and consisted of only one run with a total of 100 images presented to participants [42].
ICA test scores
Subject performance in the ICA test was assessed by considering their accuracy and reaction time in categorizing images. Participants were instructed to respond to the images as promptly and accurately as possible. Similar to assessments such as MoCA, ACE-R, and MMSE, higher scores in the ICA test are indicative of better cognitive function.
Accuracy
This metric is calculated by dividing the number of correct categorizations by the total number of images and then multiplying by 100, as shown in Equation 1.
(1)
Speed: This parameter is determined by the participants’ reaction times in trials where they responded correctly, as illustrated in Equation 2. Speed exhibits an inverse relationship with participants’ reaction times, meaning that higher speed scores correspond to lower reaction times (RT: reaction time, e: Euler’s number ∼ 2.7182 ...).
(2)
ICA Total (ICA Score Index)
This metric results from a straightforward combination of accuracy and speed, as outlined in Equation 3.
(3)
Structural mri acquisition, preprocessing, and inspection
Structural images were acquired at the National Brain Mapping Laboratory, faculty of engineering, University of Tehran, Tehran, Iran, using a 3-Tesla Philips scanner equipped with a standard 64 channel head coil. Three dimensional T1-weighted images were acquired employing the whole brain magnetization prepared rapid gradient echo (MPRAGE) sequence. The scanning parameters were as follows: echo time (TE) = 3.47 ms, repetition time (TR) = 2000 ms, inversion time (TI) = 800 ms, flip angel = 7°, matrix size = 256×256, voxel size = 1 mm3, 176 sagittal slices, slice thickness = 1 mm, and field of view (FOV) = 256 mm. Each participant was required to remain in the MRI/fMRI scanner for approximately 8 min to acquire T1-weighted images at the initiation of brain imaging and immediately prior to the functional scanning session. For each participant, the 176 T1-weighted sagittal slices in DICOM format were converted into a single structural volume in NIFTI format using Statistical Parametric Mapping 12 (SPM12, http://www.fil.ion.ucl.ac.uk/spm/software/spm12/), and MATLAB R2015b. The structural brain volume of each subject was carefully examined in its native space using MRIcroN v1.0.20190902 (https://www.nitrc.org/projects/mricron). This inspection aimed to identify any dementia-non-specific lesions, such as tumors, which could potentially lead to the exclusion of the subject from subsequent analyses. Subsequently, all structural images in the native space were normalized into the MNI space.
Functional mri data acquisition and preprocessing
Functional data acquisition was performed at National Brain Mapping Laboratory, faculty of engineering, University of Tehran, Tehran, Iran, utilizing a 3-Tesla Philips scanner equipped with a standard 64-channel head coil. 34 interleaved axial slices, covering the entire brain, were acquired using a T*-weighted gradient-echo EPI sequence with the following parameters: TR = 2000 ms, TE = 30 ms, flip angle = 90°, FOV read = 248 mm, FOV phase = 100%, resolution = 3.5 mm3, isotropic spatial resolution of 3 to 3.5 mm, and a slice thickness = 3.5 mm. A total of 75 brain volumes were recorded for each subject during each run. Subjects were provided with a handle featuring a button on its top for each hand, positioned beside each side of their body on the bed. They were directed to press the right button with their right thumb and the left button with their left thumb to indicate the presence or absence of an animal in the displayed image, respectively. The functional data underwent preprocessing using Statistical Parametric Mapping 12 (SPM12, http://www.fil.ion.ucl.ac.uk/spm/software/spm12/) within MATLAB R2015b. The preprocessing sequence included the following steps: 1) slice time correction using the middle slice; 2) realignment and head motion correction employing a 6-parameter rigid transformation; 3) co-registration to the subject’s corresponding T1-structural volume; 4) normalization to the MNI standard space; and 5) spatial smoothing using a 6 mm full-width at half-maximum Gaussian kernel.
Whole brain and roi approaches
The whole brain approach examines all voxels across the entire brain without any initial hypotheses, whereas in region-of-interest (ROI) analysis, regions are chosen based on existing literature. To explore brain regions activated in response to the ICA test, within the three groups, we conducted whole brain analysis. For all other analyses, including between-group univariate analysis and multivariate analyses including animacy decoding and subject-wise decoding, we adopted the ROI approach. Two sets of regions were defined as ROIs for our analysis. The first set pertains to regions linked with high-level visual processing, including the parahippocampus, fusiform, lingual, inferior temporal, middle temporal, and lateral occipital gyri [67–69], as detailed in Table 2. The second set includes regions affected by misfolded tau proteins aligned with Braak stages I to IV [70], corresponding to the clinical stages of MCI and mild AD. These regions encompass the hippocampus, parahippocampus, fusiform, lingual, insular, inferior temporal, middle temporal, posterior cingulate, and inferior parietal gyri, as outlined in Table 3.
Table 2
High-level visual processing ROIs selected from the Harvard-Oxford Atlas
| ROIs name | |
| 1 | Parahippocampal Gyrus, anterior division |
| 2 | Parahippocampal Gyrus, posterior division |
| 3 | Lingual Gyrus |
| 4 | Temporal Fusiform Cortex, anterior division |
| 5 | Temporal Fusiform Cortex, posterior division |
| 6 | Temporal Occipital Fusiform Cortex |
| 7 | Occipital Fusiform Gyrus |
| 8 | Inferior Temporal Gyrus, anterior division |
| 9 | Inferior Temporal Gyrus, posterior division |
| 10 | Inferior Temporal Gyrus, temporooccipital part |
| 11 | Middle Temporal Gyrus, anterior division |
| 12 | Middle Temporal Gyrus, posterior division |
| 13 | Middle Temporal Gyrus, temporooccipital part |
| 14 | Lateral Occipital Cortex, superior division |
| 15 | Lateral Occipital Cortex, inferior division |
Table 3
ROIs selected from the Harvard-Oxford Atlas based on Braak tauopathy stages I to IV
| ROIs names | Braak tau stage | |
| 1 | Hippocampus | I/II |
| 2 | Parahippocampal Gyrus, anterior division | I/II |
| 3 | Parahippocampal Gyrus, posterior division | I/II |
| 4 | Temporal Occipital Fusiform Cortex | III |
| 5 | Temporal Fusiform Cortex, anterior division | III |
| 6 | Temporal Fusiform Cortex, posterior division | III |
| 7 | Occipital Fusiform Gyrus | III |
| 8 | Lingual Gyrus | III |
| 9 | Inferior Temporal Gyrus, anterior division | IV |
| 10 | Inferior Temporal Gyrus, posterior division | IV |
| 11 | Inferior Temporal Gyrus, temporooccipital part | IV |
| 12 | Middle Temporal Gyrus, anterior division | IV |
| 13 | Middle Temporal Gyrus, posterior division | IV |
| 14 | Middle Temporal Gyrus, temporooccipital part | IV |
| 15 | Insular Cortex | IV |
| 16 | Supramarginal Gyrus, anterior division | IV |
| 17 | Supramarginal Gyrus, posterior division | IV |
| 18 | Angular Gyrus | IV |
| 19 | Cingulate Gyrus, posterior division | IV |
Univariate analysis
ROI analysis, voxel selection, calculating between-group mean beta
To ensure consistent results, we opted for voxel subsets within each ROI rather than considering all voxels [71]. Moreover, to prevent circular analysis, we implemented an independent split-data analysis [72]. To achieve this, the data in the between-group beta-map was divided into two equal-sized sets: odd and even runs. For each region, the voxel with the highest activity level within the odd runs was identified, and a 100-voxel sphere was centered around that voxel. Subsequently, we calculated the mean and standard error of the beta-values from the same sphere within the even runs, assigning these values to the respective region. For detailed results, please refer to the section titled “ROIs differentially activated through ICA test between groups.”
MVPA: Animacy decoding
To determine the discrimination accuracy of images depicting animals and non-animals within each selected ROI, we employed a linear support vector machine (SVM) classifier (CoSMoMVPA libSVM, http://cosmomvpa.org/) implemented in MATLAB R2015b. Each ROI was individually trained and tested with the SVM classifier, yielding an aggregated accuracy performance measure for each ROI. A leave-one-run-out cross-validation approach was adopted for training and testing the data. The images themselves acted as features, classified as either animal or non-animal. The feature spaces were defined by the ROIs, with the dimension of the feature spaces determined by the number of voxels (n) present within each ROI. For each image, an n-cell-pattern-vector was generated and labeled accordingly. The classifier underwent 10 repetitions, with 9 runs dedicated to training and 1 run for testing in each iteration. This cycle ensured that each run functioned as a test run once. Consequently, a total of 10 performance accuracy scores were obtained, subsequently averaged to yield a final performance accuracy for each individual ROI. Please refer to the section titled “There is information in the pattern of activity while not in the level of activity in the HC and MCI groups” for detailed outcomes.
MVPA: Subject-wise classification
To assess the accuracy of discriminating between subjects across the three groups within each selected ROI, we employed a linear support vector machine (SVM) classifier (CoSMoMVPA libSVM, http://cosmomvpa.org/) implemented in MATLAB R2015b. The classifier was utilized for pairwise group classification, including HC versus MCI, HC versus mild AD, and MCI versus mild AD. Cross-validation was performed using a leave-one-subject-out approach, where features (subjects) were labeled as HC, MCI, or mild AD, and the feature space dimension equated the number of subjects within the smaller group. Each subject was represented by a 4-cell pattern vector, with three cells capturing distinct univariate contrasts (as described in the Supplementary Material, β estimation and contrast vectors), and one cell representing the animal versus non-animal decoding accuracy (as detailed in the MVPA: Animacy decoding). In each iteration of cross-validation, subjects equal to the number within the smaller group, except one from each group, were designated as training data, while the remaining subject from each group served as the test data. Given the limited data availability, we applied the bootstrap method by repeating this procedure 10,000 times and averaging the results to yield a final accuracy performance for each pairwise group classification within each ROI. This comprehensive approach is further elaborated in the ROIs with information for subject decoding section, where the results are presented.
Statistical analyses
To ascertain the comparability of the three groups in terms of age, education, and gender, and to identify potential significant variations in their ICA test scores, a single-factor analysis of variance (ANOVA) was conducted. In cases where notable differences were observed, a two-tailed T-test was subsequently employed to identify which specific pairs of groups displayed statistically significant distinctions. For univariate analyses, one-tailed T-test were used to determine the significance of within-group and between-group differences. In the context of MVPA, non-parametric statistical tests were utilized. For animacy decoding, the sign-rank test was applied, while subject-wise classification involved 10,000 bootstrap resampling of participants. To account for multiple comparisons, the false discovery rate (FDR) correction was employed.
RESULTS
ICA and other cognitive tests scores
Table 4 displays the ICA test scores, encompassing the ICA-total, ICA-speed, and ICA-accuracy of each individual subject along with other cognitive tests within each group. Table 5 presents a comprehensive comparison of ICA scores between each pair of groups. Specifically, when contrasting the HC and MCI groups, it is evident that the MCI group exhibited significantly lower scores in both ICA-total and ICA-speed. Additionally, the comparison between the HC and mild AD groups reveals that individuals with mild AD showcased significantly poorer performance across all three ICA scores. Lastly, an examination of the MCI and mild AD groups highlights that patients with mild AD displayed significantly lower scores in ICA-accuracy.
Table 4
ICA test scores along with other cognitive test scores of individual subjects within three groups (ICA scores obtained from iPAD)
| ICA | ACE-R | |||||||||||
| Total | Speed | Accuracy | MoCA | MMSE | Total | Attention | Memory | Fluency | Language | Visuospatial | ||
| HC | ||||||||||||
| avg | 66.60 | 78.05 | 85.15 | 26.35 | 28.90 | 93.80 | 17.30 | 23.95 | 11.80 | 24.95 | 15.80 | |
| std | 8.75 | 7.16 | 7.69 | 2.41 | 1.02 | 4.24 | 0.92 | 2.58 | 1.85 | 1.61 | 0.52 | |
| S01 | 71 | 79 | 90 | 28 | 28 | 97 | 16 | 26 | 13 | 26 | 16 | |
| S02 | 71 | 79 | 89 | 30 | 29 | 97 | 17 | 26 | 12 | 26 | 16 | |
| S05 | 70 | 75 | 93 | 28 | 29 | 96 | 18 | 24 | 13 | 25 | 16 | |
| S12 | 52 | 85 | 61 | 28 | 29 | 95 | 18 | 24 | 12 | 26 | 15 | |
| S14 | 67 | 78 | 86 | 28 | 29 | 98 | 17 | 26 | 13 | 26 | 16 | |
| S15 | 76 | 87 | 88 | 25 | 27 | 92 | 16 | 23 | 11 | 26 | 16 | |
| S16 | 69 | 82 | 84 | 24 | 29 | 85 | 18 | 15 | 14 | 22 | 16 | |
| S17 | 67 | 80 | 84 | 22 | 27 | 92 | 15 | 23 | 14 | 24 | 16 | |
| S18 | 75 | 85 | 89 | 25 | 29 | 95 | 17 | 24 | 13 | 25 | 16 | |
| S23 | 68 | 76 | 89 | 28 | 30 | 100 | 18 | 26 | 14 | 26 | 16 | |
| S25 | 61 | 75 | 82 | 29 | 30 | 96 | 18 | 25 | 12 | 25 | 16 | |
| S30 | 45 | 61 | 73 | 27 | 30 | 93 | 18 | 25 | 8 | 26 | 16 | |
| S31 | 66 | 78 | 83 | 24 | 28 | 82 | 17 | 20 | 9 | 20 | 16 | |
| S32 | 66 | 77 | 85 | 27 | 30 | 97 | 18 | 26 | 11 | 26 | 16 | |
| S33 | 66 | 72 | 92 | 29 | 30 | 91 | 18 | 25 | 8 | 26 | 14 | |
| S35 | 73 | 89 | 82 | 28 | 28 | 96 | 18 | 25 | 12 | 25 | 16 | |
| S41 | 74 | 81 | 91 | 23 | 30 | 95 | 18 | 25 | 10 | 26 | 16 | |
| S42 | 66 | 72 | 92 | 22 | 28 | 94 | 17 | 25 | 11 | 25 | 16 | |
| S44 | 50 | 64 | 78 | 25 | 30 | 92 | 18 | 23 | 13 | 23 | 15 | |
| S45 | 79 | 86 | 92 | 27 | 28 | 93 | 16 | 23 | 13 | 25 | 16 | |
| MCI | ||||||||||||
| avg | 59.13 | 71.60 | 82.33 | 24.64 | 27.67 | 84.00 | 17.00 | 22.33 | 10.13 | 24.73 | 15.47 | |
| std | 10.14 | 7.90 | 9.01 | 2.02 | 1.45 | 23.50 | 1.20 | 2.09 | 1.64 | 1.62 | 0.83 | |
| S03 | 71 | 79 | 91 | 25 | 26 | 90 | 17 | 23 | 10 | 24 | 16 | |
| S04 | 65 | 70 | 94 | 27 | 28 | 90 | 17 | 23 | 8 | 26 | 16 | |
| S09 | 34 | 51 | 66 | 24 | 29 | 90 | 18 | 20 | 11 | 25 | 16 | |
| S10 | 61 | 70 | 87 | 28 | 30 | 93 | 18 | 24 | 10 | 25 | 16 | |
| S11 | 68 | 76 | 90 | 24 | 30 | 93 | 18 | 25 | 9 | 26 | 15 | |
| S19 | 57 | 72 | 79 | 25 | 27 | 90 | 17 | 24 | 11 | 23 | 15 | |
| S21 | 57 | 68 | 84 | 28* | 26 | 88 | 16 | 22 | 12 | 22 | 16 | |
| S26 | 62 | 73 | 85 | 25 | 28 | 84 | 17 | 18 | 7 | 26 | 16 | |
| S28 | 64 | 81 | 79 | 25 | 28 | 95 | 17 | 25 | 12 | 25 | 16 | |
| S29 | 56 | 65 | 86 | 26 | 28 | 92 | 18 | 20 | 12 | 26 | 16 | |
| S36 | 39 | 66 | 60 | 20 | 25 | 0 | 14 | 23 | 8 | 26 | 14 | |
| S37 | 64 | 75 | 85 | 25 | 28 | 82 | 18 | 20 | 9 | 21 | 14 | |
| S39 | 59 | 67 | 87 | 22 | 28 | 91 | 17 | 23 | 11 | 26 | 14 | |
| S40 | 64 | 80 | 80 | 26 | 28 | 94 | 18 | 24 | 10 | 26 | 16 | |
| S43 | 66 | 81 | 82 | 23 | 26 | 88 | 15 | 21 | 12 | 24 | 16 | |
| mild AD | ||||||||||||
| avg | 50.50 | 69.70 | 72.50 | 20.00 | 24.80 | 76.60 | 15.50 | 18.80 | 8.50 | 20.90 | 12.90 | |
| std | 11.81 | 12.25 | 13.07 | 6.18 | 3.19 | 14.04 | 2.59 | 3.22 | 2.80 | 4.48 | 3.63 | |
| S06 | 58 | 69 | 83 | 15 | 25 | 71 | 14 | 14 | 8 | 20 | 15 | |
| S07 | 39 | 74 | 53 | 22 | 26 | 84 | 18 | 18 | 10 | 26 | 12 | |
| S08 | 41 | 51 | 80 | 20 | 24 | 71 | 14 | 21 | 6 | 20 | 10 | |
| S13 | 63 | 74 | 85 | 27 | 27 | 94 | 18 | 21 | 13 | 26 | 16 | |
| S20 | 36 | 57 | 64 | 15 | 23 | 65 | 14 | 17 | 5 | 15 | 14 | |
| S22 | 42 | 74 | 56 | 8 | 17 | 49 | 10 | 13 | 5 | 16 | 5 | |
| S24 | 54 | 69 | 78 | 18 | 25 | 69 | 17 | 20 | 7 | 15 | 10 | |
| S27 | 69 | 75 | 92 | 25 | 26 | 92 | 17 | 22 | 12 | 25 | 16 | |
| S34 | 42 | 59 | 70 | 28 | 29 | 84 | 18 | 20 | 9 | 21 | 16 | |
| S38 | 61 | 95 | 64 | 22 | 26 | 87 | 15 | 22 | 10 | 25 | 15 | |
Table 5
ICA test scores differences between three groups using two-tailed T-test (ICA scores played on iPad). Significant results are marked with asterisks; * and ** indicates p-values< = 0.05 and< = 0.01, respectively
| p | |||
| Total | Speed | Accuracy | |
| HC versus MCI | 0.03* | 0.02* | 0.33 |
| HC versus mild AD | 0.00** | 0.03* | 0.00** |
| MCI versus mild AD | 0.06 | 0.64 | 0.04* |
Neuropsychiatric tests score correlations
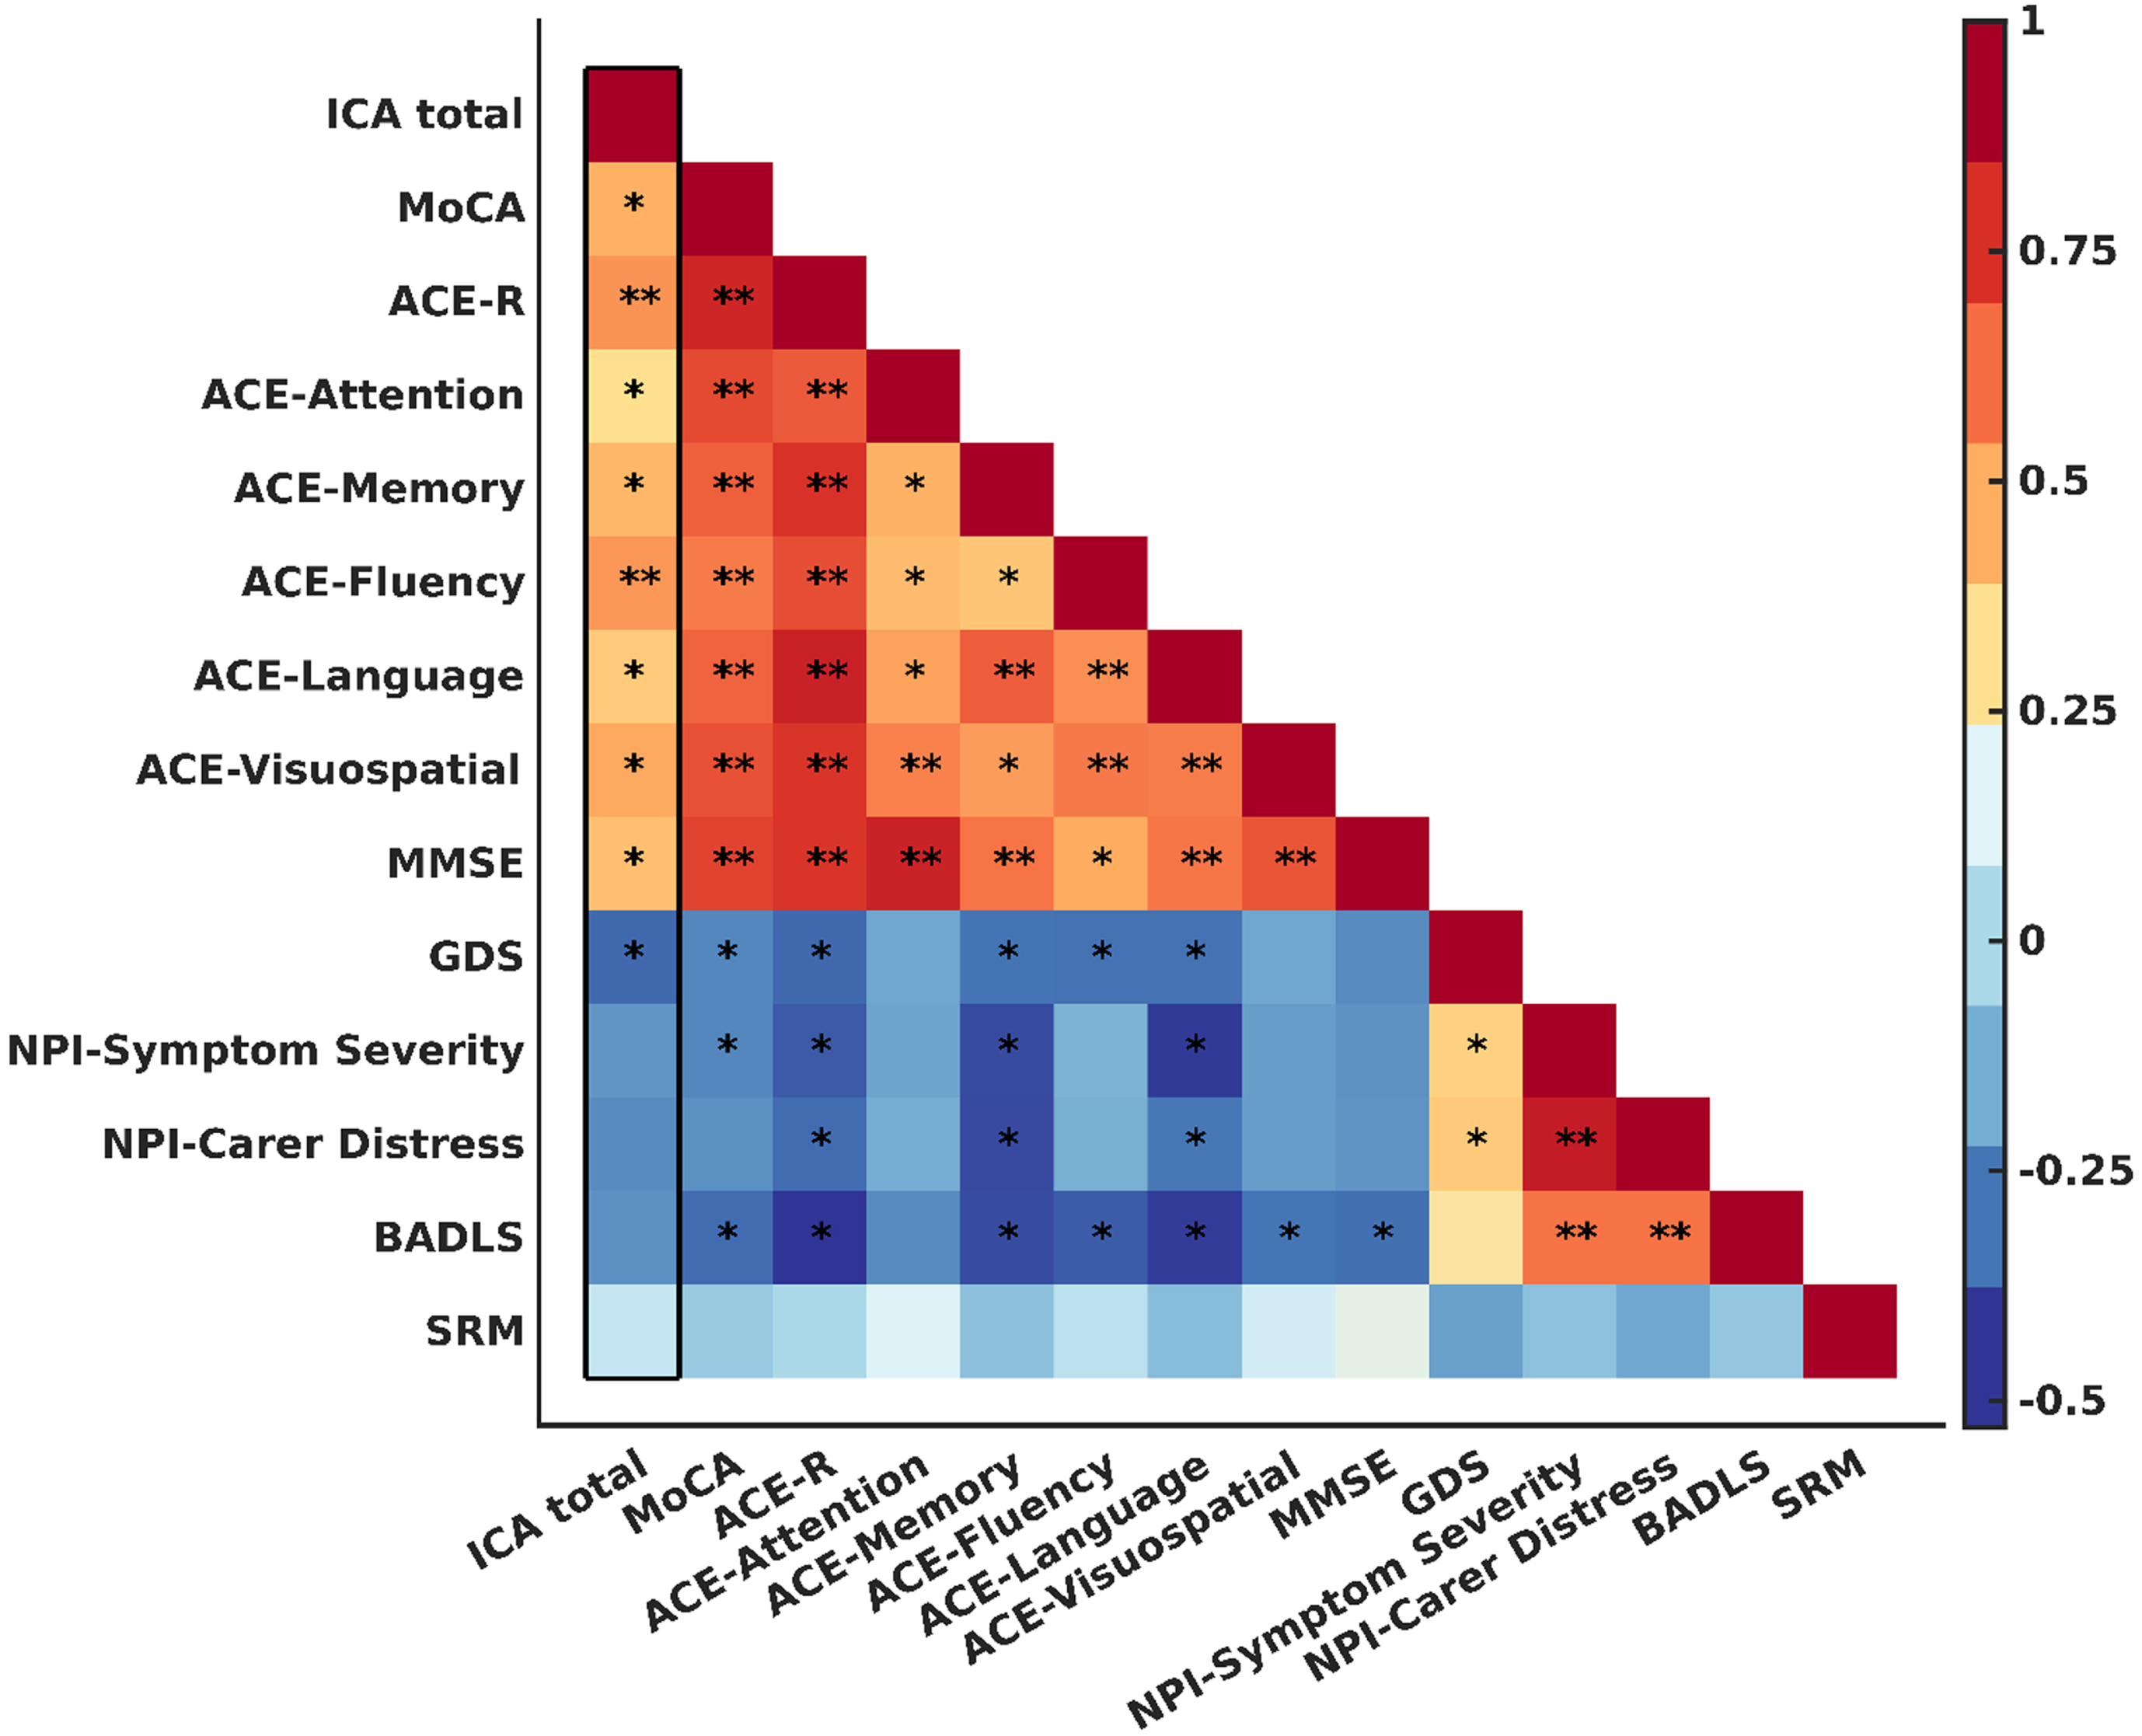
Figure 2 illustrates the correlation between each pair of neuropsychiatric tests, with asterisks (*) and double asterisks (**) denoting p-values of 0.05 or less and 0.001 or less, respectively.
Fig. 2
Pearson correlations (r) between each pair of neuropsychological tests. Color bar indictaes the value of r coefficient and direction of correlation. Significant correlations are marked with asterisks; * and ** indicates p-values< = 0.05 and< = 0.001, respectively. The square diameter represents the correlation between each test and itself, and its value is always equal to 1. The column that is marked with a thick black border indicates the correlation between ICA and other tests. SRM, self-rated memory.
ICA test activates several brain regions
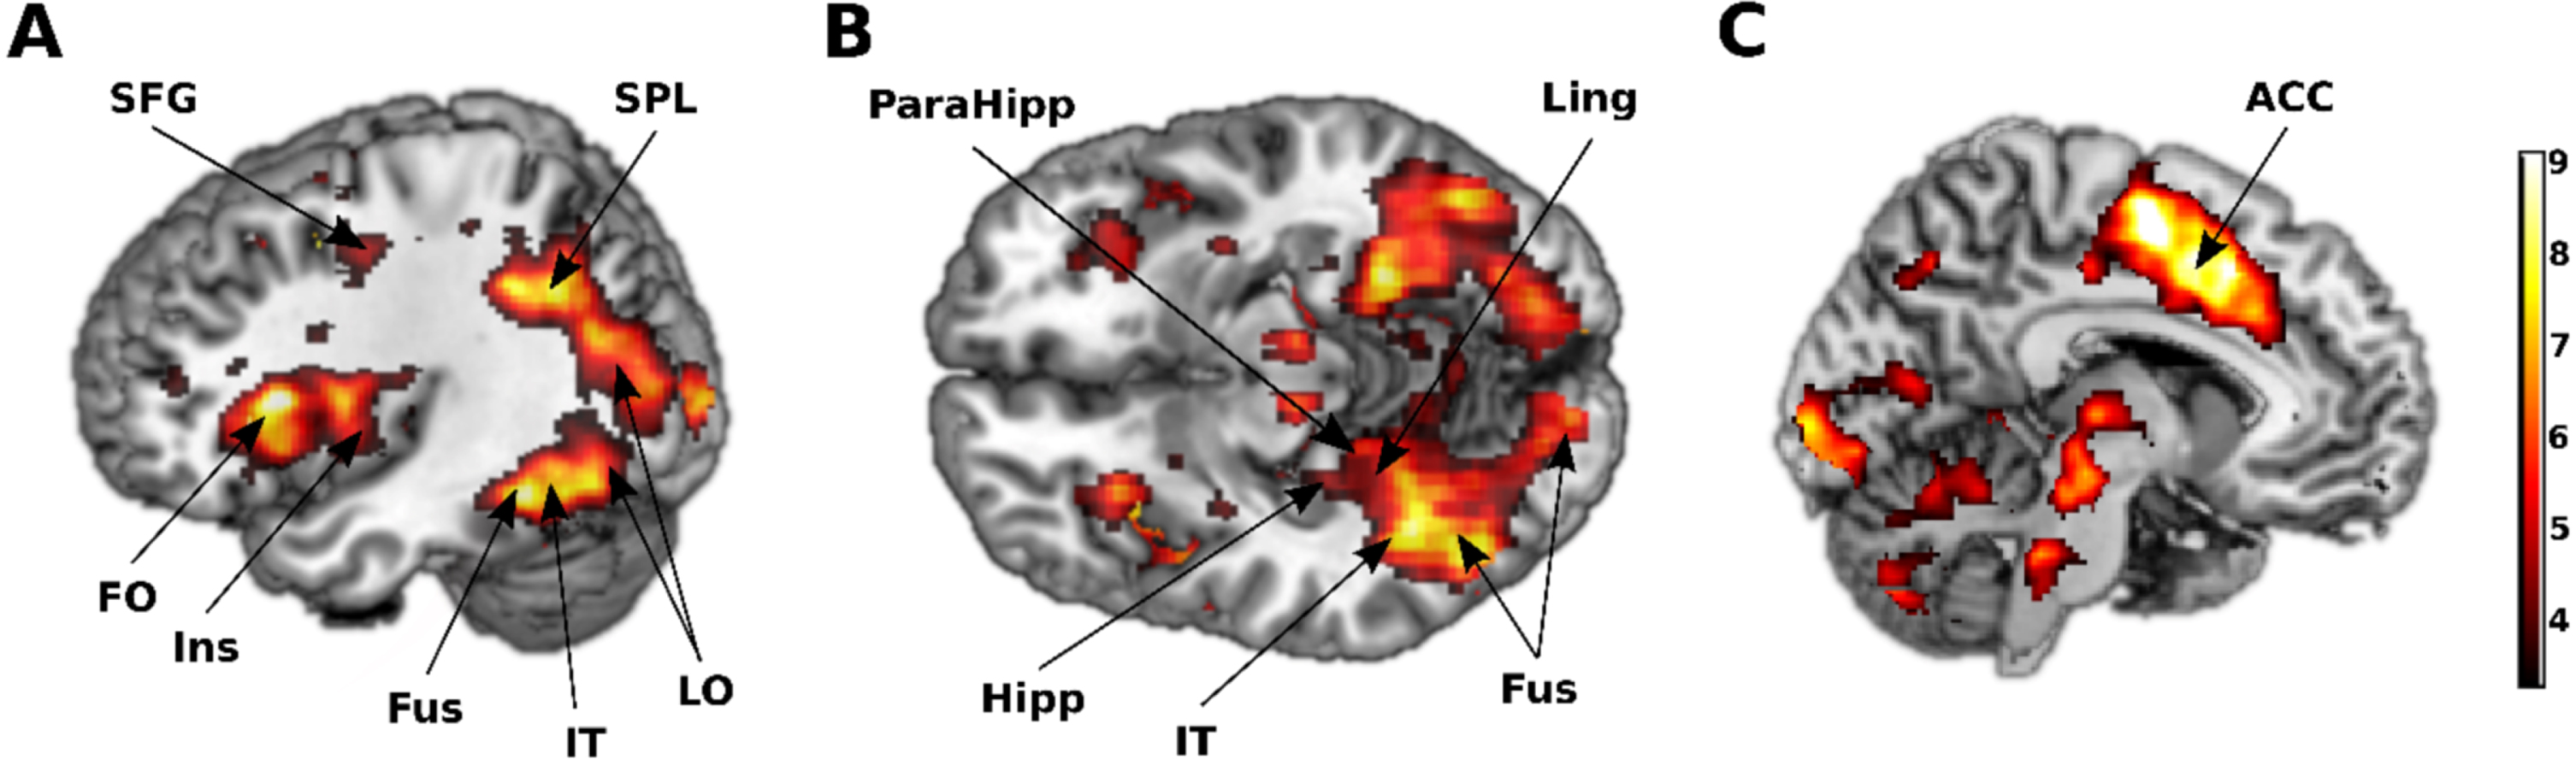
Univariate analysis of the entire brain’s activation in response to images of animal and non-animal revealed extensive brain regions involved during the ICA test. Specifically, the temporal, parietal, occipital, and frontal lobes were activated during the task. In detail, a total of 32, 34, and 7 cortical areas were found to be engaged in the HC, MCI, and mild AD groups, respectively (p≤0.001, FDR corrected). The cortical regions activated within each group are depicted in Fig. 3, and their names with corresponding coordinates are listed in Supplementary Table 1.
Fig. 3
Several brain areas were activated during the ICA test. A) Lateral view. B) Inferior view. C) Medial view. Regions activated in response to images of animal and non-animal, FDR corrected at 0.05. SFG, superior frontal gyrus; SPL, superior parietal lobule; FO, frontal operculum; Ins, insula; Fus, fusiform; IT, inferior temporal; LO, lateral occipital; ParaHipp, parahippocampus; Hipp, hippocampus; Ling, lingual; ACC, anterior cingulate cortex. The color bar represents the T statistic.
Differences in activated brain areas within three groups across entire brain
Activation encompassing all lobes of the brain, including the temporal, parietal, occipital, and frontal lobes, was observed during the ICA test in both the HC and MCI groups (Fig. 3 and Supplementary Table 1). Specifically, within the temporal lobe, both groups displayed activation in the bilateral fusiform gyri, and right inferior temporal gyrus. Conversely, within the mild AD group, an absence of activation in the temporal lobe was observed, which is typically anticipated during high-level visual object recognition tasks and with the exception of the left middle occipital gyrus, all of activated areas were localized within the parietal lobe. Both the HC and MCI groups exhibited activation in the bilateral insulas and the left anterior cingulate cortex, main hubs of the salience network responsive to external stimuli. However, again this activation was absent in the mild AD group, consistent with the disrupted nature of this network in the condition. These findings are congruent with the behavioral outcomes, which revealed significantly lower ICA scores in the mild AD group compared to the other two groups.
ROIs differentially activated through ICA test between groups
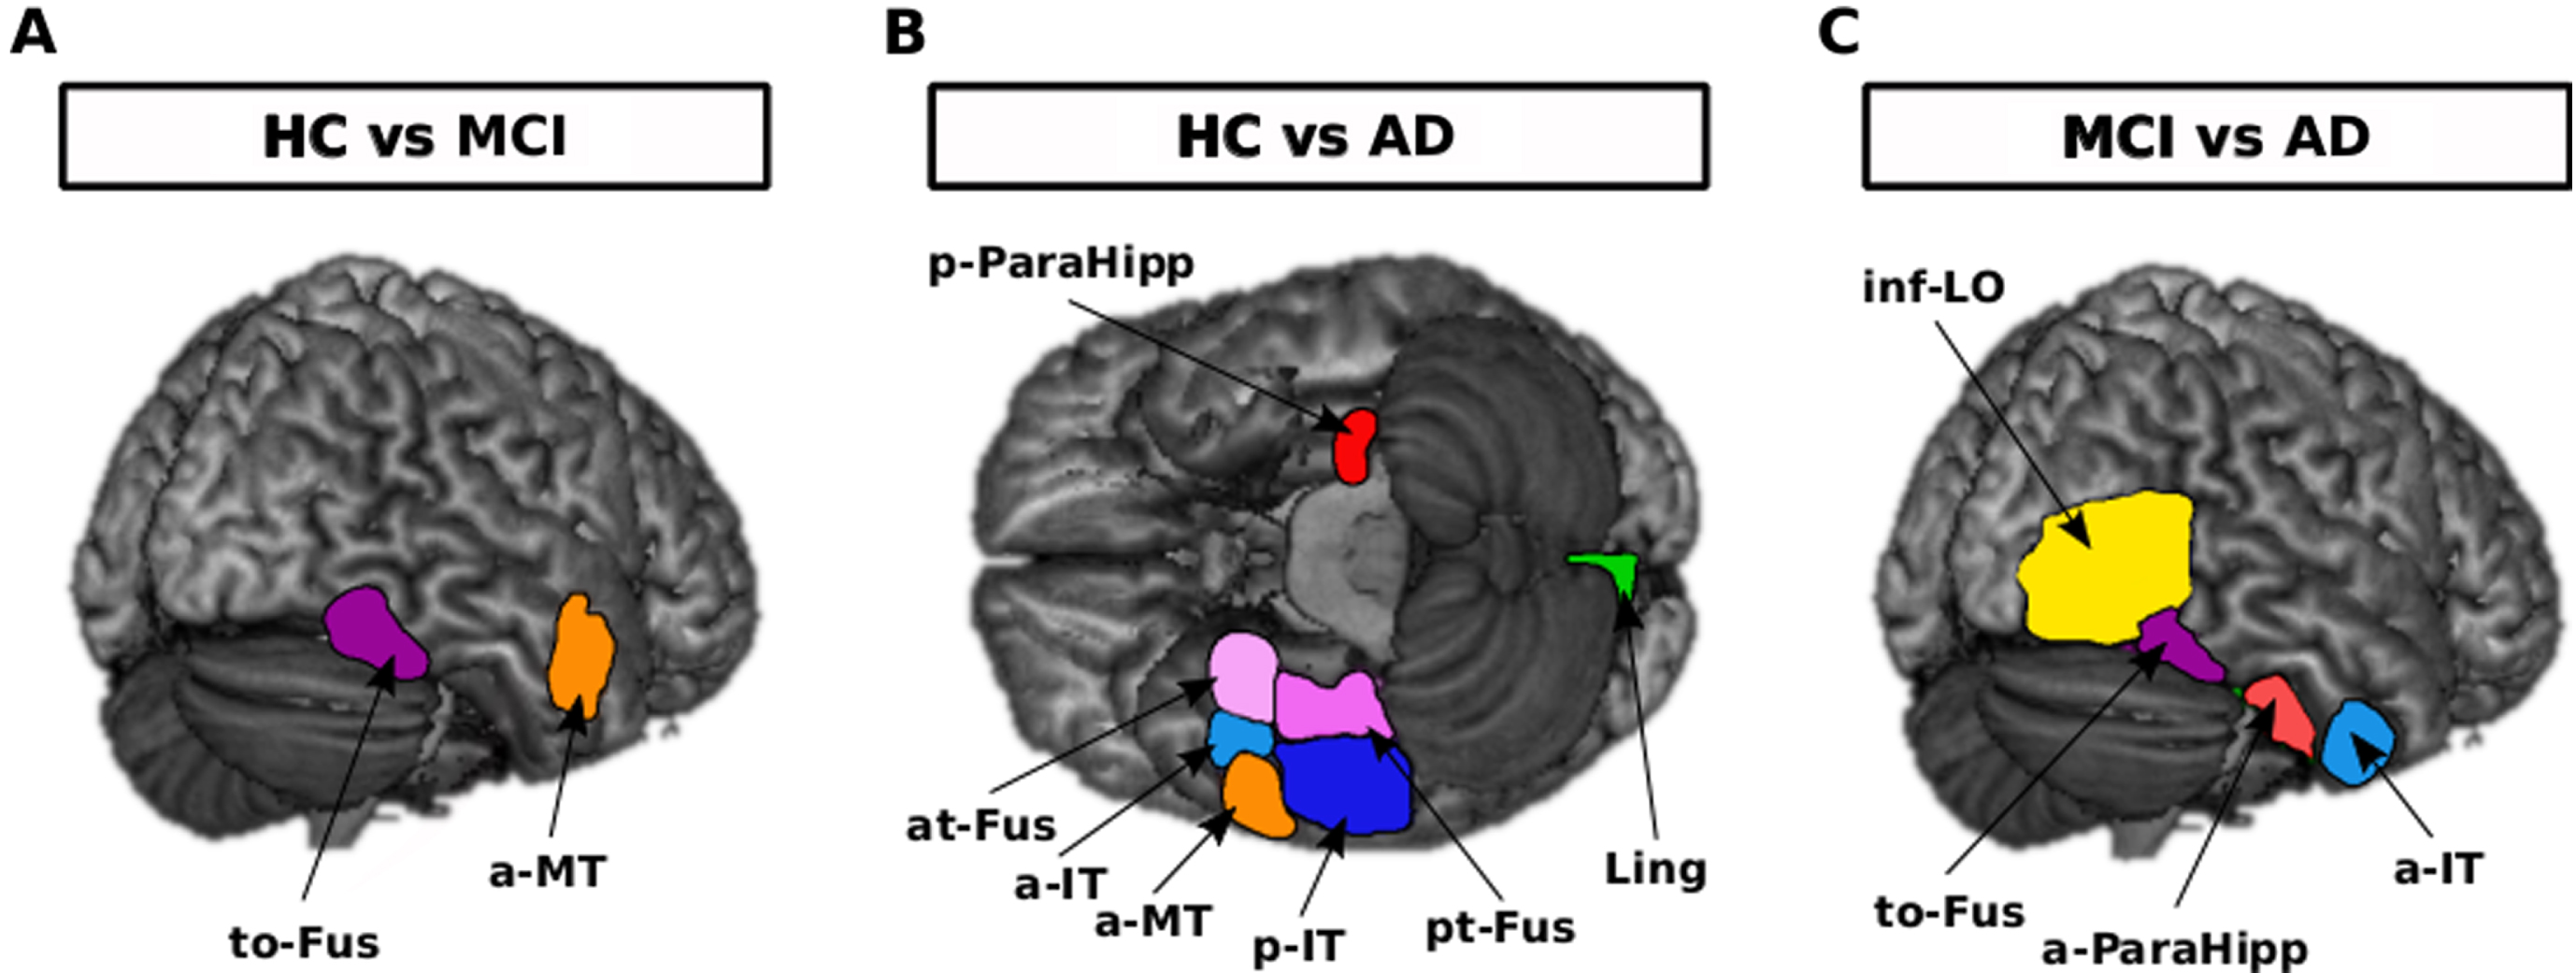
Generally, considering the brain activation in response to all images of animal and non-animal within selected ROIs, there were differences between each two groups (Fig. 4). Brain of HCs was more activated in the right temporal occipital fusiform cortex (uncorrected p = 0.004) and middle temporal gyrus, anterior division (uncorrected p = 0.047) in comparison with the MCI group. Brain of HCs was more activated in the left parahippocampal gyrus, posterior division (uncorrected p = 0.0412), right lingual gyrus (uncorrected p = 0.0029), right temporal fusiform cortex, anterior division (uncorrected p = 0.0333), right temporal fusiform cortex, posterior division (uncorrected p = 0.0084), right middle temporal gyrus, anterior division (uncorrected p = 0.0103), right inferior temporal gyrus, anterior division (uncorrected p = 0.000128), and right inferior temporal gyrus, posterior division (uncorrected p = 0.0046) in comparison with the mild AD group. Brain of MCIs was more activated in right lateral occipital cortex, inferior division (uncorrected p = 0.0010), right temporal occipital fusiform cortex (uncorrected p = 0.0490), right inferior temporal gyrus, anterior division (uncorrected p = 0.0060), and right parahippocampal gyrus, anterior division (uncorrected p = 0.0408) in comparison with the mild AD group.
Fig. 4
Brain activation differences in response to all images of animal and non-animal within regions of interest when comparing each two groups, uncorrected p-value< = 0.01. A) Right to-Fus and a-MT were more activated in the HC than in the MCI group. B) Left p-ParaHipp and right at-Fus, a-IT, a-MT, p-IT, pt-Fus and Ling were more activated in the HC than in the AD group. C) Right inf-LO, to-Fus, a-ParaHipp and a-IT were more activated in the MCI than in the AD group. to-Fus, temporal occipital fusiform cortex; at-Fus, temporal fusiform cortex, anterior division; pt-Fus, temporal fusiform cortex, posterior division; a-Mt, middle temporal gyrus, anterior division; a-IT, inferior temporal gyrus, anterior division; p-IT, inferior temporal gyrus, posterior division; p-ParaHipp, parahippocampal gyrus, posterior division; a-ParaHipp, parahippocampal gyrus, anterior division; Ling, lingual gyrus; inf-LO, lateral occipital cortex, inferior division. The only region that remained significant after FDR correction was right a-IT in HC versus AD comparison.
Right temporal occipital fusiform cortex was common when comparing HC versus MCI and MCI versus mild AD groups. Right middle temporal gyrus, anterior division was common when comparing HC versus MCI and HC versus mild AD groups. Right inferior temporal gyrus, anterior division was common when comparing HC versus mild AD and MCI versus mild AD groups. Right inferior temporal gyrus, anterior division specifically was distinct and remained significant after FDR correction when comparing the HC versus mild AD group.
There is information in the pattern of activity while not in the level of activity in the HC and MCI groups
By employing MVPA, we discovered that while recognizable information exists within the patterns of brain activity, the same cannot be ascribed to the mere levels of activity. In the context of categorizing animacy, MVPA demonstrated that both HC and MCI groups were able to significantly differentiate between animal and non-animal stimuli while univariate method failed to reveal any difference in brain activation when comparing responses to animal versus non-animal images across HC, MCI, and mild AD groups. The MVPA showcased the ability of HC and MCI groups to decode animacy across significant regions. Notably, within the mild AD group, neither univariate nor multivariate analysis could distinguish between animal and non-animal stimuli. These findings underscore the absence of discriminative information, both in terms of activity level and pattern, in the mild AD group pertaining to animacy decoding.
ROIs that have information to decode animacy in the HC group
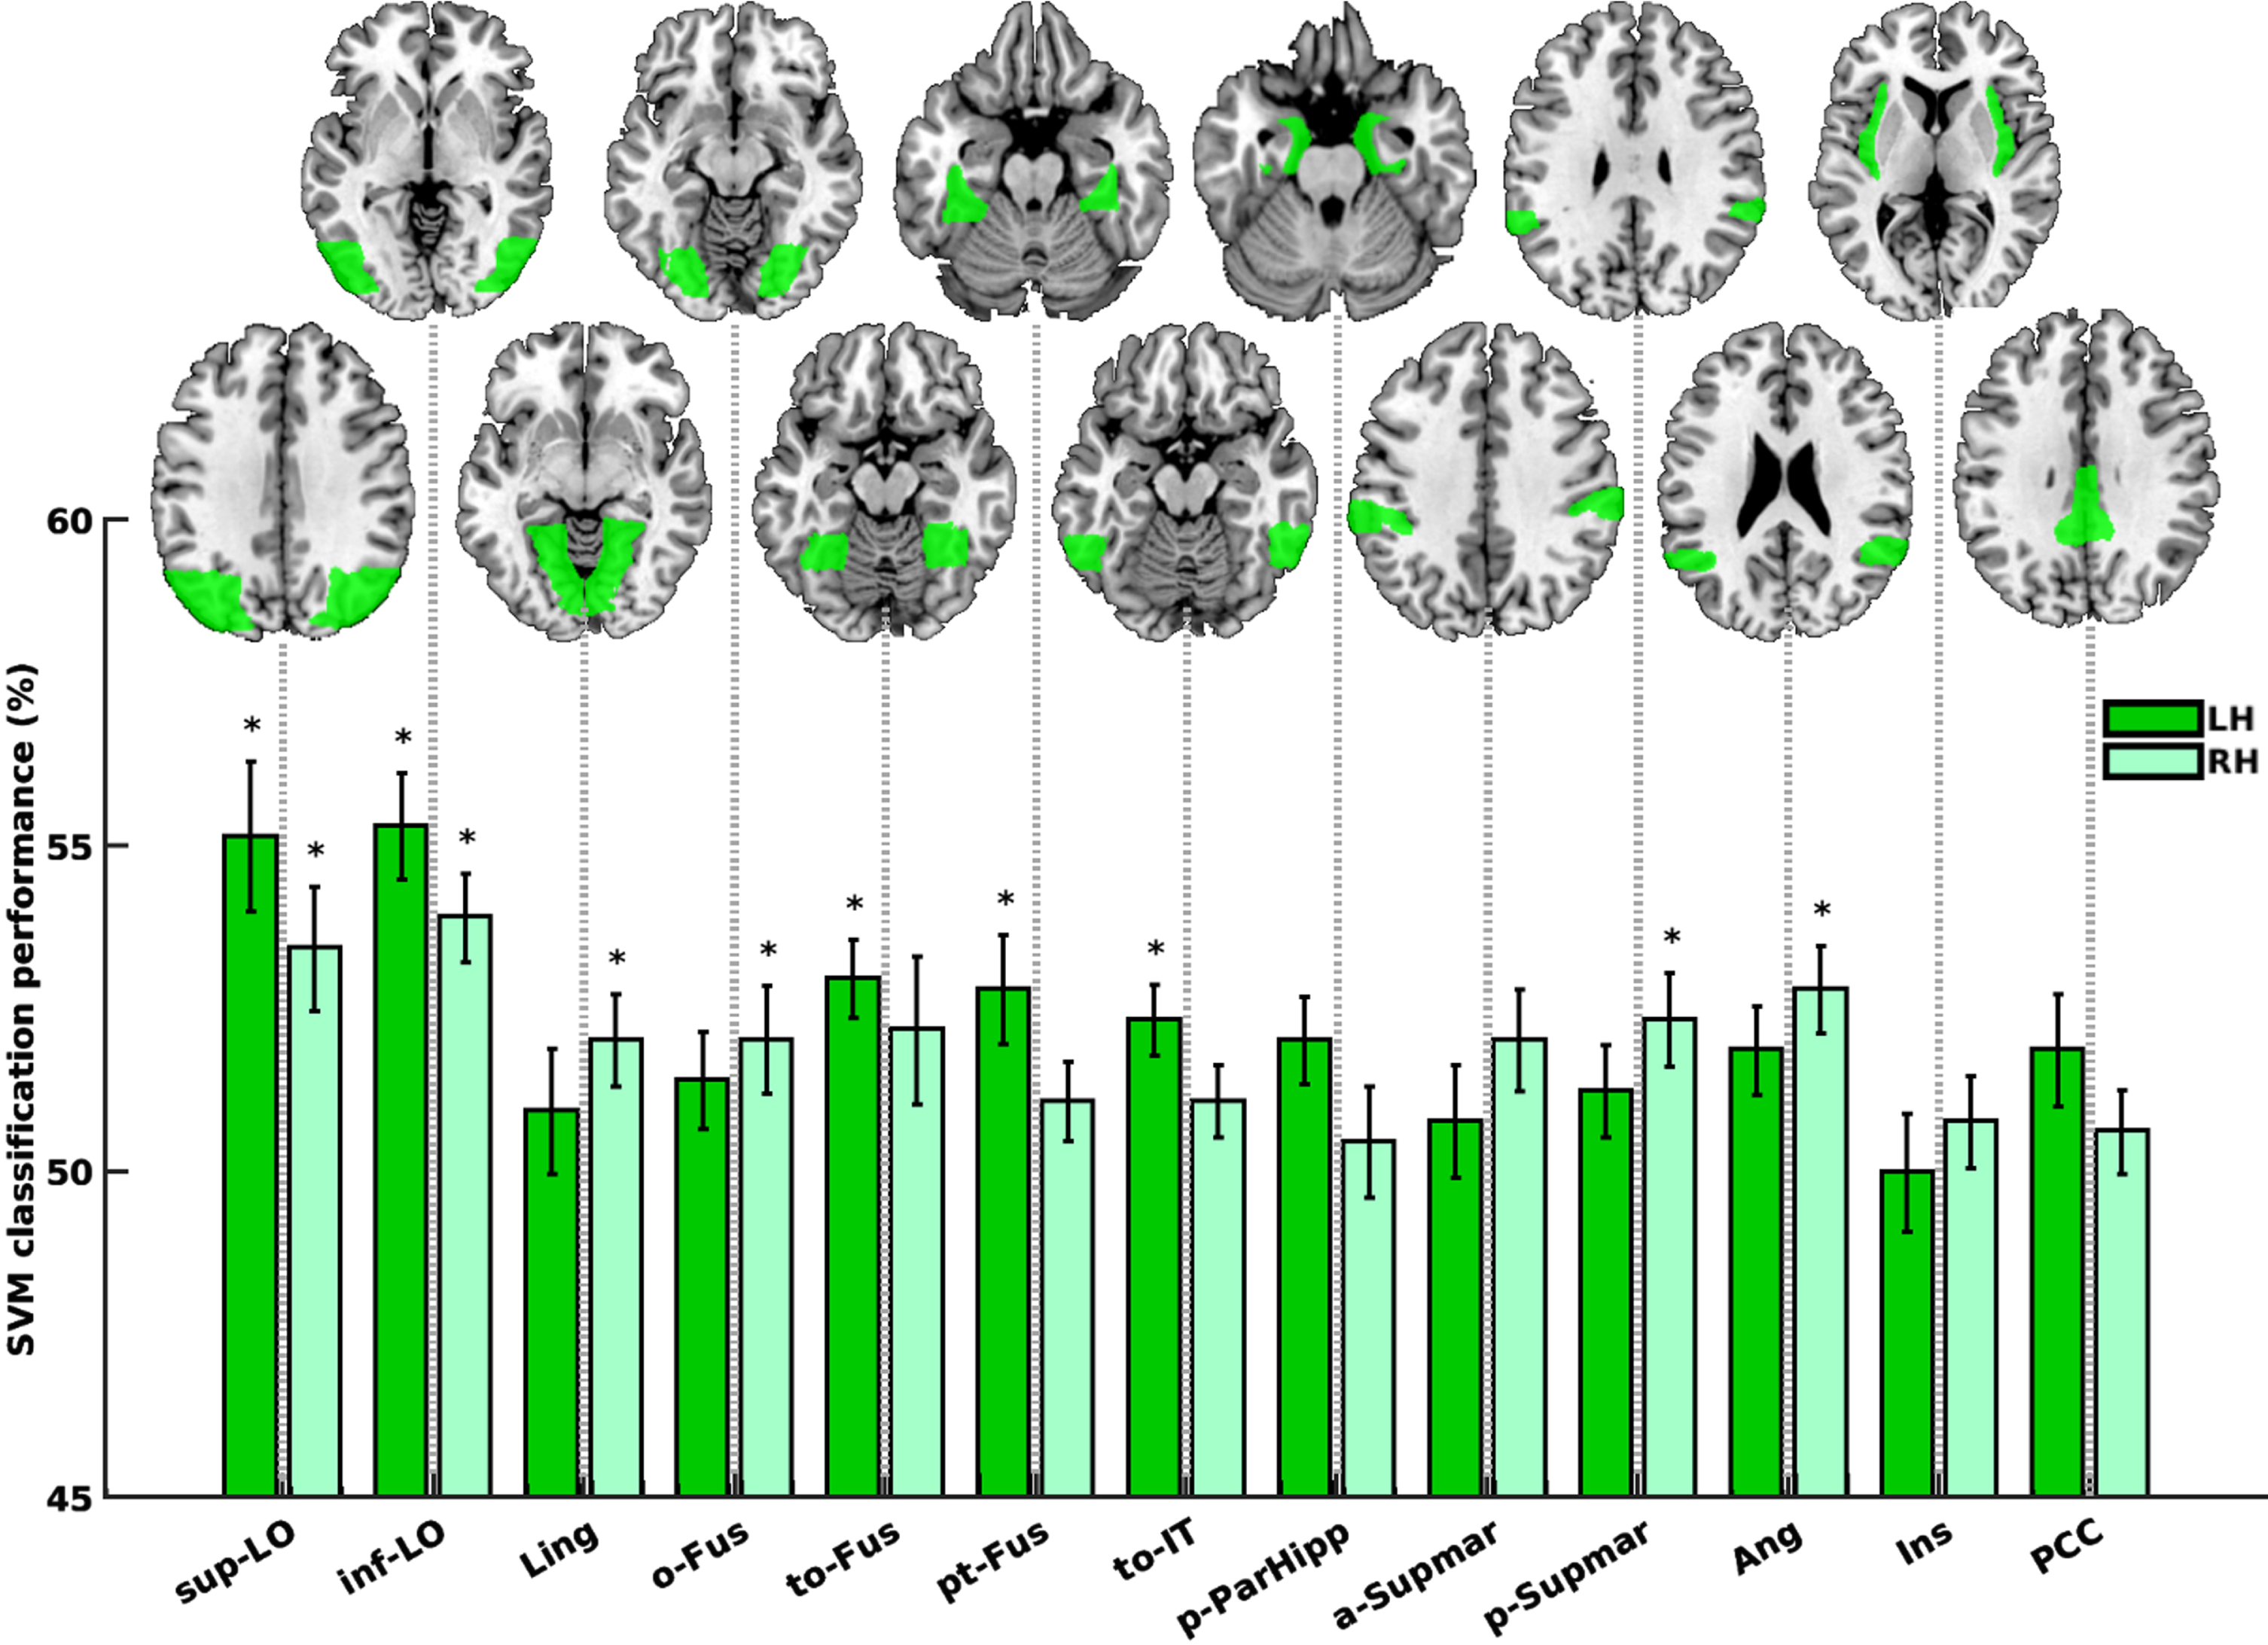
Within the HC group, specific regions demonstrated information within their activity patterns to effectively differentiate between animals and non-animals. These regions encompassed the left and right lateral occipital cortex, superior division (sup-LO; p = 0.0003 and 0.0003), left and right lateral occipital cortex, inferior division (inf-LO; p = 0.0001 and 0.0010), right lingual gyrus (Ling; p = 0.0113), left and right occipital fusiform gyrus (o-Fus; p = 0.0220 and 0.0097), left and right temporal occipital fusiform cortex (to-Fus; p = 0.0001 and 0.0395), left temporal fusiform cortex, posterior division (pt-Fus; p = 0.0028), left inferior temporal gyrus, temporooccipital part (to-IT; p = 0.0007), left parahippocampal gyrus, posterior division (p-ParaHipp; p = 0.0158), left and right supramarginal gyrus, anterior division (a-Supmar; p = 0.0472 and 0.0220), right supramarginal gyrus, posterior division (p-Supmar; p = 0.0039), left and right angular gyrus (Ang; p = 0.0236 and 0.0007), right insular cortex (Ins; p = 0.0381), and left cingulate gyrus, posterior division (PCC; p = 0.0362), as shown in Fig. 5. Out of these 19 significant regions (sign-rank), 11 regions remained significant even after FDR-correction, as indicated by bars marked with asterisks in Fig. 5.
Fig. 5
Animacy decoding in the HC group. Dark and light green bars represent the left and right hemispheres, respectively. Bars marked with asterisk (*) are regions remained significant following FDR correction. sup-LO, lateral occipital cortex, superior division; inf-LO, lateral occipital cortex, inferior division; Ling, lingual gyrus; o-Fus, occipital fusiform gyrus; to-Fus, temporal occipital fusiform cortex; pt-Fus, temporal fusiform cortex, posterior division; to-IT, inferior temporal gyrus, temporooccipital part; p-ParaHipp, parahippocampal gyrus, posterior division; a-Supmar, supramarginal gyrus, anterior division; p-Supmar, supramarginal gyrus, posterior division; Ang, angular gyrus; Ins, insular cortex; PCC, cingulate gyrus, posterior division.
ROIs that have information to decode animacy in the MCI group
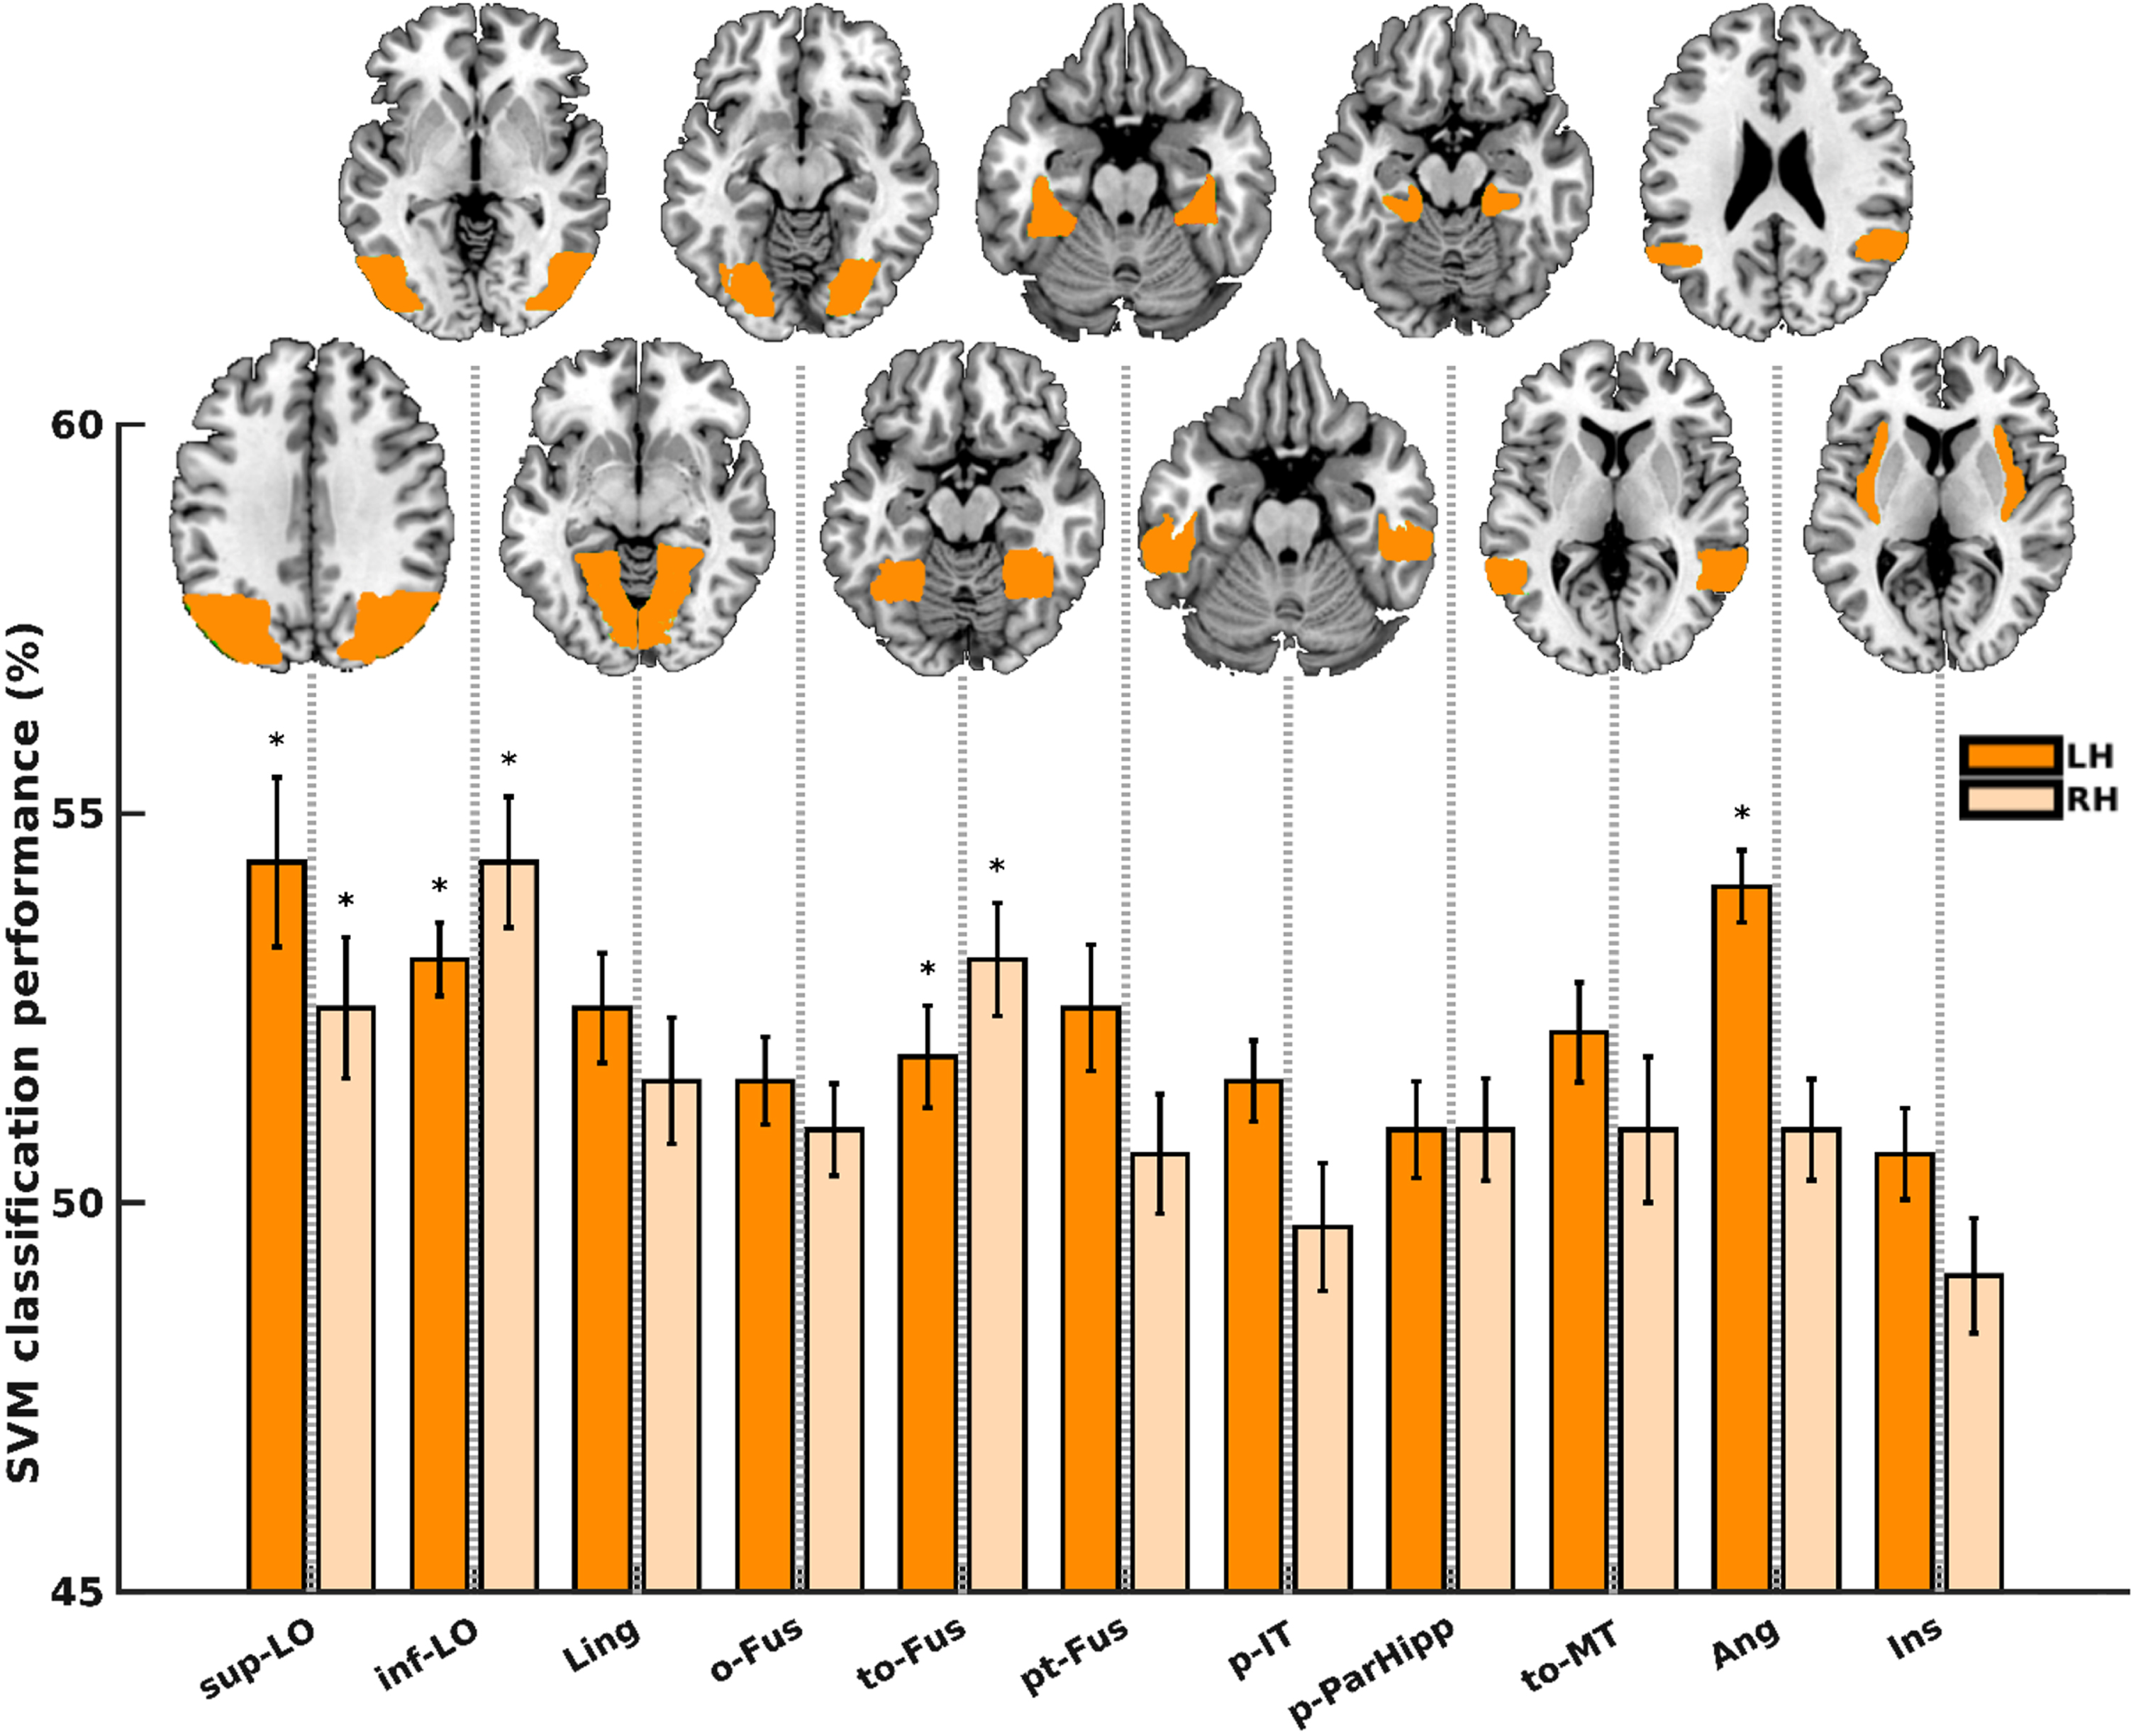
Within the MCI group, distinct regions exhibited informative patterns of activity for distinguishing animals from non-animals. These regions encompassed the left and right lateral occipital cortex, superior division (sup-LO; p = 0.0020 and 0.0021), left and right lateral occipital cortex, inferior division (inf-LO; p = 0.0000 and 0.0001), left and right occipital fusiform gyrus (o-Fus; p = 0.0101 and 0.0196), left lingual gyrus (Ling; p = 0.0167), left temporal fusiform cortex, posterior division (pt-Fus; p = 0.0232), left and right temporal occipital fusiform cortex (to-Fus; p = 0.0008 and 0.0035), left and right middle temporal gyrus, temporooccipital part (to-MT; p = 0.0332 and 0.0257), left inferior temporal gyrus, posterior division (to-IT; p = 0.0450), left parahippocampal gyrus, posterior division (p-ParHipp; p = 0.0233), left angular gyrus (Ang; p = 0.000), and left insular cortex (Ins; p = 0.0451), as illustrated in Fig. 6. Among these 16 significant regions (sign-rank), 7 regions remained significant after FDR-correction, as indicated by bars marked with asterisks in Fig. 6.
Fig. 6
Animacy decoding in the MCI group. Dark and light orange bars represent the left and right hemispheres, respectively. Bars marked with asterisk (*) are regions remained significant following FDR correction. sup-LO, lateral occipital cortex, superior division; inf-LO, lateral occipital cortex, inferior division; Ling, lingual gyrus; o-Fus, occipital fusiform gyrus; to-Fus, temporal occipital fusiform cortex; pt-Fus, temporal fusiform cortex, posterior division; p-IT, inferior temporal gyrus, posterior division; p-ParaHipp, parahippocampal gyrus, posterior division; to-MT, middle temporal gyrus, temporooccipital part; Ang, angular gyrus; Ins, insular cortex.
ROIs that have information to decode animacy in the mild AD group
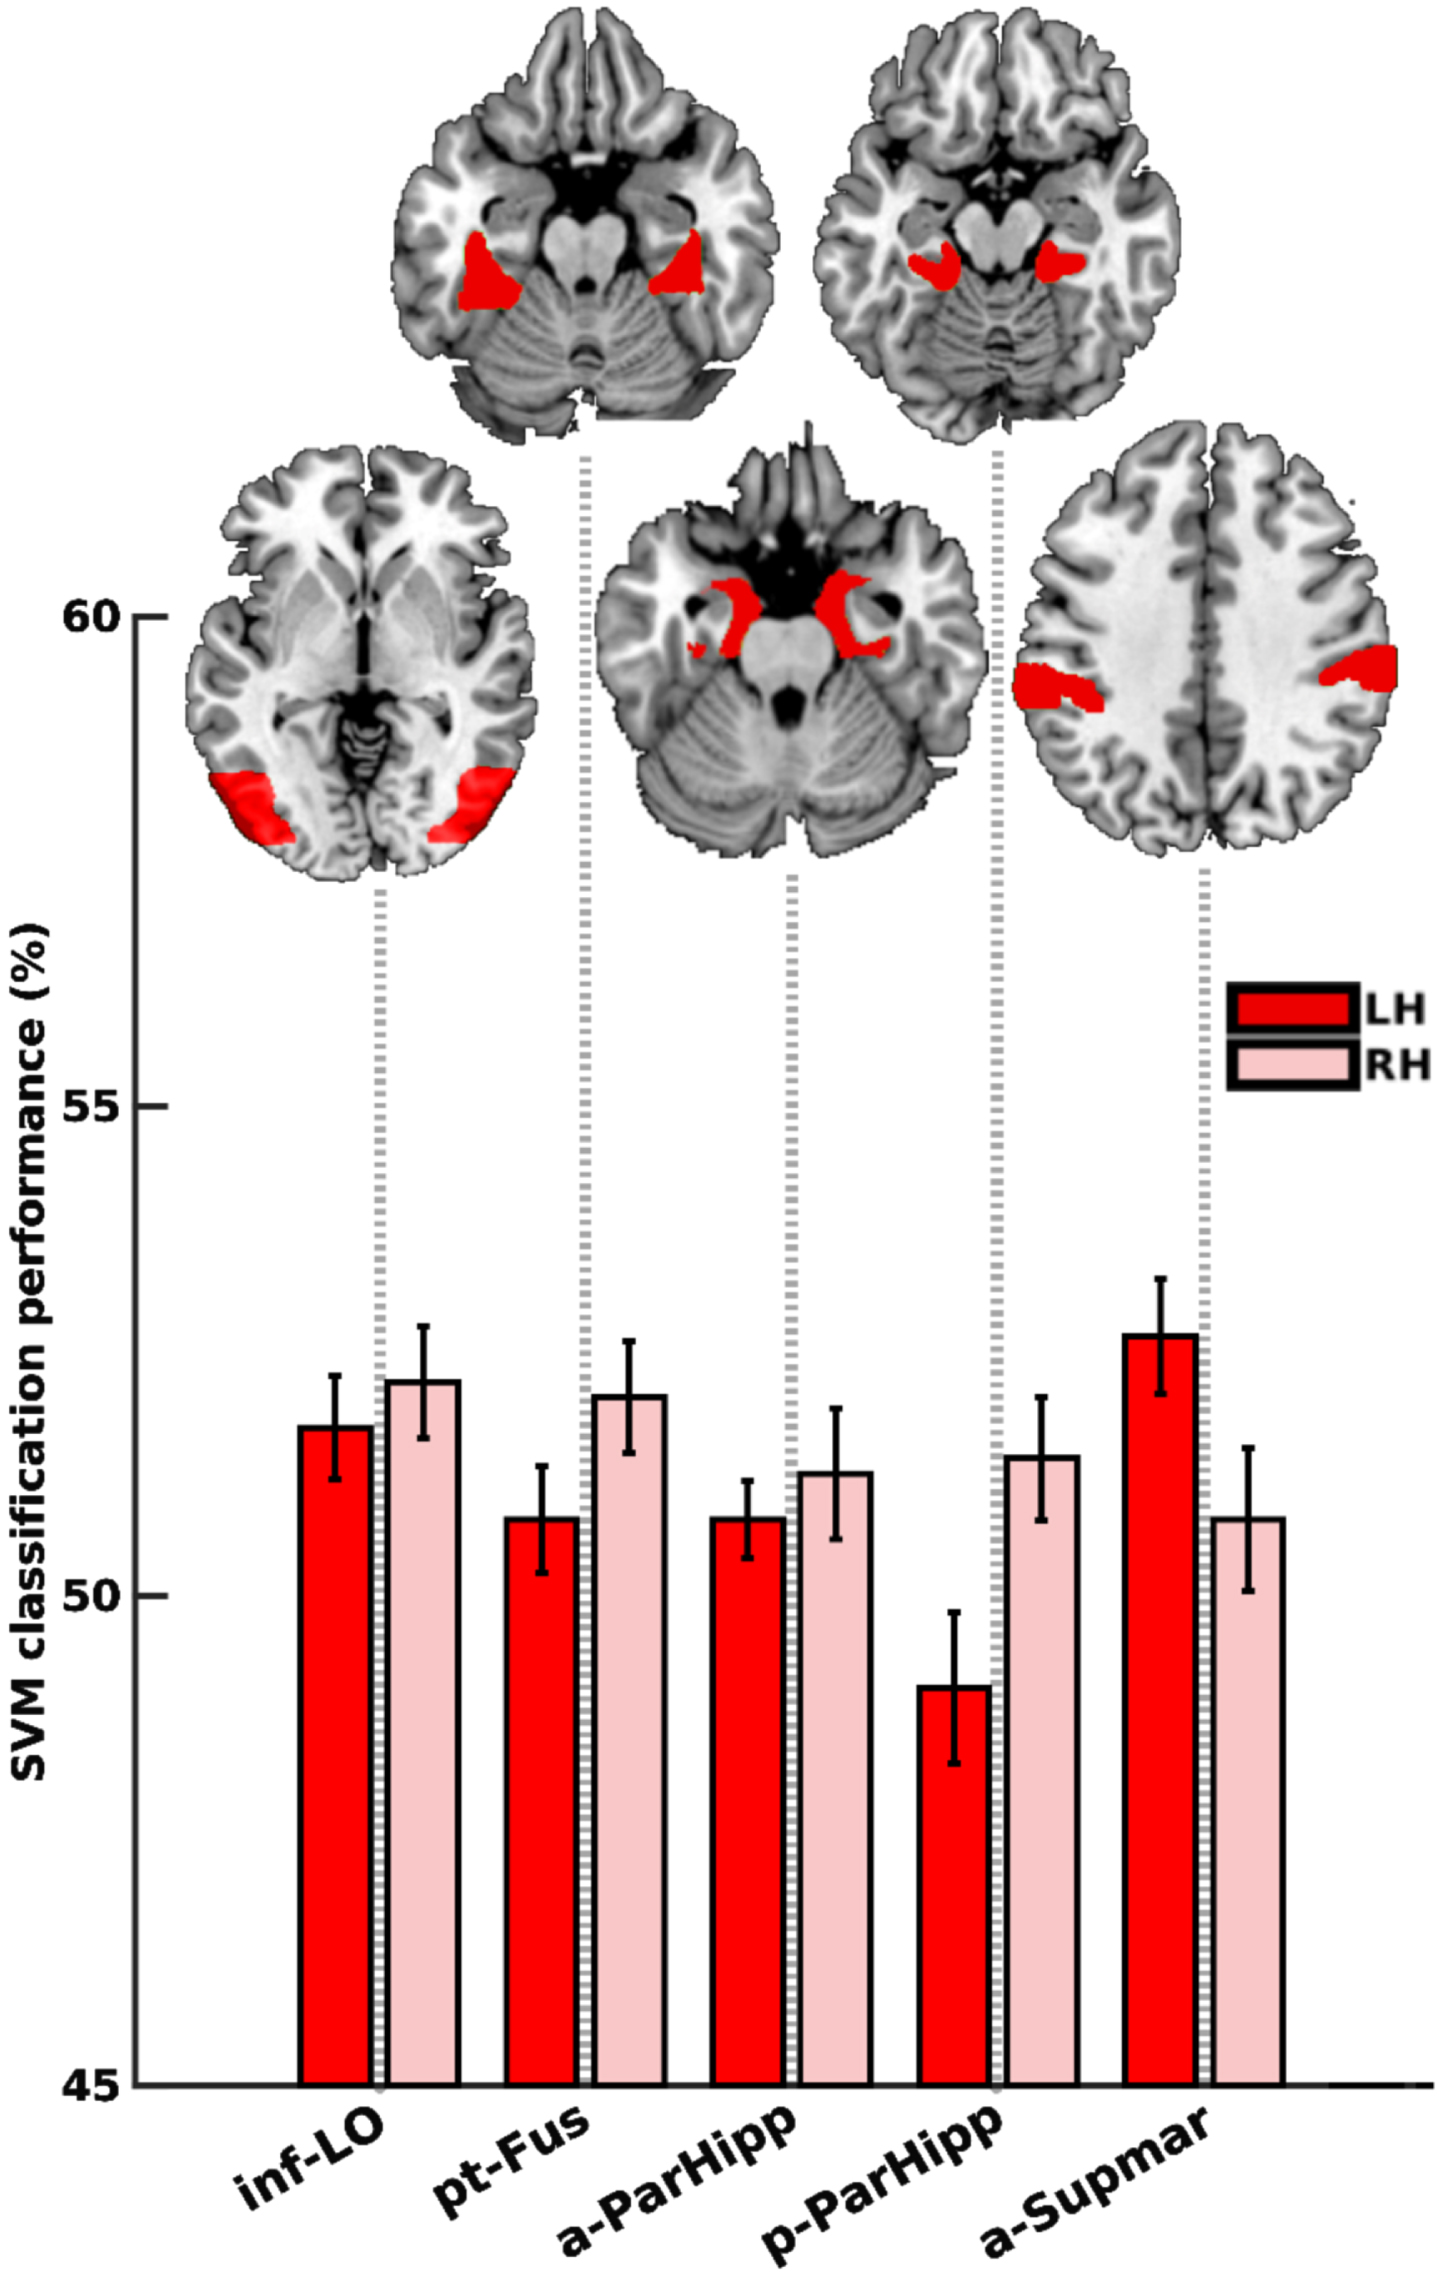
Within the mild AD group, certain regions displayed distinctive patterns of activity that facilitated the differentiation between animals and non-animals. These regions encompassed the left and right lateral occipital cortex, inferior division (inf-LO; p = 0.0048 and 0.0058), right temporal fusiform cortex, posterior division (pt-Fus; p = 0.0195), left parahippocampal gyrus, anterior division (a-ParHipp; p = 0.0136), right parahippocampal gyrus, posterior division (p-ParHipp; p = 0.0097), left supramarginal gyrus, anterior division (a-Supmar; p = 0.0205), as visualized in Fig. 7. Among these 6 significant regions (sign-rank), no region remained significant after FDR-correction, as indicated by the absence of asterisks in Fig. 7.
Fig. 7
Animacy decoding in the mild AD group. Dark and light red bars represent the left and right hemispheres, respectively. No region remained significant following FDR correction. inf-LO, lateral occipital cortex, inferior division; pt-Fus, temporal fusiform cortex, posterior division; a-ParaHipp, parahippocampal gyrus, anterior division; p-ParaHipp, parahippocampal gyrus, posterior division; a-Supmar, supramarginal gyrus, anterior division.
As the level of cognitive impairment progressed from HC to MCI to mild AD, the capacity of regions to effectively decode animacy declined, resulting in a reduction in the number of regions with this capability. This trend is congruent with the behavioral results from the ICA test scores. Specifically, the ICA-total for HC was superior to that of MCI and mild AD, measuring at 66.6 (±8.75), 59.13 (±10.14), and 50.5 (±11.8), respectively. The decreasing ability to extract information from brain activity, which was unattainable in the mild AD group and less apparent in MCI compared to HC, is reflected in behavioral outcomes. In the MCI and AD groups, individuals struggled to accurately categorize animacy, highlighting a decline in perceptual discrimination. For detailed ICA test scores, refer to Table 4.
Regions that had information to decode animacy in one group but not the other
Several regions exhibited information in their activity patterns to decode animacy in one group but not in the other. Specifically, six regions, namely the right lingual gyrus (Ling), right occipital fusiform gyrus (o-Fus), left posterior division of the temporal fusiform cortex (pt-Fus), left inferior temporal gyrus, temporooccipital part (to-IT), posterior division of the right supramarginal gyrus (p-Supmar), and right angular gyrus (Ang), were capable of decoding animacy in the HC group but not in the MCI group. Conversely, two regions, the right temporal occipital fusiform cortex (to-Fus) and left angular gyrus (Ang), displayed animacy decoding capability in the MCI group but not in the HC group. Interestingly, no region exhibited animacy decoding potential in the mild AD group that was not present in the HC or MCI groups.
ROIs with information for subject decoding
Through the utilization of MVPA, we identified certain regions that contained discriminatory information for distinguishing between different groups, a process known as subject decoding or subject-wise classification.
Regions that significantly discriminated HCs from MCIs were the left temporal fusiform cortex, anterior (at-Fus) and posterior (pt-Fus) divisions and right insular cortex (Ins) (10000 bootstrap resampling of subjects, FDR corrected). These three regions displayed no discernible information for animacy decoding in MCI subjects. Intriguingly, in the HC group, these same regions demonstrated no significant animacy-related information at the level of brain activity; however, they revealed considerable information for discriminating between HC and MCI individuals during subject decoding, exhibiting robust performance accuracies of 63%, 68%, and 70%, respectively (depicted by blue bars in Fig. 8). Although the left angular gyrus (Ang) also exhibited subject decoding potential, it did not retain significance following FDR correction.
Fig. 8
Subject-wise classification. HC versus MCI (blue bars), HC versus mild AD (red bars), and MCI versus mild AD (yellow bars). All regions shown here are significant after 10000 bootstrap resampling of subjects. Regions survived after FDR-correction are marked with an asterisk (*). at-FUS, temporal fusiform cortex, anterior division; pt-FUS, temporal fusiform cortex, posterior division; Ang, angular gyrus; Ins, insular cortex; inf-LO, lateral occipital cortex, inferior division; PCC, cingulate gyrus, posterior division; to-IT, inferior temporal gyrus, temporooccipital part; L, left; R, right.
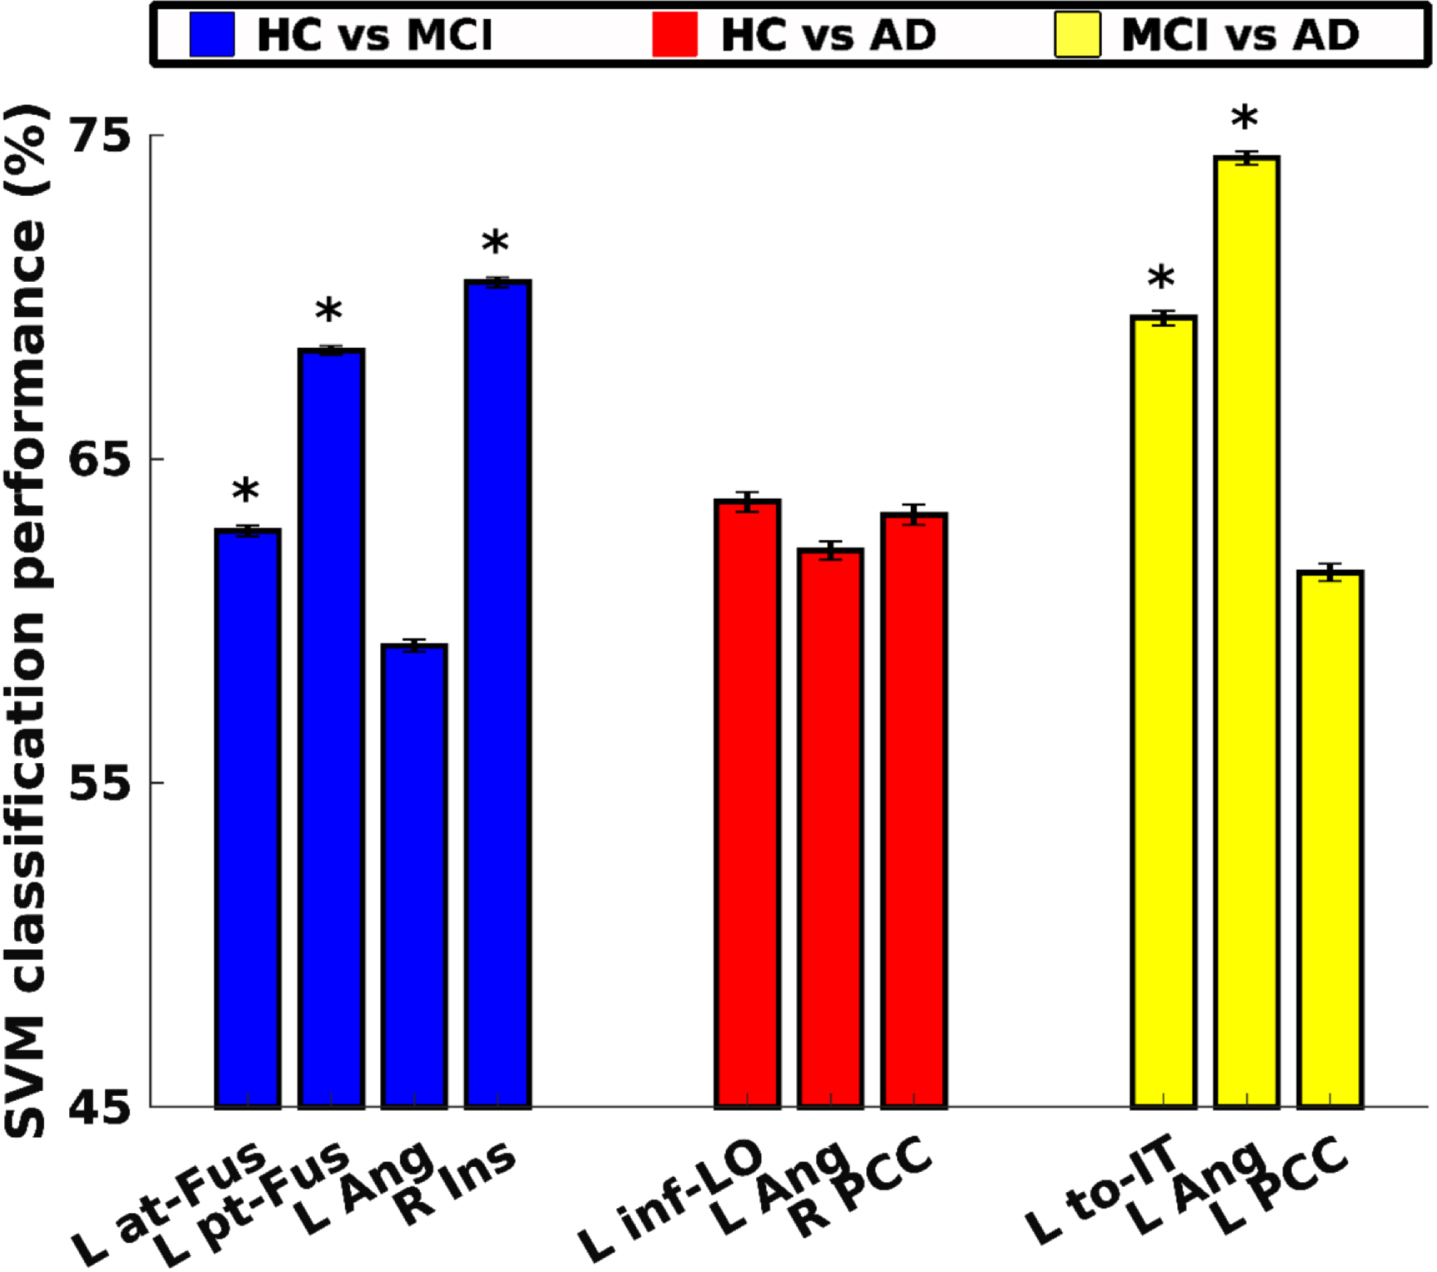
Regions that significantly discriminated HCs from ADs were the left lateral occipital cortex, inferior division (inf-LO), left angular gyrus (Ang), and right cingulate gyrus, posterior division (PCC), as established through 10000 bootstrap resampling of subjects. However, none of these regions maintained statistical significance after FDR correction. Performance accuracies for the left lateral occipital cortex, inferior division (inf-LO), left angular gyrus (Ang), and right cingulate gyrus, posterior division (PCC) were 64%, 62%, and 63%, respectively (represented by red bars in Fig. 8).
Regions that significantly discriminated MCIs from ADs were the Inferior temporal cortex, temporooccipital part (to-IT) and left angular gyrus (Ang), established through 10000 bootstrap resampling of subjects and FDR correction. Performance accuracies were 69% and 74%, respectively (depicted as yellow bars in Fig. 8). Additionally, cingulate gyrus, posterior division (PCC) exhibited the ability to decode subjects with a performance accuracy of 61%, yet it did not retain significance after FDR correction.
DISCUSSION
We examined the spatial neural dynamics of visual animacy processing in the brains of HCs, subjects with MCI, and mild AD. Our results revealed the potential of the ICA test, a rapid visual categorization task, to detect cognitive impairments in the early stages of AD. This non-memory ICA task engaged high-level visual areas affected functionally in early AD stages. Moreover, this task was designed to be challenging enough to detect subtle impairments that are sometimes not easily recognizable using the current standard of care assessment tools. Detecting cognitive decline early offers patients the chance to enhance their lifestyle, get timely diagnoses, and access future AD therapies.
We demonstrated that in response to the ICA task, extensive areas of the cortex were activated, therefore increasing the likelihood of detecting less severe brain deteriorations. The MCI group exhibited a greater number of activated regions compared to both the HC and mild AD groups. In the mild AD group, unlike HC and MCI, the brain activation was deteriorated, and limited to the parietal cortex and the left middle occipital gyrus. Furthermore, we identified regions where the mean level of brain activity displayed variations between each pair of groups in response to both animal and non-animal images.
Traditionally, the predominant analysis method employed in prior task-based fMRI investigations within the realm of AD has been univariate analysis. This approach primarily seeks to identify the presence and extent of activation within specific brain regions. We employed MVPA as an alternative approach to look deeper into the data, aiming to uncover additional insights that are not typically discerned through univariate analysis. By applying MVPA, we identified specific brain regions in HCs and MCIs that exhibited the ability to decode animacy. However, in the mild AD group, no brain regions demonstrated the capability to decode animacy following the correction for multiple comparisons.
ICA scores deteriorate as the disease progresses from MCI to mild AD
We have established that rapid animacy categorization is compromised in both MCIs and mild AD patients when compared to HCs, and this impairment exacerbates as the disease progresses from MCI to mild AD. The MCI group exhibited significantly lower ICA-speed and total scores than the HC group. However, the ICA-accuracy did not decline significantly from HC to MCI. This divergence in speed but not accuracy suggests that individuals with MCI might be sacrificing their speed to uphold their performance levels.
Comparing HC and mild AD, the ICA-speed and total scores of the mild AD group were significantly lower than those of the HC group. However, unlike the MCI group, the ICA-accuracy score also exhibited a significant decline. This observation implies that even though the processing speed was slower in the mild AD group, this decrease in speed was insufficient to sustain accuracy levels comparable to that of HCs.
Comparing MCI and mild AD, we observed a significant decline in ICA-accuracy, but not in the ICA-speed. This finding suggests that despite similar processing speeds, individuals with mild AD exhibited significantly worse accuracy in performing the ICA test compared to those with MCI.
ICA: A challenging visual task
The aforementioned findings align with previous research [14, 23] emphasizing the significance of evaluating both accuracy and speed for effective differentiation between patient groups and HCs. Utilizing a time-sensitive approach in neuropsychological assessments, instead of a time-free model, can enhance the detection of cognitive deficits. By measuring both accuracy and reaction time as proxies for cognitive impairment, the ICA test becomes a more sensitive tool for cognitive screening compared to solely measuring accuracy in a time-free manner. These two metrics together offer a more comprehensive assessment, mirroring the demands of real-world tasks that need to be completed with satisfactory performance within a reasonable timeframe [19].
The rapid and time-sensitive nature of the ICA task in our study resembles challenging daily activities, which may explain its ability to detect impairments that might not be evident in simpler tasks [12]. In [12], the accuracy of patients with AD differed from that of HCs only when the task was time-sensitive, while no difference was observed when participants had enough time to categorize animacy in natural scenes. This indicates that the ICA task’s time-sensitive design is better suited to capture early impairments in AD, as it simulates real-life experiences that require an accurate response within a limited time period.
ICA engages several key brain regions
We demonstrated that in response to the ICA task, extensive areas of the cortex were activated, therefore increasing the likelihood of detecting less severe brain deterioration at the early stages of AD. Since the ICA is an animal recognition test within natural scenes, as opposed to simple shapes on a plane background, high-level visual areas going beyond the occipital lobe early visual cortices within the temporal lobe were activated. These included the hippocampus, parahippocampus, fusiform, and inferior temporal gyri that are also known to be affected by misfolded tau proteins at the early stages of AD [70]. Bilateral insulas and the left ACC, which serve as main hubs of the salience network and generally activated across tasks [73], were also activated during the ICA task. Because of natural scenes, it was not surprising that parts of the parietal lobe which is known to code location-dependency in visual perception were also activated.
Differential activation of extensive brain regions by the ICA task across groups
Upon comparing the groups and taking into account the activated regions within each group, we noticed distinct brain activation profiles in response to all images of animal and non-animal. The HC and MCI groups displayed activation in high-level visual areas within the temporal cortex, specifically the ventral visual pathway responsible for object recognition, which aligns with the target of the ICA test. In contrast, the mild AD group exhibited brain activation mainly limited to the parietal cortex and left middle occipital gyrus, even though the task was not specifically designed to activate this pathway. Specifically, the IT cortex was activated in both the HC and MCI groups but not in the mild AD group. It can be understood that in terms of ICA-accuracy, the HC and MCI groups could recognize animals much better than the mild AD group.
Another remarkable difference was observed in the activation of the main hubs of the salience network; bilateral insulas and the left ACC were activated in the HC and MCI groups, while this activation was absent in the mild AD group.
In addition to the presence of activation in specific regions in response to images of animal and non-animal, the level of activity also exhibited notable differences among the HC, MCI, and mild AD groups in the temporal cortex. The right fusiform and MT regions exhibited more activation in the HC compared to the MCI group. Specifically, the IT cortex showed no difference between the two groups. We know that object recognition takes place in the IT cortex, so the same level of activity in the IT cortex can explain the similar ICA-accuracy in the HC and MCI groups, but the lower activation in the fusiform and MT gyri in the MCI group perhaps can explain the reason that MCI patients compromised their speed to compensate this lower activation. The left parahippocampus, right fusiform, MT, and specifically the IT cortex, showed more activation in the HC group in comparison to the AD. These findings can explain worse animal categorization in the mild AD group. Additionally, the right parahippocampus, fusiform, and specifically the IT cortex, demonstrated lower activity in the mild AD group in comparison to the MCI. Again, this observation can explain the worse ICA-accuracy and animal categorization in the mild AD group in comparison to the MCI.
Considering the presence of activation or level of activity in response to images of animal versus non-animal, we did not observe any difference in any groups that could explain the difference in the ICA scores between the three groups. We conducted MVPA to search for information that was not discoverable in voxel-wise univariate analysis to understand the mechanism of successful animacy decoding in the healthy control group, and worse categorization in the MCI and mild AD groups.
Multivariate pattern analysis reveals extra information
In an era where precision and individualized medicine are becoming the gold standard, the role of MVPA in neuroimaging studies is more crucial than ever. This advanced technique allows us to capture the complex interplay of brain regions, offering a better understanding of neural mechanisms than traditional methods.
Aside from the novel nature of the ICA test, this was the first study applying MVPA, a method that considers the pattern of activation, not just the level of activation as in traditional univariate analyses. To the best of our knowledge, the few existing visual task-based fMRI studies in MCI and mild AD have applied univariate or functional connectivity methods [37–41], making this study unique in its approach to high-level visual processing.
Univariate analysis within the HC, MCI, and mild AD groups revealed no difference in brain activation when comparing responses to animal versus non-animal stimuli. However, MVPA in the HC and MCI groups could significantly categorize animacy in high-level visual areas, including the lateral occipital, lingual gyrus, fusiform, and inferior temporal gyrus. Additionally, MVPA identified regions that could discriminate between groups, termed subject-wise classification. Specifically, the left temporal fusiform cortex, both in its anterior and posterior divisions, and the right insula could distinguish HC individuals from those with MCI. Furthermore, the left temporooccipital part of the IT cortex and the left angular gyrus were found to discriminate individuals with MCI from mild AD.
By considering the complex patterns of brain activation through MVPA, our study has unveiled additional layers of information, enhancing our understanding of the underlying neural processes and contributing to the advancement of cognitive assessment in AD.
Future directions
As we look ahead, several avenues for future research emerge that could address the limitations of the current study and extend our understanding of AD and MCI.
While our study provides valuable insights, the modest sample sizes for the MCI and AD groups limit the generalizability of our findings. Future studies should aim for larger sample sizes to ensure more representative results.
Our study was cross-sectional, preventing us from drawing conclusions about the progression from MCI to AD. Longitudinal studies are essential for capturing the temporal dynamics of disease progression and could offer more definitive insights into the transition from MCI to AD.
Incorporating additional biomarkers such as genetic or metabolic markers could provide a more comprehensive understanding of AD and MCI, enriching the dataset and potentially revealing new avenues for diagnosis ortreatment.
Additionally, methodological refinements are warranted. While our approach is supported by existing literature, especially in the context of individual variability, we recognize the value of cross-subject validation. Future studies should consider incorporating such techniques to enhance the robustness and validity of the findings.
Lastly, as research in this domain progresses, multi-center studies could prove invaluable. Collaborative research efforts can help in gathering a more diverse and larger sample, thereby enhancing the generalizability of the findings.
By addressing these areas, we believe that future research could move us closer to clinical applications, whether that be in early diagnosis, treatment strategies, or understanding the underlying mechanisms of the disease.
ACKNOWLEDGMENTS
We thank the National Brain Mapping Laboratory, where all the fMRI data acquisitions were done.
FUNDING
This work was partly supported by the Iranian Cognitive Sciences, and Technologies Council’s (COGC) grant (#4873) awarded to SKR. The funders did not have any role in the study design, data collection, analysis, decision to publish, or preparation of the manuscript. SKR and CK are shareholders of Cognetivity ltd.
CONFLICT OF INTEREST
SKR and CK are shareholders of Cognetivity ltd. MHM was Cognetivity’s employee. Other authors declared no conflict of interest.
DATA AVAILABILITY
De-identified raw data are available upon reasonable request from the corresponding authors for the purposes of replicating procedures and results.
SUPPLEMENTARY MATERIAL
[1] The supplementary material is available in the electronic version of this article: https://dx.doi.org/10.3233/ADR-230132.
REFERENCES
[1] | Murphy C ((2019) ) Olfactory and other sensory impairments in Alzheimer disease. Nat Rev Neurol 15: , 11–24. |
[2] | Albers MW , Gilmore GC , Kaye J , Murphy C , Wingfield A , Bennett DA , Boxer AL , Buchman AS , Cruickshanks KJ , Devanand DP , Duffy CJ , Gall CM , Gates GA , Granholm AC , Hensch T , Holtzer R , Hyman BT , Lin FR , McKee AC , Morris JC , Petersen RC , Silbert LC , Struble RG , Trojanowski JQ , Verghese J , Wilson DA , Xu S , Zhang LI ((2015) ) At the interface of sensory and motor dysfunctions and Alzheimer’s disease. Alzheimers Dement 11: , 70–98. |
[3] | Daulatzai MA ((2016) ) Dysfunctional sensory modalities, locus coeruleus, and basal forebrain: Early determinants that promote neuropathogenesis of cognitive and memory decline and Alzheimer’s disease. Neurotox Res 30: , 295–337. |
[4] | Lewis DA , Campbell MJ , Terry RD , Morrison JH ((1987) ) Laminar and regional distributions of neurofibrillary tangles and neuritic plaques in Alzheimer’s disease: A quantitative study of visual and auditory cortices. J Neurosci 7: , 1799–1808. |
[5] | Jackson GR , Owsley C ((2003) ) Visual dysfunction, neurodegenerative diseases, and aging. Neurol Clin 21: , 709–728. |
[6] | Bouras C , Hof PR , Giannakopoulos P , Michel JP , Morrison JH ((1994) ) Regional distribution of neurofibrillary tangles and senile plaques in the cerebral cortex of elderly patients: A quantitative evaluation of a one-year autopsy population from a geriatric hospital. Cereb Cortex 4: , 138–150. |
[7] | Arnold SE , Hyman BT , Flory J , Damasio AR , Van Hoesen GW ((1991) ) The topographical and neuroanatomical distribution of neurofibrillary tangles and neuritic plaques in the cerebral cortex of patients with Alzheimer’s disease. Cereb Cortex 1: , 103–116. |
[8] | van Rhijn SJ , Glosser G , de Vries JJ , Clark CM , Newberg AB , Alavi A ((2004) ) Visual processing impairments and decrements in regional brain activity in Alzheimer’s disease. J Clin Exp Neuropsychol 26: , 11–23. |
[9] | Nissen MJ , Corkin S , Buonanno FS , Growdon JH , Wray SH , Bauer J ((1985) ) Spatial vision in Alzheimer’s disease. General findings and a case report. Arch Neurol 42: , 667–671. |
[10] | Mendez MF , Mendez MA , Martin R , Smyth KA , Whitehouse PJ ((1990) ) Complex visual disturbances in Alzheimer’s disease. Neurology 40: , 439–443. |
[11] | Kirby E , Bandelow S , Hogervorst E ((2010) ) Visual impairment in Alzheimer’s disease: A critical review. J Alzheimers Dis 21: , 15–34. |
[12] | Boucart M , Calais G , Lenoble Q , Moroni C , Pasquier F ((2014) ) Differential processing of natural scenes in posterior cortical atrophy and in Alzheimer’s disease, as measured with a saccade choice task. Front Integr Neurosci 8: , 60. |
[13] | Boucart M , Bubbico G , Szaffarczyk S , Pasquier F ((2014) ) Animal spotting in Alzheimer’s disease: An eye tracking study of object categorization. J Alzheimers Dis 39: , 181–189. |
[14] | Owsley C ((2013) ) Visual processing speed. Vision Res 90: , 52–56. |
[15] | Salthouse TA ((2000) ) Aging and measures of processing speed. Biol Psychol 54: , 35–54. |
[16] | Salthouse TA ((1996) ) The processing-speed theory of adult age differences in cognition. Psychol Rev 103: , 403–428. |
[17] | Birren JE , Fisher LM ((1995) ) Aging and speed of behavior: Possible consequences for psychological functioning. Annu Rev Psychol 46: , 329–353. |
[18] | Birren JE , Fisher LM ((1991) ) Aging and slowing of behavior: Consequences for cognition and survival. Nebr Symp Motiv 39: , 1–37. |
[19] | Nestor PG , Parasuraman R , Haxby JV ((1991) ) Speed of information processing and attention in early Alzheimer’s dementia. Dev Neuropsychol 7: , 243–256. |
[20] | Tales A , Muir J , Jones R , Bayer A , Snowden RJ ((2004) ) The effects of saliency and task difficulty on visual search performance in ageing and Alzheimer’s disease. Neuropsychologia 42: , 335–345. |
[21] | Tales A , Haworth J , Nelson S , Snowden RJ , Wilcock G ((2005) ) Abnormal visual search in mild cognitive impairment and Alzheimer’s disease. Neurocase 11: , 80–84. |
[22] | Warkentin S , Erikson C , Janciauskiene S ((2008) ) rCBF pathology in Alzheimer’s disease is associated with slow processing speed. Neuropsychologia 46: , 1193–1200. |
[23] | Haworth J , Phillips M , Newson M , Rogers PJ , Torrens-Burton A , Tales A ((2016) ) Measuring information processing speed in mild cognitive impairment: Clinical versus research dichotomy. J Alzheimers Dis 51: , 263–275. |
[24] | Wadley VG , Bull TP , Zhang Y , Barba C , Bryan RN , Crowe M , Desiderio L , Deutsch G , Erus G , Geldmacher DS , Go R , Lassen-Greene CL , Mamaeva OA , Marson DC , McLaughlin M , Nasrallah IM , Owsley C , Passler J , Perry RT , Pilonieta G , Steward KA , Kennedy RE ((2021) ) Cognitive processing speed is strongly related to driving skills, financial abilities, and other instrumental activities of daily living in persons with mild cognitive impairment and mild dementia. J Gerontol A Biol Sci Med Sci 76: , 1829–1838. |
[25] | Lassen-Greene CL , Steward K , Okonkwo O , Porter E , Crowe M , Vance DE , Griffith HR , Ball K , Marson DC , Wadley VG ((2017) ) Mild cognitive impairment and changes in everyday function over time: The importance of evaluating both speed and accuracy. J Geriatr Psychiatry Neurol 30: , 220–227. |
[26] | Agosta F , Pievani M , Geroldi C , Copetti M , Frisoni GB , Filippi M ((2012) ) Resting state fMRI in Alzheimer’s disease: Beyond the default mode network. Neurobiol Aging 33: , 1564–1578. |
[27] | Vemuri P , Jones DT , Jack CR Jr. ((2012) ) Resting state functional MRI in Alzheimer’s disease. Alzheimers Res Ther 4: , 2. |
[28] | Damoiseaux JS ((2012) ) Resting-state fMRI as a biomarker for Alzheimer’s disease? Alzheimers Res Ther 4: , 8. |
[29] | Zhou J , Seeley WW ((2014) ) Network dysfunction in Alzheimer’s disease and frontotemporal dementia: Implications for psychiatry. Biol Psychiatry 75: , 565–573. |
[30] | Seeley WW , Crawford RK , Zhou J , Miller BL , Greicius MD ((2009) ) Neurodegenerative diseases target large-scale human brain networks. Neuron 62: , 42–52. |
[31] | Zhou J , Greicius MD , Gennatas ED , Growdon ME , Jang JY , Rabinovici GD , Kramer JH , Weiner M , Miller BL , Seeley WW ((2010) ) Divergent network connectivity changes in behavioural variant frontotemporal dementia and Alzheimer’s disease. Brain 133: , 1352–1367. |
[32] | Golby A , Silverberg G , Race E , Gabrieli S , O’Shea J , Knierim K , Stebbins G , Gabrieli J ((2005) ) Memory encoding in Alzheimer’s disease: An fMRI study of explicit and implicit memory. Brain 128: , 773–787. |
[33] | Machulda MM , Ward HA , Borowski B , Gunter JL , Cha RH , O’Brien PC , Petersen RC , Boeve BF , Knopman D , Tang-Wai DF , Ivnik RJ , Smith GE , Tangalos EG , Jack CR Jr ((2003) ) Comparison of memory fMRI response among normal, MCI, and Alzheimer’s patients. Neurology 61: , 500–506. |
[34] | Rombouts SA , Barkhof F , Veltman DJ , Machielsen WC , Witter MP , Bierlaagh MA , Lazeron RH , Valk J , Scheltens P ((2000) ) Functional MR imaging in Alzheimer’s disease during memory encoding. AJNR Am J Neuroradiol 21: , 1869–1875. |
[35] | Sperling R ((2007) ) Functional MRI studies of associative encoding in normal aging, mild cognitive impairment, and Alzheimer’s disease. Ann N Y Acad Sci 1097: , 146–155. |
[36] | Sperling RA , Bates JF , Chua EF , Cocchiarella AJ , Rentz DM , Rosen BR , Schacter DL , Albert MS ((2003) ) fMRI studies of associative encoding in young and elderly controls and mild Alzheimer’s disease. J Neurol Neurosurg Psychiatry 74: , 44–50. |
[37] | Teipel SJ , Bokde AL , Born C , Meindl T , Reiser M , Möller HJ , Hampel H ((2007) ) Morphological substrate of face matching in healthy ageing and mild cognitive impairment: A combined MRI-fMRI study. Brain 130: , 1745–1758. |
[38] | Bokde AL , Lopez-Bayo P , Meindl T , Pechler S , Born C , Faltraco F , Teipel SJ , Möller HJ , Hampel H ((2006) ) Functional connectivity of the fusiform gyrus during a face-matching task in subjects with mild cognitive impairment. Brain 129: , 1113–1124. |
[39] | Sauer J , ffytche DH , Ballard C , Brown RG , Howard R ((2006) ) Differences between Alzheimer’s disease and dementia with Lewy bodies: An fMRI study of task-related brain activity. Brain 129: , 1780–1788. |
[40] | Huang J , Beach P , Bozoki A , Zhu DC ((2021) ) Alzheimer’s disease progressively reduces visual functional network connectivity. J Alzheimers Dis Rep 5: , 549–562. |
[41] | Huang J , Beach P , Bozoki A , Zhu DC ((2020) ) Alzheimer’s disease progressively alters the face-evoked visual-processing network. J Alzheimers Dis 77: , 1025–1042. |
[42] | Khaligh-Razavi S-M , Habibi S , Sadeghi M , Marefat H , Khanbagi M , Nabavi SM , Sadeghi E , Kalafatis C ((2019) ) Integrated cognitive assessment: Speed and accuracy of visual processing as a reliable proxy to cognitive performance. Sci Rep 9: , 1102. |
[43] | Khaligh-Razavi S-M , Habibi S ((2013) ) System for assessing mental health disorder. UK Intellectual Property Office, GB201319619D0. |
[44] | Kalafatis C , Modarres MH , Apostolou P , Marefat H , Khanbagi M , Karimi H , Vahabi Z , Aarsland D , Khaligh-Razavi SM ((2021) ) Validity and cultural generalisability of a 5-minute AI-based, computerised cognitive assessment in mild cognitive impairment and Alzheimer’s dementia. Front Psychiatry 12: , 706695. |
[45] | Karimi H , Marefat H , Khanbagi M , Kalafatis C , Modarres MH , Vahabi Z , Khaligh-Razavi SM ((2022) ) Temporal dynamics of animacy categorization in the brain of patients with mild cognitive impairment. PLoS One 17: , e0264058. |
[46] | Karimi H , Marefat H , Khanbagi M , Kalafatis C , Vahabi Z , Razavi S-MK ((2020) ) Electroencephalography (EEG) reveals a decrease in speed of animacy processing in mild cognitive impairment and an alteration in neural response patterns. Alzheimers Dement 16: , e043571. |
[47] | Haxby JV , Gobbini MI , Furey ML , Ishai A , Schouten JL , Pietrini P ((2001) ) Distributed and overlapping representations of faces and objects in ventral temporal cortex. Science 293: , 2425–2430. |
[48] | Cox DD , Savoy RL ((2003) ) Functional magnetic resonance imaging (fMRI) “brain reading”: Detecting and classifying distributed patterns of fMRI activity in human visual cortex. Neuroimage 19: , 261–270. |
[49] | Haynes J-D , Rees G ((2005) ) Predicting the orientation of invisible stimuli from activity in human primary visual cortex. Nat Neurosci 8: , 686–691. |
[50] | Kamitani Y , Tong F ((2005) ) Decoding the visual and subjective contents of the human brain. Nat Neurosci 8: , 679–685. |
[51] | McKhann GM , Knopman DS , Chertkow H , Hyman BT , Jack CR Jr. , Kawas CH , Klunk WE , Koroshetz WJ , Manly JJ , Mayeux R , Mohs RC , Morris JC , Rossor MN , Scheltens P , Carrillo MC , Thies B , Weintraub S , Phelps CH ((2011) ) The diagnosis of dementia due to Alzheimer’s disease: Recommendations from the National Institute on Aging-Alzheimer’s Association workgroups on diagnostic guidelines for Alzheimer’s disease. Alzheimers Dement 7: , 263–269. |
[52] | Albert MS , DeKosky ST , Dickson D , Dubois B , Feldman HH , Fox NC , Gamst A , Holtzman DM , Jagust WJ , Petersen RC , Snyder PJ , Carrillo MC , Thies B , Phelps CH ((2011) ) The diagnosis of mild cognitive impairment due to Alzheimer’s disease: Recommendations from the National Institute on Aging-Alzheimer’s Association workgroups on diagnostic guidelines for Alzheimer’s disease. Alzheimers Dement 7: , 270–279. |
[53] | Nasreddine ZS , Phillips NA , Bédirian V , Charbonneau S , Whitehead V , Collin I , Cummings JL , Chertkow H ((2005) ) The Montreal Cognitive Assessment, MoCA: A brief screening tool for mild cognitive impairment. J Am Geriatr Soc 53: , 695–699. |
[54] | Rashedi V , Foroughan M , Chehrehnegar N ((2021) ) Psychometric properties of the Persian Montreal Cognitive Assessment in mild cognitive impairment and Alzheimer disease. Dement Geriatr Cogn Dis Extra 11: , 51–57. |
[55] | Mathuranath PS , Nestor PJ , Berrios GE , Rakowicz W , Hodges JR ((2000) ) A brief cognitive test battery to differentiate Alzheimer’s disease and frontotemporal dementia. Neurology 55: , 1613–1620. |
[56] | Mioshi E , Dawson K , Mitchell J , Arnold R , Hodges JR ((2006) ) The Addenbrooke’s Cognitive Examination Revised (ACE-R): A brief cognitive test battery for dementia screening. Int J Geriatr Psychiatry 21: , 1078–1085. |
[57] | Pouretemad HR , Khatibi A , Ganjavi A , Shams J , Zarei M ((2009) ) Validation of Addenbrooke’s cognitive examination (ACE) in a Persian-speaking population. Dement Geriatr Cogn Disord 28: , 343–347. |
[58] | Folstein MF , Folstein SE , McHugh PR ((1975) ) “Mini-mental state”. A practical method for grading the cognitive state of patients for the clinician. J Psychiatr Res 12: , 189–198. |
[59] | Ansari NN , Naghdi S , Hasson S , Valizadeh L , Jalaie S ((2010) ) Validation of a Mini-Mental State Examination (MMSE) for the Persian population: A pilot study. Appl Neuropsychol 17: , 190–195. |
[60] | Yesavage JA , Brink TL , Rose TL , Lum O , Huang V , Adey M , Leirer VO ((1982) ) Development and validation of a geriatric depression screening scale: A preliminary report. J Psychiatr Res 17: , 37–49. |
[61] | Malakouti SK , Fatollahi P , Mirabzadeh A , Salavati M , Zandi T ((2006) ) Reliability, validity and factor structure of the GDS-15 in Iranian elderly. Int J Geriatr Psychiatry 21: , 588–593. |
[62] | Cummings JL , Mega M , Gray K , Rosenberg-Thompson S , Carusi DA , Gornbein J ((1994) ) The Neuropsychiatric Inventory: Comprehensive assessment of psychopathology in dementia. Neurology 44: , 2308–2314. |
[63] | Kaufer DI , Cummings JL , Ketchel P , Smith V , MacMillan A , Shelley T , Lopez OL , DeKosky ST ((2000) ) Validation of the NPI-Q, a brief clinical form of the Neuropsychiatric Inventory. J Neuropsychiatry Clin Neurosci 12: , 233–239. |
[64] | Malakouti SK , Panaghi L , Foroughan M , Salehi M , Zandi T ((2012) ) Farsi version of the Neuropsychiatric Inventory: Validity and reliability study among Iranian elderly with dementia. Int Psychogeriatr 24: , 223–230. |
[65] | Bucks RS , Ashworth DL , Wilcock GK , Siegfried K ((1996) ) Assessment of activities of daily living in dementia: Development of the Bristol Activities of Daily Living Scale. Age Ageing 25: , 113–120. |
[66] | Kalafatis C , Modarres MH , Marefat H , Khanbagi M , Karimi H , Vahabi Z , Khaligh Razavi S-M ((2019) ) P4-207: Employing artificial intelligence in the development of a self-administered, computerised cognitive assessment for the assessment of neurodegeneration. Alzheimers Dement 15: , P1355–P1356. |
[67] | Kriegeskorte N , Mur M , Ruff DA , Kiani R , Bodurka J , Esteky H , Tanaka K , Bandettini PA ((2008) ) Matching categorical object representations in inferior temporal cortex of man and monkey. Neuron 60: , 1126–1141. |
[68] | Grill-Spector K , Weiner KS ((2014) ) The functional architecture of the ventral temporal cortex and its role in categorization. Nat Rev Neurosci 15: , 536–548. |
[69] | Khaligh-Razavi SM , Cichy RM , Pantazis D , Oliva A ((2018) ) Tracking the spatiotemporal neural dynamics of real-world object size and animacy in the human brain. J Cogn Neurosci 30: , 1559–1576. |
[70] | Braak H , Alafuzoff I , Arzberger T , Kretzschmar H , Del Tredici K ((2006) ) Staging of Alzheimer disease-associated neurofibrillary pathology using paraffin sections and immunocytochemistry. Acta Neuropathol 112: , 389–404. |
[71] | Wei P , Bao R , Fan Y ((2022) ) Independence of functional connectivity analysis in fMRI research does not rely on whether seeds are exogenous or endogenous. Med Nov Technol Devices 15: , 100126. |
[72] | Kriegeskorte N , Simmons WK , Bellgowan PS , Baker CI ((2009) ) Circular analysis in systems neuroscience: The dangers of double dipping. Nat Neurosci 12: , 535–540. |
[73] | Menon V , Uddin LQ ((2010) ) Saliency, switching, attention and control: A network model of insula function. Brain Struct Funct 214: , 655–667. |


