
Alpha 2-Macroglobulin Polymorphisms and Susceptibility to Alzheimer’s Disease: A Comprehensive Meta-Analysis Based on 62 Studies
Abstract
Background:
The relationship between alpha 2-macroglobulin (A2M) gene and Alzheimer’s disease (AD) has been widely studied across populations; however, the results are inconsistent.
Objective:
This study aimed to evaluate the association of A2M gene with AD by the application of meta-analysis.
Methods:
Relevant studies were identified by comprehensive searches. The quality of each study was assessed using the Newcastle-Ottawa Scale. Allele and genotype frequencies were extracted from each of the included studies. Odds ratio (OR) with corresponding 95% confidence intervals (CI) was calculated using a random-effects or fixed-effects model. The Cochran Q statistic and I2 metric was used to evaluate heterogeneity, and Egger’s test and Funnel plot were used to assess publication bias.
Results:
A total of 62 studies were identified and included in the current meta-analysis. The G allele of rs226380 reduced AD risk (OR: 0.64, 95% CI: 0.47–0.87, pFDR = 0.012), but carrier with the TT genotype was more likely to develop AD in Asian populations (OR: 1.56, 95% CI: 1.12–2.19, pFDR = 0.0135). The V allele of the A2M-I/V (rs669) increased susceptibility to AD in female population (OR, 95% CI: 2.15, 1.38–3.35, pFDR = 0.0024); however, the II genotype could be a protective factor in these populations (OR, 95% CI: 0.43, 0.26–0.73, pFDR = 0.003). Sensitivity analyses confirmed the reliability of the original results.
Conclusions:
Existing evidence indicate that A2M single nucleotide polymorphisms (SNPs) may be associated with AD risk in sub-populations. Future studies with larger sample sizes will be necessary to confirm the results.
INTRODUCTION
With the extension of human life expectancy, the prevalence of dementia in the global aging population is increasing. The World Health Organization estimates that approximately 55 million people worldwide have dementia, of which 40 million are believed to suffer from Alzheimer’s disease (AD) [1]. It is estimated that the total spending on long-term care, health care, and hospice services for people aged 65 and older with dementia will be around $345 billion in 2023 [2]. In China, the number of dementia patients accounts for approximately 25% of all dementia worldwide, and the annual total expenditure related to dementia was $248.71 billion in 2020, showing an increasing trend year by year. It is expected to reach $1.89 trillion by 2050 [3].
AD has become a major threat to the growing elderly population due to the lack of effective therapies. Therefore, it is urgent to study the etiology of AD and implement effective prevention and treatment. AD is a complex, heterogeneous polygenic disorder primarily related to environmental and genetic factors, and its risk increases with genetic variation, age, and family history [1]. Presumably, genetic risk factors contribute to approximately over 70% of the incidence of AD, so that the identification of genetic risk factors enables us to understand the disease mechanism in a sensible way. Dozens of genetic variants have been implicated in AD risk through large-scale genome-wide association study, such as presenilin 1, presenilin 2, amyloid-β protein precursor, and apolipoprotein E ɛ4 (APOE ɛ4) [4]. However, the precise mechanistic effects of most of these variants have yet to be determined. It is still necessary to explore other genetic variations in AD.
Alpha 2-macroglobulin (A2M) is a high molecular weight glycoprotein rich in plasma, which has a broad spectrum of protease inhibition and is also an acute phase reactive protein for the inflammatory immune response in brain tissue. Previous studies have found that A2M also plays an essential role in certain central nervous system diseases, especially neurodegenerative diseases, including AD [5]. There is evidence that A2M is a highly plausible candidate gene for AD [6]. However, the inconsistent conclusion of A2M gene polymorphisms with susceptibility to AD in previous studies can be attributed to limitations such as small sample sizes, ethnic differences, or methodological differences. Meta-analysis is often used to detect and validate minimal biological effects in genetic association studies of complex diseases [7]. There have also been meta-analyses on the relationship of several polymorphisms in A2M gene and AD, including I/V (rs669) and I/D (rs3832852/rs1799759) [8–10]. However, these meta-analyses did not include all the original studies [8, 9], were short of detailed analysis of AD subgroups [8–10], and did not exclude the control population deviating from Hardy-Weinberg equilibrium (HWE) [9]. Moreover, the results from these meta-analyses [8–10] are inconsistent. In addition, the latest meta-analysis was published in 2014 [10], and the new A2M and AD-related studies have been published in recent ten years.
Therefore, we performed the present meta-analysis with increased statistical power using a well-established method to assess the association between genetic mutation in A2M gene and AD through incorporating all available published data.
MATERIALS AND METHODS
Search strategy and data collection
Until August 31, 2023, all studies on the relationship between A2M gene polymorphisms and AD were independently identified by three investigators (Zhang HW, Liu D, and Duan YY) by searching the following databases: PubMed (from 1966), EMBASE (from 1966), the Cochrane Library (August 2023), Web of Science (from 1990), ProQuest Dissertations & Theses Database (from 1980), China National Knowledge Infrastructure (from 1994,) and Wanfang Database (from 1990) (including journal articles, dissertations or theses, and conferences literature). The following keywords were used in our search strategies: “Alzheimer” or “dementia” and “alpha 2 macroglobulin” or “A2M”. This search was limited to human studies.
There were no language restrictions when searching English databases, and equivalent Chinese terms were used when searching Chinese databases. We furthermore searched for possible eligible studies in the references within the retrieved articles, as well as in review articles and abstracts from recent conferences. When the same or similar patient cohort was included in multiple publications, only the most recent or more complete reports with more comprehensive subgroups were selected for further analysis. The control group came from an unrestricted source and could have come from the general population or hospital or clinic participants without suffering from the disease of interest. In addition, to more thoroughly analyze the association of A2M gene with AD, we included studies in which the control group was not in HWE. However, sensitivity analyses will be performed after excluding these studies.
Studies were included for the meta-analysis if they fulfilled the following criteria: 1) the association between A2M gene variants and AD was examined by using a population-based, case-control, or cohort designs; 2) diagnostic criteria for AD have been widely accepted worldwide; 3) control subjects were unrelated individuals, with no symptoms of dementia-related diseases confirmed by researchers after physical examination, medical history evaluation, and diagnostic tests; 4) The A2M variants frequency was investigated using the validated genotyping method, and the genotype or allele frequencies of cases and controls were reported or can be obtained through calculating; 5) the variants of A2M gene had been reported in at least two studies [11].
Data extraction
Data were carefully extracted from all eligible studies, and any disagreements were resolved through discussion. The following information was extracted from each study: first author, date of publication, country of origin of the study, ethnicity of the participants, the total number of participants, definitions and characteristics of cases and controls, genetic variants involved, genotyping methods, distribution of genotypes and alleles. We calculate the genotype frequency whenever possible. For those studies that included participants of different ethnicities, data were extracted separately for each ethnicity. If some of the above information is unavailable, we will contact the corresponding author for further information.
Data analysis and statistical methods
The quality of the included studies was assessed using the Newcastle-Ottawa Scale (NOS). The scores range from 0 (the worst) to 9 (the best), and studies with a NOS score of 7 or above were considered to be of high quality [12].
We used the Cochrane Review Manager (version 5.3) and Stata (version: Stata/MP 14.2) software to assess the association of different A2M gene polymorphisms with AD risk. Odds ratios (OR) and corresponding 95% confidence intervals (CI) were calculated using fixed-effect and random-effects models. A chi-square test based on the Cochran Q statistic was used to evaluate the heterogeneity between studies (p-values < 0.10 considered statistically significant), and the I2 index was used to quantify the heterogeneity. When there was heterogeneity between studies, a random-effects model was used to estimate pooled OR, as the model assumed true diversity in study results. The chi-square test was used to verify the effect of HWE. We used allele, dominant, and recessive models for the meta-analysis. Such as one single nucleotide polymorphism (SNP) usually has two alleles, including A (major allele) and a (minor allele). The three models can be described as follows: the allelic comparison (a allele versus A allele), the dominant model (AA versus aa + aA), and the recessive model (aa versus aA + AA) [13]. Multiple testing correction was conducted using the false discovery rate (FDR) method proposed by Benjamini and Hochberg. Funnel plots were used to investigate potential publication bias in analyses involving different genetic variations, and the asymmetries were considered if the Egger’s test has a p < 0.10 [12].
Sub-population analyses were conducted for ethnicity [14], and subgroup analyses for AD subtype, AD samples source, family history, or sex were also performed. Sensitivity analyses were performed after excluding specific studies, such as studies in which populations in the control group did not conform to HWE distribution, studies with poor quality (NOS < 7), studies with 0 genotype distribution in each study group, as well as studies with mixed data (from neuropathological and clinical diagnosis). A probability value of p < 0.05 (two-tailed) was considered significant unless indicated otherwise.
RESULTS
Included studies and study characteristics
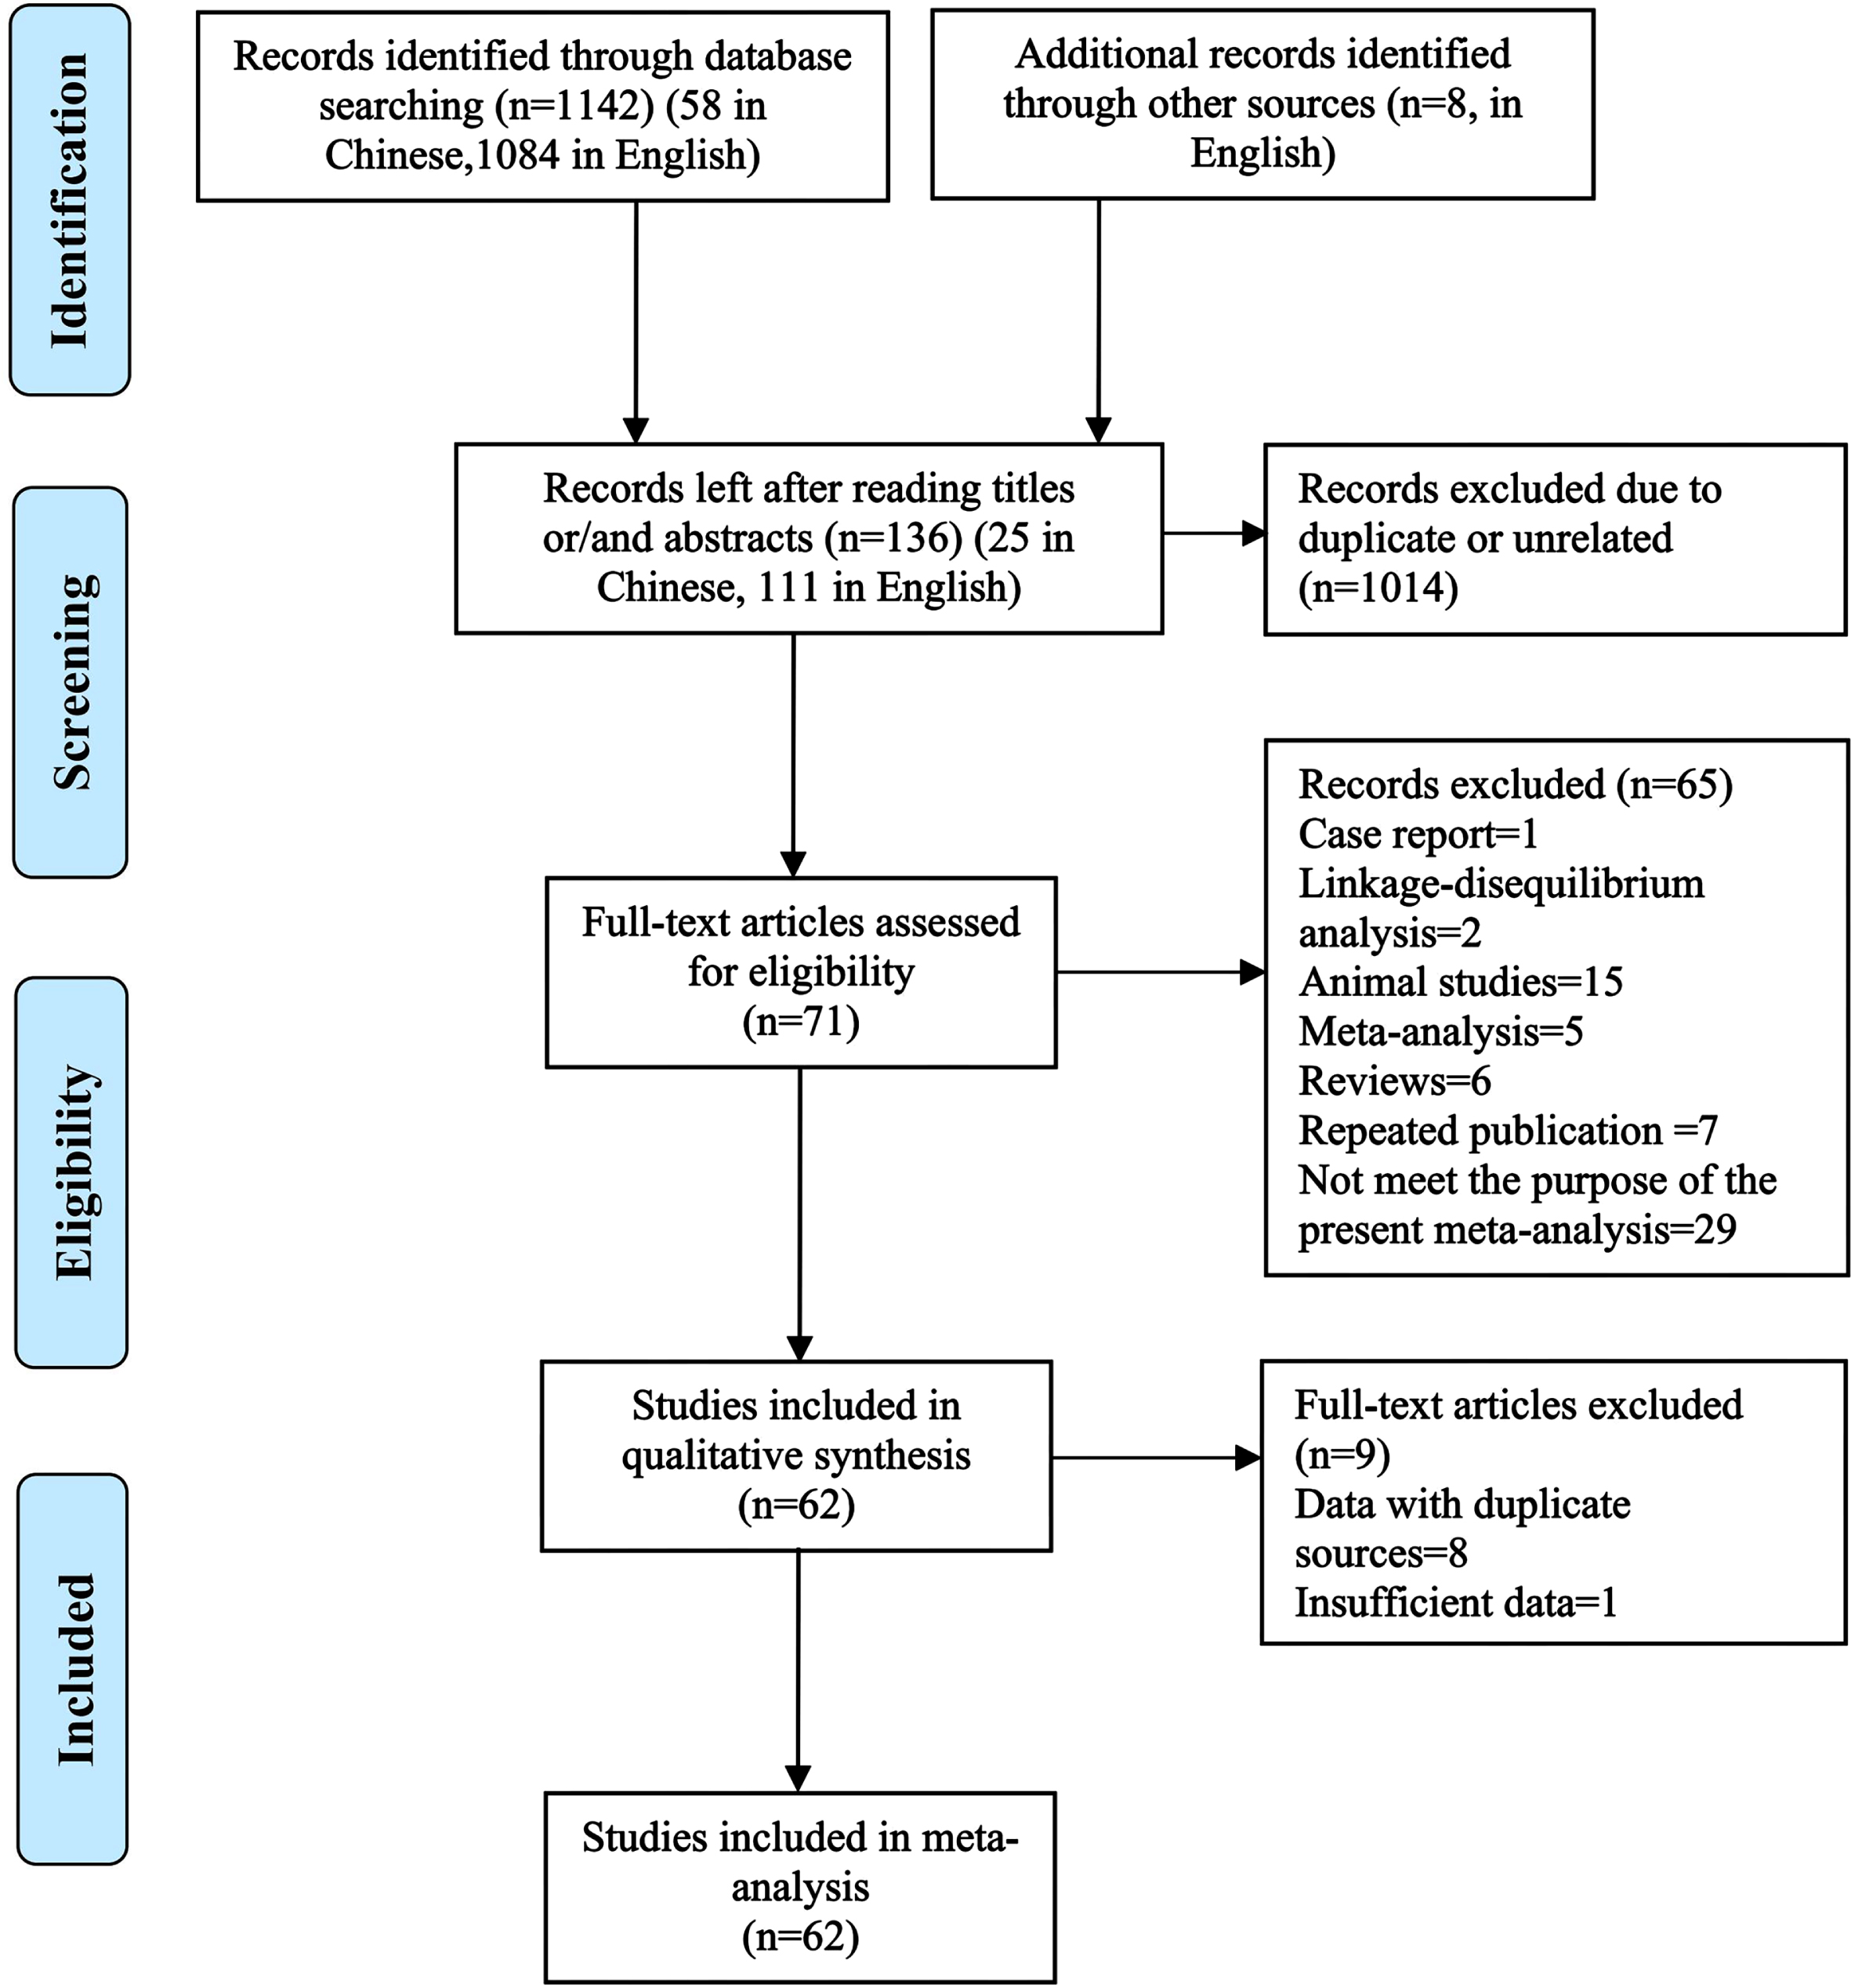
The search results showed that there were 58 items in Chinese database, including 24 in China National Knowledge Infrastructure and 34 in Wanfang Database, and 1,084 items from the English database, including 217 in Pubmed, 435 in Embase, 2 in the Cochrane Library, 416 in Web of science as well as 14 in ProQuest Dissertations & Theses Database. At the same time, eight items were screened out of the reference lists of the meta-analysis articles retrieved above. So, the total of 1,150 items were retrieved. Initially, 820 records (27 in Chinese and 793 in English databases) were excluded because of duplicate items included across databases. And then, 194 items (including 6 Chinese and 188 English ones) were excluded after reading the titles and abstracts as they are not relevant to the purpose of this study. At last, 71 potentially relevant articles (12 in Chinese and 59 in English) were initially selected for meta-analyses after reading the full text of these articles according to the inclusion and exclusion criteria. Of which, 62 articles [8, 15–75] were considered to be eligible for the final meta-analysis after removing 9 articles because of their duplicate or insufficient data. The results of the systematic literature search and article selection are summarized in Fig. 1. The excluded articles and the reasons for excluding each article are given (Supplementary Table 1). Of these articles included, 59 were full-text reports published in peer-reviewed journals [8, 15–49, 51–56, 58–60, 62–75] and 3 were doctoral dissertations [50, 57, 61].
Fig. 1
Flowchart of the literature search and article selection for the meta-analysis.
In these included studies, only SNPs variation in A2M is eligible for the meta-analysis. Common methods such as polymerase chain reaction, enzyme digestion, and gel electrophoresis or sequencing were used to identify genotypes of these SNPs. NOS scores of these studies ranged from 4 to 9, suggesting that the methodological quality of most studies was acceptable. The characteristics of studies included and the A2M SNPs involved were summarized in Tables 1 and 2, including the number of studies with different SNPs in A2M gene, the characteristics of AD cases and controls, as well as the number and proportion of studies from the different populations.
Table 1
Characteristics of included studies and A2M polymorphisms for meta-analysis
| First author (Year) | Countries (Populations) | Variants | Samples Selection/Characteristics | NOS Score | HWE | |
| AD Cases | Controls | |||||
| Koster 2000 [8] | Netherland Caucasians | I/V (rs669) I/D (rs3832852) | EOAD, n = 100, age: 57±4.9. F: 77 (77%). LOAD, n = 356, age: 82±7.1, F: 261 (76%). | N = 116. PB, age: 61±3.3. F: 64 (55%). N = 242. PB, age: 81±5.0. F: 145 (60%). | 8 | Y |
| Liao 1998 [15] | America Germany Italy Caucasians | I/V (rs669) | N = 737. No description of age and gender. | N = 449. PB. No description of age and gender. | 8 | N |
| Song 2010 [16] | China Asians | rs226379 rs226380 | N = 179, age of onset: 68.21±6.59. F: 107 (59.8%). | N = 179. PB, age: 67.20±6.58. F: 107 (59.8%). | 8 | Y |
| Millard 2014 [17] | America Mixed populations | rs226379 | N = 99, age: 71±10. F: 45 (45%). 97% Caucasians. | N = 168. age: 67±9. F: 103 (61%). 91% Caucasians. | 7 | Y |
| Wavrant-DeVrièze 1999 [18] | UK America France Caucasians | I/V (rs669) | N = 1,337. SAD, n = 1,200. FAD, n = 137. No description of age and gender. | N = 1531. PB. No description of age and gender. | 5 | Y |
| Dow 1999 [19] | UK Caucasians | I/D (rs3832852) | N = 125. Samples from neuropathological diagnosis. No precise description of age and gender. | N = 218. PB. No description of age and gender exactly. | 8 | Y |
| Rogaeva 1999 [20] | Canada America Caucasians | I/D (rs3832852) | Toronto, n = 207. Duke, n = 185. No description of age and gender. | Toronto, n = 164. Duke, n = 156. PB. No description of age and gender. | 4 | Y |
| Rudrasingham 1999 [21] | France America UK Caucasians | I/D (rs3832852) | UK: Cardiff, n = 152, age of onset: 71.9±8.13. F: 96 (63%). France: Lille, n = 616, age of onset: 69.4±8.6. F: 388 (63%). US: Wash U, n = 143, age of onset: 73.7±9.51. F: 89 (62.4%). US: Mayo, n = 327, age of onset: 75.5±9.7. F: 214 (65.5%). | UK: Cardiff, n = 99, age: 72.6±6.55. F: 53(54%). France: Lille, n = 648, age: 73.1±8.5. F: 408 (63%). US: Wash U, n = 144, age: 77±9.2. F: 94 (65.2%). US: Mayo, n = 487, age: 82.7±7.5. F:327 (67.1%). | 6 | Y |
| Singleton 1999 [22] | UK Caucasians | I/V (rs669) I/D (rs3832852) | N = 213, age: 79.2±0.6. F: 137 (64.32%). | N = 116. HB, age at death: 78.9±10.8. F: 63 (54.31%). | 7 | Y |
| Chen 1999 [23] | China (HK) Asians | I/D (rs3832852) | N = 196, age: 79.5±8.5. F: 146 (74.49%). | N = 180. HB, age: 79.2±7.5. F: 118 (65.56%). | 8 | Y |
| Crawford 1999 [24] | America Mixed populations | I/D (rs3832852) | N = 295. PB, n = 118, age: 74.21±6.65; HB, n = 177, age: 72.20±6.13. F: 166 (56.27%). 97.4% Caucasians. | N = 113. PB, age: 72.73±7.72. F: 70 (61.95%). 74.5% Caucasians. | 8 | Y |
| Hu 1999 [25] | China (Taiwan) Asians | I/D (rs3832852) | N = 65, age: 79.58±6.87. F: 32 (49.23%). | N = 84, age: 76.88±4.77. PB. F: 29 (34.52%). | 9 | N |
| Korovaitseva 1999 [26] | Russia Caucasians | I/D (rs3832852) | N = 146. EOAD, n = 70. LOAD, n = 76. No description of age and gender. | N = 160. HB. No description of age and gender. | 8 | Y |
| Shibata 1999 [27] | Japan Asians | I/D (rs3832852) | N = 55, age: 72.15±9.52. F: 33 (60%). | N = 69. PB, age: 71.00±8.10. F: 29 (42.03%). | 7 | Y |
| Myllykangas 1999 [28] | Finland Caucasians | I/V (rs669) I/D (rs3832852) | LOAD. Subjects from clinical diagnosis, n = 114, age: 89.1±2.7. F: 94 (82.5%). Samples from neuropathological diagnosis, n = 77, age: 89.3±2.7. F: 67 (87.0%). | From clinical diagnosis, n = 204, age: 88.1±2.7. F: 164 (80.4%). From neuropathological diagnosis, n = 52, age: 89.3±3.8. F: 44 (84.6%). | 8 | Y |
| Alvarez 1999 [29] | Spain Caucasians | I/D (rs3832852) | LOAD, n = 190, age: 72±9.14. No description of gender. | N = 400. PB or HB. No description of age and gender. | 8 | Y |
| Yamada 1999 [30] | Japan Asians | I/D (rs3832852) | N = 68. From the autopsy series, age at death: 86.4±7.8. No description of gender. | N = 110. From the autopsy series, age at death: 85.4±7.9. No description of gender. | 8 | Y |
| Blennow 2000 [31] | Sweden Scotland Caucasians | I/D (rs3832852) | Subjects from clinical diagnosis, n = 449, age: 73.1±10.4. F: 277 (61.69%). Samples from neuropathological diagnosis, n = 94, age: 80.1±8.2. F:58 (61.70%). | N = 349, age: 66.7±12.5. F: 153 (43.84%). N = 107, age: 76.6±9.4. F: 50 (46.73%). | 7 | Y |
| Dodel 2000 [32] | America Germany Caucasians | I/D (rs3832852) | IU: n = 83, age: 72.7±9.5. F: 44 (53.01%). MU: n = 75, age: 71.8±10.5. No description of gender. SU: n = 151, age: 74.8±7.6. F: 72 (47.68%). | IU: n = 83. PB, age: 72.9±9.4. F: 43 (51.81%). MU: n = 75. PB, age: 72.7±10.1. F: 45 (60.00%). SU: n = 123. PB, age: 68.2±8.1. F: 83 (60.00%). | 9 | Y |
| Romas 2000 [33] | Dominican Republic America Puerto Rico Caucasians | I/V (rs669) I/D (rs3832852) | FAD, n = 100. age of onset: 74.4±9.5. No description of gender. | Unaffected individuals in family. N = 47. No description of age and gender. | 9 | Y |
| Higuchi 2000 [34] | Japan Mixed populations | I/V (rs669) I/D (rs3832852) | Subjects form Japanese, n = 426, age: 76.2±9.0. F: 309 (72.54%). Samples from neuropathological diagnosis in Caucasians, n = 85, age at death: 77.6±7.3. F: 48 (56.47%). | From Japanese, n = 382, age: 74.0±5.6. F: 265 (69.37%). From Caucasians, n = 65, age: 60.9±14.8. F: 30 (46.15%). | 7 | Y |
| Bullido 2000 [35] | Spain Caucasians | I/D (rs3832852) | LOAD, n = 154, age: 70.4±6.3. F: 92 (59.74%). | N = 217, age: 72±7.6. F: 135 (62.21%). | 7 | Y |
| Shibata 2000 [36] | Japan Asians | I/V (rs669) | N = 111, age: 69.6±10.4. No description of gender. | N = 95. PB, age: 69.8±9.3. No description of gender. | 8 | Y |
| Halimi 2000 [37] | France Caucasians | I/D (rs3832852) | N = 218, age: 76.9±8.3. No description of gender. | N = 84, age: 77.0±7.4. No description of gender. | 7 | Y |
| Zill 2000 [38] | Germany Caucasians | I/V (rs669) I/D (rs3832852) | N = 88, age: 73±9. F: 50 (56.82%). | N = 118. PB, age: 47±12. F: 63 (53.39%). | 8 | Y |
| Bagli 2000 [39] | Germany Caucasians | I/D (rs3832852) | N = 102, age: 74.4±10.3. F: 68 (66.67%). | N = 191. PB, age: 74.4±10.3. F: 99 (51.83%). | 9 | Y |
| Hu 2000 [40] | China (Taiwan) Asians | I/V (rs669) | N = 82, age: 78.2. No description of gender. | N = 110. PB, age: 79.2. No description of gender. | 8 | _a |
| Jhoo 2001 [41] | South Korea Asians | I/D (rs3832852) | N = 100, age: 68.1±8.2. F: 77 (77%). EOAD, n = 38. LOAD, n = 62. | N = 203. PB, age: 69.0±4.7. F: 160 (78.82%). | 8 | Y |
| Nacmias 2001 [42] | Italy Caucasians | I/V (rs669) I/D (rs3832852) | SAD, n = 90, age of onset: 66.7±8.12. LOFAD, n = 40, age: 71.63±4.06. EOFAD, n = 49, age: 57.61±6.78. No description of gender. | From DNA bank of C.N.R. (National Research Council, Florence, Italy). N = 98. Age: 74.5±25.1. No description of gender. | 8 | Y |
| Ki 2001 [43] | South Korea Asians | I/D (rs3832852) | LOAD, n = 89. F: 69 (77.53%). No description of age. | N = 50. PB, age: 73.2±7.8. F: 29 (58%). | 7 | Y |
| Perry 2001 [44] | America Mixed populations | I/D (rs3832852) | N = 111, age: 71.3±7.7. F: 87 (78.38%). 22 with family history-positive. | N = 78, age: 75.2±7.6. F: 59 (75.64%). | 9 | Y |
| Prince 2001 [45] | Sweden Caucasians | I/D (rs3832852) | LOAD, n = 204. F: 125 (61.27%). No description of age. Subjects from clinical diagnosis, n = 111. Samples from neuropathological diagnosis, n = 93. | N = 186. F: 106 (58.06%). No description of age. PB, n = 76. Autopsy cases, n = 108. | 8 | Y |
| Pirskanen 2001 [46] | Finland Caucasians | I/V (rs669) | N = 98, from neuropathological diagnosis, age at death: 82.7±0.9. F: 77 (78.57%). | N = 240. PB, age at death: 71.7±0.7. F: 108 (45%). | 6 | Y |
| McIlroy 2001 [47] | Northern Ireland UK Caucasians | I/V (rs669) I/D (rs3832852) | LOAD, n = 219, age: 77.5±6.0. F: 147 (67.12%). | N = 237. PB, age: 77.2±6.1. F: 166 (70.04%). | 9 | Y |
| Shi 2001 [48] | China Asians | I/D (rs3832852) | LOAD, n = 97, age: 82.5±9.8. F: 65 (67.01%). | N = 111. PB, age: 81.4±9.4. F: 54 (48.65%). | 7 | Y |
| Nicosia 2001 [49] | Italy Caucasians | I/D (rs3832852) | N = 100, age: 79.2±7.3. F: 75 (75%). | N = 49. PB, age: 68.3±9.2. F: 31 (63.27%). | 7 | Y |
| Zimmer 2001 [50] | America Caucasians | I/V (rs669) I/D (rs3832852) | LOAD, n = 604, age: 77.5±6.4. F: 411 (68.1%). 35% from neuropathological diagnosis. | N = 541. PB, age: 75.9±6.3. F: 353 (65.2%). | 7 | Y |
| Janka 2002 [51] | Hungary Caucasians | I/V (rs669) | LOAD, n = 53, age: 73±6.2. F: 36 (67.92%). | N = 51. PB, age: 72±7. F: 37 (72.55%). | 8 | Y |
| Scacchi 2002 [52] | Italy Caucasians | I/D (rs3832852) | LOAD, n = 93, age: 85.8±3.8. F: 71 (76.00%). | N = 157, age: 83.9±3.1. F: 93 (59.24%). | 7 | Y |
| Poduslo 2002 [53] | America Caucasians | I/V (rs669) I/D (rs3832852) | N = 398, age of onset: 69.4±8.5. F: 67%. 137 from neuropathological diagnosis. | N = 216. PB. No description of age and gender. | 7 | Y |
| Zappia 2002 [54] | Italy Caucasians | I/V (rs669) I/D (rs3832852) | N = 132, age: 72.3±6.4. F: 79 (59.85%). EOAD, n = 37. LOAD, n = 95. | N = 184. PB, age: 76.6±7.5. F: 101 (54.89%). | 8 | Y |
| Clarimón 2003 [55] | Spain Caucasians | I/V (rs669) I/D (rs3832852) | N = 112, age: 76.7±5.4. F: 82 (73.21%). | N = 89. PB, age: 74.8±5.2. F: 47 (52.81%). | 8 | Y |
| Styczynska 2003 [56] | Poland Caucasians | I/V (rs669) | N = 100, age: 76.4±4.7. F: 66 (66%). | N = 100. PB, age: 74.24±6.6. F: 58 (58%). | 7 | Y |
| Chen 2003 [57] | China Asians | I/V (rs669) I/D (rs3832852) | N = 160, age of onset: 69.4±9.4. F: 86 (53.75%). | N = 195. PB, age: 69.8±7.8. F: 87 (44.62%). | 9 | Y |
| Zhang 2004 [58] | China Asians | I/D (rs3832852) | LOAD, n = 67, age: 80.0±6.6. F: 40 (59.70%). | N = 142, age: 69.0±9.4. F: 46 (32.39%). | 8 | Y |
| Zhao 2004 [59] | China Asians | I/V (rs669) I/D (rs3832852) | N = 115, age: 76.2±9.1. F: 65 (56.52%). | N = 190. PB, age: 62±11. F: 91 (47.89%). | 7 | For I/V (rs669): Y. For I/D (rs3832852): N |
| Camelo 2004 [60] | Colombia Caucasians | I/D (rs3832852) | N = 83, age: 69±8.9. F: 60 (72.29%). EOAD, n = 28. LOAD, n = 54. SAD, n = 47. FAD, n = 36. | N = 69, age: 71.4±12.3. F: 50 (72.46%). | 7 | Y |
| Shi 2004 [61] | China Asians | I/V (rs669) | N = 257, age: 76.7±8.8. F: 153 (59.53%). | N = 242. PB or HB, age: 80.0±7.6. F: 128 (52.89%). | 8 | Y |
| Sleegers 2004 [62] | The Netherlands Caucasians | I/D (rs3832852) | LOAD, n = 122, age: 82.2±5.3. F: 96 (78.7%). EOAD, n = 17, age: 70.9±5.8. F: 13 (76.5%). | N = 120. PB. No description of age and gender. | 5 | Y |
| Sun 2005 [63] | China Asians | I/V (rs669) | N = 112, age: 81.5±7.8, F: 72 (64.29%). | N = 113. PB or HB, age: 72.0±8.7. F: 62 (54.87%). | 8 | Y |
| Cai 2005 [64] | China Asians | I/D (rs3832852) | N = 116, age: 74.51. F: 72 (62.07%). | N = 271. PB, age: 57.8. F: 153 (56.46%). | 8 | Y |
| Bian 2005 [65] | China Asians | I/V (rs669) rs226379 rs226380 | LOAD, n = 216, age of onset: 74.69. No description of gender. | N = 200. PB, age: 72.02. No description of gender. | 8 | Y |
| Chen 2005 [66] | China Asians | I/D (rs3832852) | N = 81, age≥75. F: 71 (87.65%). | N = 143, age≥75. PB. F: 106 (74.13%). | 8 | Y |
| Depboylu 2006 [67] | Germany Caucasians | I/V (rs669) | N = 271, age: 70.7±9.6. F: 100 (36.90%). | N = 280. PB, age: 66.9±10.6. F: 87 (31.07%). | 7 | Y |
| Mariani 2006 [68] | Italy Caucasians | I/V (rs669) | LOAD, n = 100, age: 76.4±4.7. F: 74 (74%). | N = 136. PB, age: 72.9±7.3. F: 100 (73.53%). | 9 | Y |
| Hong 2008 [69] | China Mixed populations | I/V (rs669) | N = 209, age: 74.2±12.6. F: 131 (62.68%). Han Chinese, n = 98. F: 62 (63.27%). Uyghur population, n = 111. F: 69 (62.16%). | N = 220. PB, age: 73.8±13.1. F: 137 (62.27). Han Chinese, n = 103. F: 65 (63.11%). Uyghur population, n = 117. F: 72 (61.54%). | 9 | N |
| Han 2008 [70] | China Asians | I/V (rs669) | N = 55, age: 75.5±9.13. F: 21 (38.18%). | N = 59. PB, age: 72.3±8.01. F: 24 (40.68%). | 9 | Y |
| Colacicco 2009 [71] | Italy Caucasians | I/V (rs669) | N = 169. F: 107 (63.31%). LOAD, n = 99, age: 76.4±4.46. F: 57 (57.58%). EOAD, n = 70, age: 59.7±6.18. F: 50 (71.43%). | N = 264. PB or HB, age: 71.7±7.09, F: 146 (55.30%). | 9 | Y |
| Bruno 2010 [72] | Italy Caucasians | I/V (rs669) | N = 125, age: 75.4±7.0. F: 69 (55.20%). | N = 310. PB, age: 74.7±6.6. F: 175 (56.45%). | 9 | Y |
| Yuan 2013 [73] | China Asians | I/V (rs669) | N = 364, age: 74.9±8.5. F: 208 (57.14%). | N = 291. HB, age: 73.7±7.3. F: 175 (60.14%). | 8 | Y |
| Michałowska-Wender 2014 [74] | Poland Caucasians | I/V (rs669) I/D (rs3832852) | N = 50. F: 38 (76%). LOAD, n = 35. EOAD, n = 15. No description of age. | N = 50. HB. F: 36 (72%). No description of age. | 8 | For I/D (rs3832852): Y. For I/V (rs669): N |
| Zamani 2016 [75] | Iran Caucasians | I/V (rs669) | LOAD, n = 150, age: 77.73±7.6. No description of gender. | N = 150. PB. No description of age and gender. | 9 | N |
AD, Alzheimer’s disease; EOAD, early-onset AD; LOAD, late-onset AD; HWE, Hardy-Weinberg equilibrium; Y, the controls being HWE; N, the controls being not HWE; NOS, Newcastle-Ottawa Scale; PB, population-based; HB, hospital-based; F, female; IU, Indiana University Medical School, Indianapolis, Indiana; MU, Technische Universität, München, Germany; SU, Stanford University Medical Center, Stanford, California; SAD, sporadic AD; FAD, familial AD; EOFAD, early-onset FAD; LOFAD, late-onset FAD; aThe HWE analysis is not performed due to only allele frequencies.
Table 2
A2M SNPs included in the meta-analysis
| SNPs | Studies (n) | Cases (n) | Controls (n) | Composition of studies n (%) | ||
| Asians | Caucasians | Mixed populations | ||||
| I/D (rs3832852) | 42 | 8,804 | 8,820 | 12 (28.57%) | 27 (64.29%) | 3 (7.14%) |
| I/V (rs669) | 33 | 7,919 | 7,789 | 9 (27.27%) | 22 (66.67%) | 2 (6.06%) |
| rs226379 | 3 | 494 | 547 | 2 (66.67%) | 0 | 1 (33.33%) |
| rs226380 | 2 | 395 | 379 | 2 (100.00%) | 0 | 0 |
Relationship between A2M-I/D polymorphism and AD
The pooled results showed that there was no significant association of this SNP with AD in three genetic comparisons in combined population, sub-populations, or AD subtypes (Fig. 2, Table 3).
Fig. 2
Forest plot of A2M-I/D allele frequency (D versus I) and AD susceptibility in combined population. Horizontal lines are 95% confidence intervals (CI). The contrast has an OR of 0.99 (95% CI: 0.91–1.08, p = 0.89) in the random-effects model.
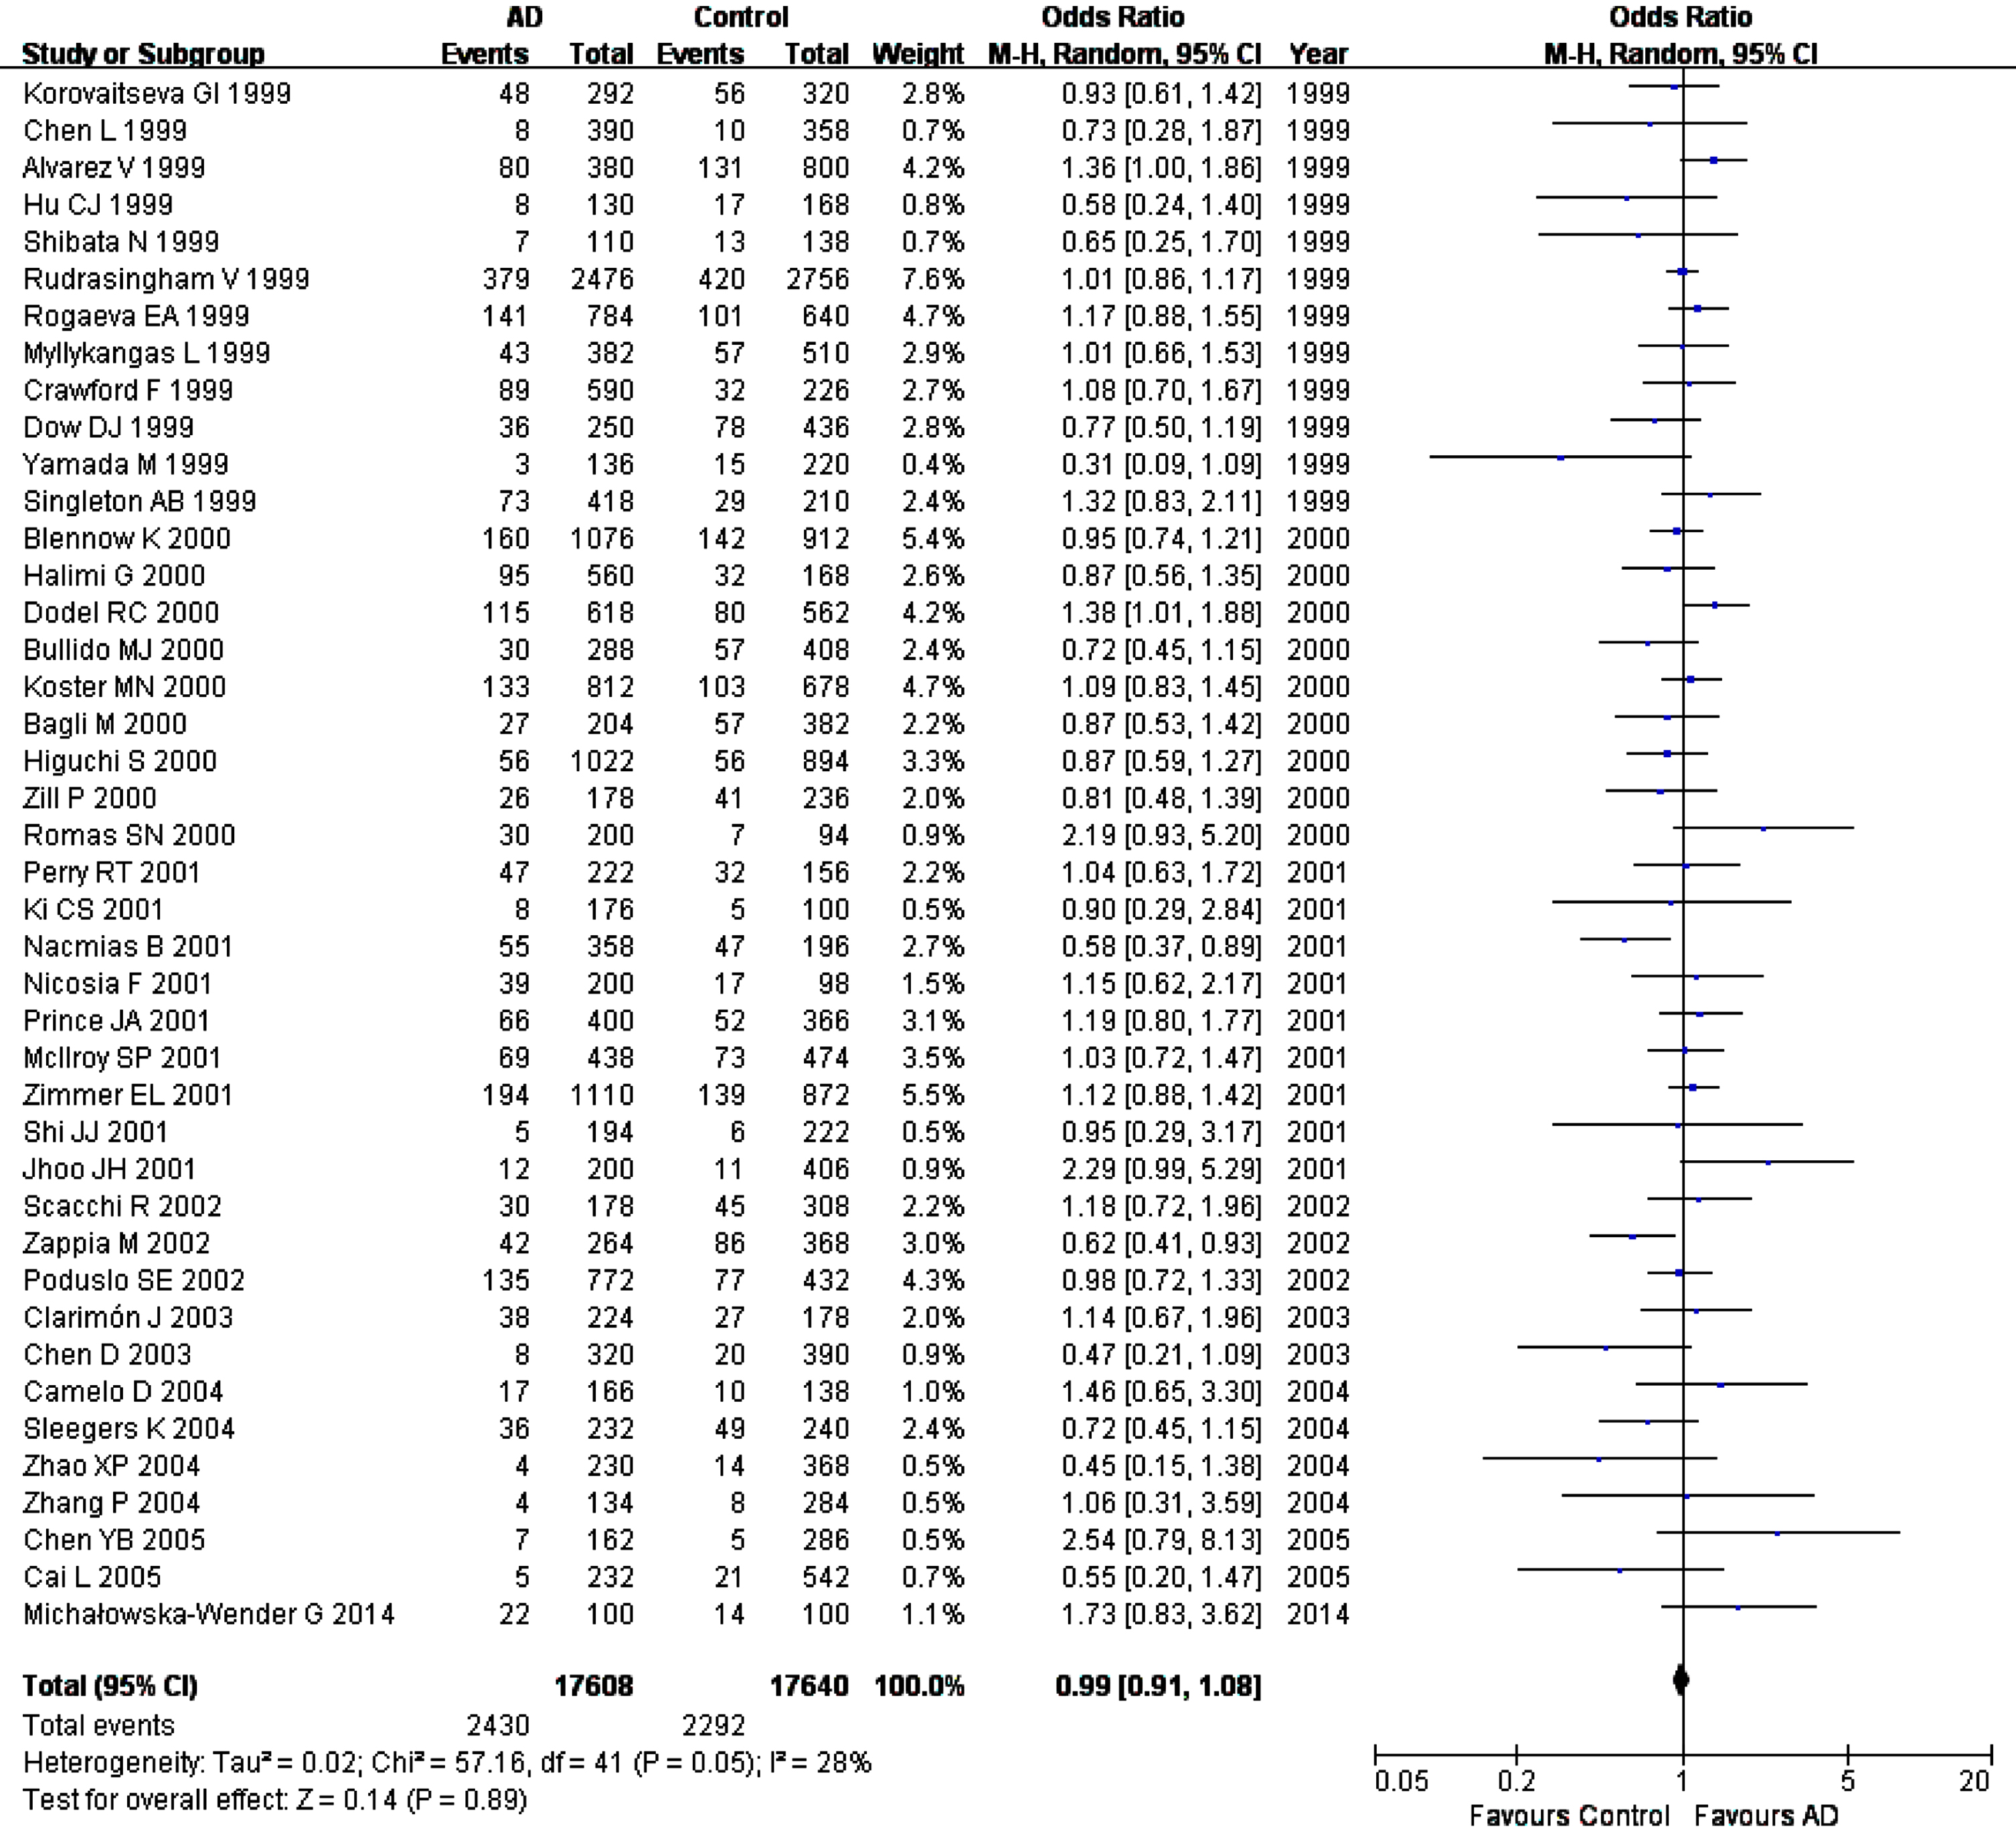
Table 3
Summary of Meta-analysis results
| A 2M Polymorphisms | Groups | Cases | Controls | Comparison models OR, 95% CI, p (pFDR) | ||||||
| I/D (rs3832852) | ID | II | DD | ID | II | DD | A | D | R | |
| Combined Population | 2012 | 6583 | 209 | 1932 | 6708 | 180 | 0.99, 0.91–1.08, 0.89 (0.89) | 1.02, 0.93–1.12, 0.71 (0.89) | 1.08, 0.88–1.32, 0.48 (0.89) | |
| Familial AD | 62 | 159 | 4 | 47 | 118 | 5 | 1.05, 0.70–1.56, 0.83 (0.83) | 0.92, 0.58–1.45, 0.72 (0.83) | 0.75, 0.20–2.75, 0.66 (0.83) | |
| Sporadic AD | 553 | 2002 | 54 | 583 | 2073 | 49 | 0.93, 0.75–1.14, 0.47 (0.59) | 1.10, 0.87–1.38, 0.44 (0.59) | 1.11, 0.75-1.64, 0.59 (0.59) | |
| Clinical diagnosis | 1600 | 5451 | 163 | 1559 | 5724 | 150 | 1.00, 0.91–1.10, 1.00 (1.00) | 1.01, 0.91–1.12, 0.90 (1.00) | 1.03, 0.82–1.29, 0.79 (1.00) | |
| Neuropathological diagnosis | 97 | 346 | 6 | 137 | 401 | 14 | 0.78, 0.59–1.01, 0.06 (0.15) | 1.29, 0.95–1.74, 0.10 (0.15) | 0.51, 0.19–1.37, 0.18 (0.18) | |
| Male | 63 | 248 | 9 | 62 | 289 | 3 | 0.99, 0.69–1.42, 0.96 (0.96) | 1.11, 0.74–1.66, 0.62 (0.93) | 2.06, 0.59–7.14, 0.26 (0.78) | |
| Female | 125 | 483 | 14 | 106 | 470 | 5 | 1.17, 0.90–1.52, 0.23 (0.35) | 0.89, 0.67–1.20, 0.46 (0.46) | 2.57, 0.91–7.22, 0.07 (0.21) | |
| Asians | 103 | 1527 | 3 | 154 | 1958 | 11 | 0.78, 0.61–1.00, 0.05 (0.15) | 1.24, 0.96–1.60, 0.10 (0.15) | 0.54, 0.20–1.44, 0.22 (0.22) | |
| Caucasians | 1805 | 4770 | 190 | 1728 | 4616 | 162 | 1.01, 0.93–1.10, 0.78 (0.97) | 1.00, 0.90–1.11, 0.97 (0.97) | 1.11, 0.89–1.37, 0.36 (0.97) | |
| EOAD | 93 | 313 | 12 | 115 | 349 | 8 | 0.91, 0.70–1.19, 0.49 (0.54) | 1.11, 0.80–1.55, 0.54 (0.54) | 1.78, 0.72–4.41, 0.21 (0.54) | |
| LOAD | 655 | 2111 | 71 | 757 | 2565 | 62 | 1.02, 0.89–1.17, 0.74 (0.74) | 0.97, 0.86–1.09, 0.58 (0.74) | 1.32, 0.93–1.87, 0.12 (0.36) | |
| I/V (rs669) | IV | II | VV | IV | II | VV | A | D | R | |
| Combined Population | 2922 | 4217 | 698 | 2850 | 4131 | 698 | 1.01, 0.93–1.10, 0.84 (0.98) | 1.00, 0.89–1.12, 0.98 (0.98) | 1.01, 0.85–1.20, 0.92 (0.98) | |
| Familial AD | 141 | 166 | 44 | 211 | 144 | 69 | 0.87, 0.70–1.09, 0.23 (0.35) | 1.40, 0.81–2.43, 0.22 (0.35) | 0.98, 0.62–1.56, 0.95 (0.95) | |
| Sporadic AD | 1287 | 2352 | 290 | 1431 | 2366 | 394 | 0.96, 0.86–1.08, 0.52 (0.59) | 1.08, 0.98–1.19, 0.11 (0.33) | 0.88, 0.57–1.38, 0.59 (0.59) | |
| Clinical diagnosis | 2338 | 3802 | 558 | 2384 | 3790 | 563 | 1.01, 0.92–1.11, 0.85 (0.90) | 1.01, 0.89–1.14, 0.90 (0.90) | 1.03, 0.84–1.25, 0.80 (0.90) | |
| Neuropathological diagnosis | 113 | 91 | 42 | 159 | 100 | 53 | 0.94, 0.53–1.68, 0.84 (0.84) | 1.26, 0.53–2.98, 0.60 (0.84) | 1.10, 0.69–1.74, 0.69 (0.84) | |
| Male | 90 | 217 | 23 | 86 | 238 | 22 | 0.95, 0.71–1.27, 0.73 (0.8) | 1.05, 0.73–1.51, 0.79 (0.8) | 0.92, 0.50–1.70, 0.80 (0.8) | |
| Female | 204 | 341 | 39 | 177 | 342 | 45 | 1.59, 0.77–3.29, 0.21 (0.32) | 0.58, 0.26–1.31, 0.19 (0.32) | 0.83, 0.53–1.31, 0.42 (0.42) | |
| Asians | 261 | 1640 | 13 | 248 | 1605 | 17 | 1.05, 0.83–1.32, 0.71 (0.71) | 0.93, 0.70–1.22, 0.59 (0.71) | 0.74, 0.37–1.48, 0.40 (0.71) | |
| Caucasians | 2647 | 2483 | 682 | 2595 | 2419 | 678 | 1.00, 0.91–1.10, 0.99 (0.99) | 1.03, 0.90–1.17, 0.68 (0.99) | 1.03, 0.85–1.24, 0.76 (0.99) | |
| EOAD | 159 | 214 | 30 | 146 | 280 | 34 | 1.18, 0.95–1.48, 0.14 (0.23) | 0.80, 0.59–1.08, 0.15 (0.23) | 0.78, 0.43–1.41, 0.41 (0.41) | |
| LOAD | 940 | 1266 | 224 | 943 | 1361 | 311 | 0.93, 0.70–1.23, 0.61 (0.86) | 1.02, 0.85–1.21, 0.86 (0.86) | 0.90, 0.66–1.22, 0.49 (0.86) | |
| rs226379 | AG | AA | GG | AG | AA | GG | A | D | R | |
| Combined Population | 101 | 348 | 45 | 139 | 329 | 79 | 0.86, 0.67–1.12, 0.27 (0.41) | 1.23, 0.87–1.72, 0.24 (0.41) | 0.90, 0.56–1.44, 0.66 (0.66) | |
| rs226380 | TG | TT | GG | TG | TT | GG | A | D | R | |
| Combined Population | 74 | 319 | 2 | 95 | 276 | 8 | 0.64, 0.47–0.87, 0.004* (0.012)* | 1.56, 1.12–2.19, 0.009* (0.0135)* | 0.24, 0.05–1.11, 0.07 (0.07) | |
AD, Alzheimer’s disease; EOAD, Early-onset AD; LOAD, Late-onset AD; A, Allelic model; D, Dominant model; R, Recessive model; pFDR, p-value corrected by FDR method; *significant statistically.
However, significant inter-study heterogeneity was observed in two genetic comparison models in combined population (I2 = 28%, p = 0.05 in allelic comparison; I2 = 27%, p = 0.06 in dominant model). In subgroup analyses, we observed a different extent heterogeneity in allelic comparison (I2 = 60%, p = 0.003) and the dominant model (I2 = 60%, p = 0.003) of the sporadic AD samples, and the allelic comparison (I2 = 29%, p = 0.06) and dominant model (I2 = 27%, p = 0.07) of the clinically diagnosed AD samples, and the allelic comparison (I2 = 29%, p = 0.07) and dominant model (I2 = 33%, p = 0.05) of the Caucasian samples, as well as the allelic comparison (I2 = 33%, p = 0.08) of late-onset AD (LOAD) samples. After excluding familial samples [33, 42, 60], the heterogeneity disappeared in combined population, the clinical diagnostic samples, and the Caucasians. After removing studies with NOS scores < 7 [62], the heterogeneity disappeared in LOAD samples, while the final relationship between A2M-I/D polymorphism and AD remained no significant (data not shown). The heterogeneity was not analyzed in sporadic subgroup because of limited studies included.
In sensitivity analyses, we excluded studies with NOS scores < 7 [20, 21, 62], studies deviating from HWE [25, 59], studies with zero in frequency for genotype distribution [22, 27, 33, 35, 39, 41, 43, 59, 64], studies with all samples from neuropathological diagnosis [19, 30], or studies with samples from the mixed neuropathological and clinical diagnoses [28, 31, 34, 45, 50, 53], and it is found that all genetic comparisons results remained unchanged, confirming the results’ stability and reliability.
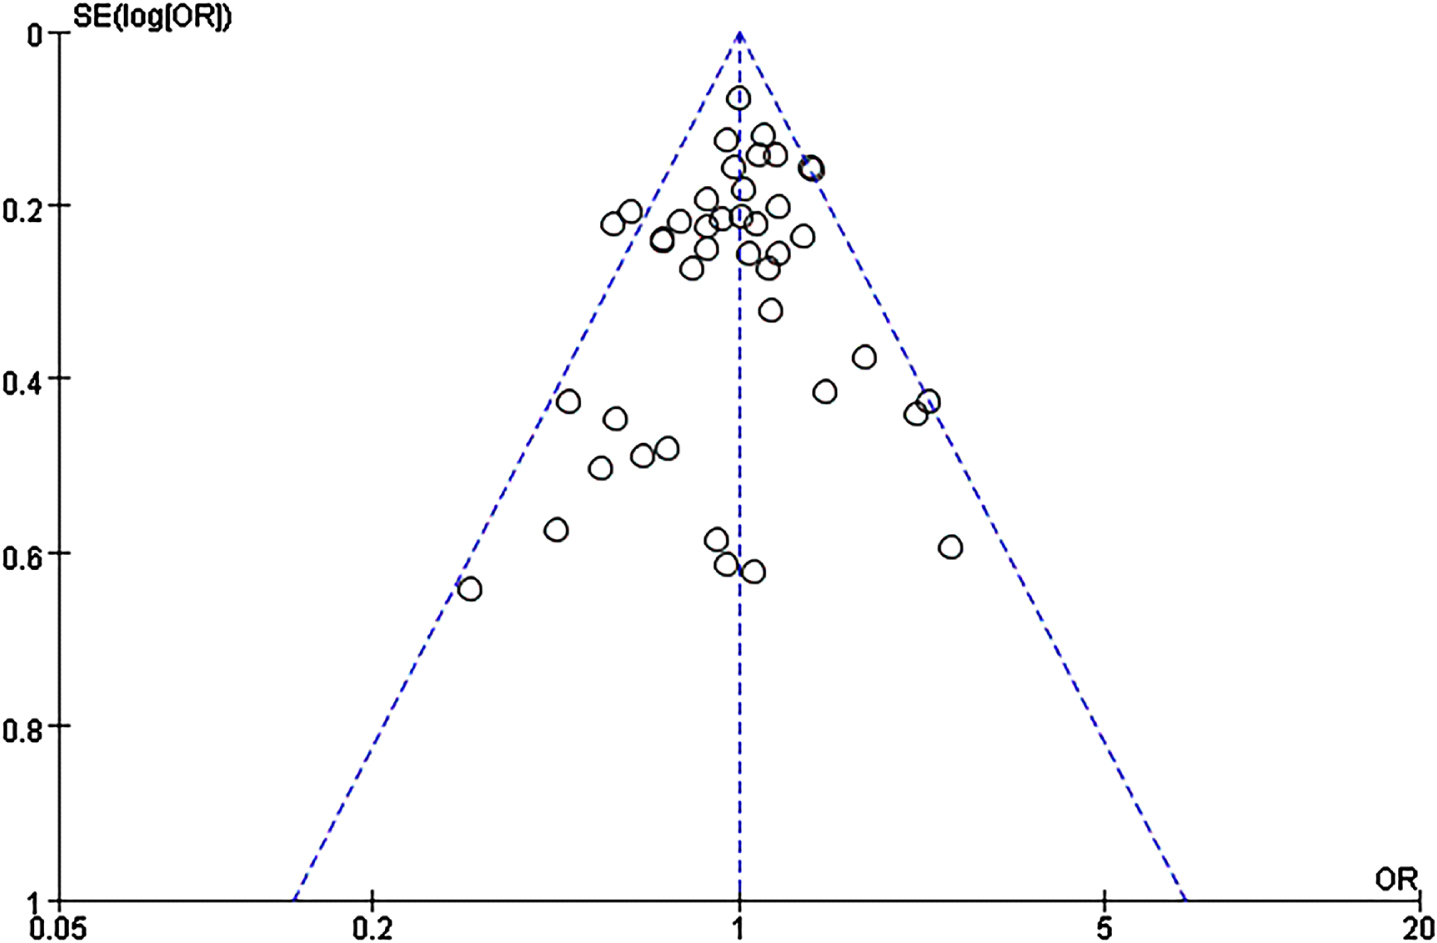
We did not find publication bias for this SNP using the funnel plots based on allele comparisons and Egger’s test (p = 0.29) (Fig. 3).
Fig. 3
Funnel plot of A2M-I/D allele distribution in the allelic comparison in combined population.
Relationship between A2M-I/V polymorphism and AD
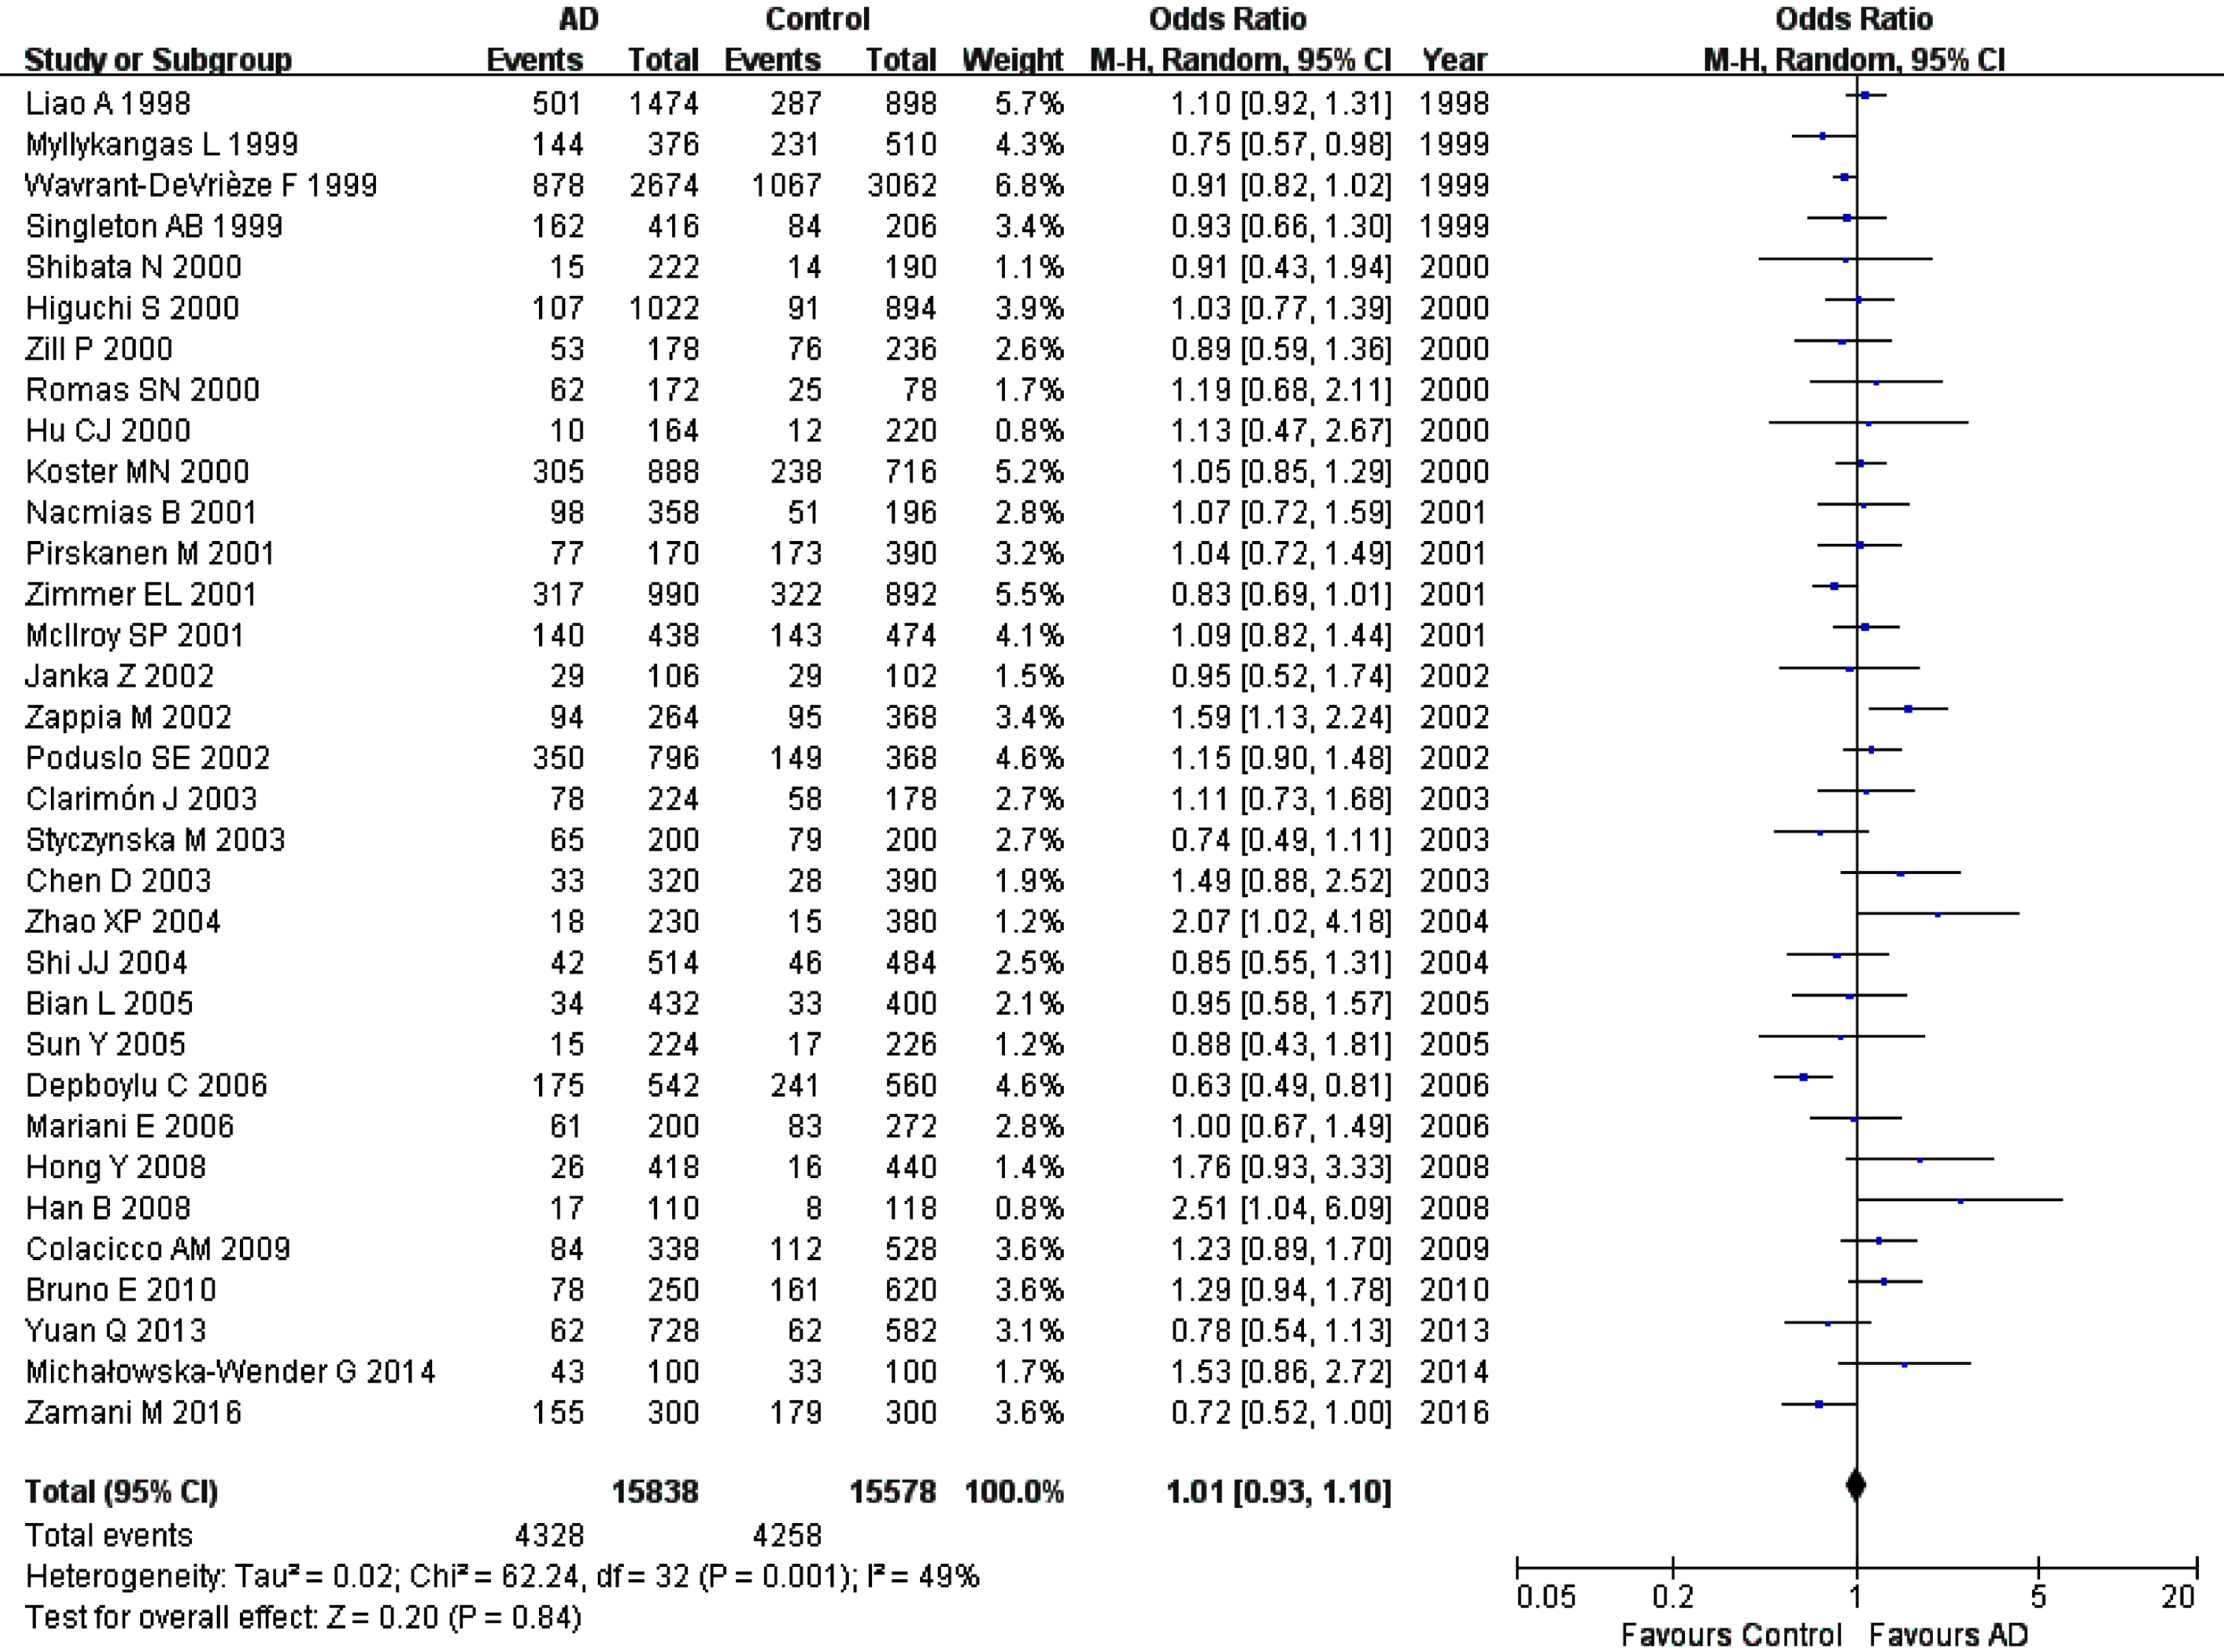
The combined results did not show a significant association of A2M-I/V polymorphism with AD in all genetic comparisons in the whole studied populations or in all subgroups (Fig. 4, Table 3).
Fig. 4
Forest plot of A2M-I/V allelic comparison (V versus I) and AD susceptibility in combined population. The contrast has an OR of 1.01 (95% CI: 0.93–1.10, p = 0.84) in the random-effects model.
Significant heterogeneity at different levels between studies was found in all genetic contrasts in combined population or in several subgroups with the exception of male and early-onset AD groups (data not shown). After excluding studies with deviation from HWE [15, 40, 69, 74, 75], the heterogeneity decreased significantly or disappeared in combined population or subgroups. The final relationship between this polymorphism and AD remained unchanged (data not shown) in all genetic comparisons. We did not explore the heterogeneity in subgroups with samples from neuropathological diagnosis due to the small number of studies.
The sensitivity analyses were performed after removing the aforementioned specific studies, such as studies with NOS scores < 7 [18, 46], studies being not in HWE [15, 40, 69, 74, 75], studies with zero in frequency for genotype distribution[59, 63], studies with all samples from neuropathological diagnosis [46], or studies with samples from the mixed neuropathological and clinical diagnoses [28, 34, 50, 53]. The final results were not altered in all comparisons except for female group, in which, the analysis demonstrated a significant association of II homozygote and V allele with AD risk after excluding studies with samples from mixed neuropathological and clinical diagnosis [50] (For II: OR, 95% CI: 0.43, 0.26–0.73, pFDR = 0.003 and for V: OR, 95% CI: 2.15, 1.38–3.35, pFDR = 0.0024) (Supplementary Figures 1 and 2).
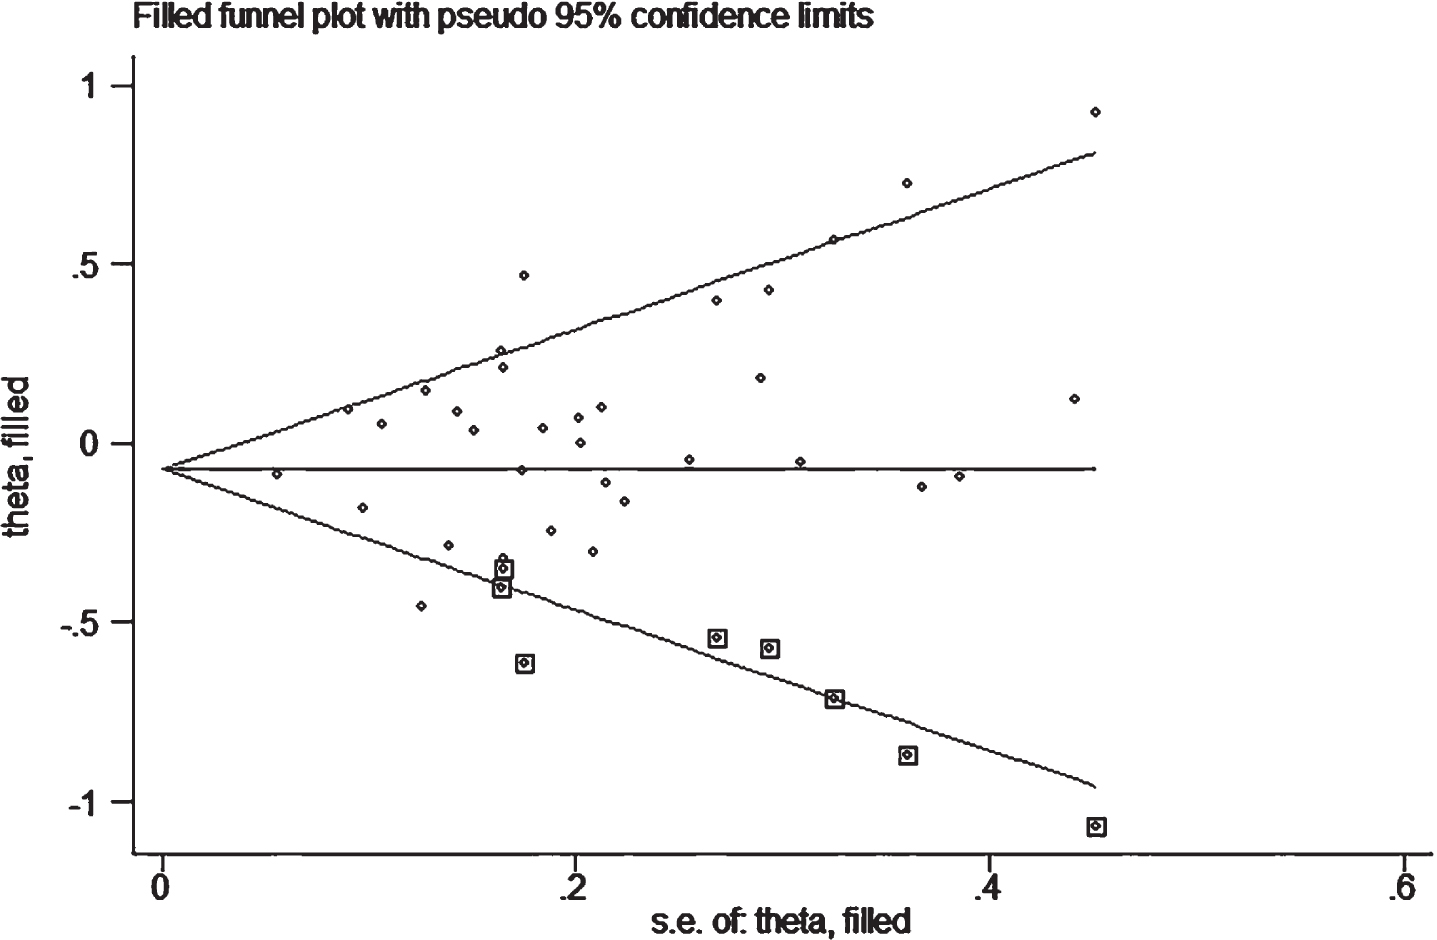
In publication bias assessment based on the allelic comparison in combined population, we found possible bias due to asymmetric distribution of the funnel plot and Egger’s test (p = 0.05), indicating that more studies are needed to verify the conclusion. However, the trim-and-fill method was performed with eight imputed studies, which produced a symmetrical funnel plot (Fig. 5). The imputed estimate (OR, 95% CI, 0.93, 0.85–1.02, p = 0.11) was similar to that in the primary analysis, indicating that results are unlikely to be explained by publication bias.
Fig. 5
Filled funnel plot of OR from studies that investigated the association between A2M-I/V allele frequency (V versus I) and the risk of AD. The circles alone are real studies and the circles enclosed in boxes are ‘filled’ studies. The horizontal line represents the summary effect estimates, and the diagonal lines represent pseudo-95 % CI limits.
The association of rs226379 and rs226380 with AD
There was no evidence of significant association of rs226379 with AD in all genetic comparisons in all populations (Table 3). Due to the limited number of published studies (n = 3), the sensitivity and heterogeneity analysis as well as publication bias testing were not conducted.
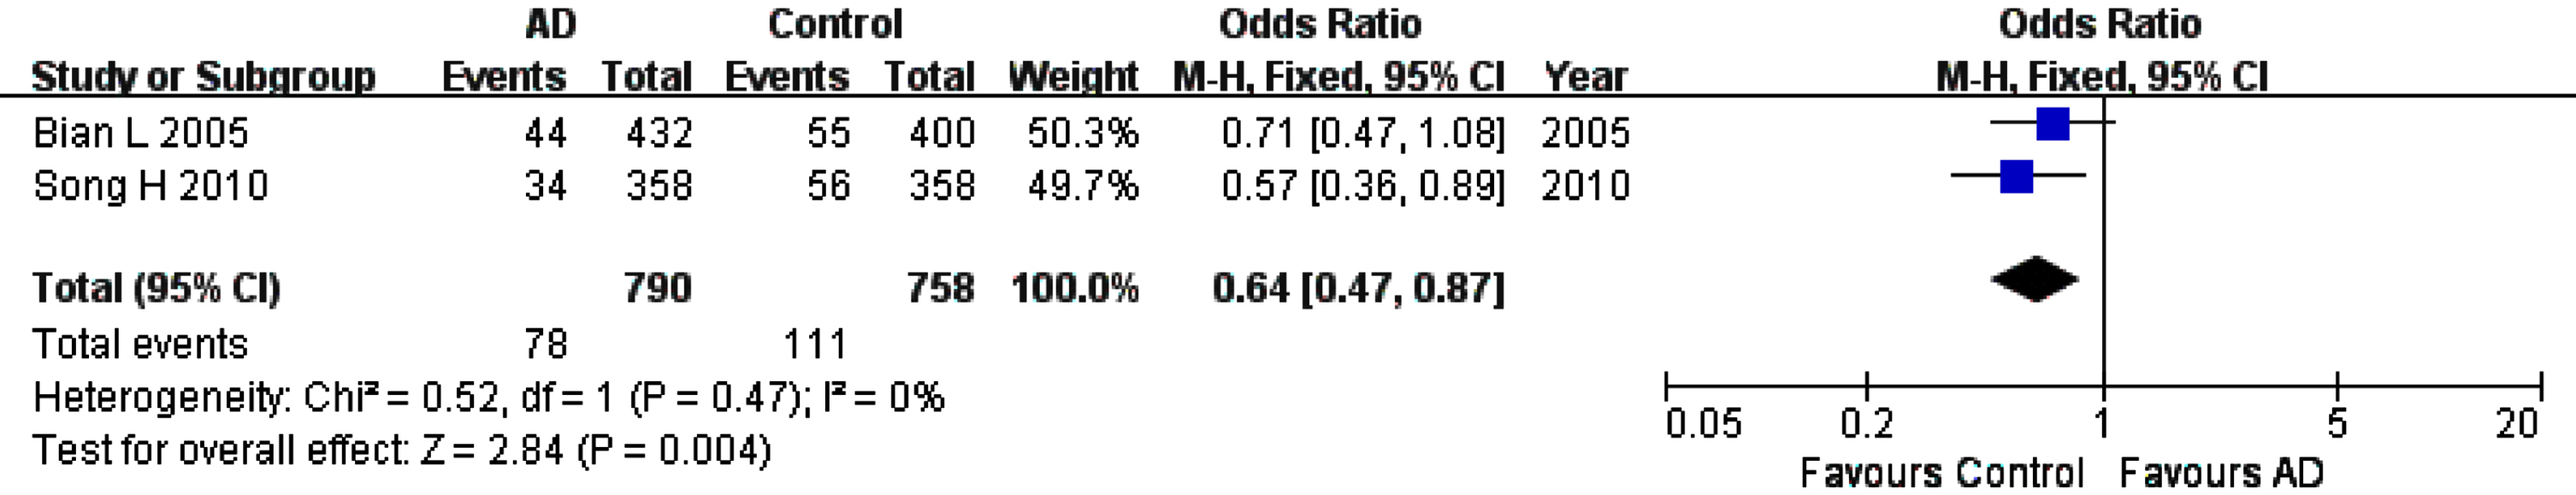
For rs226380 polymorphism in the whole studied population, the summary ORs showed statistically significant association of the TT homozygote (OR, 95% CI: 1.56, 1.12–2.19, pFDR = 0.0135) or G allele (OR, 95% CI: 0.64, 0.47–0.87, pFDR = 0.012) with the susceptibility to AD (Table 3, Figs. 6 and 7). However, it is worth noting that the total sample of this polymorphism is entirely Asian population. The sensitivity, heterogeneity and the funnel plot analyses were not performed because of the small number of studies (only two studies).
Fig. 6
Forest plot of rs226380 genotype frequency (TT versus (TG+GG)) and AD susceptibility in combined population. The contrast has an OR of 1.56 (95% CI: 1.12–2.19, p = 0.009) in the Fixed-effects model.
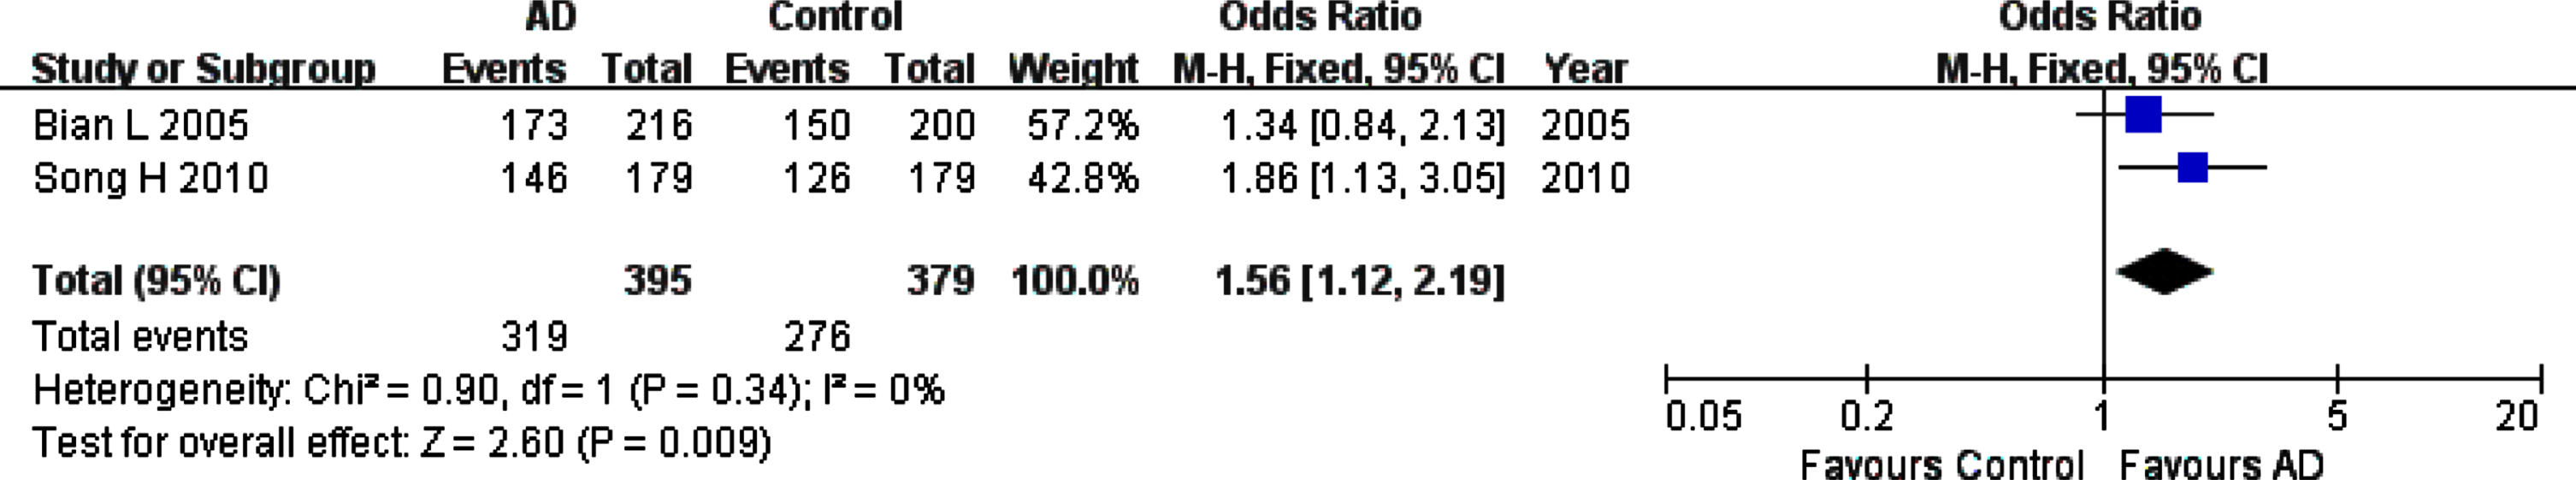
Fig. 7
Forest plot of rs226380 allele frequency (G versus T) and AD susceptibility in combined population. The contrast has an OR of 0.64 (95% CI: 0.47–0.87, p = 0.004) in the Fixed-effects model.
DISCUSSION
Relationship between A2M gene polymorphisms and AD
The meta-analysis results revealed that two SNPs (rs226380 and I/V polymorphism) in A2M were significantly associated with AD risk. The G allele of rs226380 had a decreased risk for AD in Asians, on the contrary, the TT homozygote was more common in Asian patients. The V allele of the I/V polymorphism was associated with increased risk of AD only in female population, and the II homozygote could be a protective factor in these population. However, no association of AD was found in the I/D polymorphism widely discussed in the literature.
Several previous meta-analyses focused on the relationship of A2M gene polymorphisms and AD. Studies by Koster et al. (2000) found that the D allele frequency was lower in combined analyses including three Asian studies (OR, 95% CI: 0.70, 0.53–0.92) [8]. The meta-analysis from Xu et al. (2013) included 14 original studies, and showed a significant association of A2M-I/V polymorphism with AD in different populations, such as German, Korean, Chinese, Spanish, Italian, and Polish populations [9]. However, Chen H’s meta-analysis published in 2014, including 39 primary studies, found no evidence of significant relationship of A2M-I/D or I/V polymorphism and AD risk [10]. The inconsistent results obtained from these meta-analyses may be related to following reasons, such as not including all original studies [8, 9], being short of detailed analysis on AD subgroups [8–10], not excluding the controls deviating from HWE [9], or the obtained results with significant heterogeneity [10].
The present meta-analysis contained 62 original studies (including 8,804 cases and 8,820 controls for A2M-I/D, 7,919 cases and 7,789 controls for A2M-I/V, 494 cases and 547 controls for rs226379, as well as 395 cases and 379 controls for rs226380 polymorphism), providing more comprehensive analyses on the relationship between A2M gene polymorphisms and AD risk.
Possible mechanisms of A2M gene polymorphisms in AD
The neuropathological characteristics of AD are defined as abnormal aggregation of amyloid-β (Aβ) peptide in the brain parenchyma and neurofibrillary tangles composed of abnormal hyperphosphorylation of tau protein in neurons [76]. A2M is a tetrameric protein be found widely in human plasma and cerebrospinal fluid. Many noncovalent ligands of A2M, including AD-associated Aβ peptide, neurotrophic factor, and tumor necrosis factor-alpha, preferentially bind to convert A2M [77]. A2M functions are primarily as a pan-protease inhibitory activity [5]. In addition, through its chaperone role, A2M binds and facilitates the clearance of the Aβ peptide [78]. Some studies have shown that A2M is found in the brain neural plaques of AD patients after death, and tetrameric A2M plays a role in controlling the formation of amyloid fibers [79]. This indicates that A2M is associated with amyloid protein deposition in the brain. The specific binding of A2M with Aβ peptide leads to the soluble state of Aβ peptide, preventing fibril formation. It is suggested that A2M is involved in preventing the formation of neurofibrillary tangles in the brain of AD patients [75]. The latest study has also shown that A2M with a novel p.N410T mutation (c.1229A > C) binding to Aβ peptide can prevent the formation of fibrils and weaken the neurotoxicity of Aβ [80].
The previous study found that the haplotypes grouped by eight polymorphisms in A2M were all associated with AD [81], including polymorphisms at 5’ UTR, exon 12, 24 (rs669), and intron 7, 15, 18 (rs3832852), 21, and 28. Moreover, DNA variations in the A2M gene lead to a significant increase in the accumulation of amyloid plaques in AD brains [82]. In addition, the inefficient clearance of Aβ peptide has been identified as the main pathogenic pathway in sporadic AD cases [83]. These findings further confirmed the correlation of A2M gene in the pathogenesis of AD. The evidence also shows that A2M-I/V polymorphism influences A2M levels and may modify A2M activity, therefore altering the ratio of cleaved/uncleaved A2M monomer [84]. However, there was also evidence to the contrary that no different aberrant A2M splicing products were detected in the brains of carriers with A2M-D allele, implying that the I/D mutation had no biological effect [20]. These results were consistent with our results in present meta-analysis.
Our results also showed that the significant relationship of A2M mutants to AD risk mainly in Asians. AD is genetically complex and shows heritability of up to 60–80% [1]. Because there are population differences in linkage disequilibrium and allele frequencies, while differing ethnicities share risk genes and alleles, the consequences may be different in distinct populations for AD. From studies in individuals of African and Hispanic ancestry, notable ancestry-related differences have been identified in the genetic architecture of AD [1]. For example, the effect of APOE ɛ4 is weaker in African American and Hispanic populations, however, its effect is higher in East Asian populations [85]. This supports the fact that the risk of AD inheritance is not always the same in different ethnic groups, reflecting the heterogeneity of AD gene inheritance.
Our results suggested a larger risk for AD in female with the V allele of A2M-I/V polymorphism. The genetic risk of AD may be more closely linked to women, for example, Female carriers of APOE ɛ4 are at a greater risk than male carriers, particularly those aged 65 to 75 years [86]. In the latest survey in 2023, almost two-thirds of Americans with AD were women [2]. Pathologic tau levels are higher in women [87], and these differences are particularly pronounced in individuals with higher levels of Aβ load [88]. These theories may partially explain the susceptibility to AD in female with I/V polymorphism.
Publication bias
Publication bias was found in studies involving A2M-I/V polymorphism. An important source of bias in meta-analysis is that the source material may be skewed due to the tendency of journals to publish only studies with positive findings. This suggests the possibility of publication bias, although there are other reasons for funnel plot asymmetry, such as differences in methodological quality or, simply, a play of chance. However, we used the trim and fill method to correct the bias, which did not alter the significant relationship between the allele of the A2M-I/V polymorphism and AD risk, suggesting that the publication bias did not affect the final pooled results.
Heterogeneity and sensitivity analysis
A varying degree of heterogeneity between studies were found in multiple genetic comparisons in AD for A2M-I/D or I/V polymorphism. Multiple reasons may result in heterogeneity in meta-analyses, such as source of the samples, ethnicity, and the characteristics of the single study. In the present analyses, the familial samples may be main cause of heterogeneity. The heterogeneity disappeared when we excluded the familial samples in combined population or subgroups for A2M-I/D polymorphism. Secondly, the HWE could partly explain the heterogeneity in some comparison models. After excluding studies with deviation from HWE in A2M-I/V polymorphism, the heterogeneity among studies has decreased significantly or disappeared in combined population or sub-groups. In addition, the heterogeneity disappeared when the studies with NOS < 7 were removing from the analyses in LOAD subgroup for A2M-I/D. It is worth noting that, sometimes, individual studies may cause heterogeneity. Properly, the observed heterogeneity could be attributable to differences in environmental factors, methodological factors in design, and how the studies were conducted.
The sensitivity analyses after removing specific studies did not alter the final results in any of the A2M-I/D polymorphism genetic comparisons in the whole studied population or subgroups, further confirming the reliability and stability of the results. Sensitivity analysis found a significant association of A2M-I/V polymorphism with AD risk in the female subgroup after excluding studies with samples from mixed neuropathological and clinical diagnosis, while all other comparative results remained unchanged. This suggested that the individual studies seemed to have minor effect in sub-population, nevertheless, the final overall results still kept reliable and stable.
NOS evaluation
Since all the included studies were non-randomized and had a cohort or case-control design, the NOS was used to judge study quality, as recommended by the Cochrane Collaboration [89]. Only five studies had a score of NOS < 7 in original studies, indicating a higher quality of studies included in present meta-analysis as a whole.
Limitations of this meta-analysis
Our meta-analysis has some limitations. The first, one limitation of using a meta-analytic approach for population-based observational studies is that these studies yield only estimates of associations that are influenced by confounding factors such as sex, age or ethnic admixture, either between studies or between cases and controls within each study [7]. For example, five studies [17, 24, 34, 44, 69] in current meta-analysis mixed other races in the Caucasian population (Table 1), however, removing these studies in all analyses did not alter the total results. In addition, the clinical characteristics of individual studies may also be a confounding factor. One original study we included define AD with onset age greater than 60 [75] or 70 years [71] rather than current standard (65 years and more) as LOAD, which may also affect our results, Although the sample size is small. Second, we did not track the complete unpublished articles to obtain data for analysis. The potential effect of this publication bias is unknown. We did not succeed in searching relative information through other resources of grey documents such as house journal, preprints, government documents, newsletters, trade literature, standards, patents, and translations. Third, language bias must be noted. We found no other language literature that meets our inclusion criteria besides those in Chinese and English. However, we have to acknowledge that some articles were published in journals which were not found on the international journal databases. Fourth, some data cannot be obtained because of incomplete information. A few studies (Supplementary Table 1) involving A2M polymorphism and AD did not demonstrate the distribution of alleles or genotypes in AD and controls. We were unable to obtain the data from these authors as well. These articles were excluded from our meta-analysis. Fifth, the number of studies involving the rs226380 or rs226379 polymorphisms is relatively small, and the samples of the rs226380 polymorphism are all from the Asians. And so, the results need to be further confirmed and updated in the future. At last, heterogeneity was evident among the original studies involving A2M-I/V polymorphism in our meta-analysis. We cannot make the heterogeneity disappear, despite using different methods.
Based on the limitations above mentioned, the conclusions we draw should be treated with caution.
Conclusions
In summary, accumulated evidence so far indicated that the A2M SNPs were associated with AD risk in some sub-populations. Improved methodologies and larger sample sizes are required to verify the present findings in future studies.
ACKNOWLEDGMENTS
The authors have no acknowledgments to report.
FUNDING
Hua Liu reports that this work was funded by Chengdu Municipal Bureau of Science and Technology (Grant No. 2019-YF09-00120-SN), Sichuan Provincial Human Resource and Social Security Agency Oversea Returnee Science and Technology Grant (issued by Sichuan Human Resource and Social Security Office 2019), and Sichuan Provincial Medical Research Projects from Sichuan Medical Association (S19024).
CONFLICT OF INTEREST
The authors have no conflict of interest to report.
DATA AVAILABILITY
The data supporting the findings of this study are available within the article and its supplementary material.
SUPPLEMENTARY MATERIAL
[1] The supplementary material is available in the electronic version of this article: https://dx.doi.org/10.3233/ADR-230131.
REFERENCES
[1] | Reitz C , Pericak-Vance MA , Foroud T , Mayeux R ((2023) ) A global view of the genetic basis of Alzheimer disease. Nat Rev Neurol 19: , 261–277. |
[2] | ((2023) ) Alzheimer’s disease facts and figures. Alzheimers Dement 19: , 1598–1695. |
[3] | Jia L , Quan M , Fu Y , Zhao T , Li Y , Wei C , Tang Y , Qin Q , Wang F , Qiao Y , Shi S , Wang YJ , Du Y , Zhang J , Zhang J , Luo B , Qu Q , Zhou C , Gauthier S , Jia J ((2020) ) Dementia in China: Epidemiology, clinical management, and research advances. Lancet Neurol 19: , 81–92. |
[4] | Andrade-Guerrero J , Santiago-Balmaseda A , Jeronimo-Aguilar P , Vargas-Rodríguez I , Cadena-Suárez AR , Sánchez-Garibay C , Pozo-Molina G , Méndez-Catalá CF , Cardenas-Aguayo MD , Diaz-Cintra S , Pacheco-Herrero M , Luna-Muñoz J , Soto-Rojas LO ((2023) ) Alzheimer’s disease: An updated overview of its genetics. Int J Mol Sci 24: , 3754. |
[5] | Blacker D , Wilcox MA , Laird NM , Rodes L , Horvath SM , Go RC , Perry R , Watson B Jr , Bassett SS , McInnis MG , Albert MS , Hyman BT , Tanzi RE ((1998) ) Alpha-2 macroglobulin is genetically associated with Alzheimer disease. Nat Genet 19: , 357–360. |
[6] | Myers AJ , Goate AM ((2001) ) The genetics of late-onset Alzheimer’s disease. Curr Opin Neurol 14: , 433–440. |
[7] | Munafò MR , Flint J ((2004) ) Meta-analysis of genetic association studies. Trends Genet 20: , 439–444. |
[8] | Koster MN , Dermaut B , Cruts M , Houwing-Duistermaat JJ , Roks G , Tol J , Ott A , Hofman A , Munteanu G , Breteler MM , van Duijn CM , Van Broeckhoven C ((2000) ) The alpha2-macroglobulin gene in AD: A population-based study and meta-analysis. Neurology 55: , 678–684. |
[9] | Xu X , Wang Y , Wang L , Liao Q , Chang L , Xu L , Huang Y , Ye H , Xu L , Chen C , Shen X , Zhang F , Ye M , Wang Q , Duan S ((2013) ) Meta-analyses of 8 polymorphisms associated with the risk of the Alzheimer’s disease. PLoS One 8: , e73129. |
[10] | Chen H , Li Z , Liu N , Zhang W , Zhu G ((2014) ) Influence of Alpha-2-Macroglobulin 5 bp I/D and Ile1000Val polymorphisms on the susceptibility of Alzheimer’s disease: A systematic review and meta-analysis of 52 studies. Cell Biochem Biophys 70: , 511–519. |
[11] | Liu H , Xia P , Liu M , Ji XM , Sun HB , Tao L , Mu QW ((2013) ) PON gene polymorphisms and ischaemic stroke: A systematic review and meta analysis. Int J Stroke 8: , 111–123. |
[12] | Liu H , Wang Y , Zheng J , Li G , Chen T , Lei J , Mao Y , Wang J , Liu W , Zhao G , Tacey M , Yan B ((2017) ) Platelet glycoprotein gene Ia C807T, HPA-3, and Ibα VNTR polymorphisms are associated with increased ischemic stroke risk: Evidence from a comprehensive meta-analysis. Int J Stroke 12: , 46–70. |
[13] | Bai N , Liu W , Xiang T , Zhou Q , Pu J , Zhao J , Luo D , Liu X , Liu H ((2022) ) Genetic association of ANRIL with susceptibility to Ischemic stroke: A comprehensive meta-analysis. PLoS One 17: , e0263459. |
[14] | Wu Y , Cao H , Baranova A , Huang H , Li S , Cai L , Rao S , Dai M , Xie M , Dou Y , Hao Q , Zhu L , Zhang X , Yao Y , Zhang F , Xu M , Wang Q ((2020) ) Multi-trait analysis for genome-wide association study of five psychiatric disorders. Transl Psychiatry 10: , 209. |
[15] | Liao A , Nitsch RM , Greenberg SM , Finckh U , Blacker D , Albert M , Rebeck GW , Gomez-Isla T , Clatworthy A , Binetti G , Hock C , Mueller-Thomsen T , Mann U , Zuchowski K , Beisiegel U , Staehelin H , Growdon JH , Tanzi RE , Hyman BT ((1998) ) Genetic association of an alpha2-macroglobulin (Val1000lle) polymorphism and Alzheimer’s disease. Hum Mol Genet 7: , 1953–1956. |
[16] | Song H , Jia L , Zuo X , Jia J ((2010) ) Association between haplotype -88G/25G in A2M with Alzheimer’s disease. Neurosci Lett 479: , 143–145. |
[17] | Millard SP , Lutz F , Li G , Galasko DR , Farlow MR , Quinn JF , Kaye JA , Leverenz JB , Tsuang D , Yu CE , Peskind ER , Bekris LM ((2014) ) Association of cerebrospinal fluid Aβ42 with A2M gene in cognitively normal subjects. Neurobiol Aging 35: , 357–364. |
[18] | Wavrant-DeVrièze F , Rudrasingham V , Lambert JC , Chakraverty S , Kehoe P , Crook R , Amouyel P , Wu W , Holmans P , Rice F , Pérez-Tur J , Frigard B , Morris JC , Carty S , Cottel D , Tunstall N , Lovestone S , Petersen RC , Chartier-Harlin MC , Goate A , Owen MJ , Williams J , Hardy J ((1999) ) No association between the alpha-2 macroglobulin I1000V polymorphism and Alzheimer’s disease. Neurosci Lett 262: , 137–139. |
[19] | Dow DJ , Lindsey N , Cairns NJ , Brayne C , Robinson D , Huppert FA , Paykel ES , Xuereb J , Wilcock G , Whittaker JL , Rubinsztein DC ((1999) ) Alpha-2 macroglobulin polymorphism and Alzheimer disease risk in the UK. Nat Genet 22: , 16–22. |
[20] | Rogaeva EA , Premkumar S , Grubber J , Serneels L , Scott WK , Kawarai T , Song Y , Hill DL , Abou-Donia SM , Martin ER , Vance JJ , Yu G , Orlacchio A , Pei Y , Nishimura M , Supala A , Roberge B , Saunders AM , Roses AD , Schmechel D , Crane-Gatherum A , Sorbi S , Bruni A , Small GW , Conneally PM , Haines JL , Van Leuven F , St George-Hyslop PH , Farrer LA , Pericak-Vance MA ((1999) ) An alpha-2-macroglobulin insertion-deletion polymorphism in Alzheimer disease. Nat Genet 22: , 19–22. |
[21] | Rudrasingham V , Wavrant-De Vrièze F , Lambert JC , Chakraverty S , Kehoe P , Crook R , Amouyel P , Wu W , Rice F , Pérez-Tur J , Frigard B , Morris JC , Carty S , Petersen R , Cottel D , Tunstall N , Holmans P , Lovestone S , Chartier-Harlin MC , Goate A , Hardy J , Owen MJ , Williams J ((1999) ) Alpha-2 macroglobulin gene and Alzheimer disease. Nat Genet 22: , 17–22. |
[22] | Singleton AB , Gibson AM , McKeith IG , Ballard CA , Perry RH , Ince PG , Edwardson JA , Morris CM ((1999) ) Alpha2-macroglobulin polymorphisms in Alzheimer’s disease and dementia with Lewy bodies. Neuroreport 10: , 1507–1510. |
[23] | Chen L , Baum L , Ng HK , Chan LY , Sastre I , Artíga MJ , Valdivieso F , Bullido MJ , Chiu HF , Pang CP ((1999) ) Apolipoprotein E promoter and alpha2-macroglobulin polymorphisms are not genetically associated with Chinese late onset Alzheimer’s disease. Neurosci Lett 269: , 173–177. |
[24] | Crawford F , Town T , Freeman M , Schinka J , Gold M , Duara R , Mullan M ((1999) ) The alpha-2 macroglobulin gene is not associated with Alzheimer’s disease in a case-control sample. Neurosci Lett 270: , 133–136. |
[25] | Hu CJ , Sung SM , Liu HC , Lee KY , Hsu WC , Wong WK , Lee CC , Tsai CH , Chang JG ((1999) ) No association of alpha-2 macroglobulin gene five-nucleotide deletion with AD in Taiwan Chinese. Neurology 53: , 642–643. |
[26] | Korovaitseva GI , Premkumar S , Grigorenko A , Molyaka Y , Galimbet V , Selezneva N , Gavrilova SI , Farrer LA , Rogaev EI ((1999) ) Alpha-2 macroglobulin gene in early- and late-onset Alzheimer disease. Neurosci Lett 271: , 129–131. |
[27] | Shibata N , Ohnuma T , Takahashi T , Ohtsuka E , Ueki A , Arai H ((1999) ) Genetic association between alpha-2 macroglobulin and Japanese sporadic Alzheimer’s disease. Neurosci Lett 271: , 132–134. |
[28] | Myllykangas L , Polvikoski T , Sulkava R , Verkkoniemi A , Crook R , Tienari PJ , Pusa AK , Niinistö L , O’Brien P , Kontula K , Hardy J , Haltia M , Pérez-Tur J ((1999) ) Genetic association of alpha2-macroglobulin with Alzheimer’s disease in a Finnish elderly population. Ann Neurol 46: , 382–390. |
[29] | Alvarez V , Alvarez R , Lahoz CH , Martínez C , Peña J , Guisasola LM , Salas-Puig J , Morís G , Uría D , Menes BB , Ribacoba R , Vidal JA , Sánchez JM , Coto E ((1999) ) Association between an alpha(2) macroglobulin DNA polymorphism and late-onset Alzheimer’s disease. Biochem Biophys Res Commun 264: , 48–50. |
[30] | Yamada M , Sodeyama N , Itoh Y , Suematsu N , Otomo E , Matsushita M , Mizusawa H ((1999) ) A deletion polymorphism of alpha(2)-macroglobulin gene and cerebral amyloid angiopathy. Stroke 30: , 2277–2279. |
[31] | Blennow K , Ricksten A , Prince JA , Brookes AJ , Emahazion T , Wasslavik C , Bogdanovic N , Andreasen N , B°atsman S , Marcusson J , Nägga K , Wallin A , Regland B , Olofsson H , Hesse C , Davidsson P , Minthon L , Jansson A , Palmqvist L , Rymo L ((2000) ) No association between the alpha2-macroglobulin (A2M) deletion and Alzheimer’s disease, and no change in A2M mRNA, protein, or protein expression. J Neural Transm (Vienna) 107: , 1065–1079. |
[32] | Dodel RC , Du Y , Bales KR , Gao F , Eastwood B , Glazier B , Zimmer R , Cordell B , Hake A , Evans R , Gallagher-Thompson D , Thompson LW , Tinklenberg JR , Pfefferbaum A , Sullivan EV , Yesavage J , Alstiel L , Gasser T , Farlow MR , Murphy GM Jr , Paul SM ((2000) ) Alpha2 macroglobulin and the risk of Alzheimer’s disease. Neurology 54: , 438–442. |
[33] | Romas SN , Mayeux R , Rabinowitz D , Tang MX , Zadroga HR , Lantigua R , Medrano M , Tycko B , Knowles JA ((2000) ) The deletion polymorphism and Val1000Ile in alpha-2-macroglobulin and Alzheimer disease in Caribbean Hispanics. Neurosci Lett 279: , 133–136. |
[34] | Higuchi S , Matsushita S , Nakane J , Arai H , Matsui T , Urakami K , Yuzuriha T , Takeda A ((2000) ) Alpha2-macroglobulin gene polymorphisms show racial diversity and are not associated with Alzheimer’s disease. Neuroreport 11: , 1167–1171. |
[35] | Bullido MJ , Guallar-Castillón P , Artiga MJ , Ramos MC , Sastre I , Aldudo J , Frank A , Coria F , Rodríguez-Artalejo F , Valdivieso F ((2000) ) Alzheimer’s risk associated with human apolipoprotein E, alpha-2 macroglobulin and lipoprotein receptor related protein polymorphisms: Absence of genetic interactions, and modulation by gender. Neurosci Lett 289: , 213–216. |
[36] | Shibata N , Ohnuma T , Takahashi T , Ohtsuka E , Ueki A , Nagao M , Arai H ((2000) ) No genetic association between alpha-2 macroglobulin I1000V polymorphism and Japanese sporadic Alzheimer’s disease. Neurosci Lett 290: , 154–156. |
[37] | Halimi G , Duplan L , Bideau C , Iniesta D , Berthézène P , Oddoze C , Verdier JM , Michel B , Bergé-Lefranc JL ((2000) ) Association of APOE promoter but not A2M polymorphisms with risk of developing Alzheimer’s disease. Neuroreport 11: , 3599–3601. |
[38] | Zill P , Bürger K , Behrens S , Hampel H , Padberg F , Boetsch T , Möller HJ , Ackenheil M , Bondy B ((2000) ) Polymorphisms in the alpha-2 macroglobulin gene in psychogeriatric patients. Neurosci Lett 294: , 69–72. |
[39] | Bagli M , Papassotiropoulos A , Jessen F , Schmitz S , Rao ML , Maier W , Heun R ((2000) ) Identical distribution of the alpha 2-macroglobulin pentanucleotide deletion in subjects with Alzheimer disease and controls in a German population. Am J Med Genet 96: , 775–777. |
[40] | Hu CJ , Sung SM , Liu HC , Hsu WC , Lee LS , Lee CC , Tsai CH , Chang JG ((2000) ) Genetic risk factors of sporadic Alzheimer’s disease among Chinese in Taiwan. J Neurol Sci 181: , 127–131. |
[41] | Jhoo JH , Kim KW , Lee DY , Lee KU , Lee JH , Kim SY , Youn JY , Youn JC , Woo JI ((2001) ) Association of alpha-2-macroglobulin deletion polymorphism with sporadic Alzheimer’s disease in Koreans. J Neurol Sci 184: , 21–25. |
[42] | Nacmias B , Tedde A , Cellini E , Forleo P , Orlacchio A , Guarnieri BM , Petruzzi C , D’Andrea F , Serio A , Sorbi S ((2001) ) Alpha2-macroglobulin polymorphisms in Italian sporadic and familial Alzheimer’s disease. Neurosci Lett 299: , 9–12. |
[43] | Ki CS , Na DL , Kim HJ , Kim JW ((2001) ) Alpha-1 antichymotrypsin and alpha-2 macroglobulin gene polymorphisms are not associated with Korean late-onset Alzheimer’s disease. Neurosci Lett 302: , 69–72. |
[44] | Perry RT , Collins JS , Harrell LE , Acton RT , Go RC ((2001) ) Investigation of association of 13 polymorphisms in eight genes in southeastern African American Alzheimer disease patients as compared to age-matched controls. Am J Med Genet 105: , 332–342. |
[45] | Prince JA , Feuk L , Sawyer SL , Gottfries J , Ricksten A , Nägga K , Bogdanovic N , Blennow K , Brookes AJ ((2001) ) Lack of replication of association findings in complex disease: An analysis of 15 polymorphisms in prior candidate genes for sporadic Alzheimer’s disease. Eur J Hum Genet 9: , 437–444. |
[46] | Pirskanen M , Alafuzoff I , Hiltunen M , Mannermaa A , Helisalmi S , Lehtovirta M , Koivisto AM , Laakso M , Soininen H ((2001) ) An association between a subset of Finnish late-onset Alzheimer’s disease and alpha2-macroglobulin. Neurogenetics 3: , 171–172. |
[47] | McIlroy SP , Dynan KB , Vahidassr DJ , Lawson JT , Patterson CC , Passmore P ((2001) ) Common polymorphisms in LRP and A2M do not affect genetic risk for Alzheimer disease in Northern Ireland. Am J Med Genet 105: , 502–506. |
[48] | Shi J , Ma C , Lao H , Feng R , Guo Y , Mu N , Li Q , Tan Y , Wang D ((2001) ) No evidence for association between the alpha 2-macroglobulin polymorphism and Alzheimer’s disease in the Han Chinese [in Chinese]. Chin J Med Genet 18: , 299–302. |
[49] | Nicosia F , Alberici A , Benussi L , Gasparini L , Ghidoni R , Mazzoli F , Zanetti O , Frisoni GB , Geroldi C , Binetti G ((2001) ) Analysis of alpha-2-macroglobulin-2 allele as a risk factor in Alzheimer’s disease. Dement Geriatr Cogn Disord 12: , 305–308. |
[50] | Zimmer EL , Kamboh MI ((2001) ) Association of candidate genes on chromosome 12 in late-onset Alzheimer’s disease . Doctoral Dissertation. University of Pittsburgh, Pittsburgh, United States, p. 12. |
[51] | Janka Z , Juhász A , Rimanóczy A , Boda K , Márki-Zay J , Palotás M , Kuk I , Zöllei M , Jakab K , Kálmán J ((2002) ) Alpha2-macroglobulin exon 24 (Val-1000-Ile) polymorphism is not associated with late-onset sporadic Alzheimer’s dementia in the Hungarian population. Psychiatr Genet 12: , 49–54. |
[52] | Scacchi R , Ruggeri M , Gambina G , Martini MC , Corbo RM ((2002) ) Alpha2-macroglobulin deletion polymorphism and plasma levels in late onset Alzheimer’s disease. Clin Chem Lab Med 40: , 333–336. |
[53] | Poduslo SE , Shook B , Drigalenko E , Yin X ((2002) ) Lack of association of the two polymorphisms in alpha-2 macroglobulin with Alzheimer disease. Am J Med Genet 110: , 30–35. |
[54] | Zappia M , Cittadella R , Manna I , Nicoletti G , Andreoli V , Bonavita S , Gambardella A , Quattrone A ((2002) ) Genetic association of alpha2-macroglobulin polymorphisms with AD in southern Italy. Neurology 59: , 756–758. |
[55] | Clarimón J , Bertranpetit J , Calafell F , Boada M , Tàrraga L , Comas D ((2003) ) Joint analysis of candidate genes related to Alzheimer’s disease in a Spanish population. Psychiatr Genet 13: , 85–90. |
[56] | Styczynska M , Religa D , Pfeffer A , Luczywek E , Wasiak B , Styczynski G , Peplonska B , Gabryelewicz T , Golebiowski M , Kobrys M , Barcikowska M ((2003) ) Simultaneous analysis of five genetic risk factors in Polish patients with Alzheimer’s disease. Neurosci Lett 344: , 99–102. |
[57] | Chen D , Zhang JW ((2003) ) Gene association analysis of Alzheimer’s disease and cloning of aging-related genes in mice [in Chinese]. Doctoral Dissertation. Peking Union Medical College, Beijin, China. |
[58] | Zhang P , Yang Z , Wan CL , Zheng WD , Zhang CF , Li S , Lü ZP , Zheng CG , Jin F , Wang L ((2004) ) Neither the tumor necrosis factor alpha-308 A/G polymorphism nor the alpha2-macroglobulin polymorphism was associated with late-onset Alzheimer’s disease in the Chinese population [in Chinese]. Acta Genet Sin 31: , 1–6. |
[59] | Zhao XP , Xie HJ , Ding SJ , Zheng HM ((2004) ) Alpha-2 macroglobulin gene polymorphism in patients with Parkinson’s disease and Alzheimer’s disease [in Chinese]. Chin J Neurol 1: , 49–51. |
[60] | Camelo D , Arboleda G , Yunis JJ , Pardo R , Arango G , Solano E , López L , Hedmont D , Arboleda H ((2004) ) Angiotensin-converting enzyme and alpha-2-macroglobulin gene polymorphisms are not associated with Alzheimer’s disease in Colombian patients. J Neurol Sci 218: , 47–51. |
[61] | Shi JJ , Zhang SZ ((2004) ) [in Chinese]. Doctoral Dissertation. Sichuan University, Chengdu, China. Genetic polymorphisms in 6 candidate genes of sporadic Alzheimer’s and their association with the disease. |
[62] | Sleegers K , Roks G , Theuns J , Aulchenko YS , Rademakers R , Cruts M , van Gool WA , Van Broeckhove C , Heutink P , Oostra BA , van Swieten JC , van Duijn CM ((2004) ) Familial clustering and genetic risk for dementia in a genetically isolated Dutch population. Brain 127: , 1641–1649. |
[63] | Sun Y , Shi J , Zhang S , Tang M , Liu X , Wang Y , Han H , Guo Y , Deng H , Zhao Z , Ma C ((2005) ) No evidence for genetic association between alpha-2 macroglobulin I1000V polymorphism and sporadic Alzheimer’s disease in two independent Chinese populations [in Chinese]. Chin J Med Genet 22: , 174–179. |
[64] | Cai L , Tang G , Chen L , Zhang B , Jiang S , Ren D ((2005) ) Genetic studies of A2M and BACE1 genes in Chinese Han Alzheimer’s disease patients. Neuroreport 16: , 1023–1026. |
[65] | Bian L , Yang JD , Guo TW , Duan Y , Qin W , Sun Y , Feng GY , He L ((2005) ) Association study of the A2M and LRP1 Genes with Alzheimer disease in the Han Chinese. Biol Psychiatry 58: , 731–737. |
[66] | Chen YB , Wen ZH , Lai SL , Liang WX , Wang Q , Cheng SY , Hou MJ , Sun J ((2005) ) Association between low-density lipoprotein receptor-related protein (LRP) and alpha-2 macroglobulin (α2M) gene polymorphisms and Alzheimer’s disease: An elderly population-based study in Guangzhou of China [in Chinese]. Chin J Gerontol 9: , 1014–1017. |
[67] | Depboylu C , Lohmüller F , Du Y , Riemenschneider M , Kurz A , Gasser T , Müller U , Dodel RC ((2006) ) Alpha2-macroglobulin, lipoprotein receptor-related protein and lipoprotein receptor-associated protein and the genetic risk for developing Alzheimer’s disease. Neurosci Lett 400: , 187–190. |
[68] | Mariani E , Seripa D , Ingegni T , Nocentini G , Mangialasche F , Ercolani S , Cherubini A , Metastasio A , Pilotto A , Senin U , Mecocci P ((2006) ) Interaction of CTSD and A2M polymorphisms in the risk for Alzheimer’s disease. J Neurol Sci 247: , 187–191. |
[69] | Hong Y , Zhou XH , Ma L ((2008) ) Xin jiang Uygurs and Hans A2M gene polymorphism analysis of Alzheimer’s disease [in Chinese]. Chin J Nerv Ment Dis 6: , 334–337. |
[70] | Han B , Zhang SL ((2008) ) Association of apoE gene, A2M gene and ACE gene polymorphism with Alzheimer’s disease [in Chinese]. J Shanxi Med Univ 8: , 692–696+710. |
[71] | Colacicco AM , Solfrizzi V , D’Introno A , Capurso C , Kehoe PG , Seripa D , Pilotto A , Santamato A , Capurso A , Panza F ((2009) ) Alpha-2-macroglobulin gene, oxidized low-density lipoprotein receptor-1 locus, and sporadic Alzheimer’s disease. Neurobiol Aging 30: , 1518–1520. |
[72] | Bruno E , Quattrocchi G , Nicoletti A , Le Pira F , Maci T , Mostile G , Andreoli V , Quattrone A , Zappia M ((2010) ) Lack of interaction between LRP1 and A2M polymorphisms for the risk of Alzheimer disease. Neurosci Lett 482: , 112–116. |
[73] | Yuan Q , Wang F , Xue S , Jia J ((2013) ) Association of polymorphisms in the LRP1 and A2M genes with Alzheimer’s disease in the northern Chinese Han population. J Clin Neurosci 20: , 253–256. |
[74] | Michałowska-Wender G , Wawrzynek A , Rossa G , Kozubski W , Wender M ((2014) ) On the lack of a clear-cut association between alpha-2-macroglobulin deletion and the risk of Alzheimer disease in Poland. Folia Neuropathol 52: , 417–420. |
[75] | Zamani M , Mohammadi M , Zamani H , Tavasoli A ((2016) ) Pharmacogenetic study on the impact of rivastigmine concerning genetic variants of A2M and IL-6 genes on Iranian Alzheimer’s patients. Mol Neurobiol 53: , 4521–4528. |
[76] | Grangeon L , Charbonnier C , Zarea A , Rousseau S , Rovelet-Lecrux A , Bendetowicz D , Lemaitre M , Malrain C , Quillard-Muraine M , Cassinari K , Maltete D , Pariente J , Moreaud O , Magnin E , Cretin B , Mackowiak MA , Sillaire AR , Vercelletto M , Dionet E , Felician O , Rod-Olivieri P , Thomas-Antérion C , Godeneche G , Sauvée M , Cartz-Piver L , Le Ber I , Chauvire V , Jonveaux T , Balageas AC , Laquerriere A , Duyckaerts C , Vital A , de Paula AM , Meyronet D , Guyant-Marechal L , Hannequin D , Tournier-Lasserve E , Campion D , Nicolas G , Wallon D ((2023) ) Phenotype and imaging features associated with APP duplications. Alzheimers Res Ther 15: , 93. |
[77] | Cater JH , Wilson MR , Wyatt AR ((2019) ) Alpha-2-macroglobulin, a hypochlorite-regulated chaperone and immune system modulator. Oxid Med Cell Longev 2019: , 5410657. |
[78] | Lagrange J , Lecompte T , Knopp T , Lacolley P , Regnault V ((2022) ) Alpha-2-macroglobulin in hemostasis and thrombosis: An underestimated old double-edged sword. J Thromb Haemost 20: , 806–815. |
[79] | Ozawa D , Hasegawa K , Lee YH , Sakurai K , Yanagi K , Ookoshi T , Goto Y , Naiki H ((2011) ) Inhibition of beta2-microglobulin amyloid fibril formation by alpha2-macroglobulin. J Biol Chem 286: , 9668–9676. |
[80] | Qiu G , Cao L , Chen YJ ((2023) ) Novel heterozygous mutation in alpha-2-macroglobulin (A2M) suppressing the binding of amyloid-β (Aβ). Front Neurol 13: , 1090900. |
[81] | Saunders AJ , Bertram L , Mullin K , Sampson AJ , Latifzai K , Basu S , Jones J , Kinney D , MacKenzie-Ingano L , Yu S , Albert MS , Moscarillo TJ , Go RC , Bassett SS , Daly MJ , Laird NM , Wang X , Velicelebi G , Wagner SL , Becker DK , Tanzi RE , Blacker D ((2003) ) Genetic association of Alzheimer’s disease with multiple polymorphisms in alpha-2-macroglobulin. Hum Mol Genet 12: , 2765–2776. |
[82] | Kovacs DM ((2000) ) alpha2-macroglobulin in late-onset Alzheimer’s disease. Exp Gerontol 35: , 473–479. |
[83] | Heneka MT , Carson MJ , El Khoury J , Landreth GE , Brosseron F , Feinstein DL , Jacobs AH , Wyss-Coray T , Vitorica J , Ransohoff RM , Herrup K , Frautschy SA , Finsen B , Brown GC , Verkhratsky A , Yamanaka K , Koistinaho J , Latz E , Halle A , Petzold GC , Town T , Morgan D , Shinohara ML , Perry VH , Holmes C , Bazan NG , Brooks DJ , Hunot S , Joseph B , Deigendesch N , Garaschuk O , Boddeke E , Dinarello CA , Breitner JC , Cole GM , Golenbock DT , Kummer MP ((2015) ) Neuroinflammation in Alzheimer’s disease. Lancet Neurol 14: , 388–405. |
[84] | del Río-Espínola A , Fernández-Cadenas I , Giralt D , Quiroga A , Gutiérrez-Agulló M , Quintana M , Fernández-Álvarez P , Domingues-Montanari S , Mendióroz M , Delgado P , Turck N , Ruíz A , Ribó M , Castellanos M , Obach V , Martínez S , Freijo MM , Jiménez-Conde J , Cuadrado-Godia E , Roquer J , Chacón P , Martí-Fábregas J , Sánchez JC , Montaner J ((2012) ) A predictive clinical-genetic model of tissue plasminogen activator response in acute ischemic stroke. Ann Neurol 72: , 716–729. |
[85] | Miyashita A , Kikuchi M , Hara N , Ikeuchi T ((2023) ) Genetics of Alzheimer’s disease: An East Asian perspective. J Hum Genet 68: , 115–124. |
[86] | Neu SC , Pa J , Kukull W , Beekly D , Kuzma A , Gangadharan P , Wang LS , Romero K , Arneric SP , Redolfi A , Orlandi D , Frisoni GB , Au R , Devine S , Auerbach S , Espinosa A , Boada M , Ruiz A , Johnson SC , Koscik R , Wang JJ , Hsu WC , Chen YL , Toga AW ((2017) ) Apolipoprotein E genotype and sex risk factors for Alzheimer disease: A meta-analysis. JAMA Neurol 74: , 1178–1189. |
[87] | Tsiknia AA , Sundermann EE , Reas ET , Edland SD , Brewer JB , Galasko D , Banks SJ ((2022) ) Sex differences in Alzheimer’s disease: Plasma MMP-9 and markers of disease severity. Alzheimers Res Ther 14: , 160. |
[88] | Buckley RF , Mormino EC , Rabin JS , Hohman TJ , Landau S , Hanseeuw BJ , Jacobs HIL , Papp KV , Amariglio RE , Properzi MJ , Schultz AP , Kirn D , Scott MR , Hedden T , Farrell M , Price J , Chhatwal J , Rentz DM , Villemagne VL , Johnson KA , Sperling RA ((2019) ) Sex differences in the association of global amyloid and regional tau deposition measured by positron emission tomography in clinically normal older adults. JAMA Neurol 76: , 542–551. |
[89] | Chopra V , Anand S , Hickner A , Buist M , Rogers MA , Saint S , Flanders SA ((2013) ) Risk of venous thromboembolism associated with peripherally inserted central catheters: A systematic review and meta-analysis. Lancet 382: , 311–325. |


