
Dimethyl Fumarate Exerts a Neuroprotective Effect by Enhancing Mitophagy via the NRF2/BNIP3/PINK1 Axis in the MPP+ Iodide-Induced Parkinson’s Disease Mice Model
Abstract
Background:
Parkinson’s disease (PD) is a progressive neurodegenerative disorder linked to the loss of dopaminergic neurons in the substantia nigra. Mitophagy, mitochondrial selective autophagy, is critical in maintaining mitochondrial and subsequently neuronal homeostasis. Its impairment is strongly implicated in PD and is associated with accelerated neurodegeneration.
Objective:
To study the positive effect of dimethyl fumarate (DMF) on mitophagy via the NRF2/BNIP3/PINK1 axis activation in PD disease models.
Methods:
The neuroprotective effect of DMF was explored in in vitro and in vivo PD models. MTT assay was performed to determine the DMF dose followed by JC-1 assay to study its mitoprotective effect in MPP+ exposed SHSY5Y cells. For the in vivo study, C57BL/6 mice were divided into six groups: Normal Control (NC), Disease Control (DC), Sham (Saline i.c.v.), Low Dose (MPP+ iodide+DMF 15 mg/kg), Mid Dose (MPP+ iodide+DMF 30 mg/kg), and High Dose (MPP+ iodide+DMF 60 mg/kg). The neuroprotective effect of DMF was assessed by performing rotarod, open field test, and pole test, and biochemical parameter analysis using immunofluorescence, western blot, and RT-PCR.
Results:
DMF treatment significantly alleviated the loss of TH positive dopaminergic neurons and enhanced mitophagy by increasing PINK1, Parkin, BNIP3, and LC3 levels in the MPP+ iodide-induced PD mice model. DMF treatment groups showed good locomotor activity and rearing time when compared to the DC group.
Conclusions:
DMF confers neuroprotection by activating the BNIP3/PINK1/Parkin pathway, enhancing the autophagosome formation via LC3, and improving mitophagy in PD models, and could be a potential therapeutic option in PD.
INTRODUCTION
Neurological disorders are the leading cause of disability, and Parkinson’s disease (PD) is the fastest growing of these disorders [1]. First described by James Parkinson in 1817 in “An Essay on the Shaking Palsy” [2], PD is a progressive neurodegenerative disorder clinically associated with significant motor symptoms like resting tremor, rigidity, postural instability, and bradykinesia and non-motor symptoms like cognitive changes, autonomic dysfunction, sleep disturbances, and sensory pain [3]. The prevalence of PD increased by 21.7% from 1990 to 2016, making it the second most common neurodegenerative disorder after Alzheimer’s disease. As many as 6.1 million people were affected by PD globally in 2016 over 65 years, and it is expected to rise to 9.3 million in 2030 [4, 5].
PD is associated with the selective loss of dopaminergic neurons in substantia nigra pars compacts (SNpC) in the midbrain, and the accumulation of Lewy bodies, the cytoplasmic inclusions from insoluble α-syn aggregates [6]. The pathophysiology of PD is complex and multifactorial because of variable contributions from genetic and environmental factors [7], leading to oxidative stress [8], mitochondrial dysfunction [9, 10], neuroinflammation [11, 12], disturbed protein homeostasis [13], and reduced neurotransmitter levels [3]. Among these, dysfunctional protein degradation pathways commonly termed as autophagy pathways are vital in PD pathology, as neurons depend on them to maintain the effective turnover of the proteins and damaged organelles to prevent toxicity and cell death [14].
Mitophagy refers to mitochondria selective autophagy that is activated in response to various mitochondrial stressors like mitochondrial depolarization, ER stress and selectively degrades damaged mitochondria [15, 16]. Mitophagy can be broadly classified into Parkin-dependent and Parkin-independent pathways. In Parkin dependent pathway, accumulation of PINK1 on the mitochondrial outer membrane (OMM) as a result of mitochondrial depolarization leads to subsequent phosphorylation of parkin and activation of its E3 ligase activity, which then ubiquitinates several OMM substrates like TBK1 [17, 18]. These ubiquitinated proteins recruit the autophagy receptor proteins like OPTN, NDP52 and eventually result in LC3-coated autophagosome formation [19]. In contrast, parkin-independent pathway, operates on the presence of LC-3 interacting region (LIR) motifs present on several OMM proteins like AMBRA1 [20], FUNDC1 [21], BNIP3 like (BNIP3L/NIX) protein [22], BNIP3 which upon activation interact with ATG8 protein resulting in autophagosome formation [23]. Mitophagy is critical in order to maintain the mitochondrial homeostasis, the failure of which leads to the accumulation of damaged mitochondria and accelerates PD pathology [24]. Mitophagy is found to be compromised in several NDDs including PD [25]. Treatments aimed at restoring autophagy especially mitophagy have shown to be neuroprotective in the case of PD [26, 27].
Several proteins were identified to play role in regulation of autophagy. BCL2 interacting protein 3 (BNIP3) is a nuclear encoded protein that exerts its functions by interacting with various OMM proteins. It plays a crucial role in the regulation of apoptosis, autophagy, and mitophagy. BNIP3 has been found to regulate mitophagy in hypoxia dependent manner in tumor cells [28]. It contains the LIR motif which enables it to regulate mitophagy via parkin-independent pathway. BNIP3 protein levels were found to be decreased in PD [29]. Recently Zhang et al. have shown that increased BNIP3 binds to PINK1 and decreases the proteolytic cleavage of PINK1 resulting in activation of parkin-dependent mitophagy [30]. Hence activating BNIP3 would promote mitophagy via both pathways. NRF2 (Nuclear factor E2-related factor 2), a basic leucine-zipper transcription factor, majorly promotes cellular defense mechanisms against oxidative and electrophilic stresses, and its role in autophagy has been explored widely [31]. Recently, a study concluded that autophagy was restored by NRF2-mediated BNIP3 upregulation through IGF-1 signaling [32]. Dimethyl fumarate (DMF), an NRF2 activator, is an FDA-approved drug for psoriasis and multiple sclerosis. It exhibited antioxidant, anti-inflammatory, immunomodulatory, neuroprotective, and cognition-enhancing properties in PD and Alzheimer’s disease models [33–37]. The robust bioavailability and therapeutic efficacy of DMF is mediated by its potent metabolite MMF through the activation of NRF2 pathway, a key transcription factor involved in antioxidant response [38]. In our previous study, we have shown that DMF modulates autophagy via NRF2-TIGAR-LAMP2/Cathepsin D pathway in rotenone induced PD model [39]. Similarly, inducing NRF2 through the administration of DMF can be used to directly induce BNIP3, PINK1/PARKIN expression in the PD disease model and promote mitophagy.
METHODS
Materials used include: MPP+Iodide (Abcam), dimethyl fumarate (DMF) (Sigma Aldrich), JC-1 stain (Invitrogen, 3168), MTT (Invitrogen, M6494), DMSO (Sigma-Aldrich, D8418), Chemiluminescence western blotting substrate (Bio-Rad Laboratories, 1705061), Sucrose (Hi-media, MB025), OCT media (Sigma-Aldrich, SHH0026), T-PER extraction buffer (ThermoFisher, 78510), protease inhibitor (Sigma-Aldrich, P8340), Nitrocellulose membrane (GC-NCM-302), Bovine serum albumin (SRL, A6003), anti-Tyrosine Hydroxylase (TH) (Santa Cruz Biotechnology, sc25269), anti-α-synuclein (Santa Cruz Biotechnology, sc53955), anti-β-actin (Santa Cruz Biotechnology, sc47778), anti-NRF1 (Cell Signaling Technology, 12381S), anti-NRF2 (Sigma-Aldrich, SAB5700720), anti-PINK1 (Santa Cruz Biotechnology, sc517353), anti-Parkin (Santa Cruz Biotechnology, sc30130), LC-3A/B (Cell Signaling Technology, 12741S), anti-mouse Alexa flour 488 (A21202LC3), BECLIN-1 (3495S), BCL2 (NBP2-67182), anti-mouse secondary antibody (HRP-conjugated) (7076s), anti-rabbit secondary (HRP-conjugated) (AP307P), fluoroshield DAPI (F6057), Alexa fluor 488 Donkey Anti-Mouse IgG (H + L) (A-11008). All the chemicals used in the study were obtained from commercial vendors unless otherwise specified.
Cell culture
Human neuroblastoma cell line SHSY5Y was procured from the National Centre of Cell Science (NCCS) Pune, India. SHSY5Y cells were maintained in MEM+F12 (1 : 1) media with 10% Fetal Bovine Serum (FBS) at 37°C in an incubator with 5% CO2 and 95% air. The culture media was replaced every three days and sub cultured upon 80–90% confluency for further use or plated as per the experimental requirements [34, 40].
Cell viability assay (MTT ASSAY)
MTT (3–[4, 5-dimethylthiazol-2-yl]-2,5-diphenyl tetrazolium bromide) assay was performed to assess the cell viability. SHSY5Y cells were plated at a density of 10000–20000 cells per well into 96 well microplate and incubated for 24 h for adhesion. The cells were treated with different concentrations of MPP+ iodide (100–5000μM) and DMF (10–100μM) diluted in DMEM media and incubated for 24 h at 37°C with 5–6.5% CO2. The media containing MPP+ iodide was discarded and MTT reagent (0.5 mg/ml in DMEM) was added and incubated for 4 h at 37°C with 5% CO2 . The formed formazan crystals were solubilized using 150μl DMSO, and the absorbance was measured at 570 nm using a microplate reader. The intensity of the color the formazan crystals show, determines the % viability of the cells [41].
JC-1 assay
JC-1 (5,5’,6,6’-tetraethylbenzaimidazolcarbocyanine iodide) assay was used to determine the mitochondrial membrane potential, which signifies the functional state of the mitochondria within the cells. The cells were subcultured in a 6-well plate and incubated for 24 h at 37°C for the groups, NC: Normal control, DC: MPP+ (500μM), LD: MPP+ (500μM)+DMF (15μM), MD: MPP+ (500μM)+DMF (30μM), HD: MPP+ (500μM)+DMF (45μM), HD only: DMF (45μM). The doses were chosen based on the results obtained from MTT assay. The cells were pretreated with DMF (15μM, 30μM, 45μM) for 3 h followed by treatment with 500μM of MPP+ iodide and incubated overnight. Then the media was removed, 10μM JC-1 dye was added and incubated for 20 min. Then, the cells were washed with PBS and observed under fluorescent microscope.
Animals
Table 1
Experimental animal groups
| No. | Treatment Group | No. of Animals |
| 1 | Normal Control | 12 |
| 2 | Disease Control (MPP+ iodide, 18μg/3μl, i.c.v) | 12 |
| 3 | Sham Control (Saline, 3μl, i.c.v) | 12 |
| 4 | Low dose group (MPP+ iodide+DMF 15 mg/kg p.o. in saline) | 12 |
| 5 | Mid dose group (MPP+ iodide+DMF 30 mg/kg p.o. in saline) | 12 |
| 6 | High dose group (MPP+ iodide+DMF 60 mg/kg p.o. in saline) | 12 |
Healthy male C57BL6 mice weighing 20–25 g at 8 weeks of age were utilized for this study. They were maintained under standard laboratory conditions of 12 : 12-h light/dark cycle, 25±1°C, relative humidity 60±10% with standard food and filtered water ad libitum. All the experiments were conducted in accordance with the ARRIVE guidelines regulations specified by the Institutional Animal Ethics Committee (IAEC)-NIPER Hyderabad with the approved animal protocol number NIP/010/2022/PC/496.
MPP+ iodide-induced PD and DMF treatment in study animals
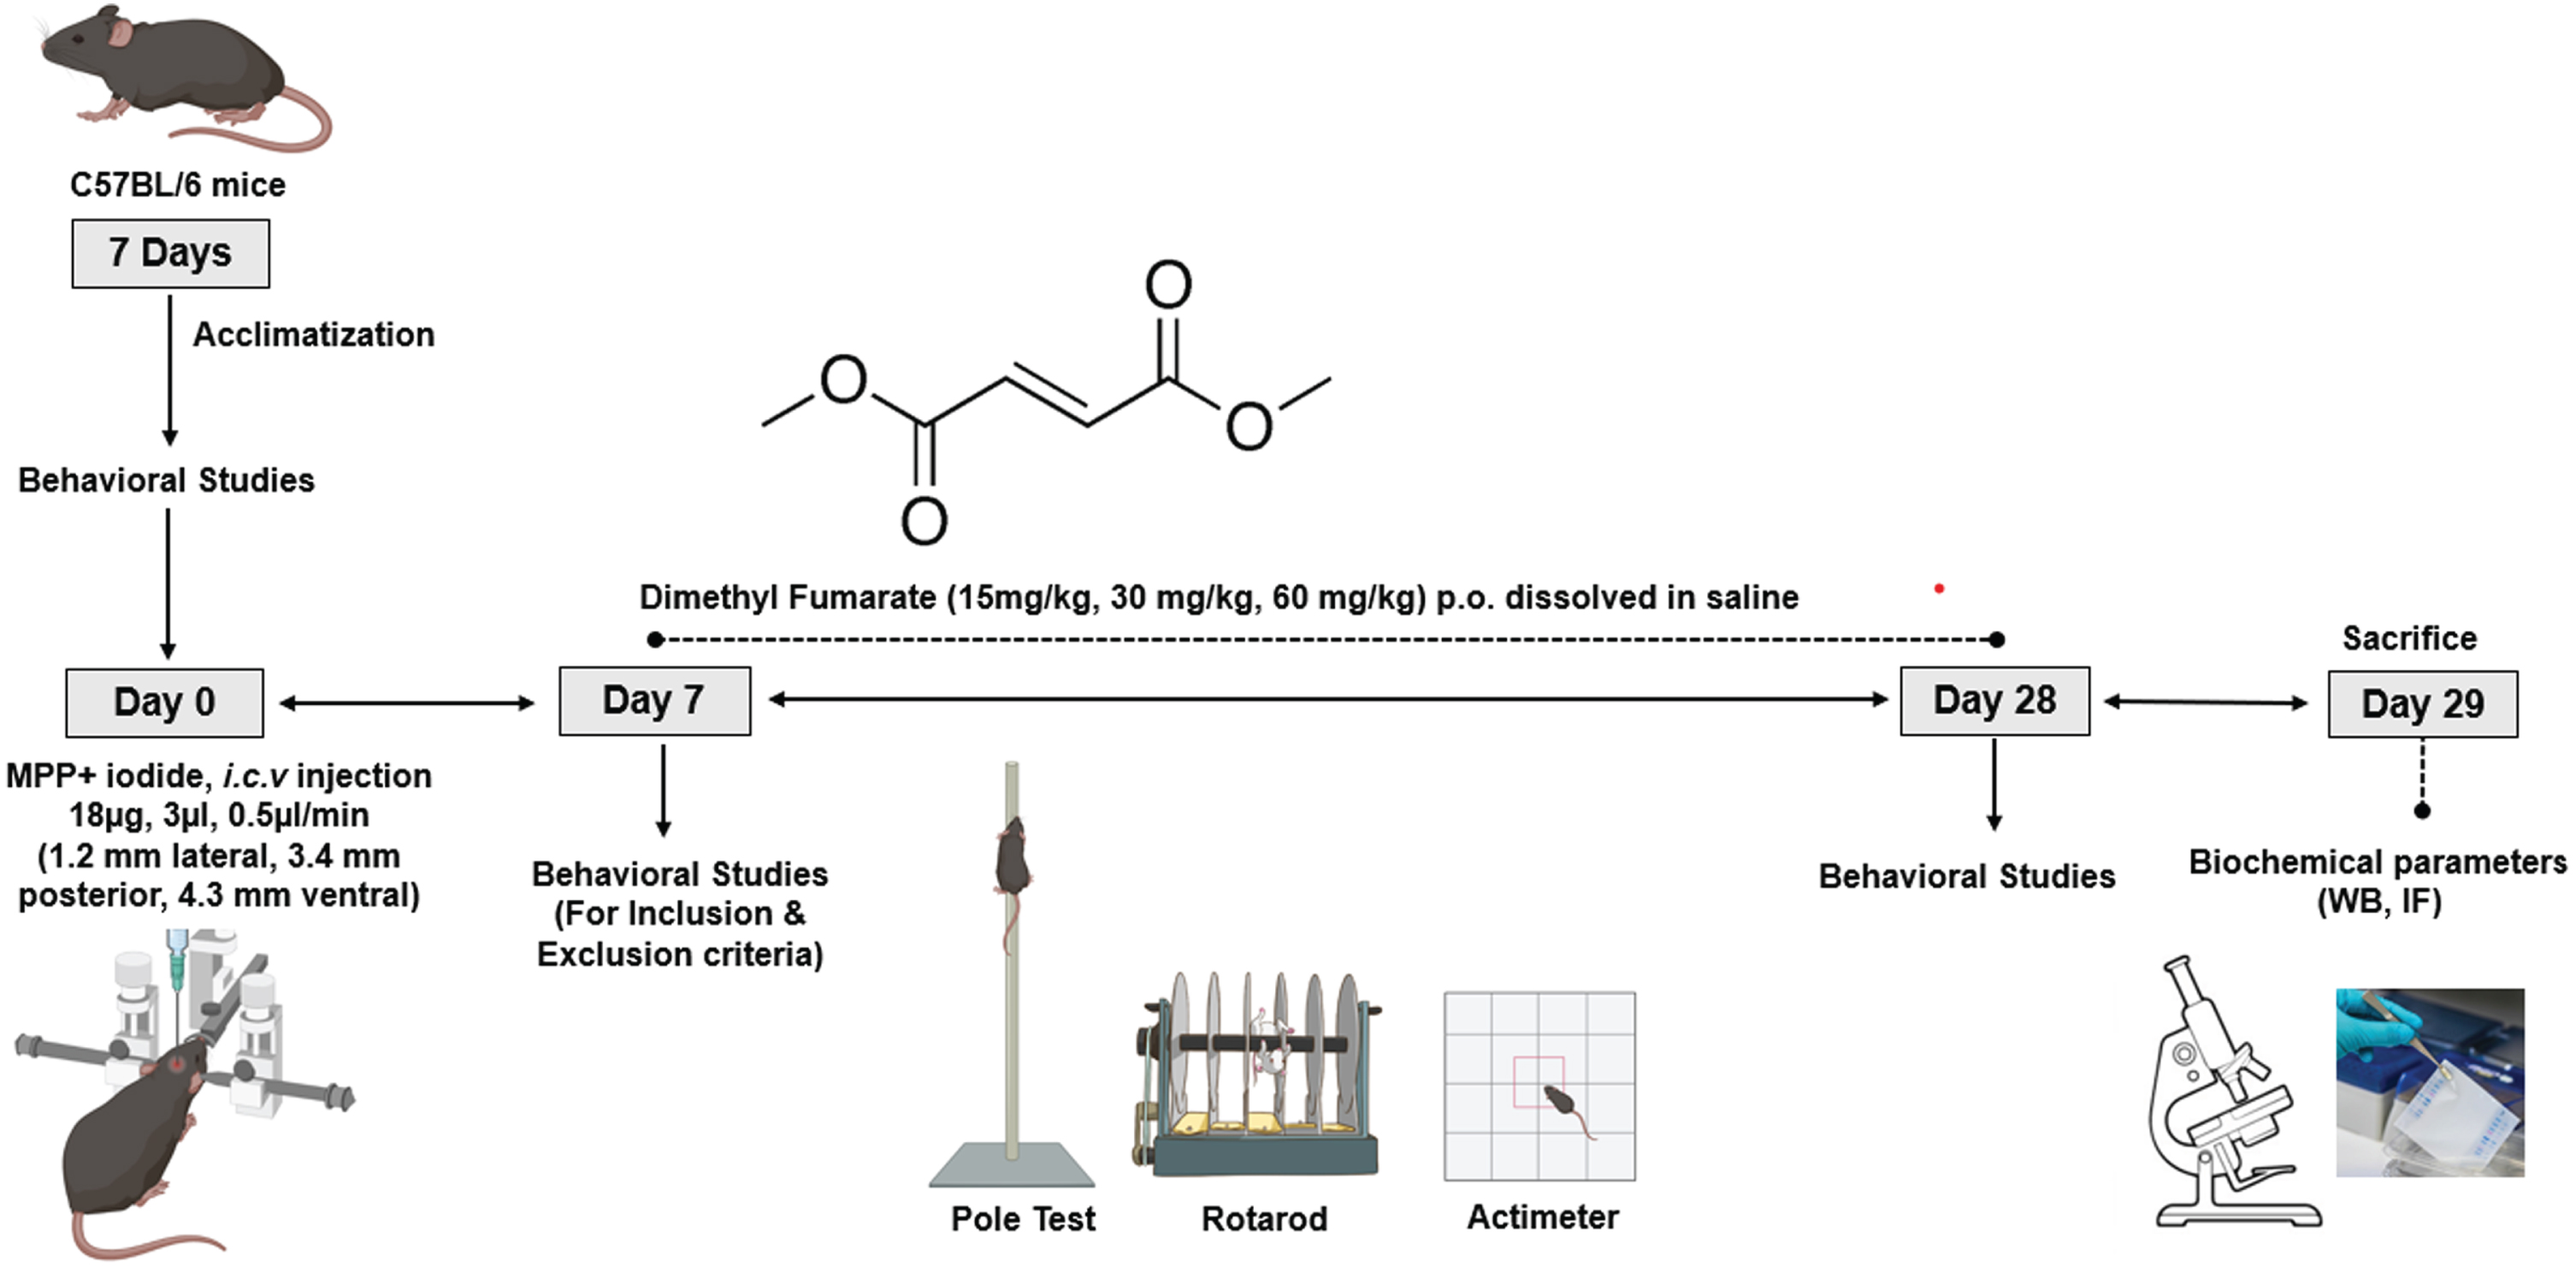
The animals were divided into 6 groups with 12 animals in each group (Table 1). The mice were induced with PD using MPP+ iodide (Abcam, Cambridge, UK) with a single dose of 18μg/3μl [43, 44] at a rate of 0.5μl/min using the stereotaxic apparatus. The animals were anesthetized by using a combination of Ketamine (100 mg/kg) and Xylazine (10 mg/kg) i.p. before proceeding with stereotaxis under aseptic conditions. The head skin was shaved to expose the skin covering the skull. The animal was then mounted on the head stage using ear bars. After disinfecting the skin using 70% alcohol, an incision was made with the blade to expose the skull, and bregma was located. With respect to bregma, a burr hole was made at co-ordinates Mediolateral: –1.2 mm, Anteroposterior: 3.4 mm, and Dorsoventral: –4.3 mm (corresponding to the SNpC region of the brain) [45] to enable the entry of the Hamilton syringe. The burr hole was closed with dental cement, and the cut was sealed with endocrylate. Throughout the surgery, the vitals of the animal were closely monitored, and the eyes were kept moist using saline solution. Sufficient antibacterial powder was applied to the surgical site, and the animals were placed on heating pads to avoid heat loss. Diclofenac (10 mg/kg, i.p.), moistened food, and isotonic solutions were given as a part of post-operative care for 7 days. DMF (Sigma-Aldrich, St. Louis, MO) was administered for 21 days at 15, 30, and 60 mg/kg (p.o. in saline) after completion of 7 days of post-operative care. After DMF treatment period for 21 days, the mice were anesthetized with isoflurane intranasally and then decapitated with and without perfusion using large bandage scissors; their brains were isolated and stored for further processing. The study design was given in Fig. 1.
Fig. 1
Study timeline.
Neurobehavioral tests
Rotarod test
Coordinated motor skills and ability to balance are evaluated by using the rotarod test, which requires the animals to walk on an accelerating cylinder to mark the maximal duration of time the animal lasted on the rod [46]. The test was conducted on day 0, day 7, and after the DMF treatment period (day 28). The mice were trained for 3 days prior to the procedure wherein they were allowed to walk on the apparatus for 120 s at 5 RPM. During the test procedure, the animals were placed on an accelerating rod at 40 RPM for 300 s [47]. The time spent on the revolving rod by animals, i.e., latency to fall was measured in three trials per day with 15 min time intervals, and the average latency to fall was recorded.
Actophotometer
An automated actimeter (Panlab Apparatus, Barcelona, Spain) was used to assess the spontaneous locomotor activity of the animal. The equipment comprised of 22.5×22.5 cm area with 16 surrounding infrared beams attached to a computerized control unit [48]. After 1 min of habituation, the locomotor activity was recorded for a period of 10 min in a dark room. Various parameters like the distance travelled, the number of rearing, mean velocity, and resting time were assessed by employing Acti-Track software.
Pole test
Pole test was used to evaluate motor function by using a 50 cm-long wooden pole wrapped with bandage gauze. The pole was placed in the plastic cage and filled with corn bedding. Initially, the animals were trained for two consecutive days. Later, the animals were placed on the pole, and the time taken to descend, i.e., its posterior limbs touching the ground, was noted. They were tested three times, separated by a time period of 15 min, and the average value was considered for the statistical analysis [49, 50].
Biochemical experiments
Western blotting
80 mg of mid-brain tissue was homogenized using TPER buffer and Protease Inhibitor (25X) combination of volume 10 times the weight of the tissue, left undisturbed in ice for an hour and centrifuged at 12000 rpm for 20 min at 4°C, and the supernatant was collected. BCA assay was performed to estimate the total protein content in the tissue homogenate. The sample was prepared in Laemmle buffer at 95°C for 15 min and immediately transferred to 4°C.
The samples containing 30μg were loaded, SDS-PAGE was run and the proteins were transferred to the nitrocellulose membrane. The membrane was blocked using 3% BSA for 1-2 h, followed by overnight incubation in the following primary antibodies at 4°C: Anti-NRF2 (Sigma Aldrich, 1 : 1000), Anti-BNIP3 (Sigma Aldrich, 1 : 1000), TH (Santa Cruz, 1 : 2500), β-actin (Santa Cruz, 1 : 1000), α-synuclein (Santa Cruz, 1 : 500), NRF1 (Santa Cruz, 1 : 2500), PINK1 (Santa Cruz, 1 : 500), PARKIN (Santa Cruz, 1 : 500), LC3 (CST, 1 : 1000), BECLIN-1 (Santa Cruz, 1 : 1000), BCL2 (Santa Cruz, 1 : 500). Then, blots were incubated with HRP-conjugated anti-mouse (CST) and anti-rabbit (Santa Cruz) secondary antibody (1 : 10000 dilution) before visualizing using ECL reagent through chemiluminescence [39]. The relative band densities were quantified by densitometry using Image J analyzing software (Image J 1.53 k, National Institute of Health, Bethesda, MD, USA). Equal loading of protein was confirmed by measuring β-actin expression [51].
Immunofluorescence
The mid brain region of 4% PFA-perfused and sucrose-processed brains were used for immunofluorescence. Tissue sections were taken using Cryotome (Leica CM 1950) and mounted on gelatin-coated slides. The slides containing sections were first incubated in 100% methanol/acetone (chilled at –20°C) at room temperature for 10 min followed by washing with ice-cold PBS (5 min, 3 times), blocking with 3% BSA for a time period of 45 min. The sections were incubated in TH primary antibody (Santa Cruz, 1 : 200 dilution using 1% BSA in PBST) overnight at 4°C followed incubation in Alexa Fluor 488 secondary antibody (Invitrogen, 1 : 2000 dilution using 1% BSA in PBST) for 2 h in the dark at room temperature. The sections were counterstained with fluoroshield DAPI and visualized under the fluorescent microscope (Olympus, BX53) [39].
RT-PCR
Total RNA was extracted from 100 mg of the study animals’ midbrain tissue using TRI reagent (Sigma Aldrich), chloroform, isopropyl alcohol and quantified in Nanodrop 2000c spectrophotometer (Thermo scientific). cDNA was synthesized from the obtained RNA samples using Prime script 1st strand cDNA synthesis kit (Takara) in thermal cycler (BIO-RAD T100trademark Thermal Cycler). Real time PCR was performed for TH, SNCA using TB Green Premix Ex Taqtrademark II (Tli RNaseH Plus) kit (Takara) as per the manufacturer’s instructions in Quantstudio 7 Pro (Applied biosystems by Thermo Scientific). Primers for GAPDH, TH, SNCA were obtained from Eurogentec and sequences for the same are given in Table 2. Relative mRNA expression for TH, SNCA was calculated using LIVAK method using GAPDH as endogene control.
Table 2
Primer sequences used for RT-PCR
| Primer | Sequence |
| GAPDH forward primer | 5’ TGT-GAA-CGG-ATT-TGG-CCG-TA 3’ |
| GAPDH reverse primer | 5’ ACT-GTG-CCG-TTG-AAT-TTG-CC 3’ |
| TH forward primer | 5’ AAG-CTG-ATT-GCA-GAG-ATT-GCC 3’ |
| TH reverse primer | 5 ’TTC-CTC-CTT-TGT-GTA-TTC-CAC-GT 3’ |
| SNCA forward primer | 5’ TAT-CTG-CGC-GTG-TGC-TTG-G 3’ |
| SNCA reverse primer | 5’ ACT-TTC-CGA-CTT-CTG-GCT-GC 3’ |
Statistical analysis
All the data was expressed as the Mean±Standard error of mean (SEM) for animals. The results were statistically analyzed using one-way analysis of variance (ANOVA) utilizing the GraphPad Prism Version-8.0 software. Post hoc analysis was done with “Bonferroni’s Multiple Comparison Test.” A probability level of p values < 0.05 was considered as statistically significant.
RESULTS
Effect of MPP+ iodide and DMF on cell viability of SHSY5Y cell line
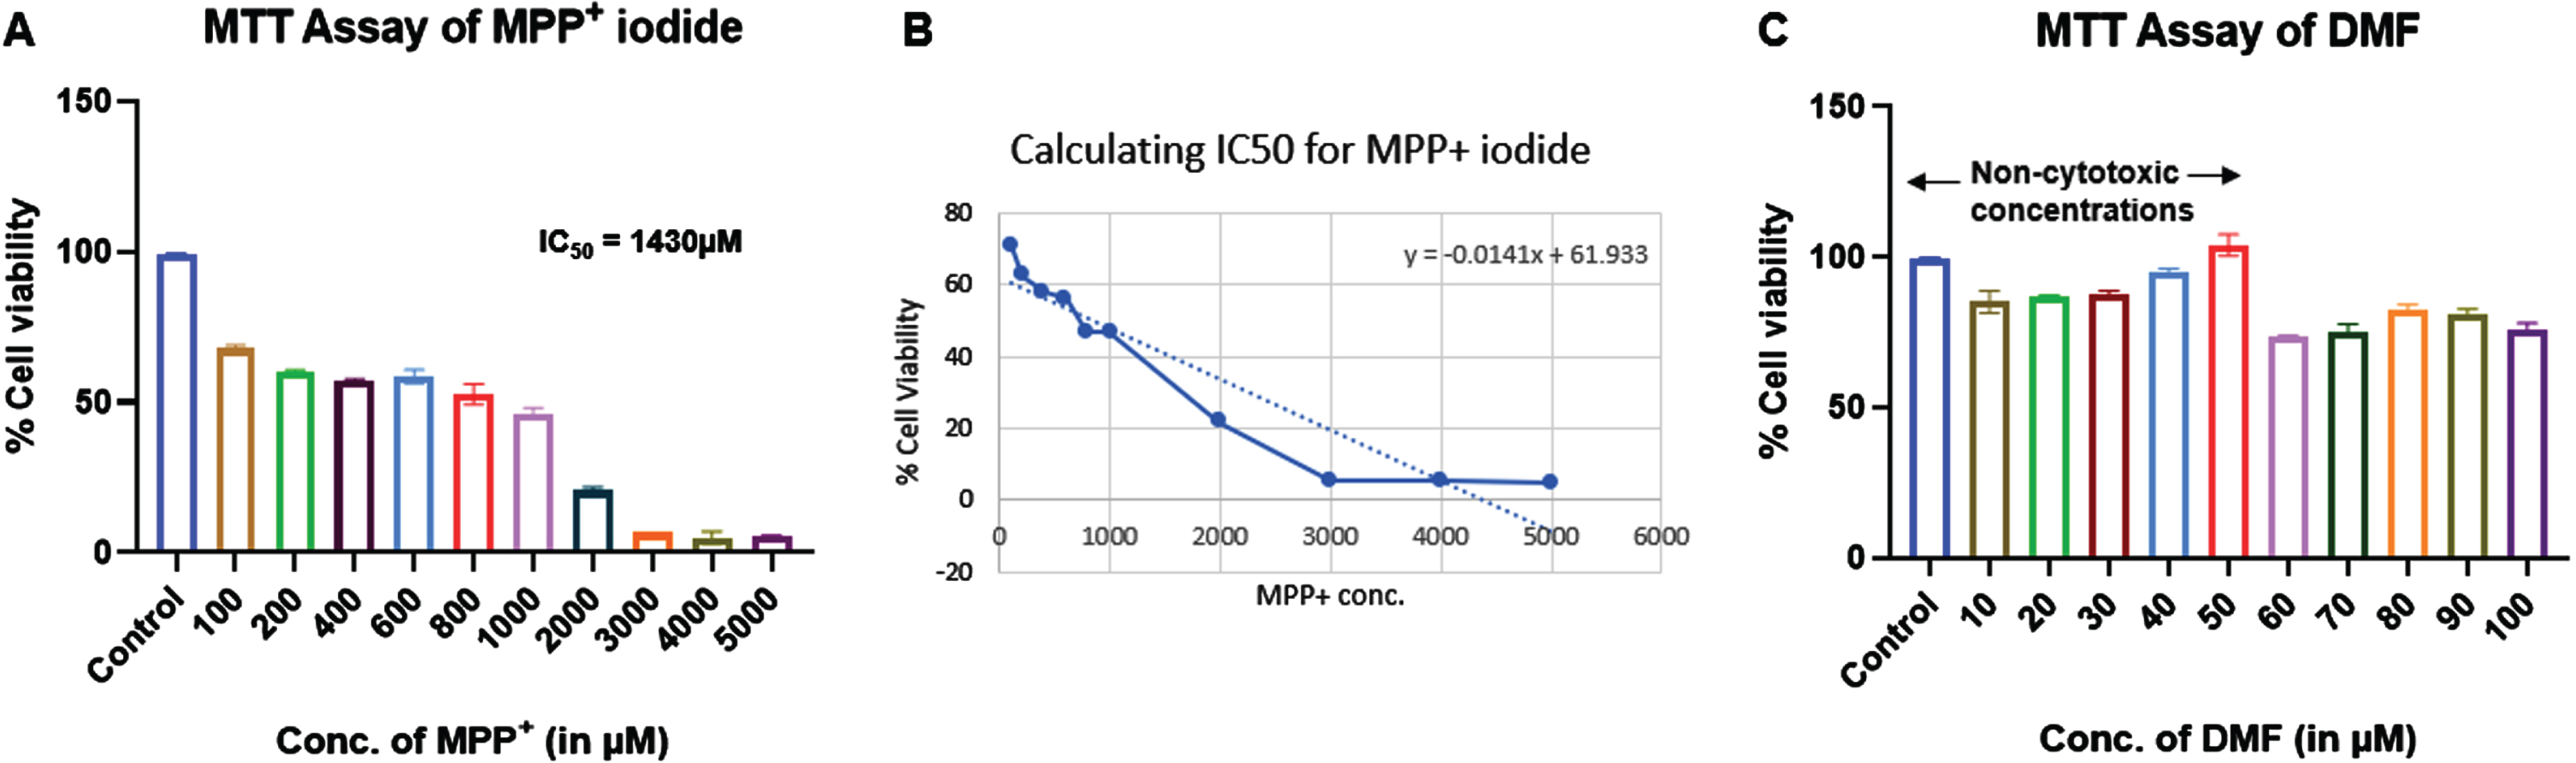
MTT assay of MPP+ iodide and DMF was performed on SHSY5Y cell line to identify the cytotoxic concentrations. IC50 of MPP+ iodide was found to be 1430μM. We used 500μM at which more 50% cell viability was observed for further experiments. Similarly, 10–50μM concentrations of DMF showed no cytotoxic effects and were used for further experiments (Fig. 2).
Fig. 2
Effect of MPP+ iodide and DMF on cell viability of SHSY5Y cell line (n = 3). A) MTT assay of MPP+ iodide, B) IC50 of MPP+ iodide, C) MTT assay of DMF.
DMF maintained the mitochondrial membrane potential (MMP) in MPP+ exposed SHSY5Y cell line
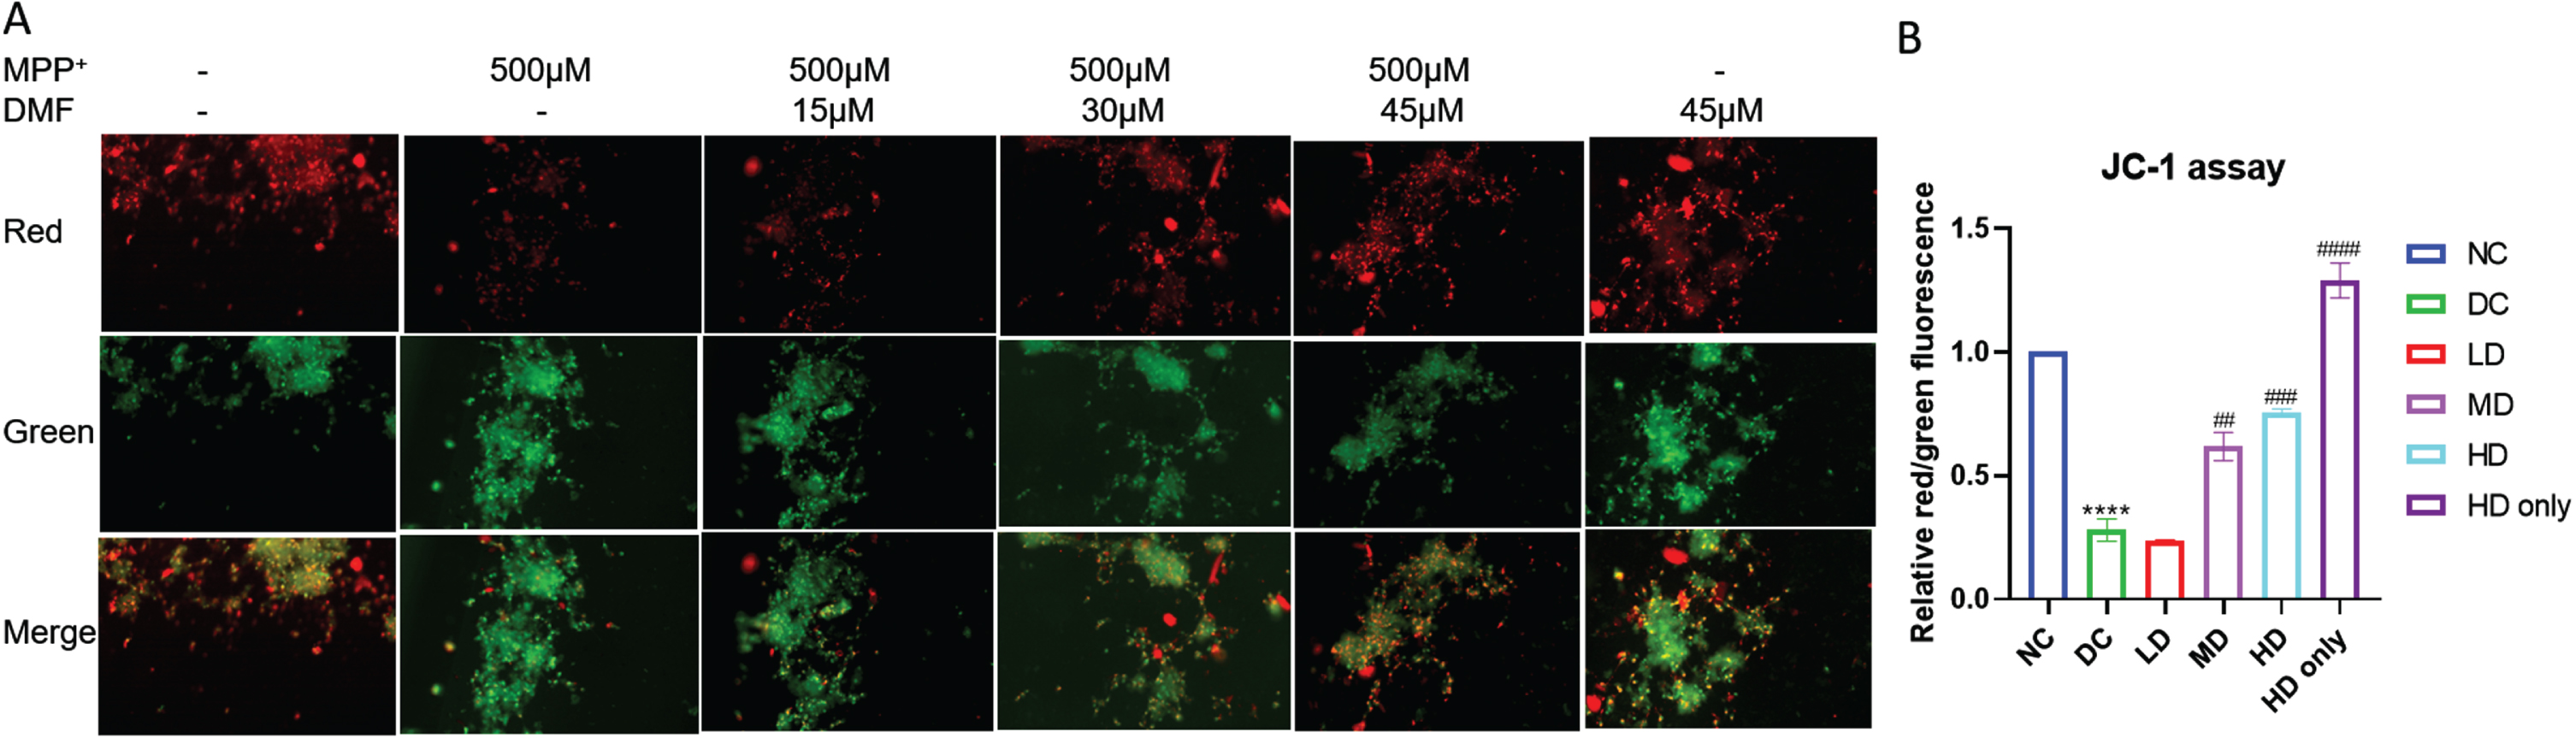
Pretreatment with DMF significantly maintained the mitochondrial integrity in MPP+ exposed SHSY5Y cells. The red:green fluorescence was low in MPP+ exposed cells (DC) indicating the loss of MMP, whereas the ratio increased in DMF treated groups in dose dependent manner (Fig. 3). The results show that 30μM and 45μM DMF exerted maximum mito-protective effect by preserving mitochondrial membrane integrity in MPP+ exposed SHSY5Y cells.
Fig. 3
Mitochondrial membrane potential (JC-1) assay. A) Representative image of red and green fluorescence intensities in various groups. B) Relative red/green fluorescence intensity in various groups (DF = 6). n = 2; Data represent mean±SEM. The p-values were calculated using a one-way analysis of variance using Bonferroni method (ANOVA). ***p < 0.001 versus NC; # p < 0.05, # # p < 0.01, # # # p < 0.001 versus DC.
DMF alleviated MPP+ iodide-induced behavioral impairments
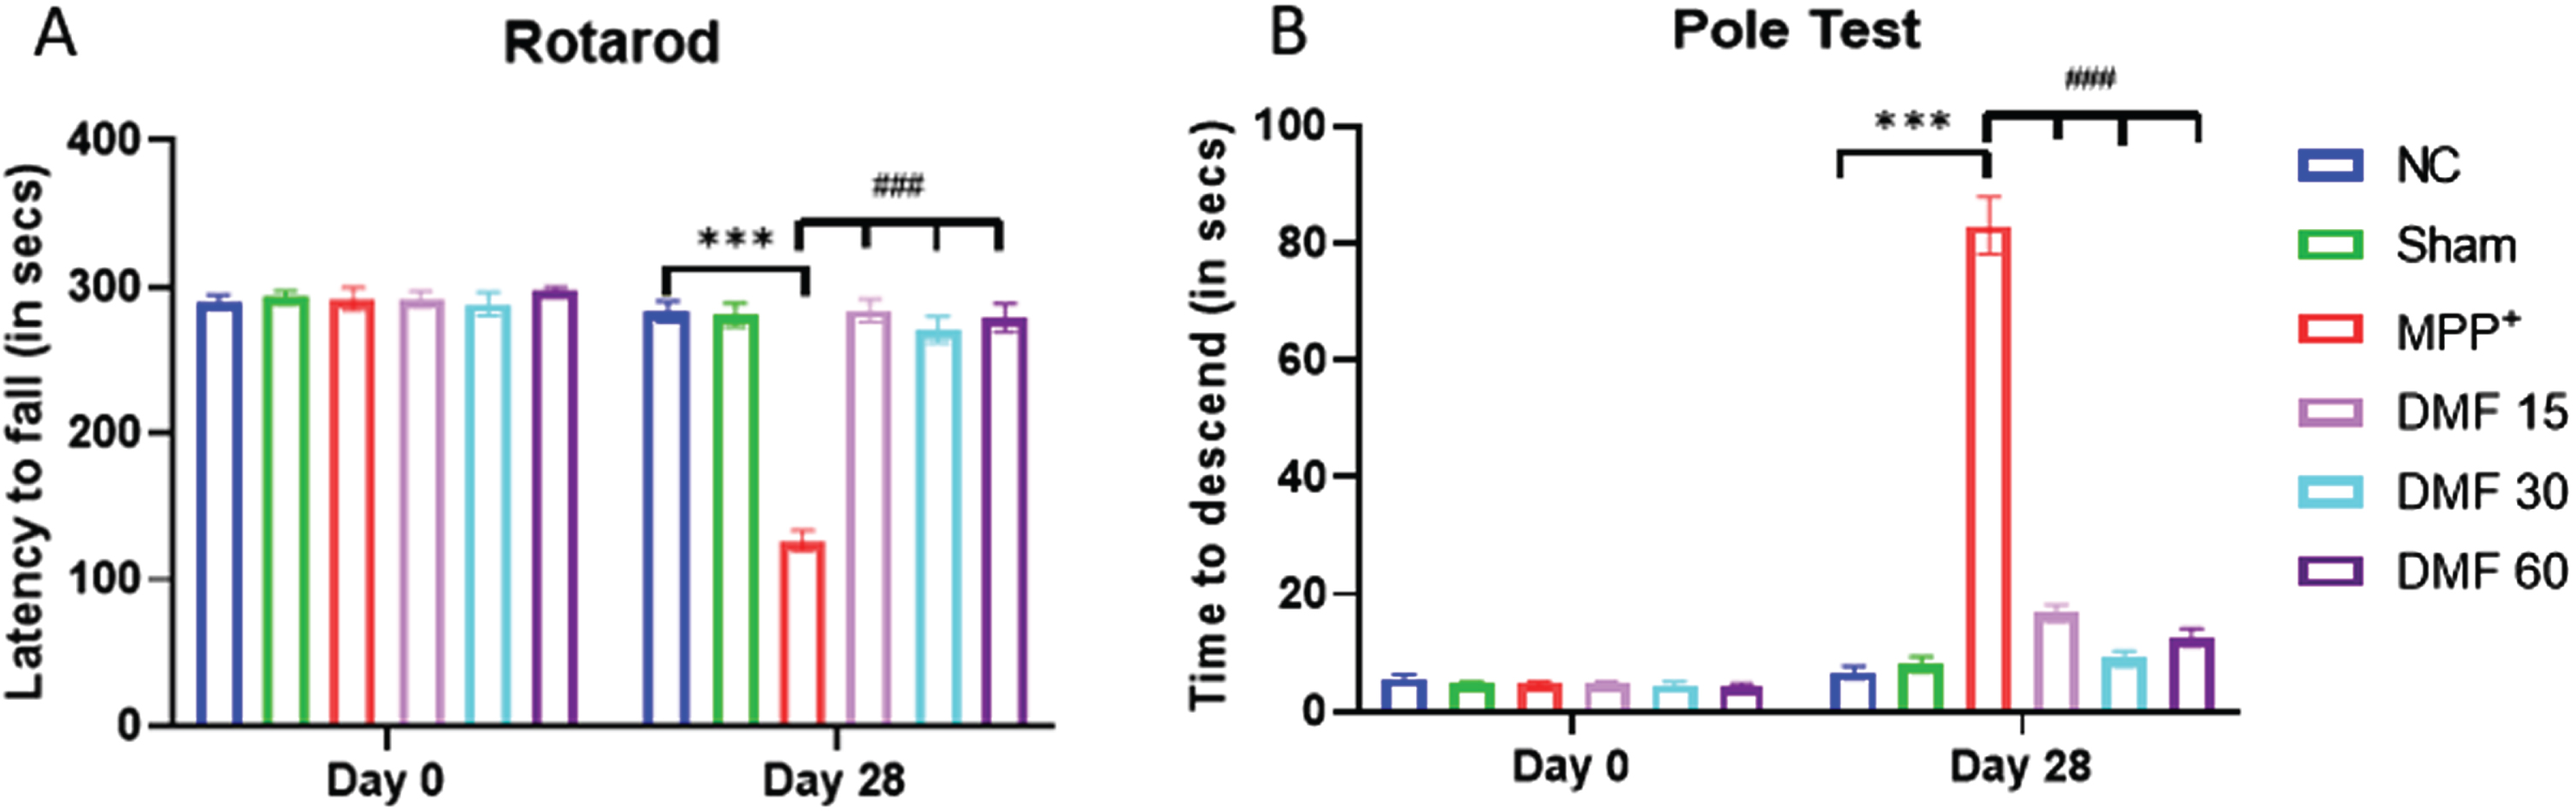
The animals belonging to all the study groups were evaluated for their motor coordination using Rotarod test (latency fall), Actophotometer (distance travelled, no. of rearings, and Vmean, and resting time), and Pole test (time to descend) at 0th and 28th day. For Rotarod Test, on Day-7, all the animals remained on the revolving rod for around 300 s. On day 7, MPP+ iodide-treated mice expressed significant motor deficits (p < 0.001) in terms of decreased latency fall, whereas on Day 28, DMF-treated mice (15 mg/kg, 30 mg/kg, 60 mg/kg) exhibited gradual and dose-related improvement (p < 0.001) in their motor coordinating activities when compared to the MPP+ iodide-induced mice (Fig. 4A). For the Pole test, on Day 0, all the animals were able to reach the bottom of the pole within the time span of 15 s. MPP+ iodide-treated mice expressed slowness of movement and loss of grip (p < 0.001) in terms of increased time to descend, with few animals falling from the pole as soon as they were placed on Day 28. Whereas DMF-treated mice exhibited significant improvement (p < 0.001) in their motor coordinating activities when compared to the MPP+ iodide-induced mice (Fig. 4B).
Fig. 4
Effect of DMF on motor activity in PD. A) Graphical representation of latency to fall among various study groups at Day 0 and Day 28 (DF = 24), B) Graphical representation of time of descent among various study groups at Day 0 and Day 28 (DF = 18); n = 6/group. Data represent mean±SEM. The p-values were calculated using a one-way analysis of variance using Bonferroni method (ANOVA). ***p < 0.001 versus NC; # p < 0.05, # # p < 0.01, # # # p < 0.001 versus DC.
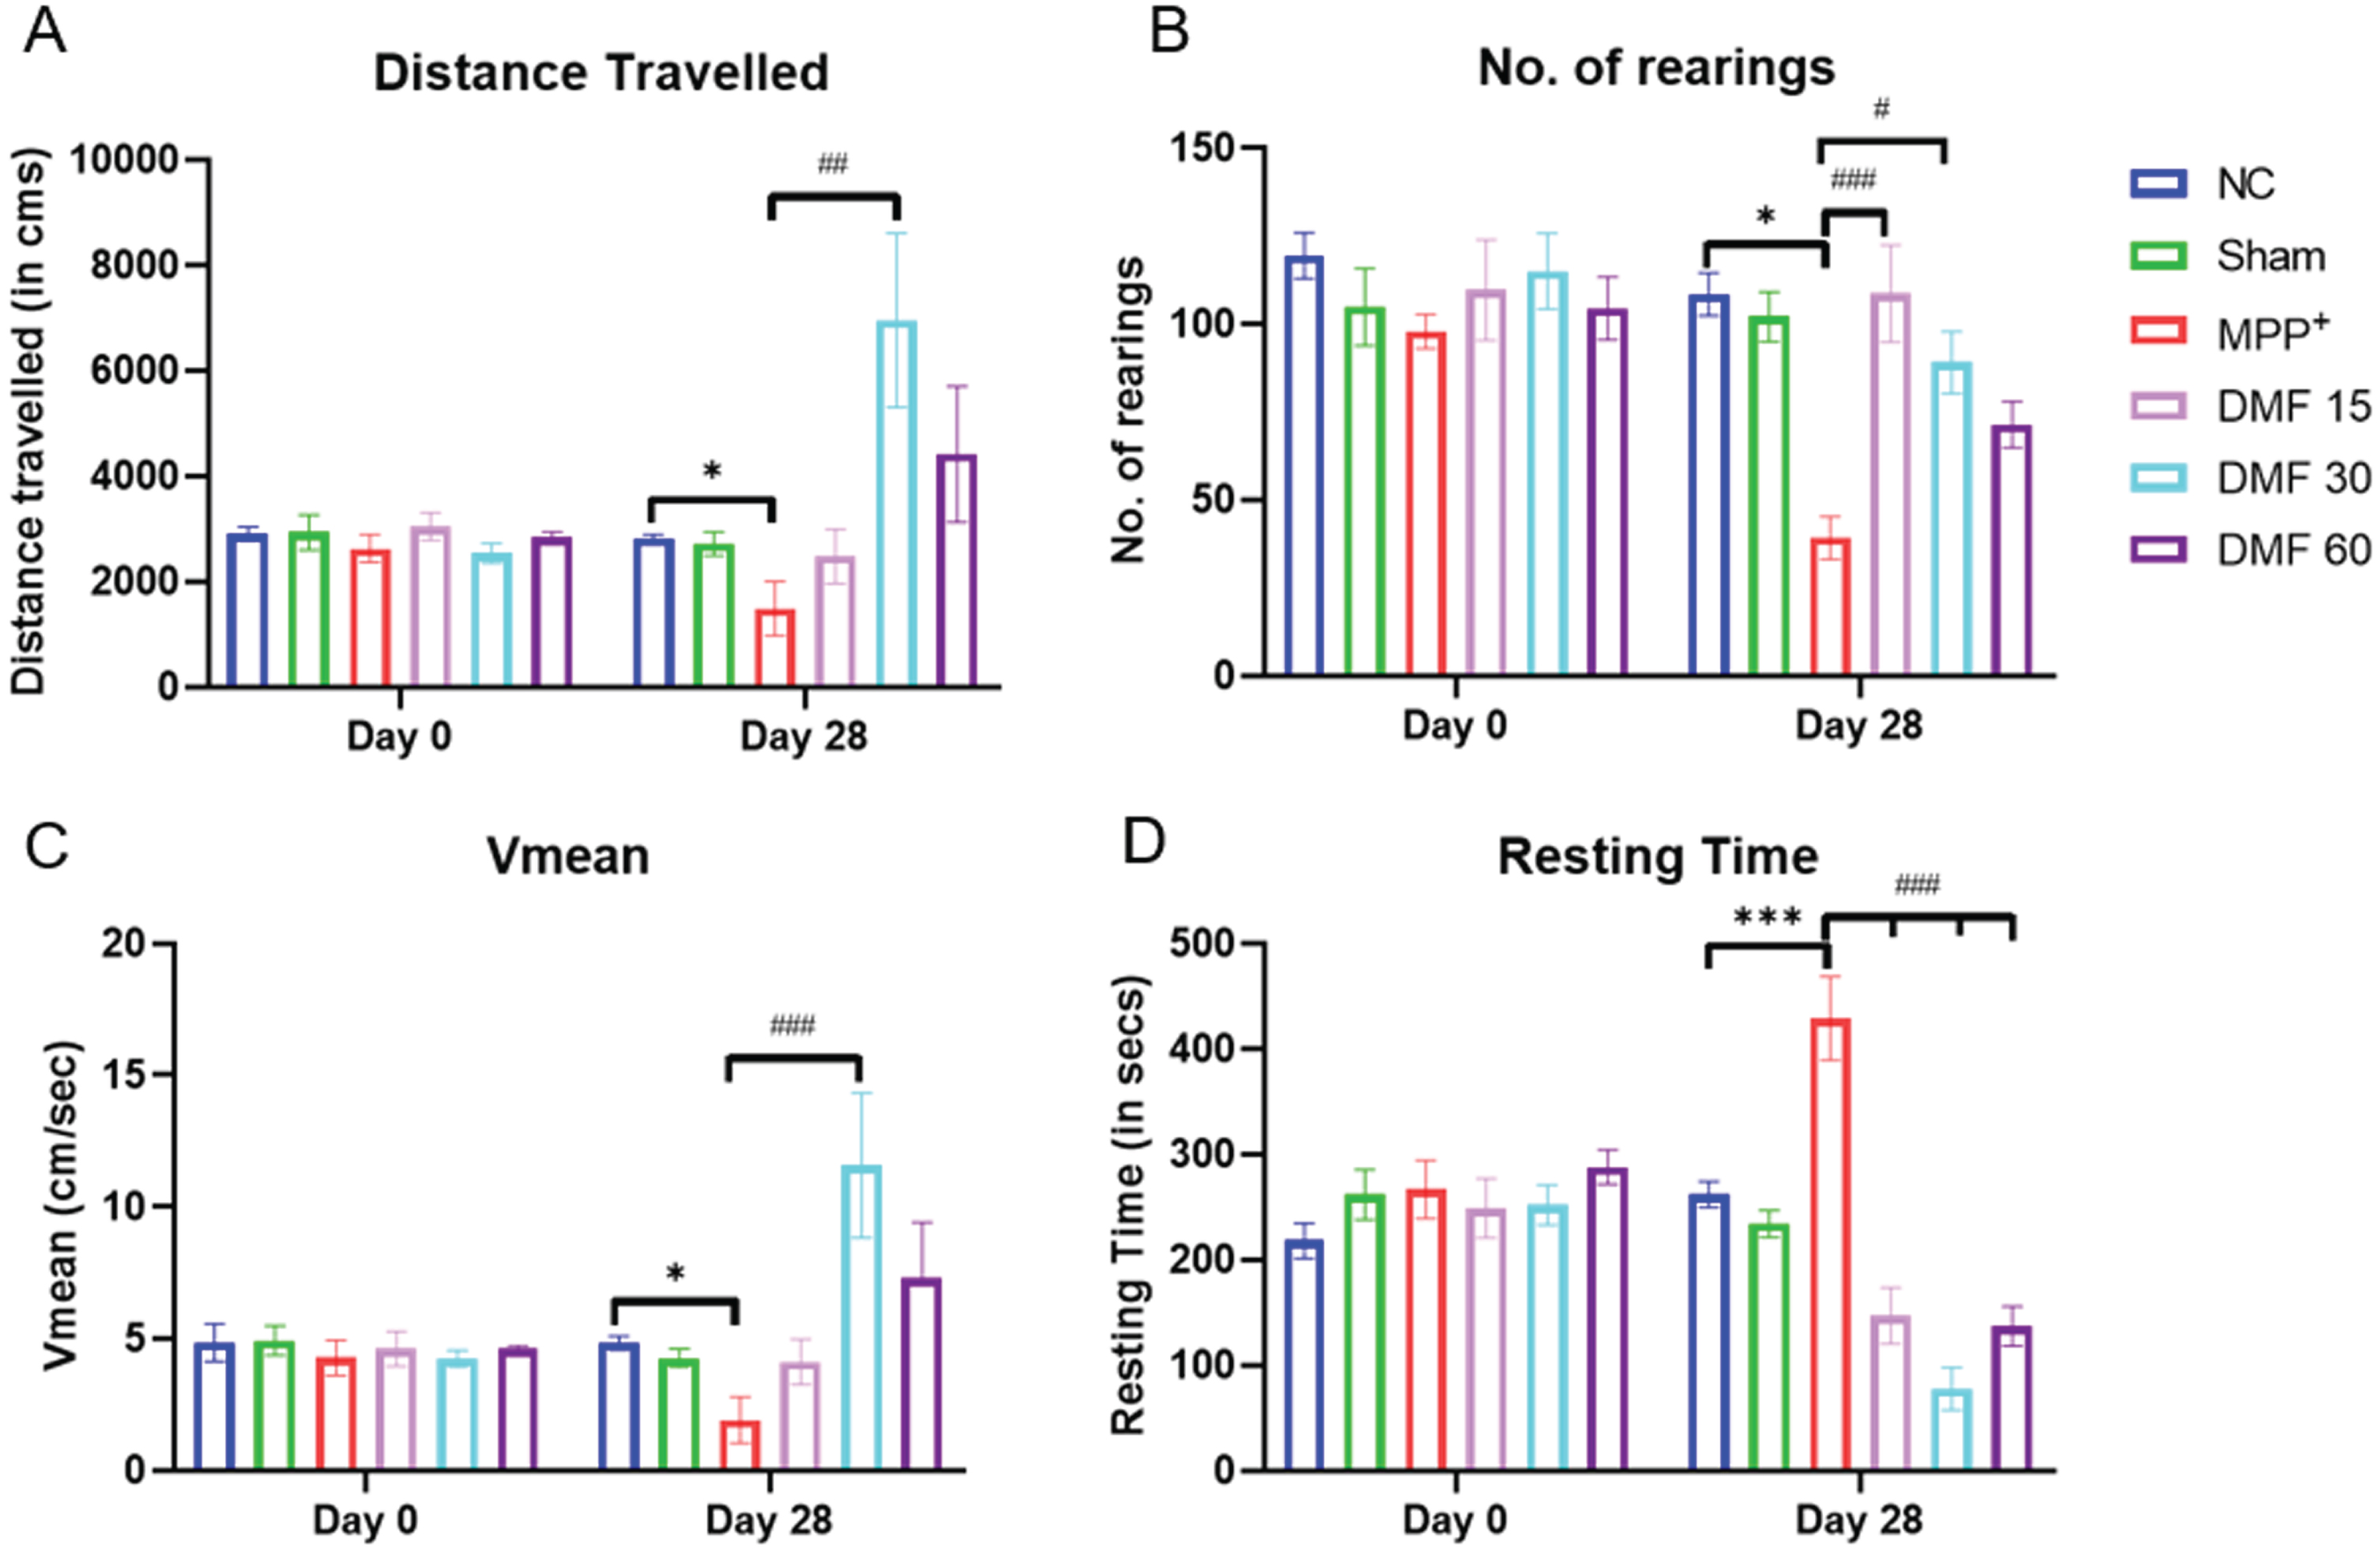
There was an improvement in motor coordination in DMF-treated groups, as observed through the Actophotometer. The track plots indicated that the motor activity of diseased animals was severely compromised, and upon treating them with DMF, the motor deficits were restored in a dose-dependent manner (Fig. 5). All the assessed parameters (Fig. 6A-D) were significantly improved, indicating the ability of DMF to reverse PD-based bradykinesia.
Fig. 5
Representative track plots of study animals of various groups on Actophotometer.
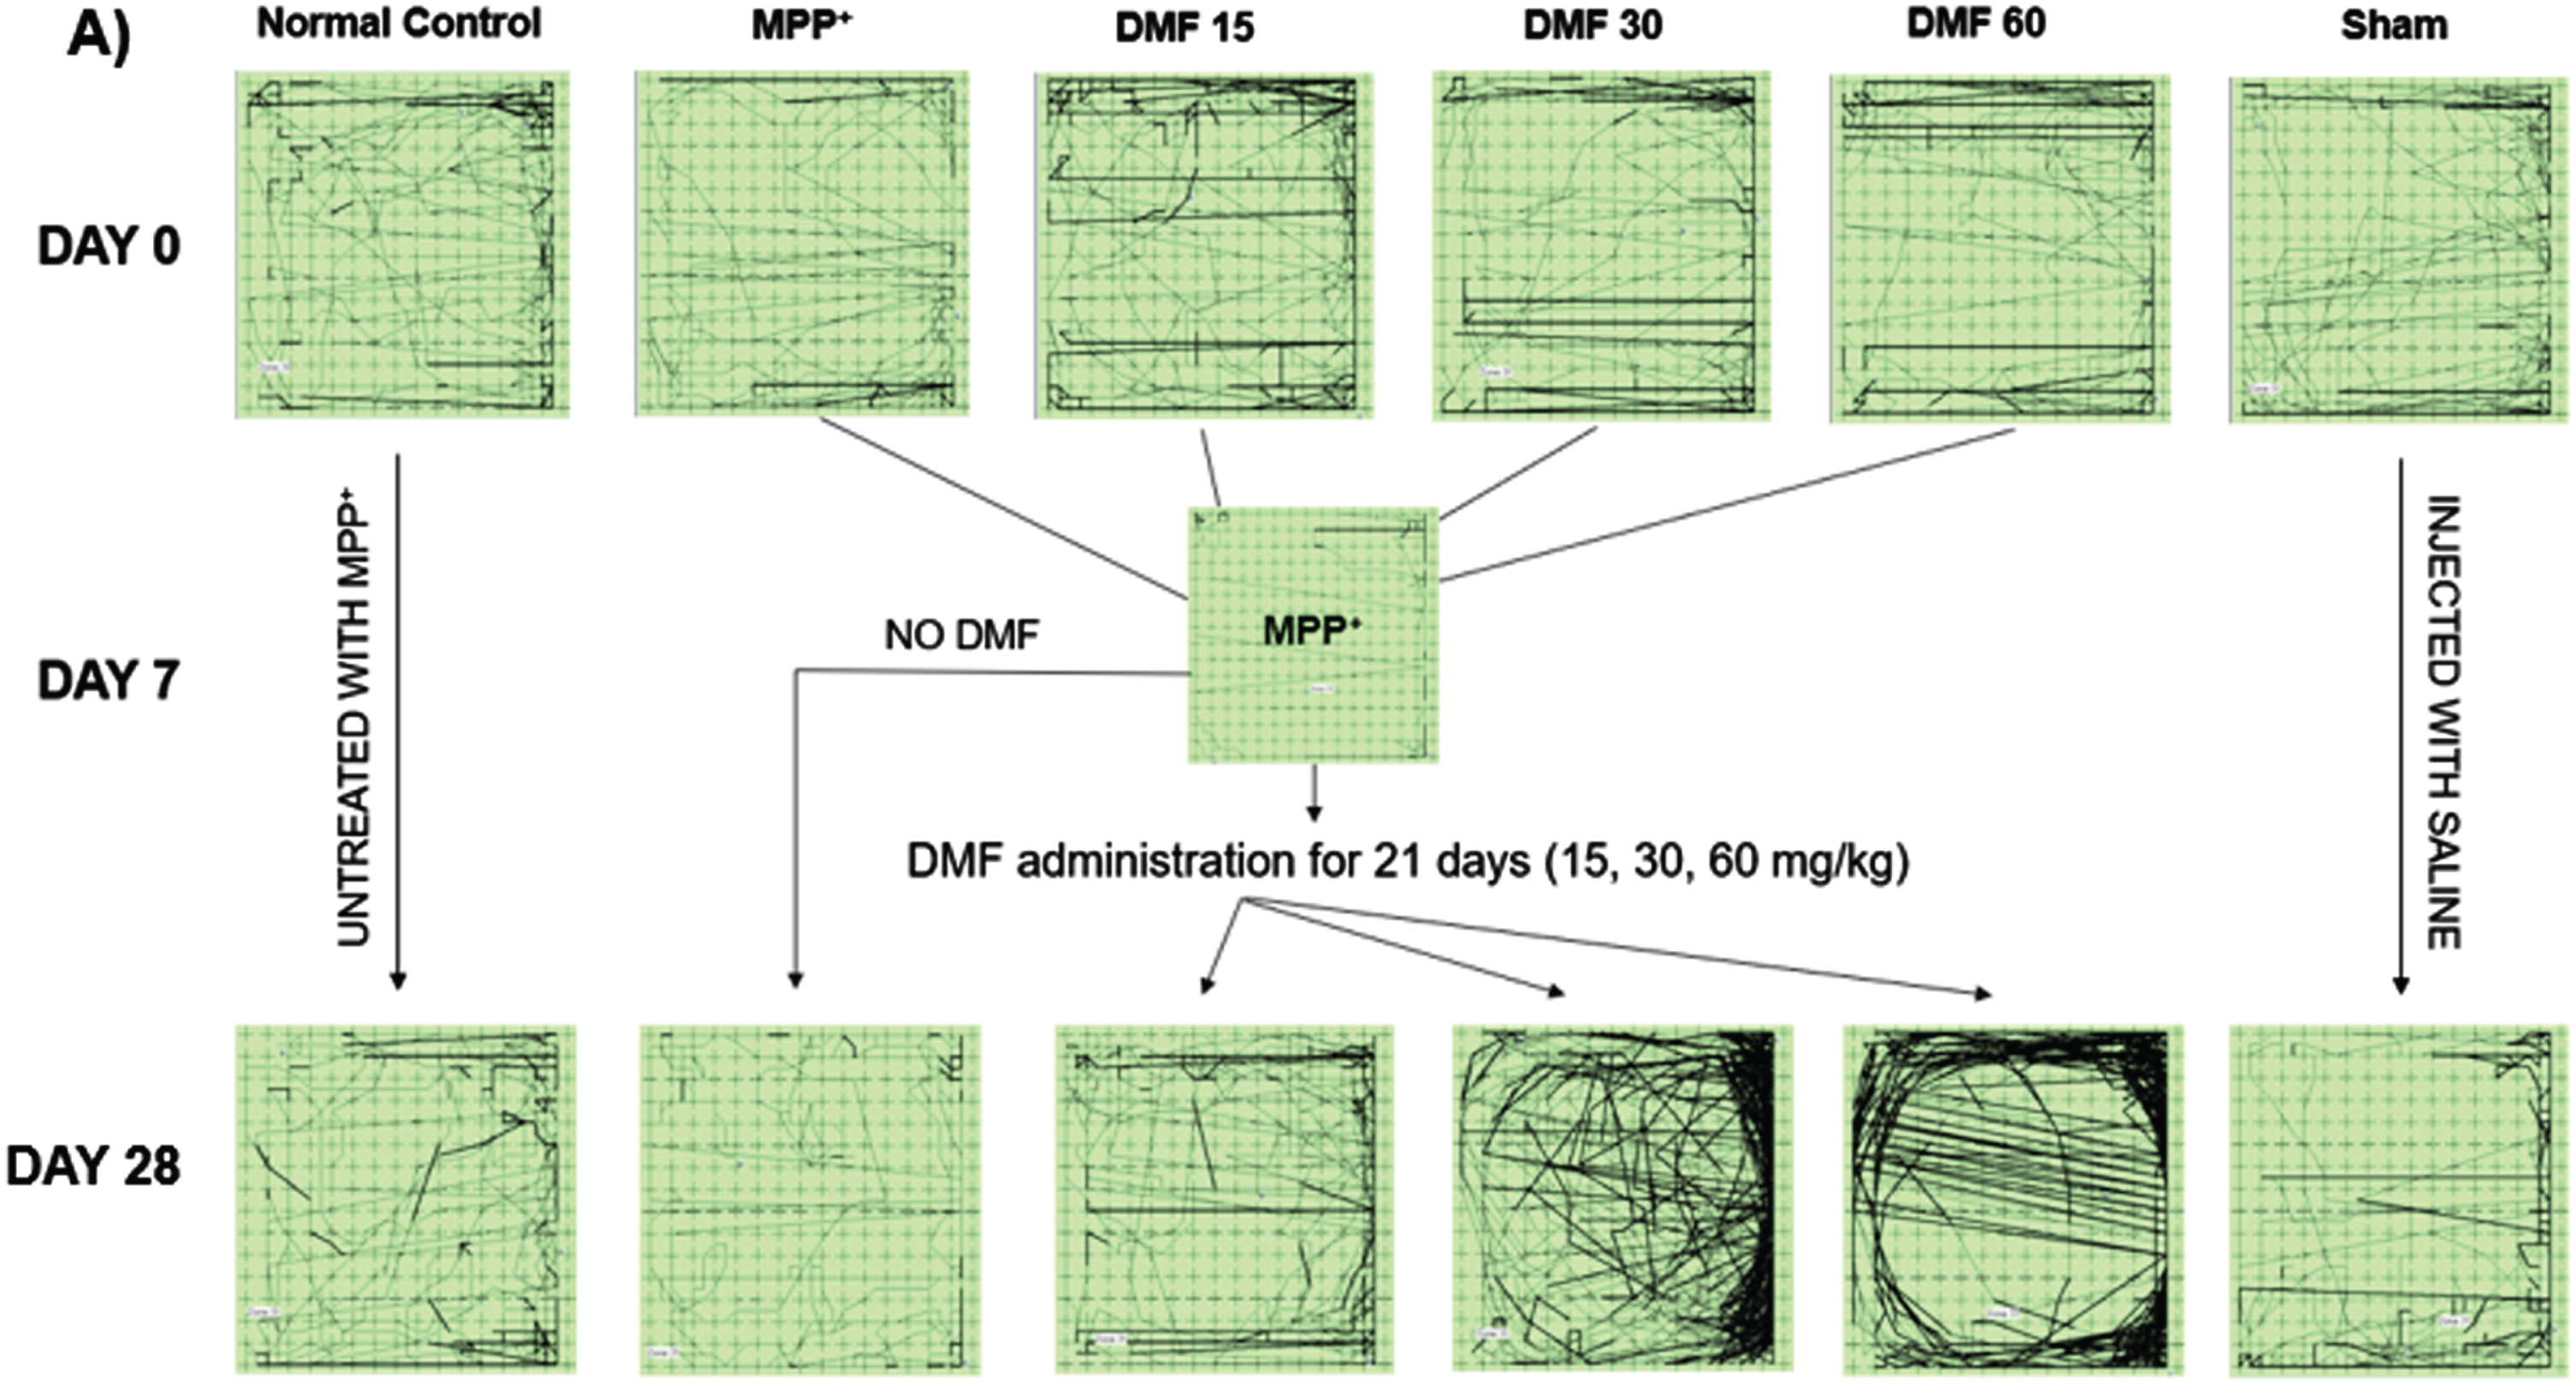
Fig. 6
Effect of DMF on motor activity in PD. Graphical representation of Actophotometer at Day 0 and Day 28 for A) Distance travelled (DF = 24), B) No. of rearings (DF = 24), C) Vmean (DF = 24), D) Resting Time (DF = 24); n = 6/group. Data represent mean±SEM. The p-values were calculated using a one-way analysis of variance using Bonferroni method (ANOVA). ***p < 0.001 versus NC; # p < 0.05, # # p < 0.01, # # # p < 0.001 versus DC.
DMF abrogated MPP+ induced neurodegeneration, elevated TH levels and attenuated α-syn in dopaminergic neurons
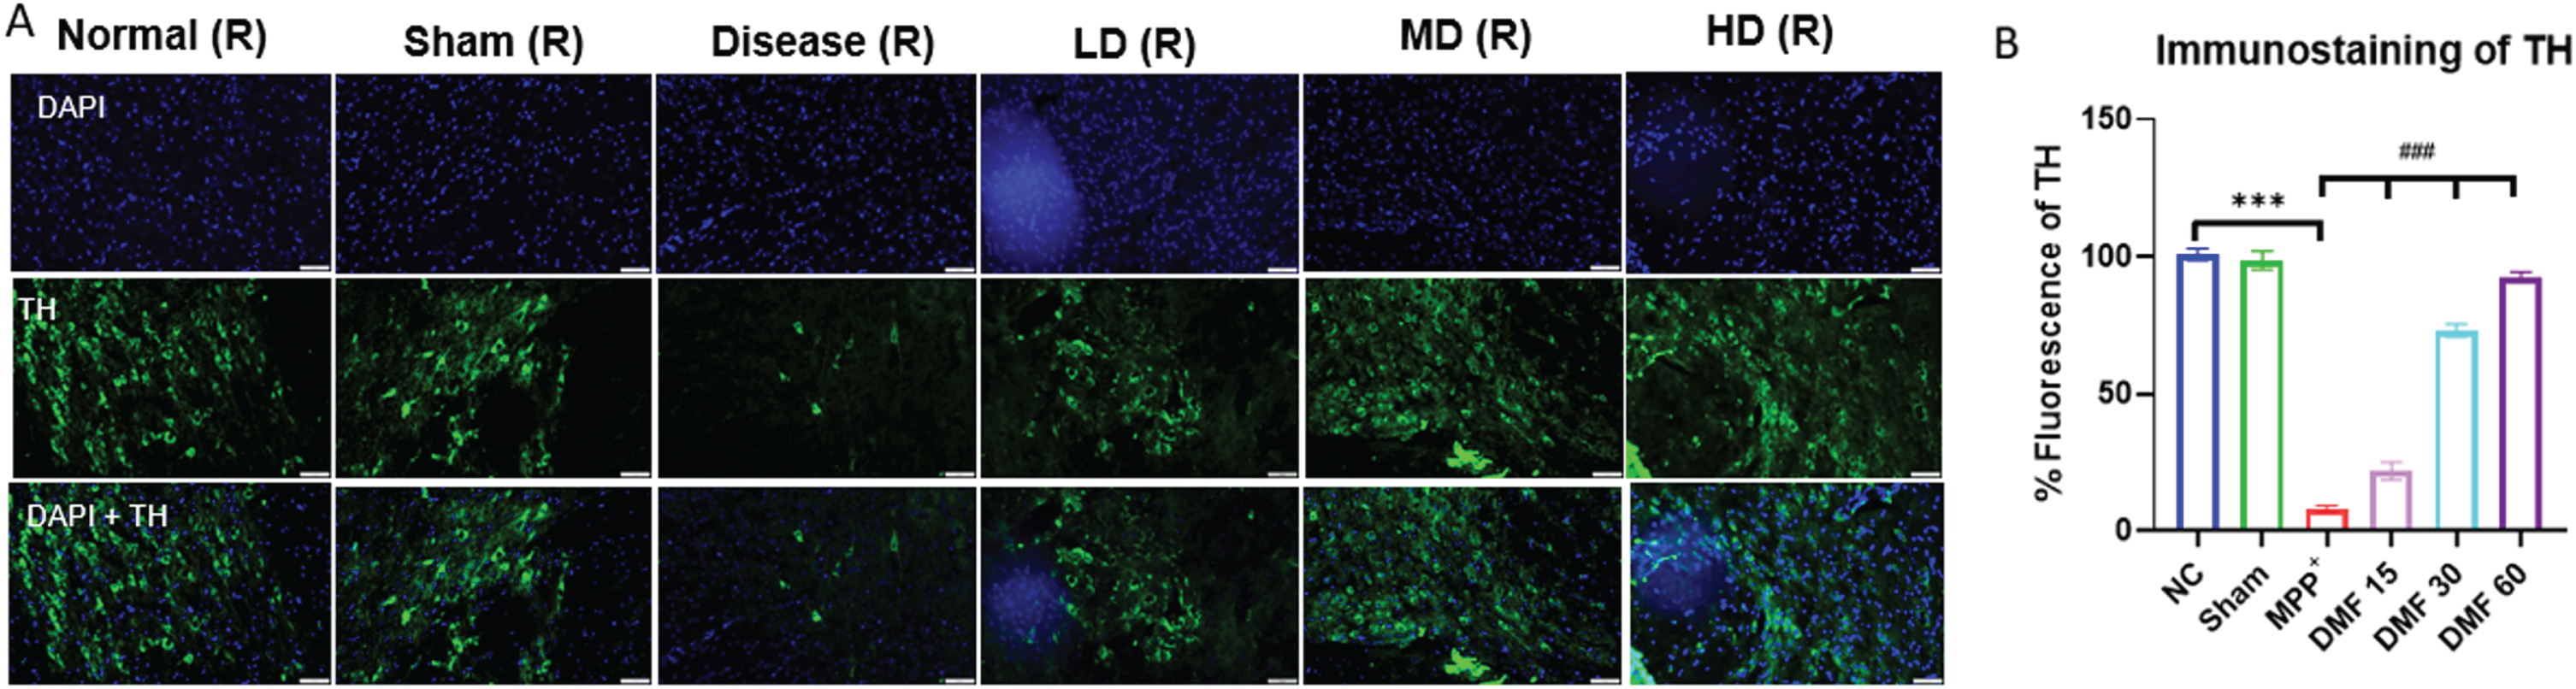
The establishment of the PD model was confirmed by decreased expression of TH and elevated α-syn in MPP+ treated group, both being the pathological hallmarks of the disease. While TH deficit affects the synthesis of dopamine, causing gradual loss of dopaminergic neurons, α-syn aggregation accelerates the production of Lewy bodies, ultimately disrupting the synthesis, storage, reuptake, and efflux of dopamine. A significant decline in α-syn levels and enhanced TH concentration in DMF-treated mice (Fig. 7A-C) through western blotting confirmed the neuroprotective potential of DMF in PD. Further relative mRNA expression levels of TH, α-syn were also in line with western blot results (Fig. 7D, E). Immunofluorescence confirmed that the TH-expressing dopaminergic neurons present in the SNpC region were significantly reduced under the influence of MPP+ iodide at the site of the injection, i.e., the right side of the brain. A visible increase in the TH-expressing dopaminergic neurons was observed upon the administration of DMF in MPP+-treated mice, especially in the dose of 30 mg/kg (Fig. 8A, B).
Fig. 7
A) Representative western blot image of parkinsonian markers, TH and α-syn, B) Quantitative analysis of TH (DF = 12), C) Quantitative analysis of α-syn (DF = 12), D, E) Relative mRNA expression of SNCA and TH respectively (DF = 12); n = 3. Data represent mean±SEM. The p-values were calculated using a one- way analysis of variance using Bonferroni method (ANOVA). ***p < 0.001 versus NC; # p < 0.05, # # p < 0.01, # # # p < 0.001 versus DC.
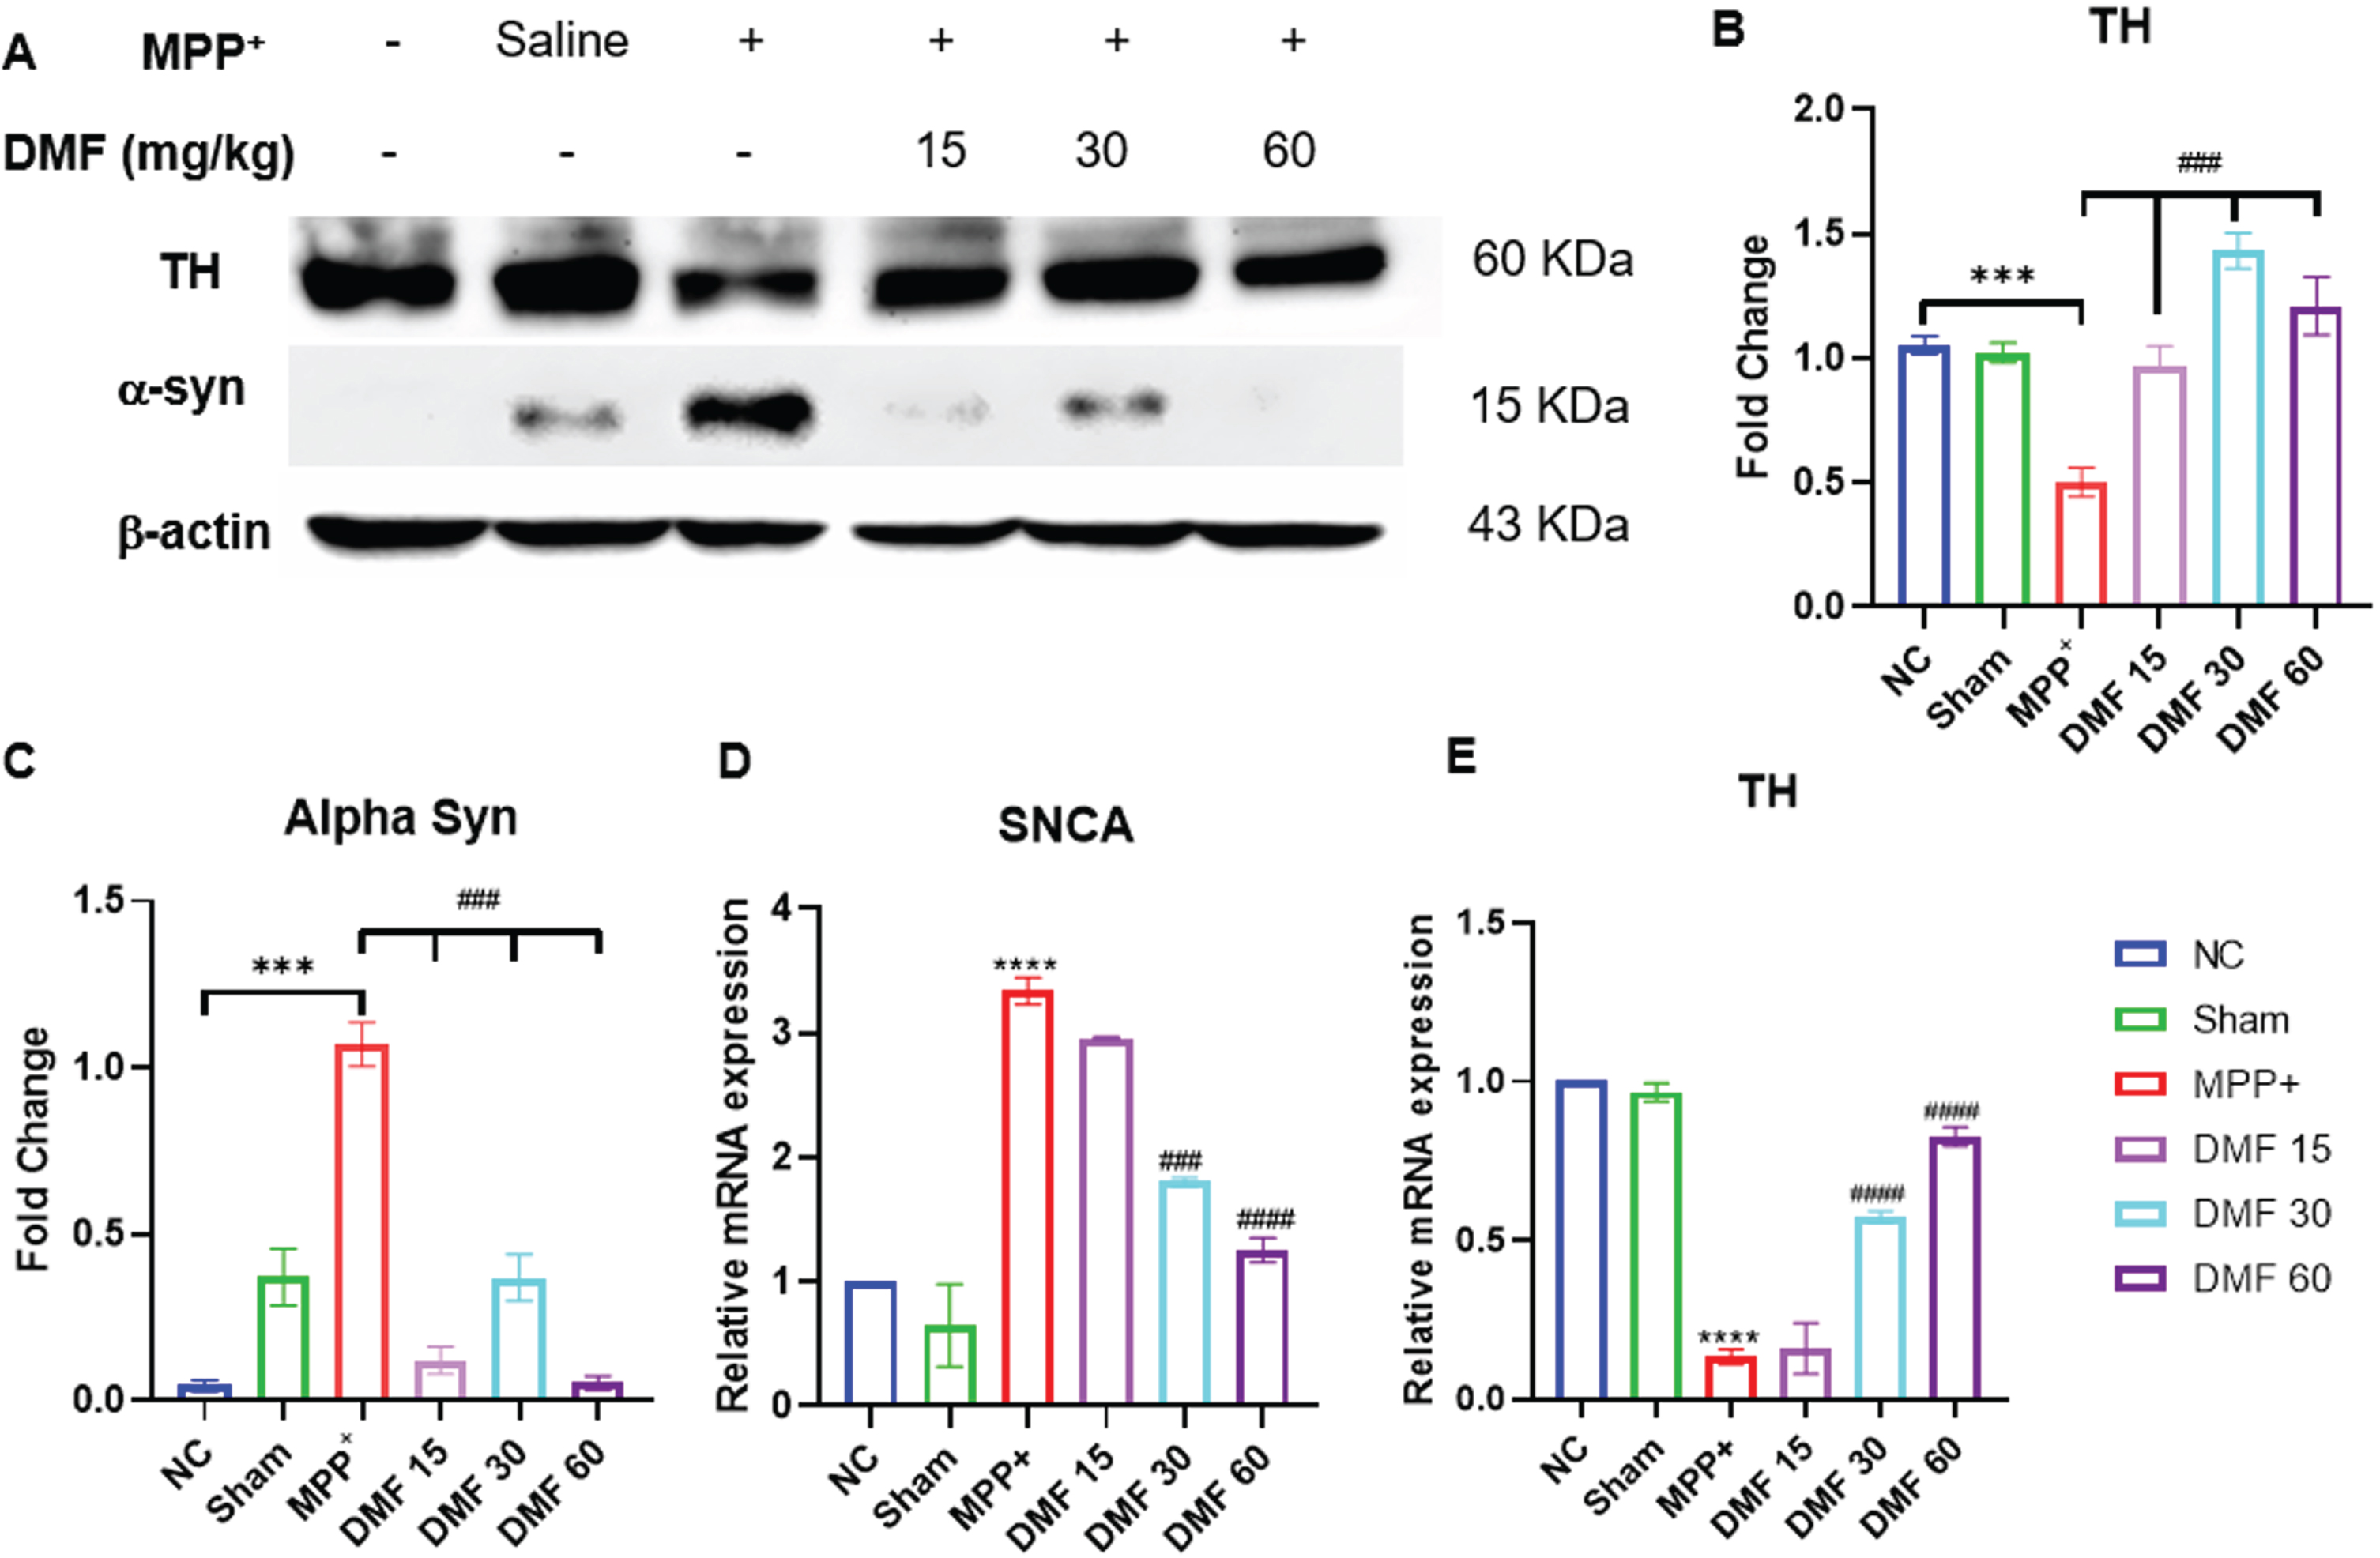
Fig. 8
A) Graphical representation of immunofluorescence of TH, scale 50μM. B) % fluorescence of TH in various groups (DF = 12); n = 3. Data represents mean±SEM. The p-values were calculated using a one-way analysis of variance using Bonferroni method (ANOVA). ***p < 0.001 versus NC; # p < 0.05, # # p < 0.01, # # # p < 0.001 versus DC.
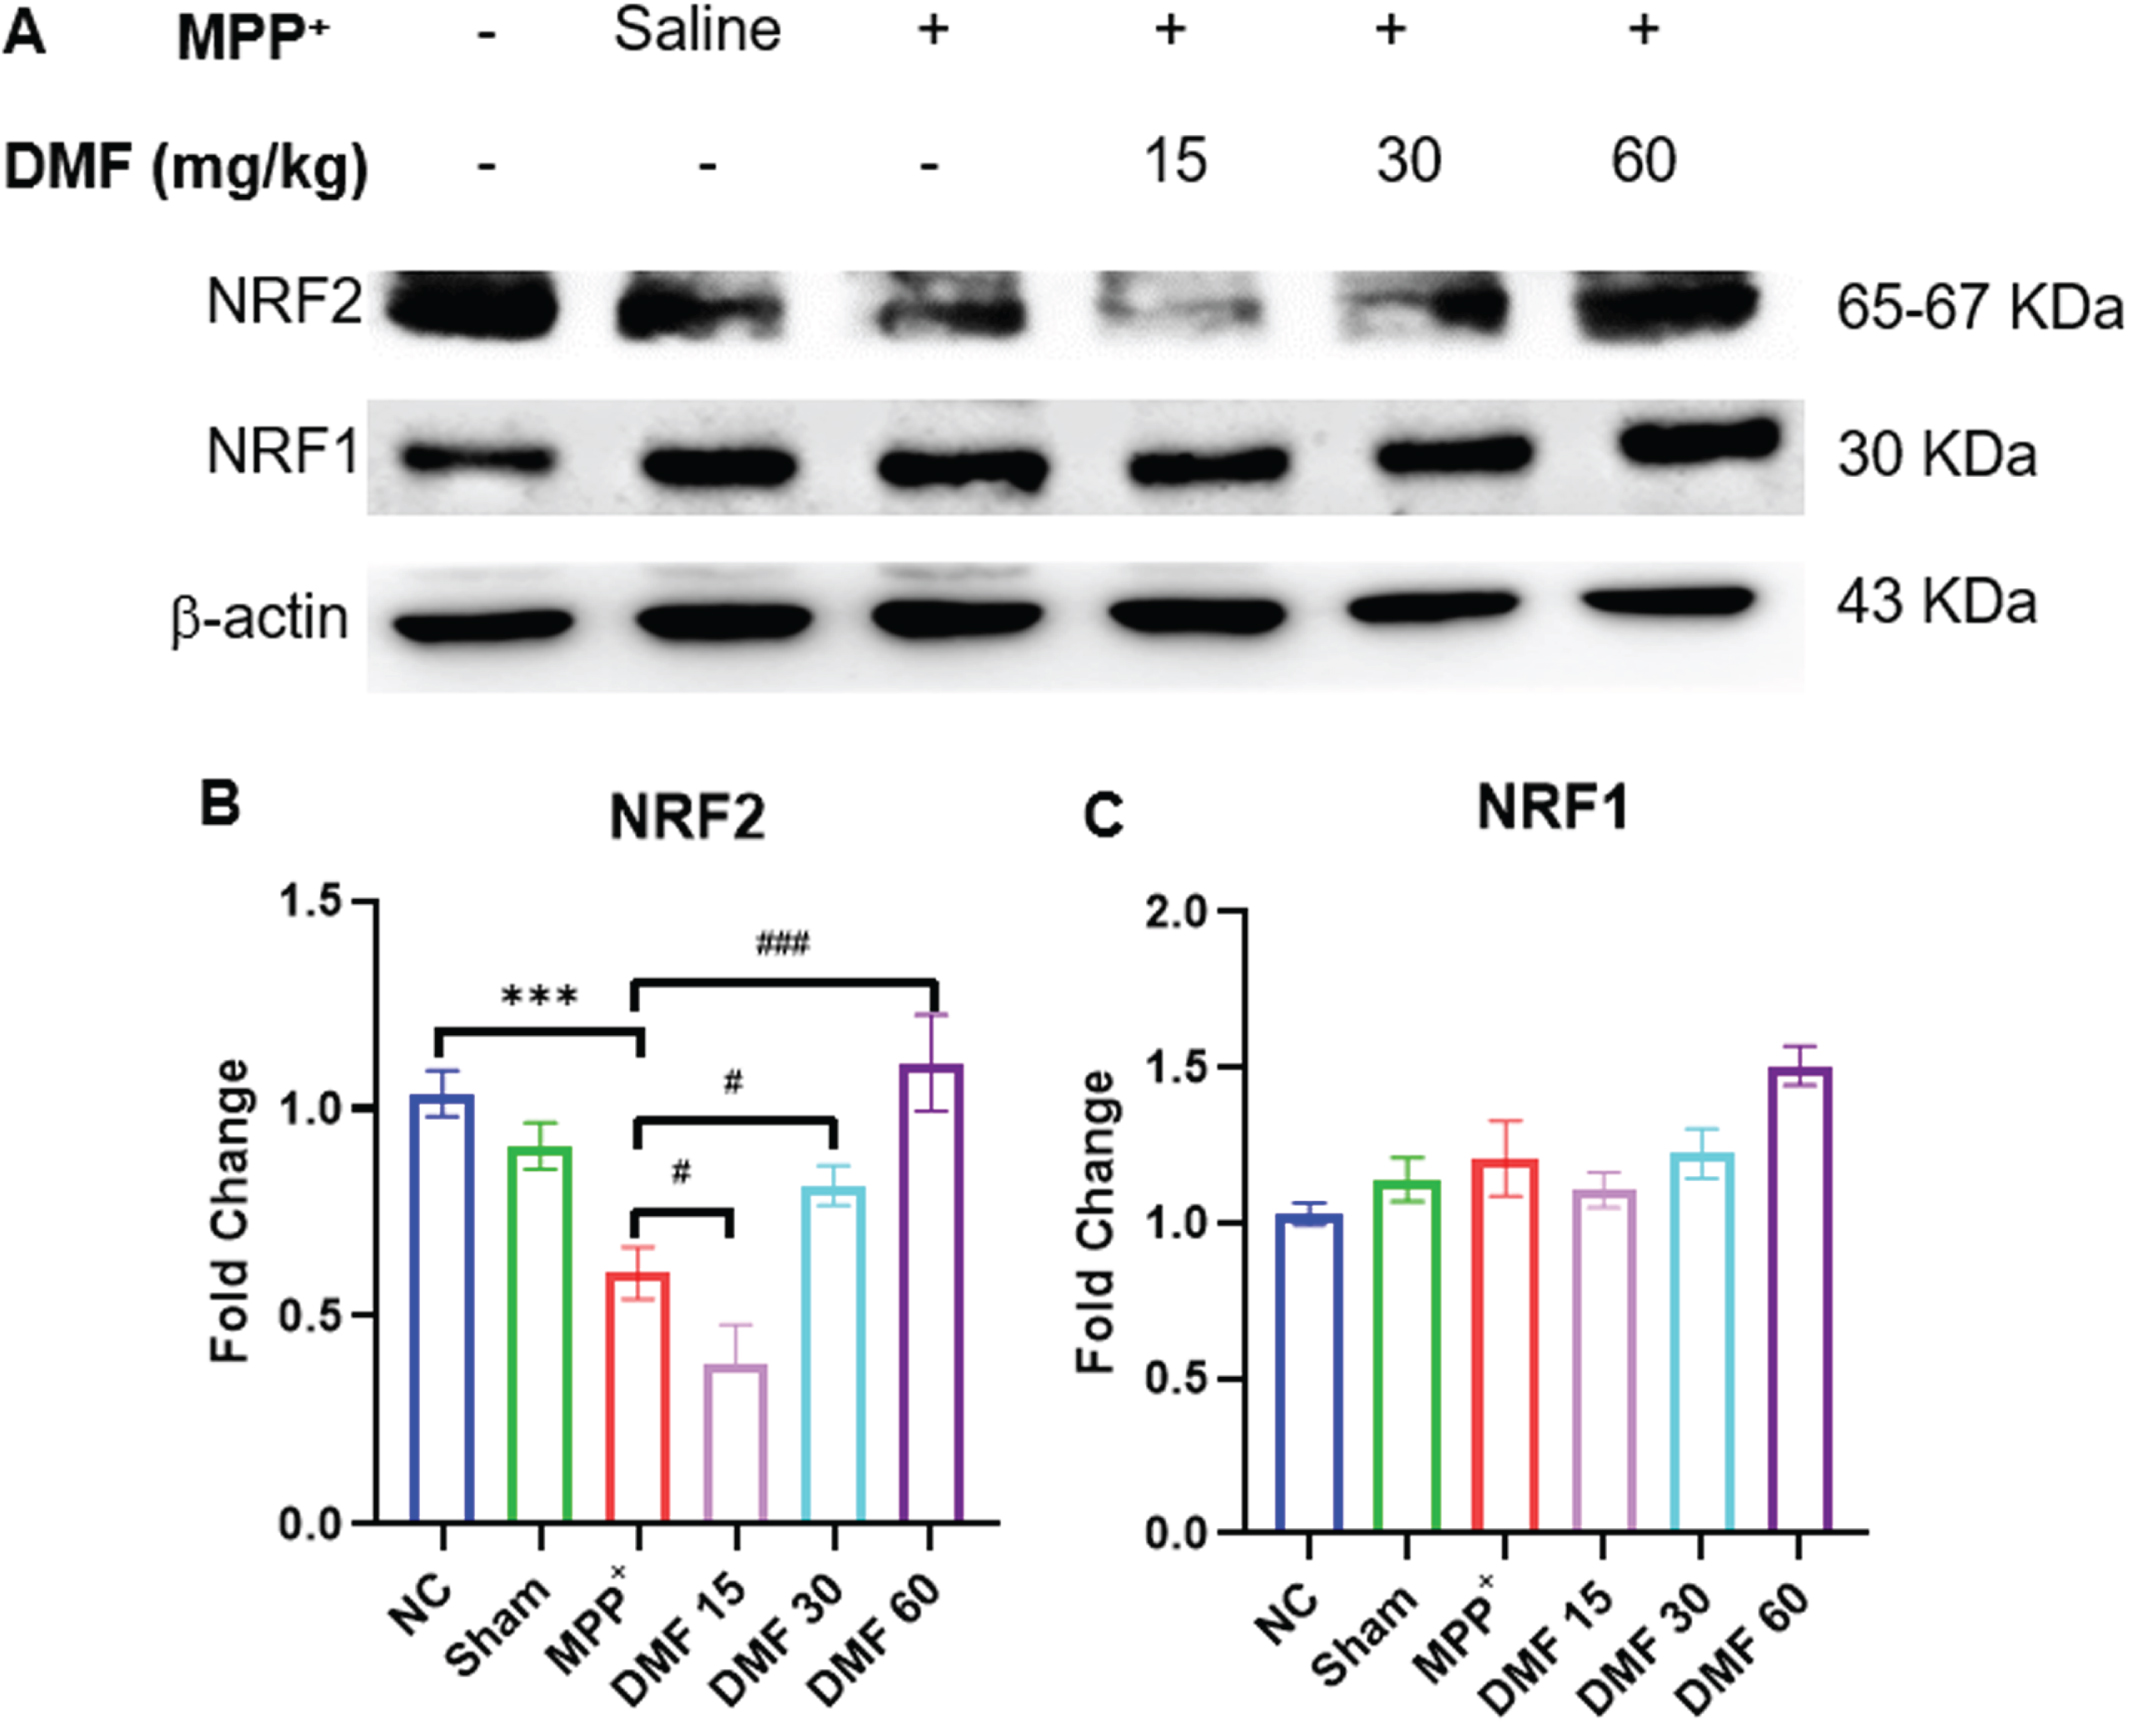
DMF activated NRF2 and NRF1 genes
NRF2 has a multifaceted role in autophagy, mitochondrial biogenesis, and dynamics in physiological conditions. The significant downregulation of NRF2 was evident in PD-induced mice, indicating the ability of MPP+iodide to disrupt the protein homeostasis of the dopaminergic neurons. Upon the administration of DMF, the expression of NRF2 (Fig. 9A, B) has visibly increased in a dose-dependent manner when compared to the disease-control animals exerting a neuroprotective effect. Activation of the NRF2 pathway by DMF is also linked to an increase in the levels of NRF1 (Fig. 9A, C). Though a significant difference in NRF1 expression was not found in PD animals, DMF increased the NRF1 expression in DMF-treated animals when compared to normal control signifying the positive correlation of NRF2 with NRF1 gene.
Fig. 9
A) Image of western blots of NRF2 and NRF1 B) Quantitative analysis of NRF2 (DF = 12), C) Quantitative analysis of NRF1(DF = 12); n = 3. Data represents mean±SEM. The p-values were calculated using a one-way analysis of variance using Bonferroni method (ANOVA). ***p < 0.001 versus NC; # p < 0.05, # # p < 0.01, # # # p < 0.001 versus DC.
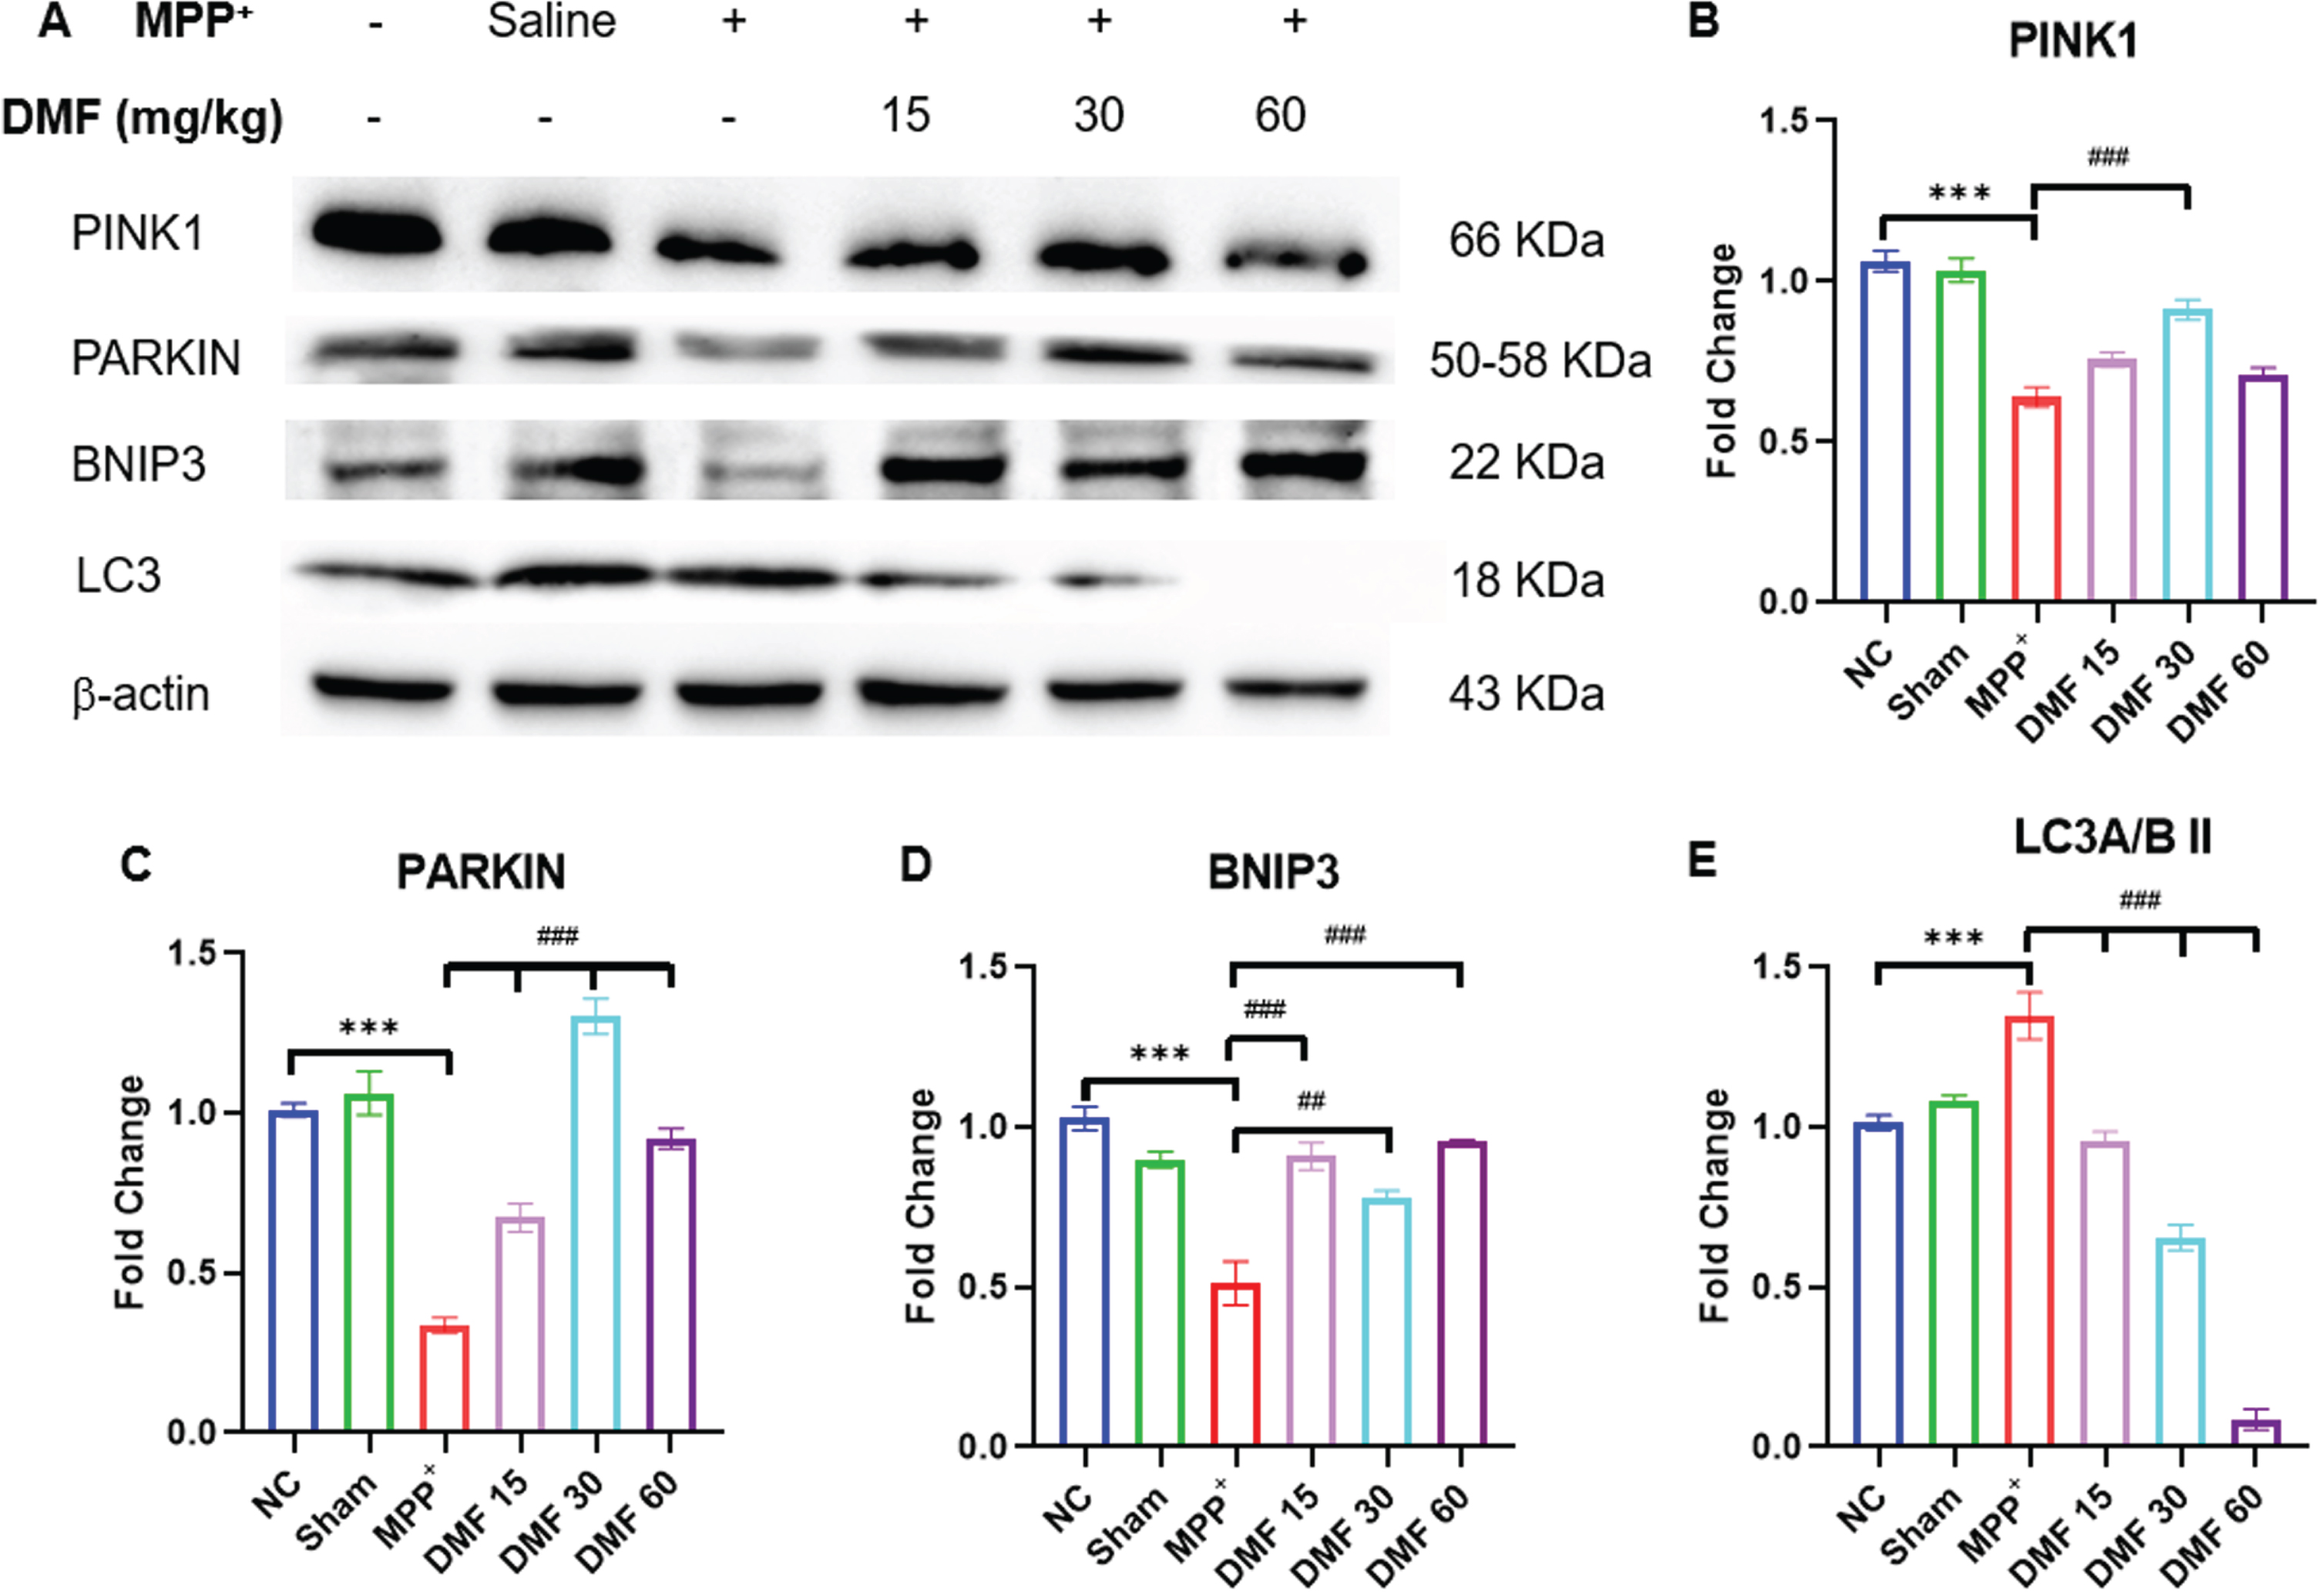
DMF promoted protein homeostasis by enhancing mitophagy in PD
Mitochondrial dysfunction triggered by MPP+ iodide reduced the levels of BNIP3, PINK1, and PARKIN (Fig. 10A-D) proteins which are involved in mitophagy evident through western blotting of the mid-brain samples of the disease induced mice. These results can be linked to the reduced NRF2 expression, which fails to increase the expression of BNIP3 protein, disrupting the protein homeostasis due to impaired autophagy. Further, the decline in PINK1-PARKIN molecules lead to the failure of cellular mitophagy. The concentration of these mitophagy-associated proteins was significantly upregulated in DMF-treated mice, demonstrating the restoration of the protein homeostasis to a greater extent when compared to the disease group. MPP+ exposure has been linked to an increase in LC3A/BII levels (Fig. 10E), indicating a drop in autophagosome degradation. DMF-treated mice expressed lower LC3A/BII concentration, probably due to the reactivation of autophagy.
Fig. 10
A) Image of western blots of proteins involved in mitophagy; PINK1, PARKIN, BNIP3, LC3, B) Quantitative analysis of PINK1 (DF = 12), C) Quantitative analysis of PARKIN (DF = 12), D) Quantitative analysis of BNIP3(DF = 12), E) Quantitative analysis of LC3A/BII (DF = 12); n = 3; Data represents mean±SEM. The p-values were calculated using a one-way analysis of variance using Bonferroni method (ANOVA). ***p < 0.001 versus NC; # p < 0.05, # # p < 0.01, # # # p < 0.001 versus DC.
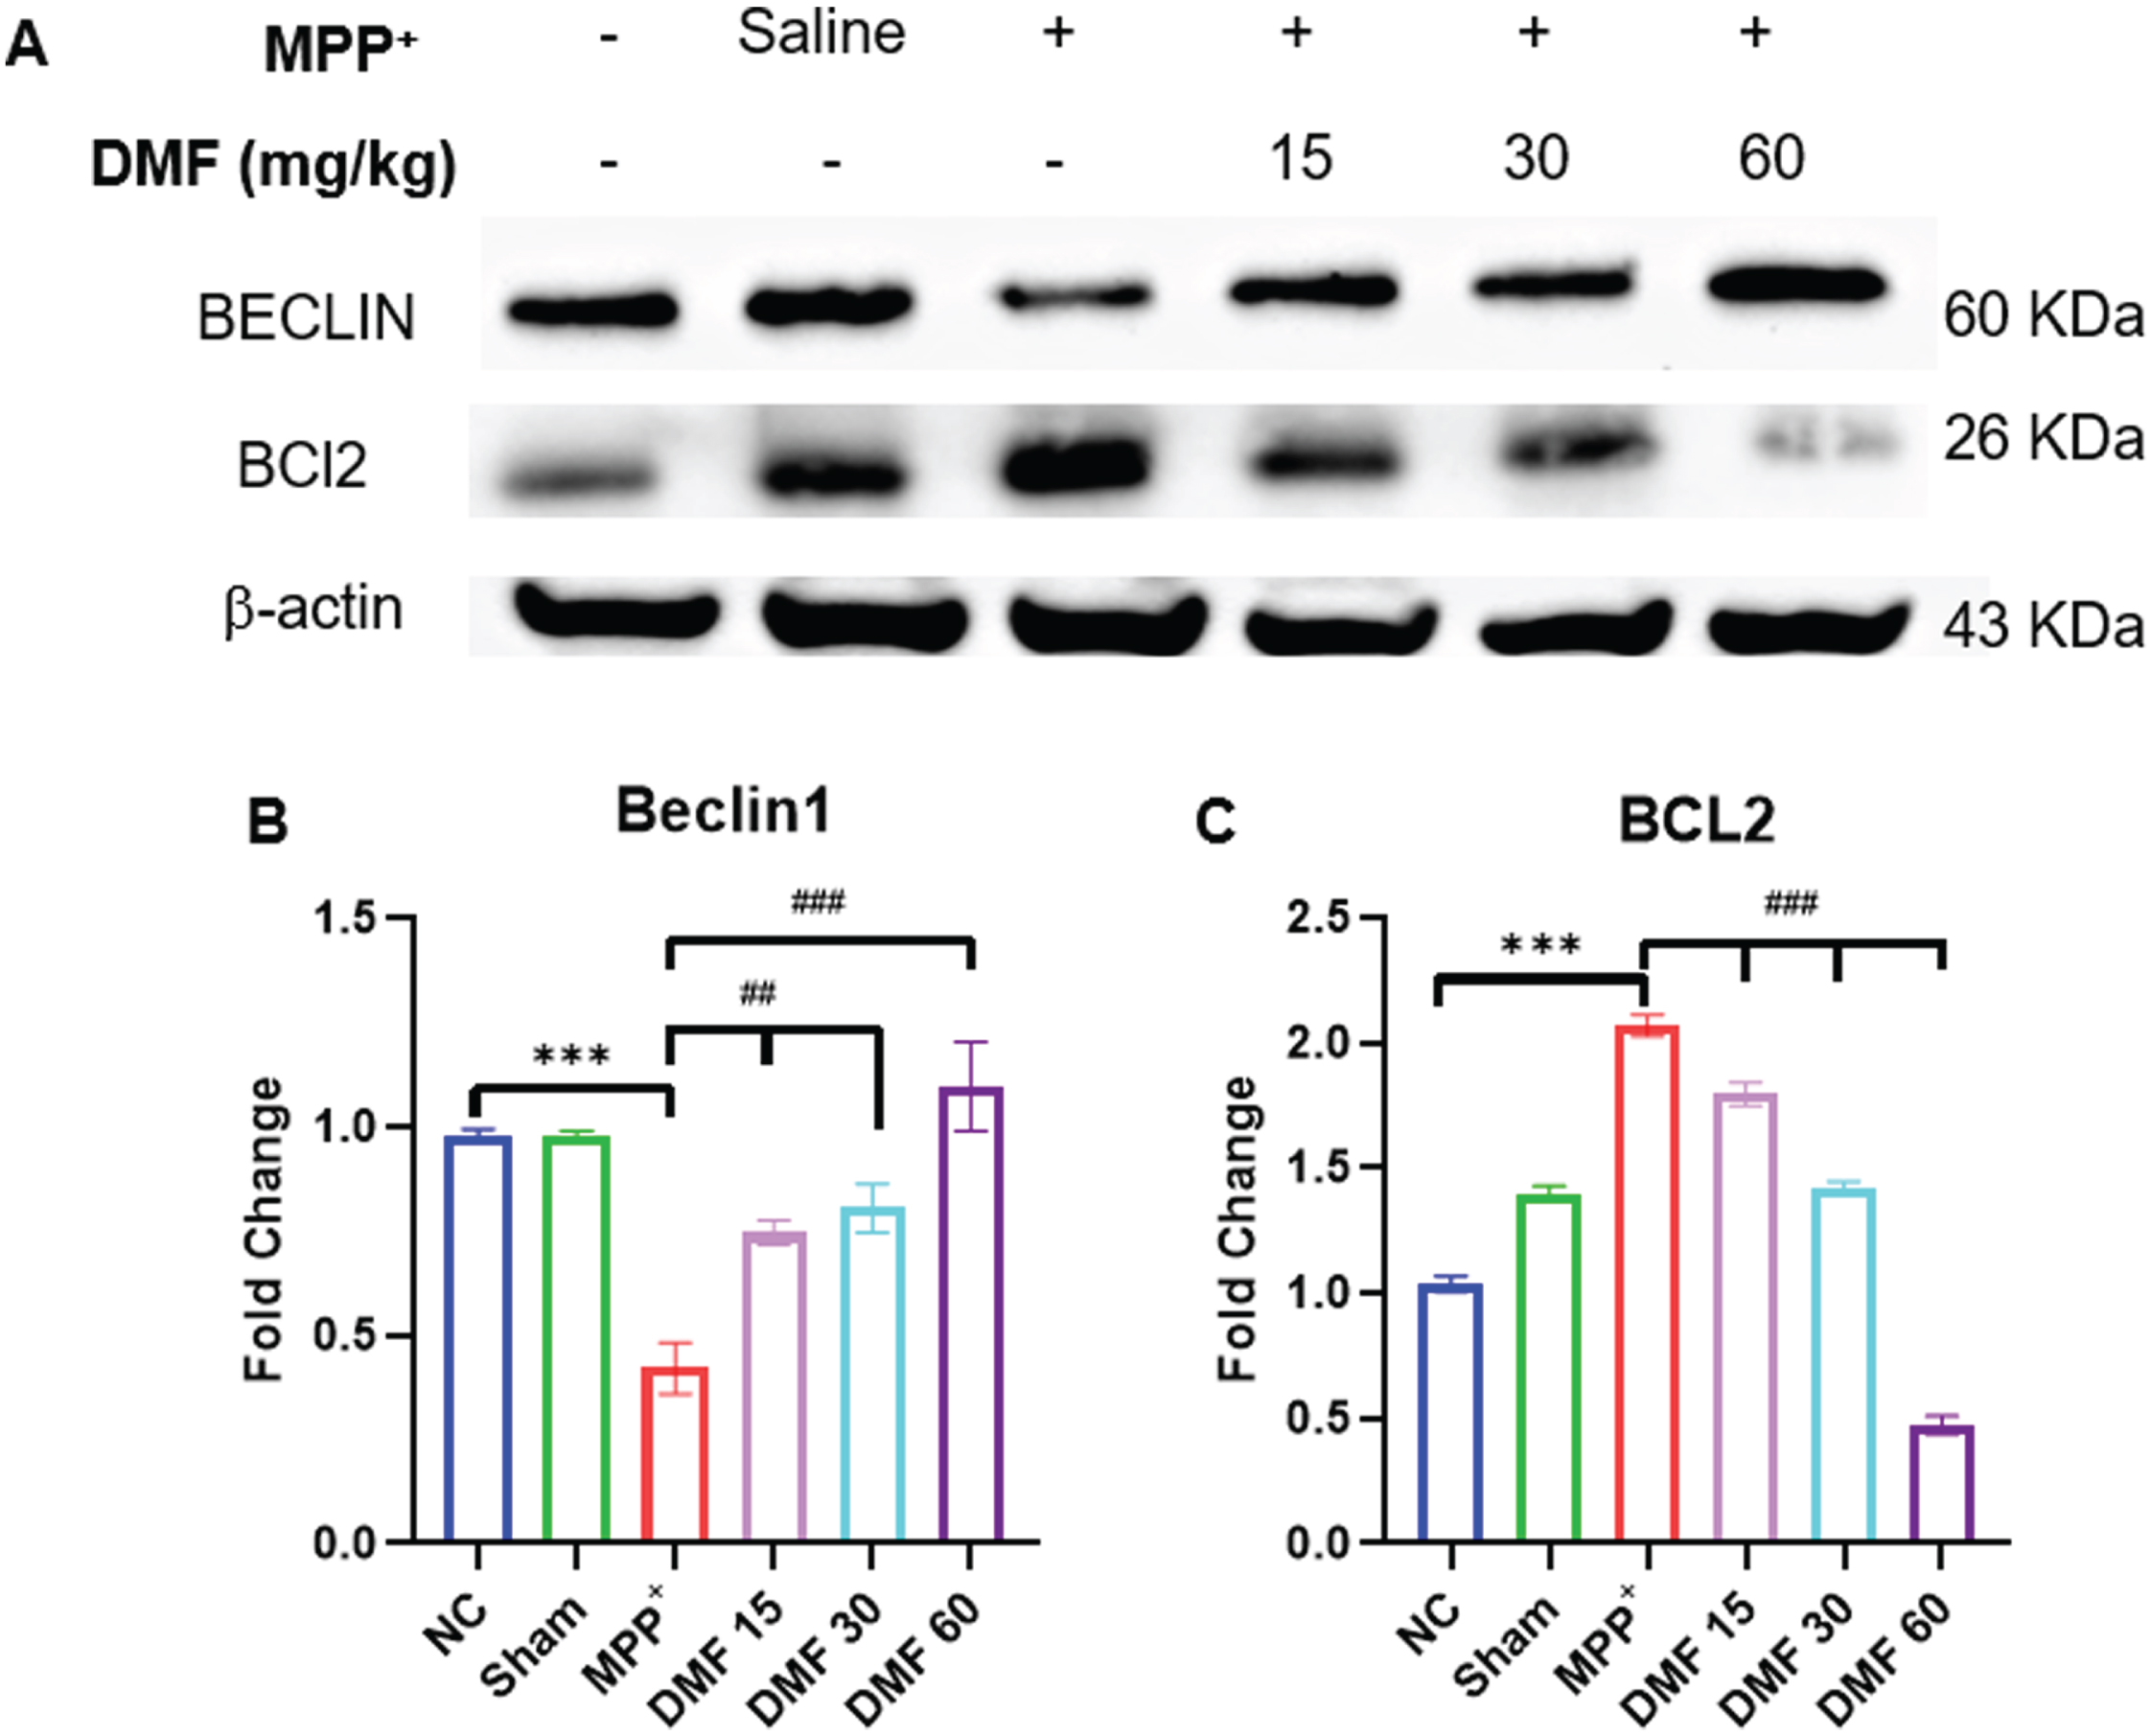
DMF is involved in the breakdown of the BCL2-Beclin1 complex through BNIP3 upregulation
When compared to the normal control, a significant downregulation of Beclin1 and upregulation of BCL2 was observed. A decrease in Beclin1 (Fig. 11A, B) concentration indicates reduced autophagy in MPP+-induced animals, whereas elevated BCL2 (Fig. 11A, C) can be linked to the non-availability of BNIP3 protein to form a complex with it which was supposed to enhance autophagy. A significant reversal of the concentrations of these proteins was observed in DMF-treated mice in a dose-dependent manner. This indicates the ability of DMF to positively affect the disrupted autophagic process through BNIP3 elevation, rescuing neurodegeneration in PD.
Fig. 11
A) Image of western blots of proteins Beclin1 and BCL2 B) Quantitative analysis of Beclin1 (DF = 12) C) Quantitative analysis of BCL2 (DF = 12); n = 3; Data represents mean±SEM. The p-values were calculated using a one-way analysis of variance using Bonferroni method (ANOVA). ***p < 0.001 versus NC; # p < 0.05, # # p < 0.01, # # # p < 0.001 versus DC.
DISCUSSION
This study was designed to investigate the neuroprotective effect of DMF through NRF2-BNIP3-PINK1 axis using PD model. The disease was induced using MPP+ iodide, a metabolite of MPTP, which has been used as a gold standard in PD research. MPTP-based PD model yields large variations in disease development due to difference in MAO-B enzyme concentration, the one responsible for the conversion of MPTP to MPP+ in the study animals. In order to induce homogenous dopaminergic damage and avoid the systemic side effects of MPTP, i.c.v. injection of MPP+iodide is being preferred over MPTP over the recent past [43, 44, 52–54]. Additionally, MPP+ provides advantages like simplicity, affordability, practicability, and fewer ethical considerations (like its parent molecule MPTP). MPP+, being an excellent substrate for DAT, possesses selective toxicity towards the dopaminergic neurons. It is a Complex-I inhibitor, thereby rapidly reducing the ATP production in the SNpC region of the brain [55, 56].
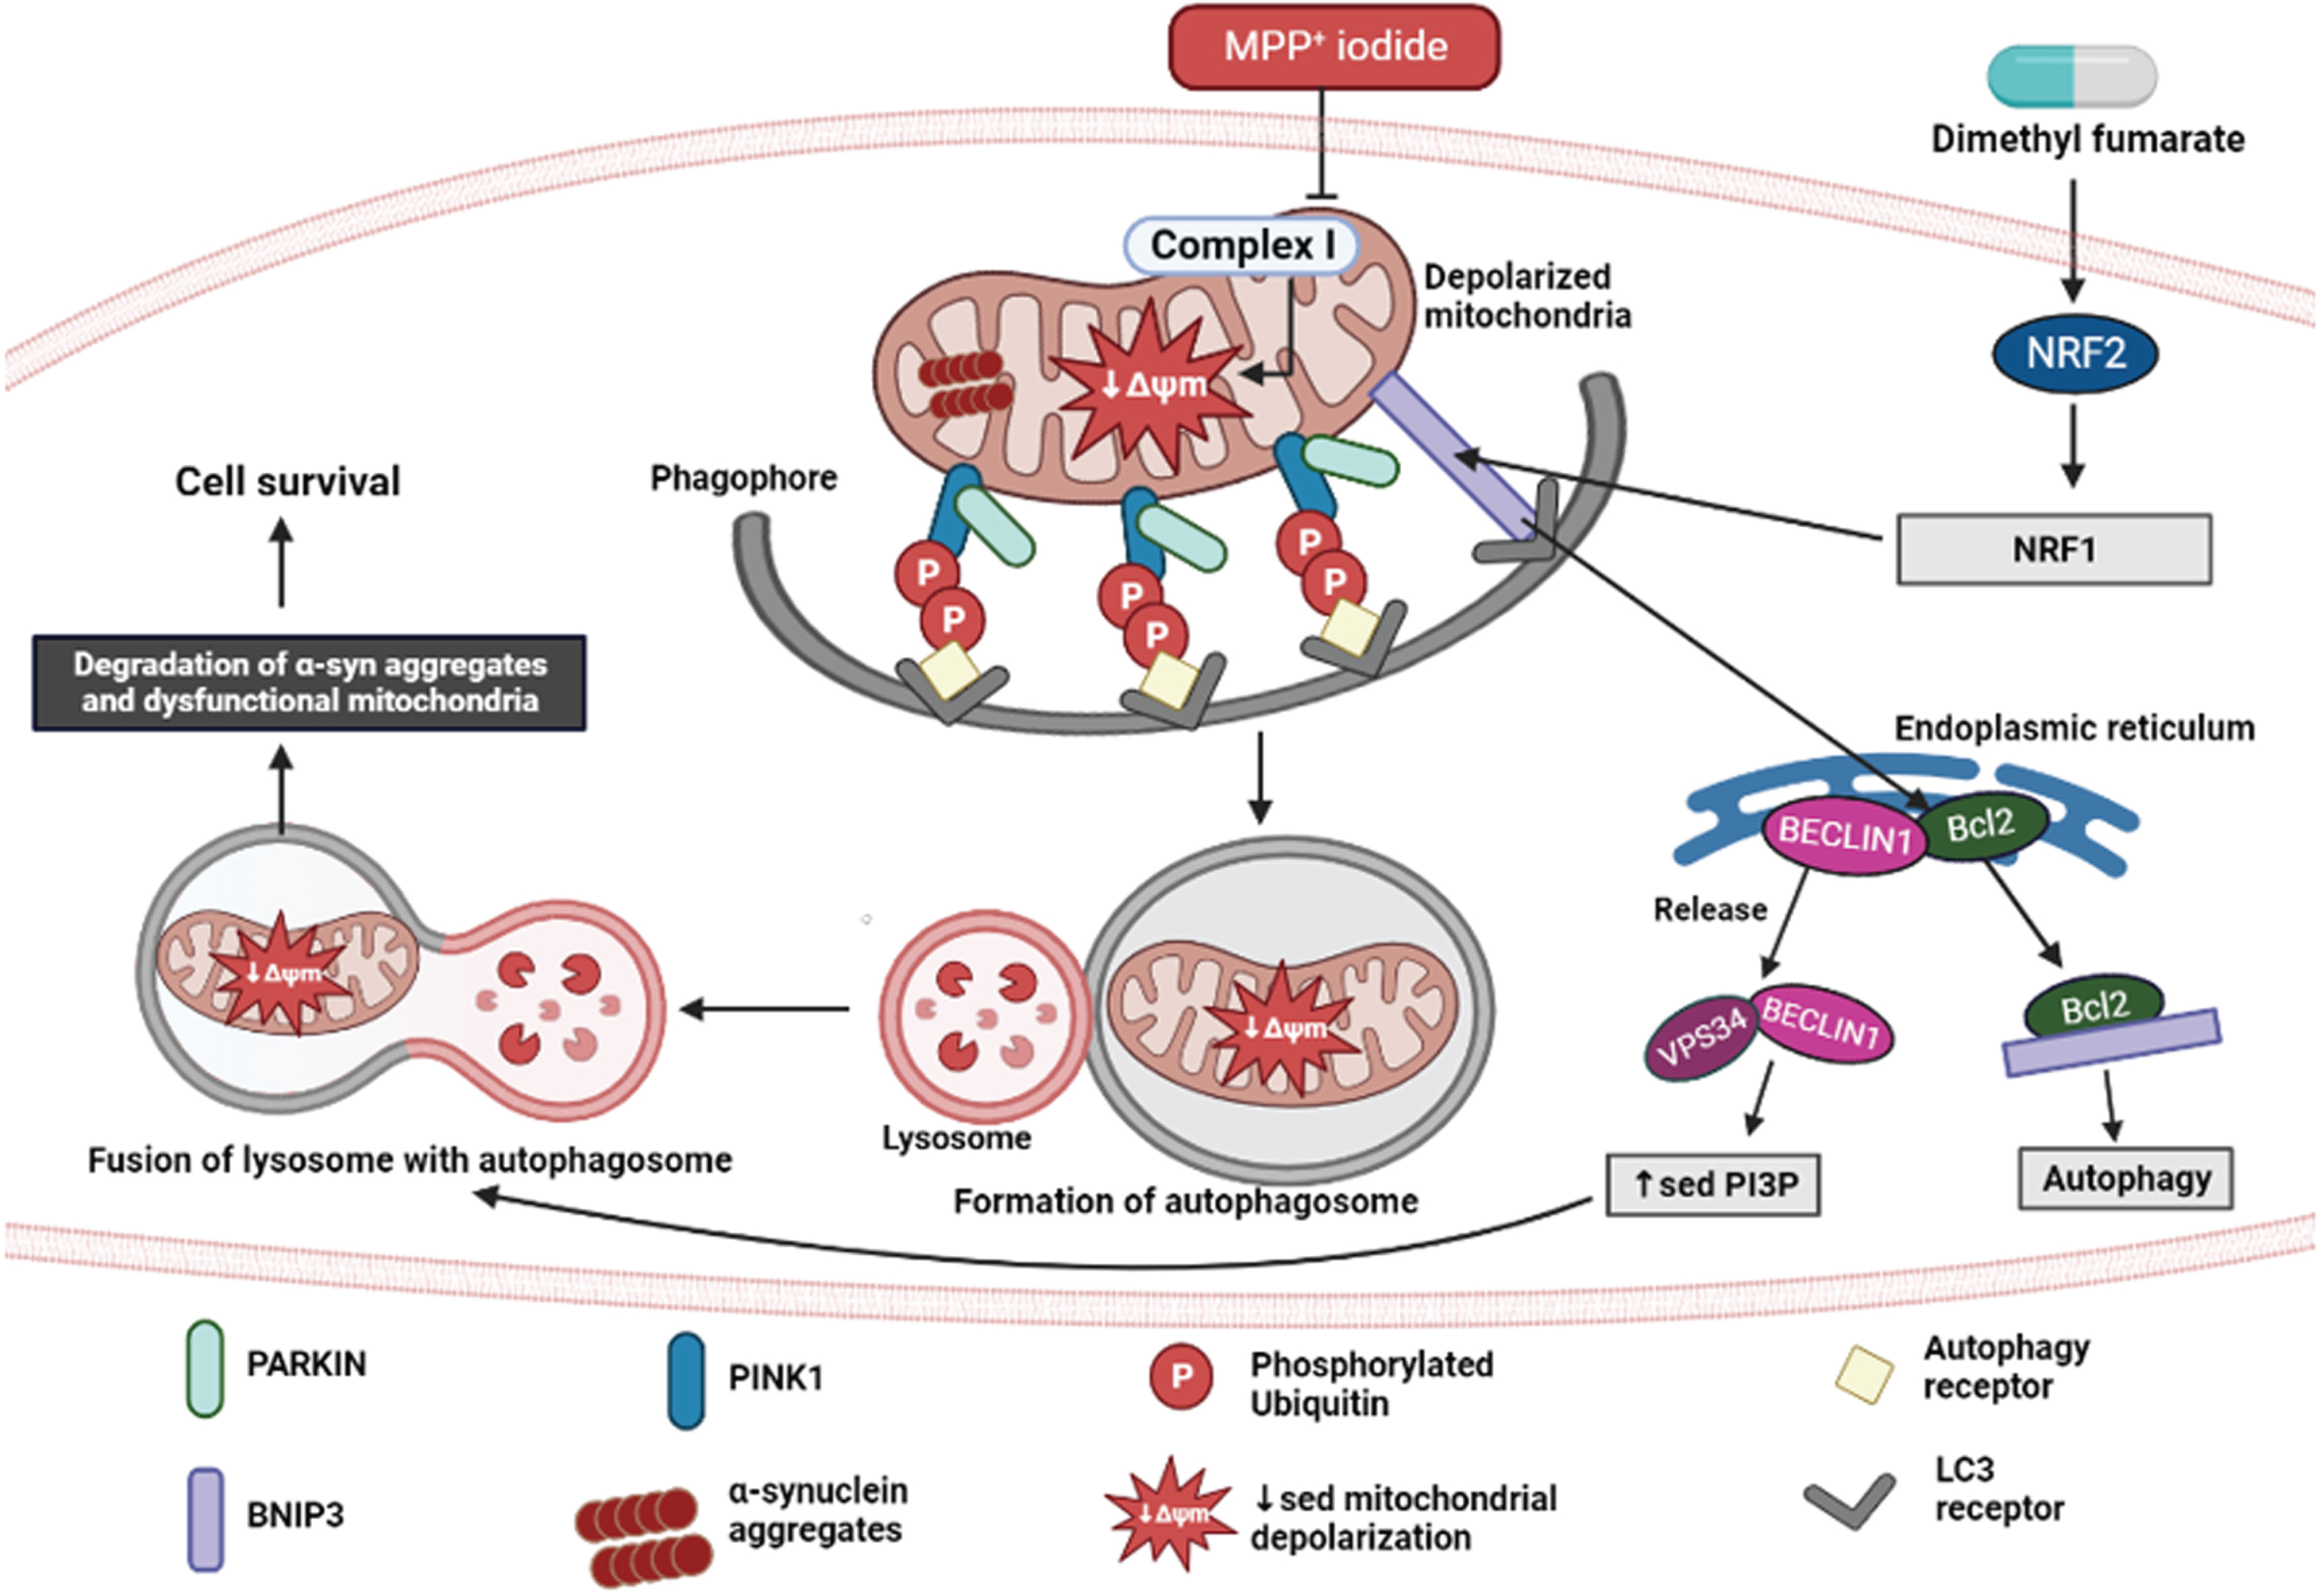
Autophagy is a vital phenomenon involved in maintaining the effective turnover of proteins and damaged organelles. α-syn accumulation is a consequence of malfunctional autophagic-lysosomal degradation in PD. Because dopaminergic neurons are more vulnerable to inadequate clearance of damaged mitochondria, accumulation of defective mitochondria increases reactive oxygen species levels and further accelerates the disease progression [14]. NRF2 is an important regulator of endogenous defense mechanisms in response to neurodegeneration in PD. Its activator, DMF, has been proven to be effective in reversing neuronal damage in various PD models [33–35]. Recently, evidence stated that NRF2 stimulates oxidative stress-induced autophagy in Parkinsonism. In this study, we proved that DMF exerts neuroprotective effect by promoting mitophagy via NRF2-BNIP3-PINK1 axis. The detailed mechanism is illustrated in Fig. 12.
Fig. 12
Neuroprotective effect of DMF in MPP+ iodide-induced PD model. Created in Biorender.com.
The neurobehavioral evaluation was performed using the rotarod, actimeter, and pole test. They suggested that the motor coordination of PD-induced mice was severely compromised, with bradykinesia being clearly evident. The latency fall (in rotarod); distance travelled, number of rearings, Vmean, resting time (in actimeter); and time to descend (in pole test) were significantly alleviated in DMF-treated mice in a dose-dependent manner (Figs. 4–6).
Western blot of mid-brain samples of the study animals revealed the downregulation of TH and α-syn aggregation in disease control animals, which was reversed upon 21-day exposure to DMF in different concentrations of 15, 30, and 60 mg/kg (Fig. 7). TH expression the SNpC region of the brain was also studied through immunofluorescence (Fig. 8). Its expression was minimal and DMF significantly elevated the TH concentration. Additionally, the decline in NRF2 expression as seen in PD mice was counteracted by DMF. The expression of NRF2 was found to be significantly increased in DMF-treated mice. We tried investigating the role of NRF2 in initiating the process of autophagy. NRF2 enables autophagy by enhancing the concentration of BNIP3 protein through a mediator NRF1 (Fig. 9). Loss of BNIP3 as MPP+ treated mice was reversed in DMF-treated mice.
As expected, the autophagic proteins PINK1 and PARKIN were found in lower levels in DC group when to the drug-exposed subjects. Increased BNIP3 by DMF is believed to be involved in upregulating the recruitment of PINK1 and PARKIN molecules thereby initiating the clearance of the damaged organelles through autophagy and promoting cell survival. Increased LC3A/BII levels in diseased animals denote the disturbance in the autophagolysosomal degradation which was alleviated through DMF. The effect of BNIP3 protein on BCL2-Beclin1 complex has also been investigated in this study (Fig. 10). In general, BNIP3 binds to BCL2 and the dissociation of Beclin1 from this complex activates autophagy [57]. In PD animals, the Beclin1 concentration was decreased upon the onset of stress (i.c.v. injection of MPP+ iodide) and the BCL2 expression was increased because of non-availability of BNIP3 protein to bind to it (Fig. 11). Taken together, our study has demonstrated that DMF has a neuroprotective potential especially by enhancing the NRF2-BNIP3-PINK1 axis and by targeting this pathway beneficial management of PD is possible. From this study, we conclude that DMF promoted mitophagy via NRF2-BNIP3-PINK1 axis in MPP+ induced PD model and ameliorated PD pathology in the study animals in a dose dependent manner. Thus, DMF exerts neuroprotective effect via its antioxidant as well as mitophagy promoting mechanism of actions in PD and can be further explored for its therapeutic potential in PD.
ACKNOWLEDGMENTS
All authors are thankful to the Department of Pharmacology and Toxicology, NIPER Hyderabad. Figure 12 was created in Biorender.com.
FUNDING
This work is supported by the National Institute of Pharmaceutical Education and Research, Hyderabad, and the Department of Pharmaceuticals, Ministry of Chemical and Fertilizers, Govt. of India.
CONFLICT OF INTEREST
The authors have no conflict of interest to report.
DATA AVAILABILITY
The raw data supporting the conclusions of this article will be made available by the corresponding author upon request.
REFERENCES
[1] | Dorsey ER , Bloem BR ((2018) ) The Parkinson pandemic— a call to action. JAMA Neurol 75: , 9–10. |
[2] | Parkinson J ((2002) ) An essay on the shaking palsy. 1817.. J Neuropsychiatry Clin Neurosci 14: , , 223–236discussion 222. |
[3] | Raza C , Anjum R , ul Ain Shakeel N ((2019) ) Parkinson’s disease: Mechanisms, translational models and management strategies. Life Sci 226: , 77–90. |
[4] | Ou Z , Pan J , Tang S , Duan D , Yu D , Nong H , Wang Z ((2021) ) Global trends in the incidence, prevalence, and years lived with disability of Parkinson’s disease in 204 countries/territories from 1990 to 2019. Front Public Health 9: , 776847. |
[5] | Dorsey ER , Constantinescu R , Thompson JP , Biglan KM , Holloway RG , Kieburtz K , Marshall FJ , Ravina BM , Schifitto G , Siderowf A , Tanner CM ((2007) ) Projected number of people with Parkinson disease in the most populous nations, 2005 through 2030. Neurology 68: , 384–386. |
[6] | Menzies FM , Fleming A , Caricasole A , Bento CF , Andrews SP , Ashkenazi A , Füllgrabe J , Jackson A , Jimenez Sanchez M , Karabiyik C , Licitra F , Lopez Ramirez A , Pavel M , Puri C , Renna M , Ricketts T , Schlotawa L , Vicinanza M , Won H , Zhu Y , Skidmore J , Rubinsztein DC ((2017) ) Autophagy and neurodegeneration: Pathogenic mechanisms and therapeutic opportunities. Neuron 93: , 1015–1034. |
[7] | Bloem BR , Okun MS , Klein C ((2021) ) Parkinson’s disease. Lancet 397: , 2284–2303. |
[8] | Gillmore JD , Gane E , Taubel J , Kao J , Fontana M , Maitland ML , Seitzer J , O’Connell D , Walsh KR , Wood K , Phillips J , Xu Y , Amaral A , Boyd AP , Cehelsky JE , McKee MD , Schiermeier A , Harari O , Murphy A , Kyratsous CA , Zambrowicz B , Soltys R , Gutstein DE , Leonard J , Sepp-Lorenzino L , Lebwohl D ((2021) ) CRISPR-Cas9 gene editing for transthyretin amyloidosis. N Engl J Med 385: , 493–502. |
[9] | Bose A , Beal MF ((2016) ) Mitochondrial dysfunction in Parkinson’s disease. J Neurochem 139: , 216–231. |
[10] | Tryphena KP , Anuradha U , Kumar R , Rajan S , Srivastava S , Singh SB , Khatri DK ((2023) ) Understanding the involvement of microRNAs in mitochondrial dysfunction and their role as potential biomarkers and therapeutic targets in Parkinson’s disease. J Alzheimers Dis 94: (s1), S187–S202. |
[11] | Samim Khan S , Janrao S , Srivastava S , Bala Singh S , Vora L , Kumar Khatri D ((2023) ) GSK-3β: An exuberating neuroinflammatory mediator in Parkinson’s disease. Biochem Pharmacol 210: , 115496. |
[12] | Khot M , Sood A , Tryphena KP , Khan S , Srivastava S , Singh SB , Khatri DK ((2022) ) NLRP3 inflammasomes: A potential target to improve mitochondrial biogenesis in Parkinson’s disease. Eur J Pharmacol 934: , 175300. |
[13] | Kulkarni A , Preeti K , Tryphena KP , Srivastava S , Singh SB , Khatri DK ((2023) ) Proteostasis in Parkinson’s disease: Recent development and possible implication in diagnosis and therapeutics. Ageing Res Rev 84: , 101816. |
[14] | Hou X , Watzlawik JO , Fiesel FC , Springer W ((2020) ) Autophagy in Parkinson’s disease. J Mol Biol 432: , 2651–2672. |
[15] | Xiao B , Kuruvilla J , Tan EK ((2022) ) Mitophagy and reactive oxygen species interplay in Parkinson’s disease. NPJ Parkinsons Dis 8: , 135. |
[16] | Motawi TK , Al-Kady RH , Senousy MA , Abdelraouf SM ((2023) ) Repaglinide elicits a neuroprotective effect in rotenone-induced Parkinson’s disease in rats: Emphasis on targeting the DREAM-ER stress BiP/ATF6/CHOP trajectory and activation of mitophagy. ACS Chem Neurosci 14: , 180–194. |
[17] | Lechado-Terradas A , Schepers S , Zittlau KI , Sharma K , Ok O , Fitzgerald JC , Geimer S , Westermann B , Macek B , Kahle PJ ((2022) ) Parkin-dependent mitophagy occurs via proteasome-dependent steps sequentially targeting separate mitochondrial sub-compartments for autophagy. Autophagy Rep 1: , 576–602. |
[18] | Lazarou M , Sliter DA , Kane LA , Sarraf SA , Wang C , Burman JL , Sideris DP , Fogel AI , Youle RJ ((2015) ) The ubiquitin kinase PINK1 recruits autophagy receptors to induce mitophagy. Nature 524: , 309–314. |
[19] | Koyano F , Okatsu K , Kosako H , Tamura Y , Go E , Kimura M , Kimura Y , Tsuchiya H , Yoshihara H , Hirokawa T , Endo T , Fon EA , Trempe JF , Saeki Y , Tanaka K , Matsuda N ((2014) ) Ubiquitin is phosphorylated by PINK1 to activate parkin. Nature 510: , 162–166. |
[20] | Strappazzon F , Nazio F , Corrado M , Cianfanelli V , Romagnoli A , Fimia GM , Campello S , Nardacci R , Piacentini M , Campanella M , Cecconi F ((2014) ) AMBRA1 is able to induce mitophagy via LC3 binding, regardless of PARKIN and p62/SQSTM1. Cell Death Differ 22: , 419–432. |
[21] | Chen Z , Liu L , Cheng Q , Li Y , Wu H , Zhang W , Wang Y , Sehgal SA , Siraj S , Wang X , Wang J , Zhu Y , Chen Q ((2017) ) Mitochondrial E3 ligase MARCH5 regulates FUNDC1 to fine-tune hypoxic mitophagy. EMBO Rep 18: , 495–509. |
[22] | Novak I , Kirkin V , McEwan DG , Zhang J , Wild P , Rozenknop A , Rogov V , Löhr F , Popovic D , Occhipinti A , Reichert AS , Terzic J , Dötsch V , Ney PA , Dikic I ((2010) ) Nix is a selective autophagy receptor for mitochondrial clearance. EMBO Rep 11: , 45–51. |
[23] | Zhu Y , Massen S , Terenzio M , Lang V , Chen-Lindner S , Eils R , Novak I , Dikic I , Hamacher-Brady A , Brady NR ((2013) ) Modulation of serines 17 and 24 in the LC3-interacting region of Bnip3 determines pro-survival mitophagy versus apoptosis. J Biol Chem 288: , 1099–1113. |
[24] | Palikaras K , Lionaki E , Tavernarakis N ((2018) ) Mechanisms of mitophagy in cellular homeostasis, physiology and pathology. Nat Cell Biol 20: , 1013–1022. |
[25] | Jiao L , Du X , Li Y , Jiao Q , Jiang H ((2022) ) Role of mitophagy in neurodegenerative diseases and potential targets for therapy. Mol Biol Rep 49: , 10749–10760. |
[26] | Wang Q , Xue H , Yue Y , Hao S , Huang SH , Zhang Z ((2022) ) Role of mitophagy in the neurodegenerative diseases and its pharmacological advances: A review. Front Mol Neurosci 15: , 1014251. |
[27] | Masaldan S , Callegari S , Dewson G ((2022) ) Therapeutic targeting of mitophagy in Parkinson’s disease. Biochem Soc Trans 50: , 783–797. |
[28] | Zhang J , Ney PA ((2009) ) Role of BNIP3 and NIX in cell death, autophagy, and mitophagy. Cell Death Differ 16: , 939–946. |
[29] | Chen M , Peng L , Gong P , Zheng X , Sun T , Zhang X , Huo J ((2021) ) Baicalein mediates mitochondrial autophagy via miR-30b and the NIX/BNIP3 signaling pathway in Parkinson’s disease. Biochem Res Int 2021: , 2319412. |
[30] | Zhang T , Xue L , Li L , Tang C , Wan Z , Wang R , Tan J , Tan Y , Han H , Tian R , Billiar TR , Tao WA , Zhang Z ((2016) ) BNIP3 protein suppresses PINK1 kinase proteolytic cleavage to promote mitophagy. J Biol Chem 291: , 21616–21629. |
[31] | Rajan S , Tryphena KP , Khan S , Vora L , Srivastava S , Singh SB , Khatri DK ((2023) ) Understanding the involvement of innate immunity and the Nrf2-NLRP3 axis on mitochondrial health in Parkinson’s disease. Ageing Res Rev 87: , 101915. |
[32] | Riis S , Murray JB , O’Connor R ((2020) ) IGF-1 signalling regulates mitochondria dynamics and turnover through a conserved GSK-3β-Nrf2-BNIP3 pathway. Cells 9: , 147. |
[33] | Campolo M , Casili G , Biundo F , Crupi R , Cordaro M , Cuzzocrea S , Esposito E ((2017) ) The neuroprotective effect of dimethyl fumarate in an MPTP-mouse model of Parkinson’s disease: Involvement of reactive oxygen species/nuclear factor-κB/nuclear transcription factor related to NF-E2. Antioxid Redox Signal 27: , 453–471. |
[34] | Jing X , Shi H , Zhang C , Ren M , Han M , Wei X , Zhang X , Lou H ((2015) ) Dimethyl fumarate attenuates 6-OHDA-induced neurotoxicity in SH-SY5Y cells and in animal model of Parkinson’s disease by enhancing Nrf2 activity. Neuroscience 286: , 131–140. |
[35] | Fumagalli F , Calbi V , Natali Sora MG , Sessa M , Baldoli C , Rancoita PMV , Ciotti F , Sarzana M , Fraschini M , Zambon AA , Acquati S , Redaelli D , Attanasio V , Miglietta S , De Mattia F , Barzaghi F , Ferrua F , Migliavacca M , Tucci F , Gallo V , Del Carro U , Canale S , Spiga I , Lorioli L , Recupero S , Fratini ES , Morena F , Silvani P , Calvi MR , Facchini M , Locatelli S , Corti A , Zancan S , Antonioli G , Farinelli G , Gabaldo M , Garcia-Segovia J , Schwab LC , Downey GF , Filippi M , Cicalese MP , Martino S , Di Serio C , Ciceri F , Bernardo ME , Naldini L , Biffi A , Aiuti A ((2022) ) Lentiviral haematopoietic stem-cell gene therapy for early-onset metachromatic leukodystrophy: Long-term results from a non-randomised, open-label, phase 1/2 trial and expanded access. Lancet 399: , 372–383. |
[36] | Abd El-Fatah IM , Abdelrazek HMA , Ibrahim SM , Abdallah DM , El-Abhar HS ((2021) ) Dimethyl fumarate abridged tauo-/amyloidopathy in a D-Galactose/ovariectomy-induced Alzheimer’s-like disease: Modulation of AMPK/SIRT-1, AKT/CREB/BDNF, AKT/GSK-3β, adiponectin/Adipo1R, and NF-κB/IL-1β/ROS trajectories. Neurochem Int 148: , 105082. |
[37] | Majkutewicz I , Kurowska E , Podlacha M , Myślińska D , Grembecka B , Ruciński J , Pierzynowska K , Wrona D ((2018) ) Age-dependent effects of dimethyl fumarate on cognitive andneuropathological features in the streptozotocin-induced rat modelof Alzheimer’s disease. Brain Res 1686: , 19–33. |
[38] | Kourakis S , Timpani CA , de Haan JB , Gueven N , Fischer D , Rybalka E ((2020) ) Dimethyl fumarate and its esters: A drug with broad clinical utility? Pharmaceuticals 13: , 306. |
[39] | Khot M , Sood A , Tryphena KP , Pinjala P , Srivastava S , Singh SB , Khatri DK ((2023) ) Dimethyl fumarate ameliorates parkinsonian pathology by modulating autophagy and apoptosis via Nrf2-TIGAR-LAMP2/Cathepsin D axis. Brain Res 1815: , 148462. |
[40] | Katila N , Bhurtel S , Park P-H , Choi D-Y ((2021) ) Metformin attenuates rotenone-induced oxidative stress and mitochondrial damage via the AKT/Nrf2 pathway. Neurochem Int 148: , 105120. |
[41] | Di Martino RMC , Pruccoli L , Bisi A , Gobbi S , Rampa A , Martinez A , Pérez C , Martinez-Gonzalez L , Paglione M , Di Schiavi E , Seghetti F , Tarozzi A , Belluti F ((2020) ) Novel curcumin-diethyl fumarate hybrid as a dualistic GSK-3β inhibitor/Nrf2 inducer for the treatment of Parkinson’s disease. ACS Chem Neurosci 11: , 2728–2740. |
[42] | Yang R , Ye S , Zhang S , Huang H , Zhang Y , Yang Y , Xie S , He L , Yang Y , Shi J ((2023) ) Serotonin and dopamine depletion in distinct brain regions may cause anxiety in 1-methyl-4-phenyl-1,2,3,6-tetrahydropyridine-treated mice as a model of early Parkinson’s disease. Neuroreport 34: , 551–559. |
[43] | Rojas P , Serrano-García N , Medina-Campos ON , Pedraza-Chaverri J , Maldonado PD , Ruiz-Sánchez E ((2011) ) S-Allylcysteine, a garlic compound, protects against oxidative stress in 1-methyl-4-phenylpyridinium-induced parkinsonism in mice. J Nutr Biochem 22: , 937–944. |
[44] | Alcaraz-Zubeldia M , Boll-Woehrlen MC , Montes-López S , Pérez-Severiano F , Martínez-Lazcano JC , Díaz-Ruiz A , Ríos C ((2009) ) Copper sulfate prevents tyrosine hydroxylase reduced activity and motor deficits in a Parkinson’s disease model in mice. Rev Invest Clin 61: , 405–411. |
[45] | Kim H , Shin J-Y , Jo A , Kim JH , Park S , Choi J-Y , Kang HC , Dawson VL , Dawson TM , Shin J-H , Lee Y ((2021) ) Parkin interacting substrate phosphorylation by c-Abl drives dopaminergic neurodegeneration. Brain 144: , 3674–3691. |
[46] | Sedelis M , Schwarting RKW , Huston JP ((2001) ) Behavioral phenotyping of the MPTP mouse model of Parkinson’s disease. Behav Brain Res 125: , 109–125. |
[47] | Leem YH , Park JS , Park JE , Kim DY , Kim HS ((2022) ) Neurogenic effects of rotarod walking exercise in subventricular zone, subgranular zone, and substantia nigra in MPTP-induced Parkinson’s disease mice. Sci Rep 12: , 10544. |
[48] | Michel A , Downey P , Nicolas J-M , Scheller D ((2014) ) Unprecedented therapeutic potential with a combination of A2A/NR2B receptor antagonists as observed in the 6-OHDA lesioned rat model of Parkinson’s disease. PLoS One 9: , e114086. |
[49] | Shao Q , Chen Y , Li F , Wang S , Zhang X , Yuan Y , Chen N ((2019) ) TLR4 deficiency has a protective effect in the MPTP/probenecid mouse model of Parkinson’s disease. Acta Pharmacol Sin 40: , 1503–1512. |
[50] | Wang W , Lv Z , Gao J , Liu M , Wang Y , Tang C , Xiang J ((2021) ) Treadmill exercise alleviates neuronal damage by suppressing NLRP3 inflammasome and microglial activation in the MPTP mouse model of Parkinson’s disease. Brain Res Bull 174: , 349–358. |
[51] | Zhang Q , Heng Y , Mou Z , Huang J , Yuan Y , Chen N ((2017) ) Reassessment of subacute MPTP-treated mice as animal model of Parkinson’s disease. Acta Pharmacol Sin 38: , 1317–1328. |
[52] | Chen X , Liu Z , Cao B-B , Qiu Y-H , Peng Y-P ((2017) ) TGF-β1 Neuroprotection via inhibition of microglial activation in a rat model of Parkinson’s disease. J Neuroimmune Pharmacol 12: , 433–446. |
[53] | Moretti M , Neis VB , Matheus FC , Cunha MP , Rosa PB , Ribeiro CM , Rodrigues ALS , Prediger RD ((2015) ) Effects of agmatine on depressive-like behavior induced by intracerebroventricular administration of 1-Methyl-4-phenylpyridinium (MPP+). Neurotox Res 28: , 222–231. |
[54] | Irwin I , Ricaurte GA , DeLanney LE , Langston JW ((1988) ) The sensitivity of nigrostriatal dopamine neurons to MPP+does not increase with age. Neurosci Lett 87: , 51–56. |
[55] | Meredith GE , Rademacher DJ ((2011) ) MPTP mouse models of Parkinson’s disease: An update. J Parkinsons Dis 1: , 19–33. |
[56] | Tryphena KP , Nikhil US , Pinjala P , Srivastava S , Singh SB , Khatri DK ((2023) ) Mitochondrial complex I as a pathologic and therapeutic target for Parkinson’s disease. ACS Chem Neurosci 14: , 1356–1368. |
[57] | Decuypere J-P , Parys JB , Bultynck G ((2012) ) Regulation of the autophagic bcl-2/beclin 1 interaction. Cells 1: , 284–312. |


