
Relationship Between Sphingomyelin and Risk of Alzheimer’s Disease: A Bidirectional Mendelian Randomization Study
Abstract
Background:
Alzheimer’s disease (AD) is a complex neurodegenerative disorder whose etiology involves multiple genetic and environmental factors. Sphingomyelin (SM) is a type of sphingolipid found in cell membranes, and recent evidence suggests a potential link between SM and AD. However, the nature of this relationship remains unclear.
Objective:
To elucidate the potential causal relationship between SM levels and the risk of developing AD using a two-sample Mendelian randomization approach.
Methods:
The study utilized data extracted from the genome wide association study database. The primary analysis method was the inverse variance weighted (IVW) method, which was supplemented by weighted median, weighted mode, and MR Egger methods. The study specifically investigated the bidirectional causal relationship between SM and AD, evaluating odds ratios (OR) with a 95% confidence interval (95% CI).
Results:
Elevated levels of SM were found to be a risk factor for AD, as shown by IVW(MRE) [OR: 1.001, 95% CI: 1.000 to 1.002; p = 0.020 < 0.05], IVW(FE) [OR: 1.001, 95% CI: 1.001 to 1.002; p = 3.36e-07 < 0.05], and MR Egger. Conversely, AD was demonstrated to lead to an increase in SM levels [IVW(MRE): OR: 5.64e+08, 95% CI: 1.69e+05 to 1.89e+12; p = 1.14e-06 < 0.05], with consistent findings across the IVW(FE), MR Egger, weighted median, and weighted mode methods.
Conclusions:
The study establishes a bidirectional positive correlation between SM and AD. Increased SM levels are associated with a higher risk of developing AD, and the presence of AD can further elevate SM levels, potentially exacerbating the disease’s progression.
INTRODUCTION
Alzheimer’s disease (AD) is a progressive central nervous system degenerative disorder characterized by learning and memory deficits, as well as a progressive decline in cognitive function [1]. With the gradual increase in human life expectancy and advancements in diagnostic methods, the incidence and total number of AD cases are rising each year. Consequently, AD has become one of the most significant threats to the quality of life and health of the elderly, posing a substantial challenge to global economic development [2]. AD belongs to cortical dementia and degenerative dementia and is an irreversible form of dementia. Clinically, the onset is insidious, characterized by a continuous and progressive decline in cognitive functions without remission. The hallmark of AD is cognitive impairment, with prominent memory disturbances. Additionally, it may manifest with aphasia, acalculia, apraxia, and agnosia, and lead to impairments in social, daily living, or occupational functions, exhibiting a unique neuropsychological deficit pattern. The clinical manifestations of AD include cognitive impairment symptoms, non-cognitive neuropsychiatric symptoms, and a decline in social and daily living functions. Among these, the decline in social and daily living functions is a consequence of cognitive impairment and non-cognitive neuropsychiatric symptoms, primarily characterized by reduced learning ability, working capacity, and self-care abilities [2, 3]. The primary pathological features of AD are the deposition of senile plaques formed by amyloid-β (Aβ) protein accumulation, neurofibrillary tangles resulting from hyperphosphorylation of tau protein, and neuron loss in specific brain regions [3]. At present, the etiology and pathogenesis of AD remain elusive, making accurate and effective treatments hard to find. Thus, there’s an urgent need to explore strategies for preventing and treating AD.
Studies have indicated that lipids, especially cholesterol and sphingomyelin (SM), might play crucial roles in the pathogenesis of AD [4, 5]. SM is a vital lipid component involved in the structure and function of cell membranes. Essential for the normal function of the nervous system, it constitutes a significant part of the myelin sheath. Given that SM is enriched in the myelin sheath and closely related to cholesterol in lipid rafts, abnormalities in SM metabolism could lead to AD. Current evidence has identified a direct link between SM metabolic disturbances and neurodegenerative diseases in the brain [6], suggesting SM could be a potential breakthrough in AD research.
Current studies suggest a possible relationship between SM and AD. However, results remain inconsistent, and the precise causal relationship has been debated, with contradictions across various studies. While some investigations have found increased SM levels in AD patients [7, 8], others have shown decreased SM levels [9–11] or no change at all [12]. Such disparities could be attributed to the varying sample sizes, research methodologies, regional and ethnic diversities, and other confounding factors of these studies.
The two-sample Mendelian randomization (TSMR) method is a powerful tool in epidemiological research. Its core concept revolves around using genetic variations as instrumental variables to determine causal relationships between risk factors and specific diseases [13–15]. TSMR can effectively circumvent confounding issues in observational studies, reverse causation, and challenges of representativeness and feasibility in randomized controlled trials [16]. To date, no studies, domestic or international, have utilized the TSMR method to evaluate the causal relationship between SM and AD. Therefore, to elucidate the causal relationship between SM and AD, this study employs the TSMR method to investigate the potential causal link between them, aiming to provide a theoretical basis for the prevention and treatment of AD.
MATERIALS AND METHODS
Methods and research design
In this study, we utilized publicly available genome wide association study (GWAS) summary databases and took SM and AD as the exposure or outcome factors respectively. We employed the TSMR method to assess the bidirectional causal relationship between SM and AD.
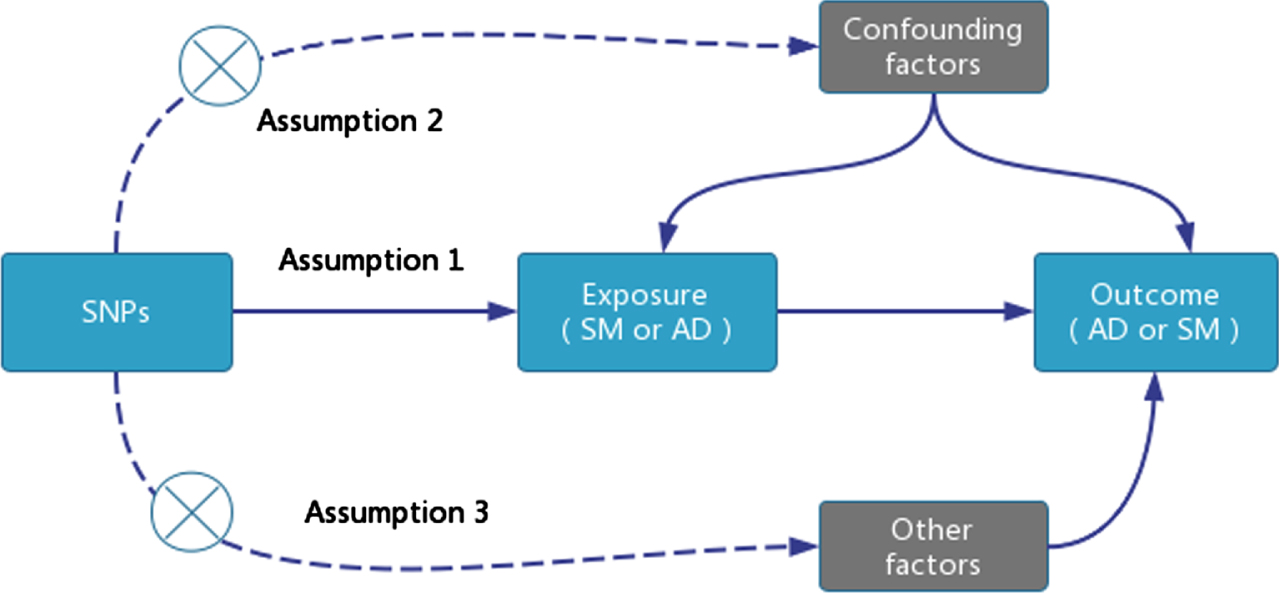
TSMR analysis requires satisfying three core assumptions: single nucleotide polymorphisms (SNPs) as instrumental variables (IVs) must be closely associated with the exposure factor: 1) Select SNPs associated with SM that are genome-wide significant (p < 5E-08). However, due to the limited number of SNPs that are genome-wide significant (p < 5E-08) and related to AD, which are insufficient for TSMR analysis, we chose SNPs that are genome-wide significant (p < 5E-06); 2) Remove SNPs with linkage disequilibrium (r2 < 0.001, Clumping distance = 10,000 KB); 3) Exclude SNPs associated with confounding factors; 4) All SNPs must be screened through the calculation of the F-statistic to avoid weak instrument variable bias, with a value >10 indicating the absence of weak instrument variables. The F-statistic is calculated as F = [(N - K - 1) / K] * [R2 / (1 - R2)], where N is the sample size of the exposure factor, K is the number of instrumental variables, and R2 is the proportion of variance in the exposure factor explained by the instrumental variables [17] (Fig. 1).
Fig. 1
TSMR Research Design Model.
Data source and selection of IVs
For this research, we accessed the GWAS database via the MR Base platform (http://app.mrbase.org/). Data concerning SM was derived from a study of 114,999 individuals, whereas the data for AD came from the UK Biobank, encompassing 488,285 Europeans and 12,321,875 SNPs (Table 1).
Table 1
Summary of Genetic Data Information
| variable | GWAS ID | Sample size | SNPs | Population | Sex | Year |
| SM | met-d-Sphingomyelins | 114999 | 12321875 | European | Males and Females | 2020 |
| AD | ieu-b-5067 | 488285 | 12321875 | European | Males and Females | 2022 |
To align with the TSMR research design, IVs must be closely associated with the exposure factors SM or AD. We adopted a genome-wide significance threshold (p < 5E-08) to select SNPs significantly associated with SM or AD. Using clumping procedures (r2 < 0.001, Clumping distance = 10,000 KB), we removed SNPs that exhibited linkage disequilibrium. Ultimately, in the outcome data AD or SM corresponding to the exposure factors SM or AD, 59 independent SNPs related to the exposure factor SM were extracted as IVs (Fig. 2). However, only 4 independent SNPs related to the exposure factor AD were retrieved. Thus, we resorted to a substitute significance threshold of p < 5E-06. Under this criterion, 26 independent SNPs associated with the exposure factor AD were extracted as IVs (Table 2).
Fig. 2
TSMR analysis results of causal relationship between SM and AD.
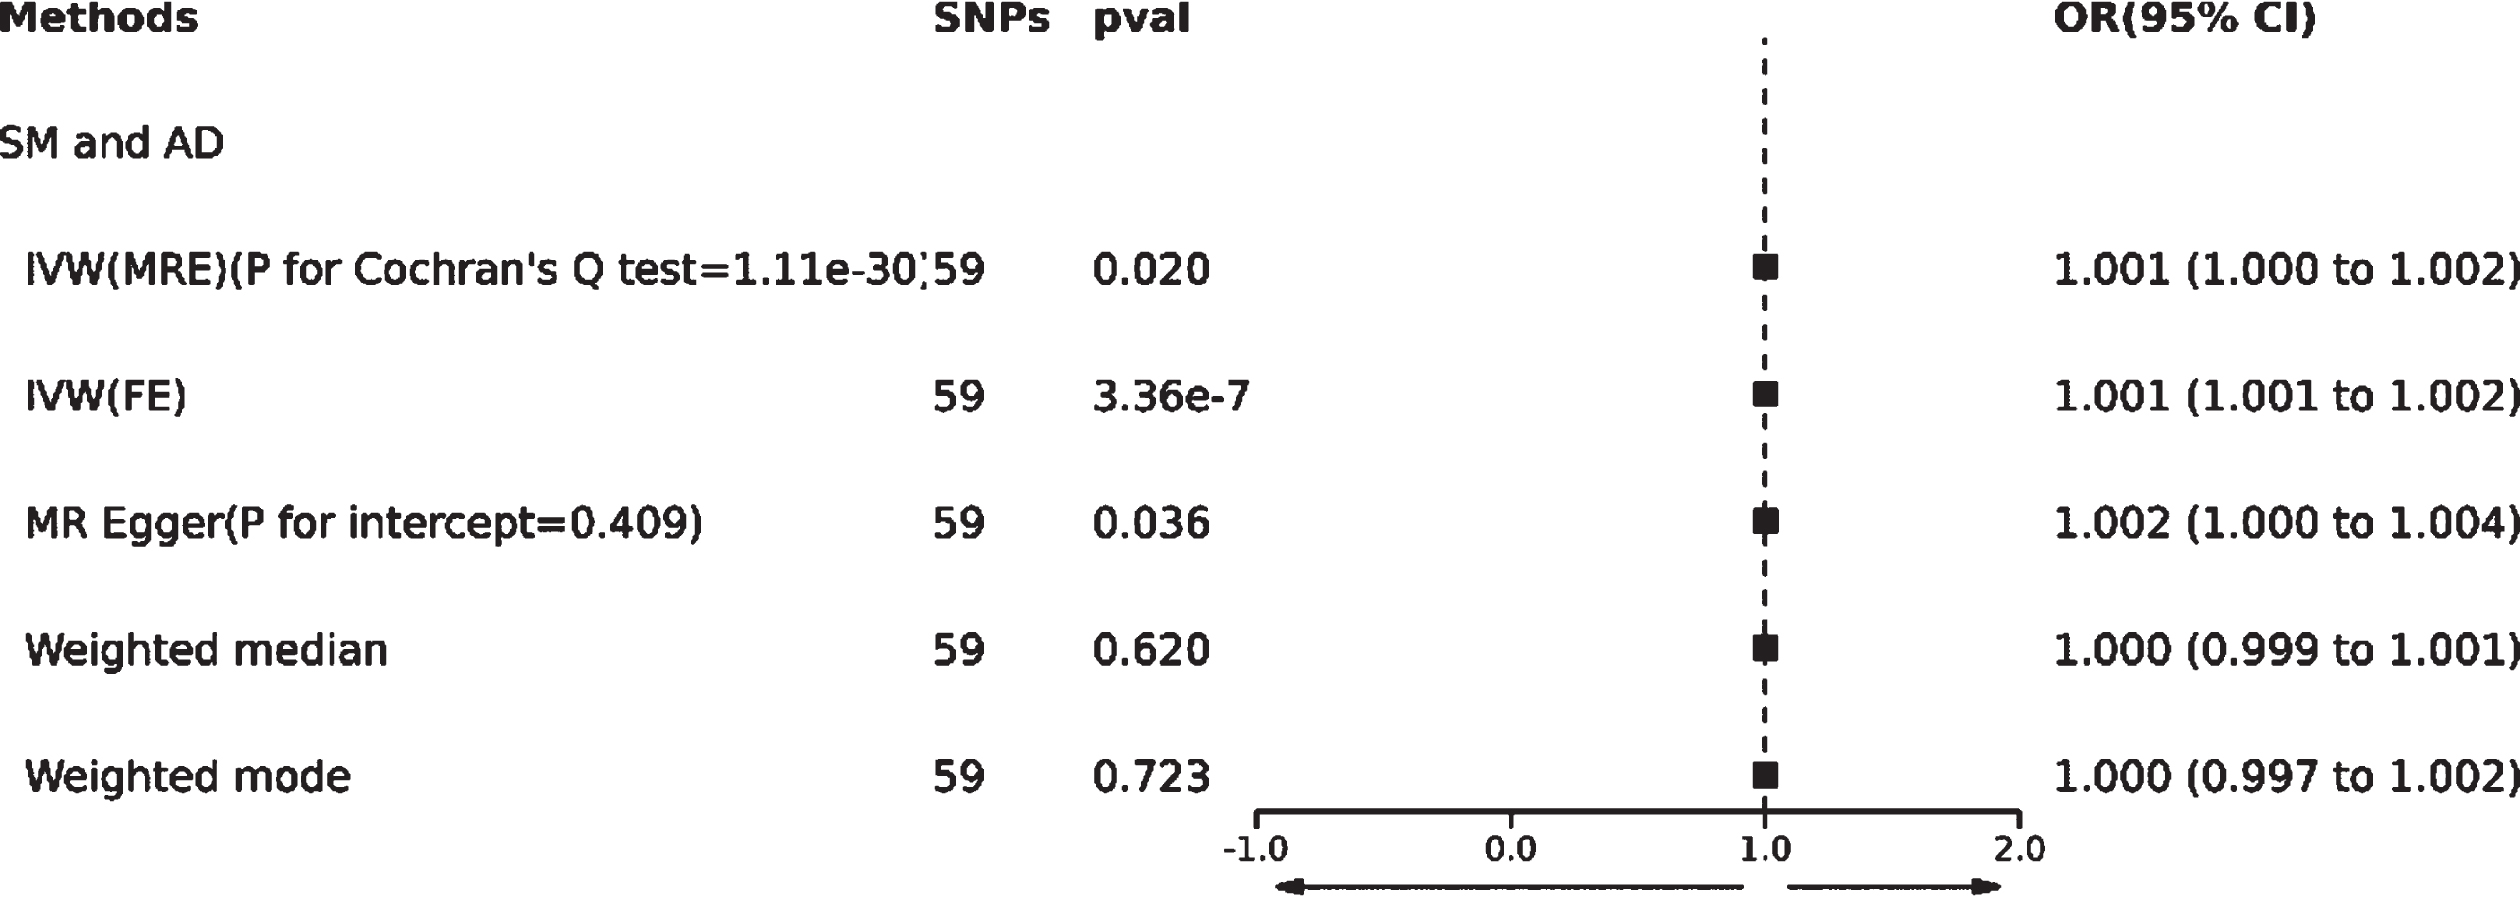
Table 2
TSMR analysis results of the causal relationship between AD and SM
| Methods | SNPs | OR (95% CI) | p for association | p for Cochran’s Q test | p for MR Egger intercept |
| AD and SM | |||||
| IVW(MRE) | 26 | 5.64e+08 (1.69e+05 to 1.89e+12) | 1.14e-06 | 4.36e-58 | |
| IVW(FE) | 26 | 5.64e+08 (6.35e+07 to 5.01e+09) | 4.11e-73 | ||
| MR Egger | 26 | 2.14e+11 (3.19e+05 to 1.44e+17) | 8.46e-04 | 0.287 | |
| Weighted median | 26 | 3.43e+07 (1.39e+04 to 8.44e+10) | 1.34e-05 | ||
| Weighted mode | 26 | 8.24e+12 (1.55e+11 to 4.38e+14) | 8.66e-14 | ||
Moreover, we employed the F-test to evaluate whether the chosen IVs have a weak instrument bias. An F value greater than 10 indicates the absence of weak instrument bias, further corroborating the associativity hypothesis. The formula is F = [(N-K-1)/K]*[R ∧2/(1-R ∧2)], where N represents the sample size of the exposure factor, K is the number of instrumental variables, and R ∧2 is the proportion of exposure variation explained by the IVs [18].
TSMR statistical analysis
This study primarily employed the inverse variance weighted (IVW) method for analysis. We used Cochran’s Q to test for heterogeneity. If p < 0.05, suggesting the presence of heterogeneity, we then utilized the multiplicative random effects (MRE) method to mitigate bias arising from heterogeneity. If p > 0.05, indicating no evident heterogeneity affecting our results, the fixed effects (FE) method was adopted for analysis [19, 20].
We also employed supplementary analysis methods such as weighted median, weighted mode, and MR Egger for validation. The MR Egger method is a way to detect and adjust for pleiotropy in TSMR analysis to obtain causal effect estimates. This tests whether the results are influenced by horizontal pleiotropy; if p > 0.05, then there is no horizontal pleiotropy, meaning IVs affect the outcome entirely through the exposure. If p < 0.05, suggesting horizontal pleiotropy exists, the MR Egger method is primarily used for analysis [21, 22]. The weighted median and weighted mode methods use a majority of IVs to determine the existence of a causal relationship; when a few IVs do not satisfy the validity assumption, the estimate remains robust, although not unbiased [23]. If the result from the IVW method is significant (p < 0.05) and no pleiotropy is detected, even if the outcomes from other methods are not significant, as long as the direction of other methods is consistent, it can be considered a positive result [24].
To interpret the results more intuitively, this study employed the odds ratio (OR) and its 95% confidence interval (95% CI) as effect indicators. A p value less than 0.05 was considered statistically significant. Additionally, to ensure the overall effect’s reliability, we conducted a “leave-one-out” analysis. By sequentially omitting one SNP and calculating the MR effect of the remaining SNPs, we assessed the potential outlier instrumental variables, thus gauging the stability of the TSMR analysis results [25].
RESULTS
Causal relationship results between SM and AD
Based on the methodology of this study, 59 SNPs related to SM were extracted as IVs. The effect of each SNP locus on AD through TSMR analysis is illustrated in Fig. 3A. All SNPs underwent the F-test, with F-values ranging from 29.777 to 2598.546, all >10, suggesting no weak instrument bias affecting the study’s outcome, thus confirming the reliability of the data results. The MR Egger horizontal pleiotropy test (p for intercept = 0.409 > 0.05) is shown in Fig. 2, indicating no horizontal pleiotropy. The funnel plot also demonstrates no apparent bias (Fig. 3B). Calculating Cochran’s Q value (p = 1.11e-30 < 0.05) indicates heterogeneity, leading the primary analysis method to be IVW(MRE) as seen in Fig. 2.
Fig. 3
Forest plot (A), funnel plot (B), scatter plot (C), and leave-one-out plot (D) illustrating the causal relationship between SM and AD.
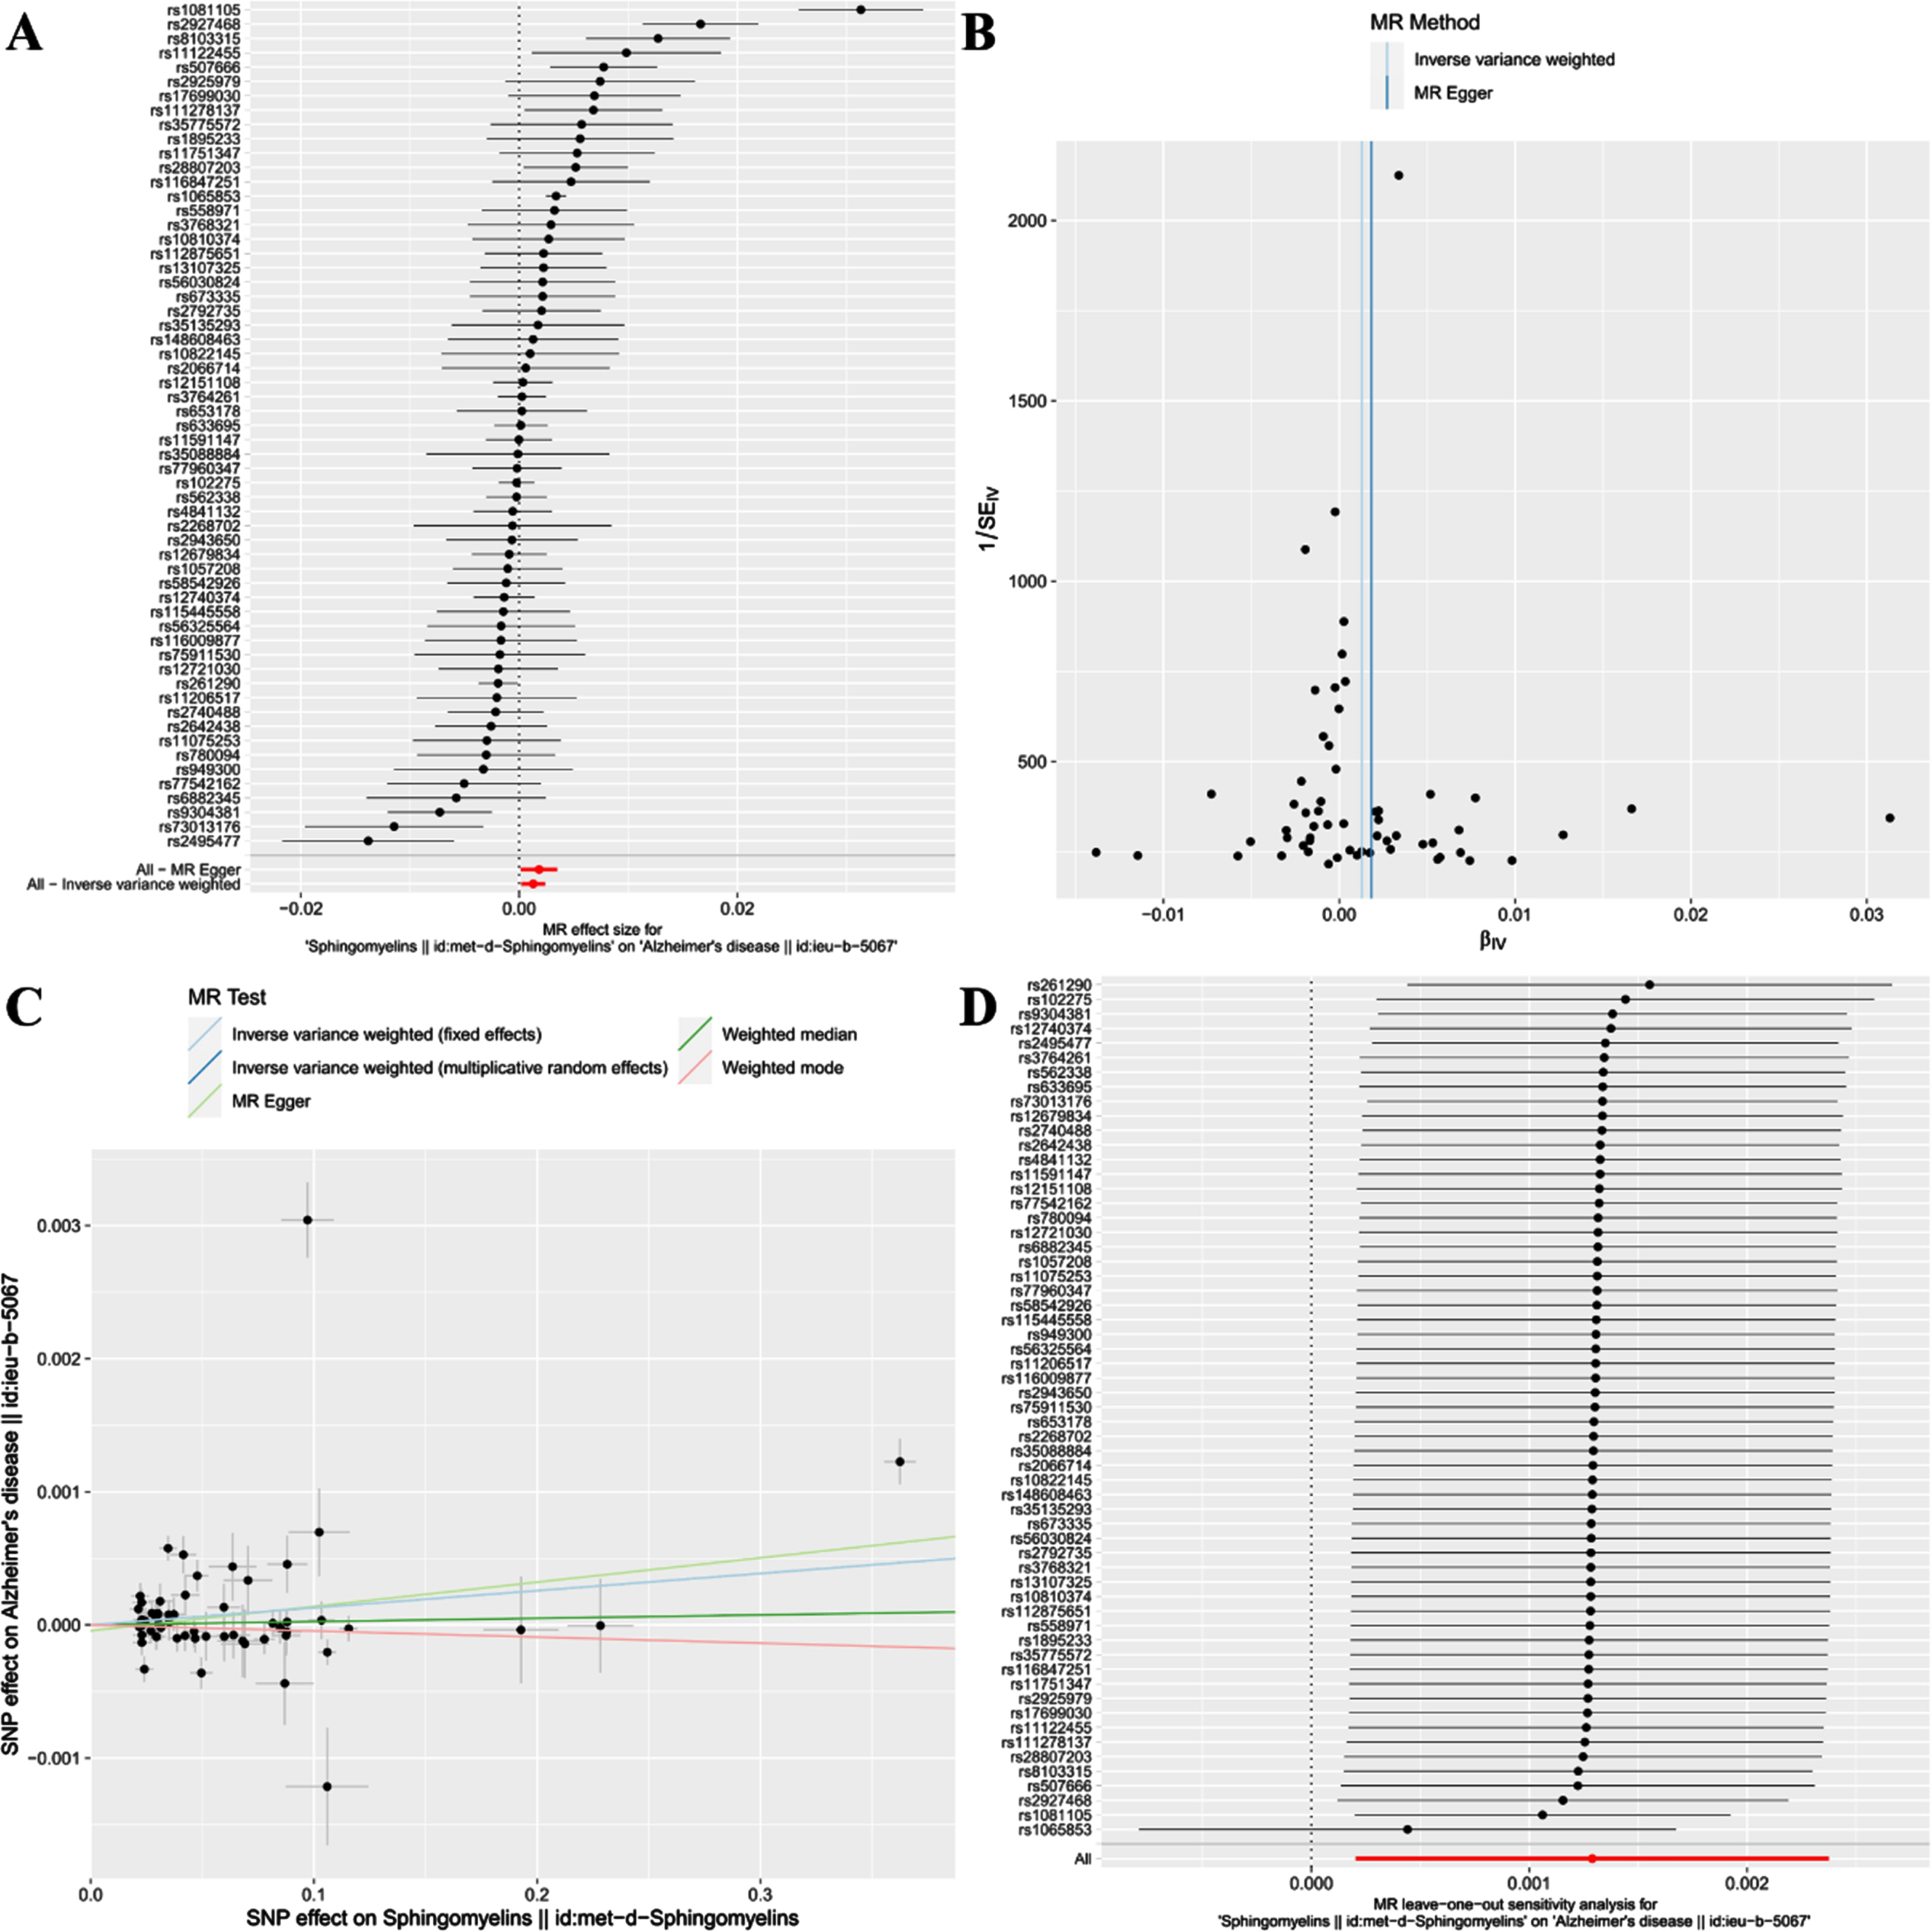
This study reveals a positive correlation between SM and AD, suggesting that SM might be a risk factor for the onset of AD [IVW(MRE): OR: 1.001, 95% CI: 1.000 to 1.002; p = 0.020 < 0.05]. Concurrently, [IVW(FE): OR: 1.001, 95% CI: 1.001 to 1.002; p = 3.36e-07 < 0.05] and the MR Egger method [OR: 1.002, 95% CI: 1.000 to 1.004; p = 0.036 < 0.05] further validated this finding. However, neither the Weighted median nor Weighted mode analysis discovered similar outcomes(Figs. 2 and 3C).
Additionally, a “leave-one-out” analysis was performed. This step-by-step exclusion test suggested that no single SNP significantly influenced the result’s robustness, ensuring the study’s stability and reliability (Fig. 3D).
Causal relationship results between AD and SM
For the reverse TSMR, 26 SNPs related to AD were extracted as IVs. The effect of each SNP locus on SM through TSMR analysis is shown in Fig. 4A. All SNPs underwent the F-test, with F-values ranging from 20.773 to 797.552, all >10, indicating no weak instrument bias affecting the results, affirming the reliability of the data. The MR Egger horizontal pleiotropy test (p for intercept = 0.287 > 0.05) is provided in Table 2, suggesting no horizontal pleiotropy; the funnel plot also indicates no apparent bias (Fig. 4B). Calculating Cochran’s Q value (p = 4.36e-58 < 0.05) shows heterogeneity, so the primary analysis method is IVW(MRE), as described in Table 2.
Fig. 4
Forest plot (A), funnel plot (B), scatter plot (C), and leave-one-out plot (D) illustrating the causal relationship between AD and SM.
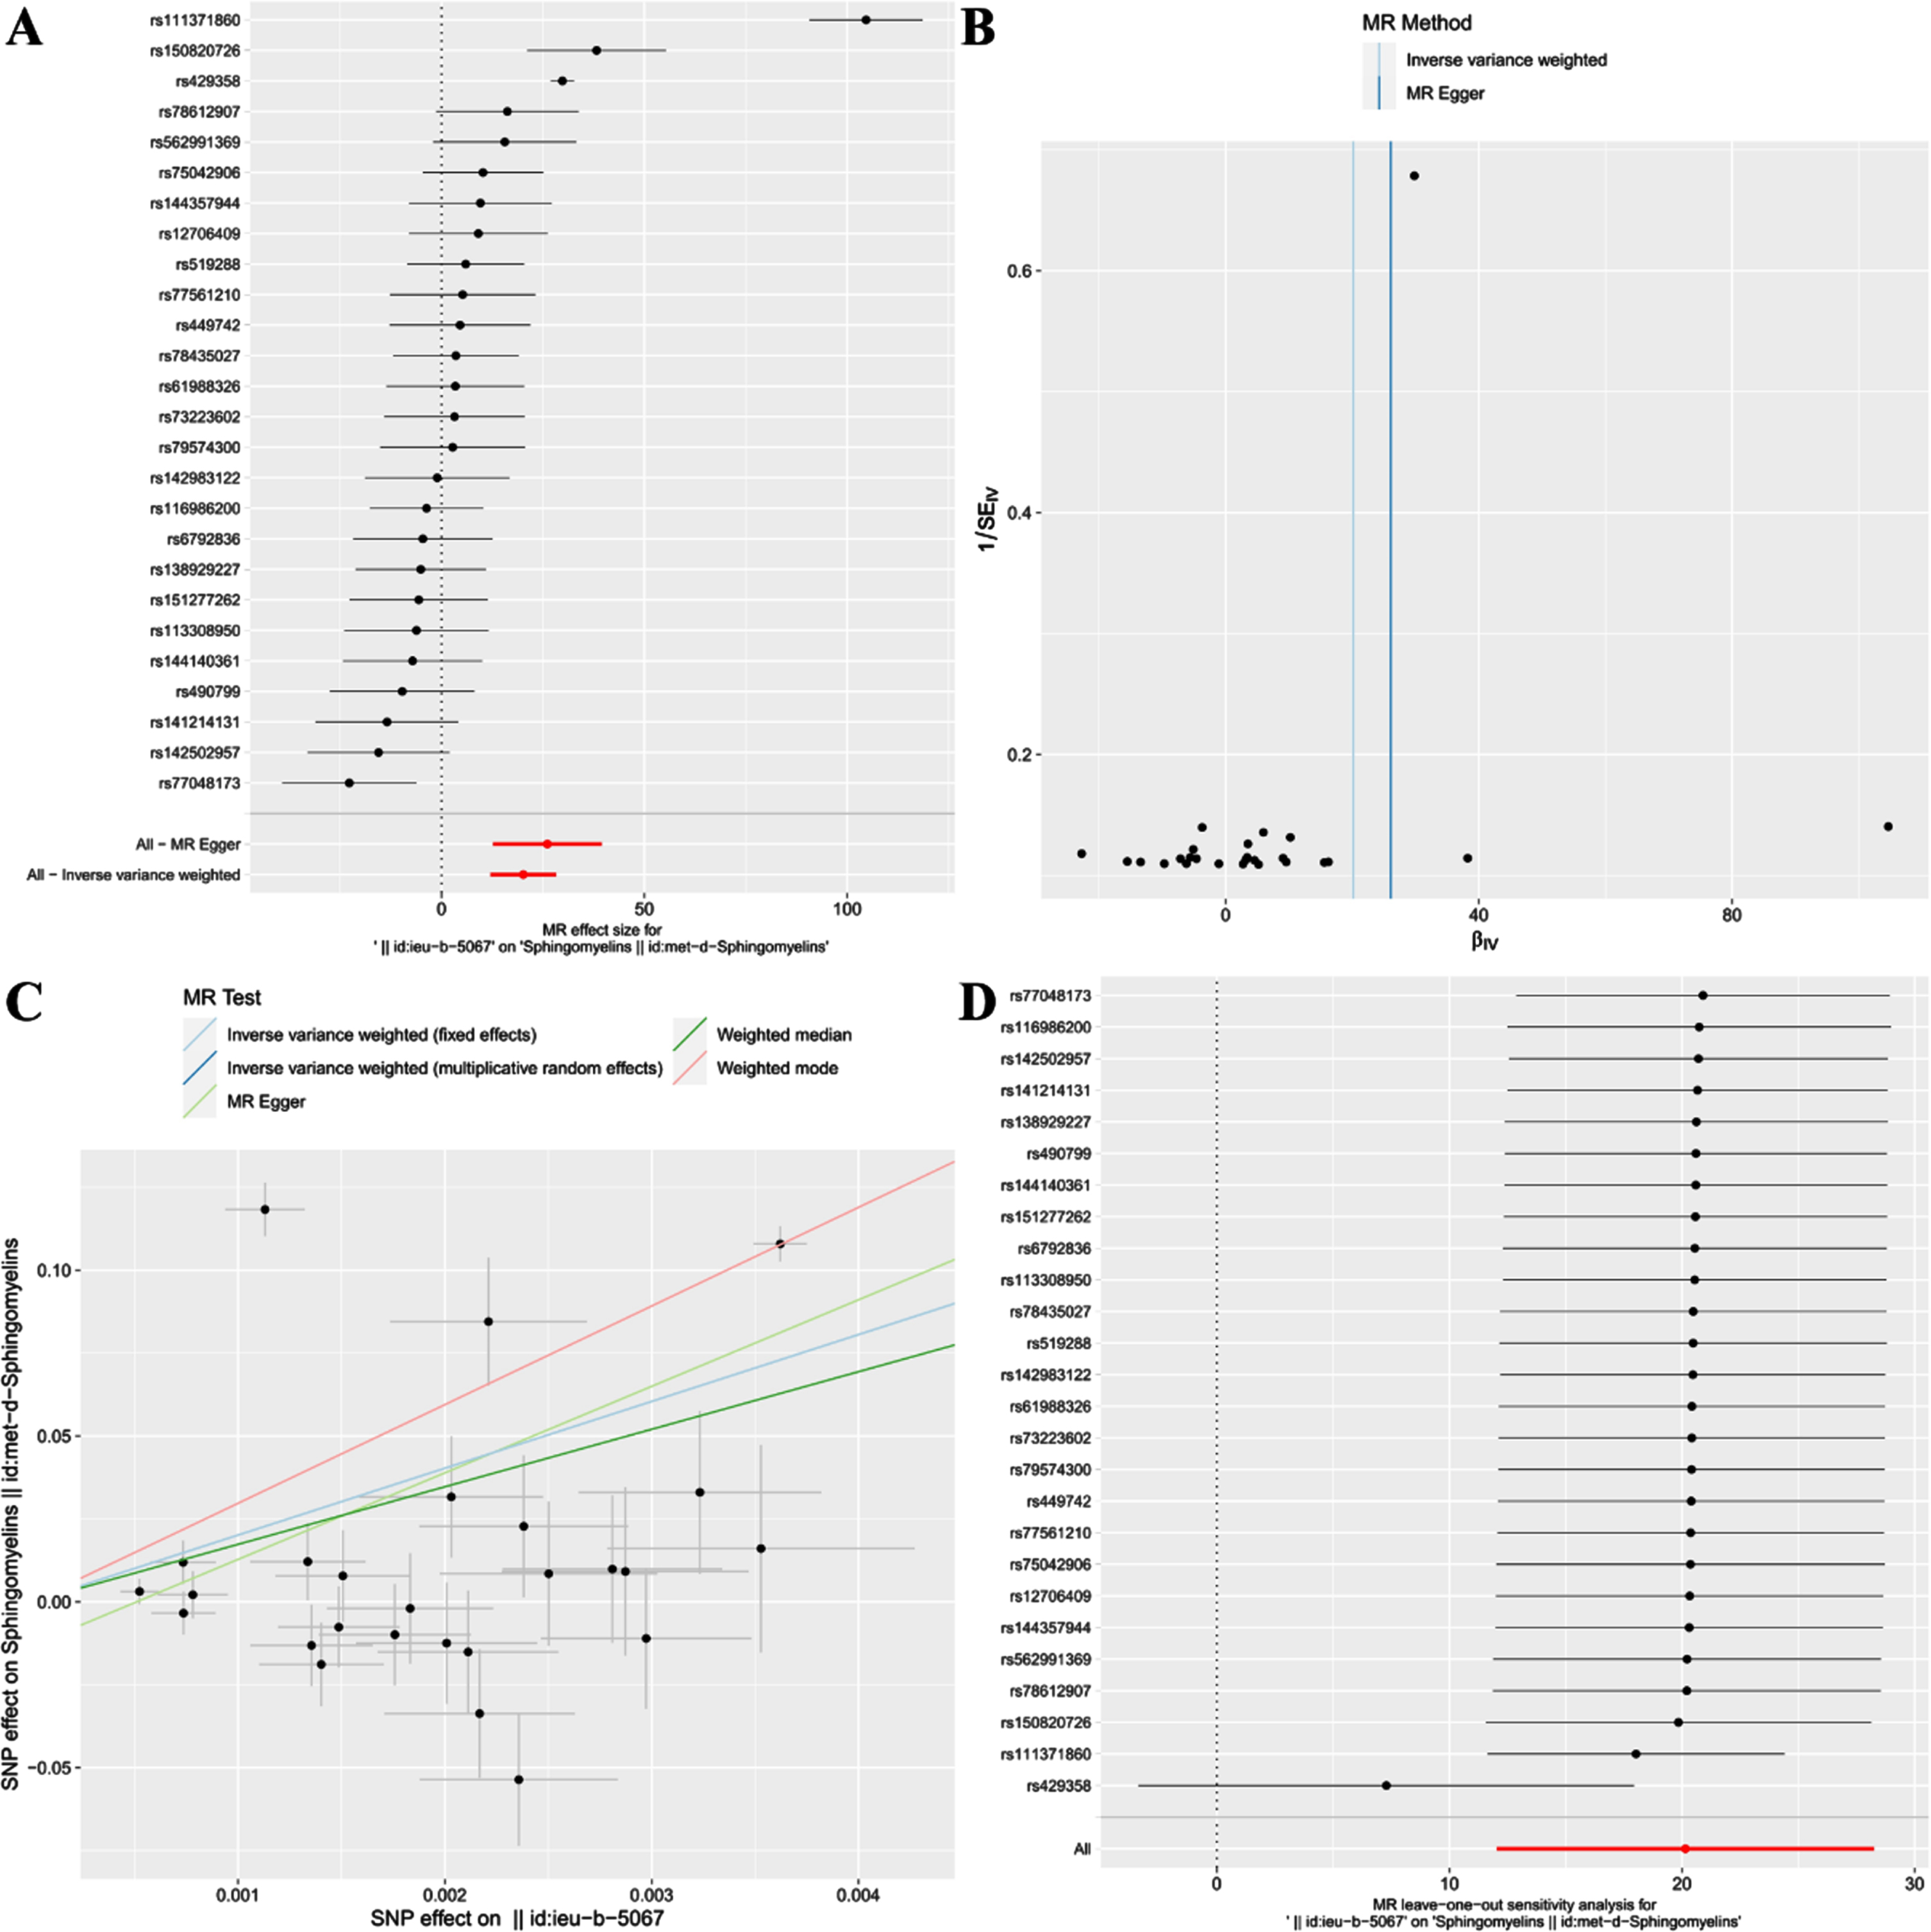
This study discovered a significant positive correlation between AD and SM, suggesting that AD could likely lead to an increase in SM [IVW(MRE): OR: 5.64e+08, 95% CI: 1.69e+05 to 1.89e+12; p = 1.14e-06 < 0.05]. Concurrently, results from IVW(FE) [OR: 5.64e+08, 95% CI: 6.35e+07 to 5.01e+09; p = 4.11e-73 < 0.05], MR Egger [OR: 2.14e+11, 95% CI: 3.19e+05 to 1.44e+17; p = 8.46e-04 < 0.05], Weighted median [OR: 3.43e+07, 95% CI: 1.39e+04 to 8.44e+10; p = 1.34e-05 < 0.05], and Weighted mode [OR: 8.24e+12, 95% CI: 1.55e+11 to 4.38e+14; p = 8.66e-14 < 0.05] further confirm this finding (Table 2, Fig. 4C).
Additionally, after conducting the “leave-one-out” analysis and progressively excluding SNPs, the results indicate no single SNP significantly influences the robustness of the results, ensuring the study’s stability and reliability (Fig. 4D).
DISCUSSION
This study employed a bidirectional TSMR research method to systematically assess the causal relationship between SM and AD. Predictions at the genetic level suggest a bidirectional positive correlation between SM and AD. On one hand, this indicates that SM is a risk factor for the onset of AD and is associated with an increased risk of AD. On the other hand, it suggests that AD may lead to a further increase in SM.
Our findings are consistent with previous observational studies that identify SM as a risk factor for the onset of AD, with higher concentrations of SM increasing the risk of developing AD. A metabolomic analysis of the AD brain revealed that high concentrations of SM are closely associated with increased severity of AD pathology and cognitive abnormality risks [26]. Depp et al. [27] used models of chronic myelin damage to systematically unveil its role in promoting amyloid protein deposition, a hallmark pathology of AD. The study revealed that myelin damage likely triggers accelerated Aβ production from axonal swelling, and diverts the attention of microglial cells, thus slowing down Aβ clearance. This disrupts the brain’s internal balance and accelerates plaque production. SM, being the most abundant sphingolipid in the brain and highly concentrated in myelin, may increase in concentration due to myelin damage. A 31P nuclear magnetic resonance study found increased SM in AD subjects’ brain tissues, suggesting abnormal SM metabolism could lead to AD [28]. Thus, SM might serve as a biomarker for early detection and prevention of AD, and correcting SM metabolic disturbances could be a promising and innovative AD therapeutic strategy [26].
Concurrently, our reverse TSMR analysis found that AD leads to an increase in SM. Although current research presents mixed results regarding SM levels in AD patients, our study at the genetic level supports that AD causes an increase in SM levels. Kosicek et al. [29] speculate that the rise in SM levels in AD might be a cellular response to high ceramide levels, which then partially metabolizes into SM. Moreover, Agarwal et al. [30] found a close relationship between ABCA7 rs3764650 gene mutations and impaired SM transport function. The progression and severity of AD might be linked to ABCA7’s impaired SM transport function. Cuyvers et al. [31] found that knocking out ABCA7 in mice significantly elevates both SM and ceramide levels. Under physiological conditions in normal populations, ABCA7 protein transports SM inside neuronal cells to APOA1/HDL, regulating neuronal ceramide metabolism and maintaining normal exosome production and secretion. SM-rich APOA1/HDL increases the affinity for soluble Aβ, facilitating Aβ clearance through the blood-brain barrier [32]. AD patients might impair ABCA7’s SM transport function, resulting in increased SM levels.
Differences in past study outcomes could be attributed to factors like sample size, research methodology, regional and ethnic diversity, etc. Genetic variations remain stable throughout an individual’s life, and allele classification and fixation are random. Therefore, the results discovered at the genetic level in this bidirectional TSMR study can avoid biases caused by various confounding factors.
However, our study has some limitations. Firstly, we used a genome-wide significance threshold (p < 5E-08) and extracted only four independent SNPs related to the exposure factor AD. Choosing a limited number of SNPs as IVs might only explain a small part of the exposure variations, affecting the causal estimate’s statistical power. Hence, we adopted a significance threshold of p < 5E-06 and extracted 26 independent SNPs related to the exposure factor AD as IVs. Secondly, TSMR analysis data was sourced from Europeans, and it remains to be verified if genetic differences exist across different ethnicities, countries, and regions. Lastly, although we have confirmed the bidirectional causal relationship between SM and AD, the underlying mechanism remains unclear. Further in-depth research is required to explore the interaction mechanism between SM and AD.
Conclusion
In summary, through bidirectional TSMR analysis, this study found a bidirectional positive correlation between SM and AD. On one hand, it indicates that SM is a risk factor for the onset of AD, with increased SM being associated with a higher risk of AD onset. This study innovatively uses TSMR analysis to discover from a genetic perspective that there is a bidirectional positive correlation between SM and AD. On one hand, it suggests that SM is a risk factor for the onset of AD, with elevated levels of SM being associated with a higher risk of AD onset. On the other hand, it indicates that AD can also lead to a further increase in SM, potentially exacerbating the progression of AD. This study not only fills a gap in this field but also has positive clinical implications. We should advocate for enhanced monitoring of SM in clinical settings, providing new clinical evidence for the prevention and treatment of AD. Furthermore, it can also provide theoretical references for the development of new drugs, paving the way for the development of medications aimed at regulating SM in AD patients.
ACKNOWLEDGMENTS
The authors have no acknowledgments to report.
FUNDING
The work is supported by the National Natural Science Foundation of China (No. 82104244), Wuxi Municipal Health Commission (No. Q202101 and ZH202110), Wuxi Taihu Talent Project (No. WXTTP2020008 and WXTTP2021), Wuxi Medical Development Discipline Project (No. FZXK2021012) and Jiangsu Research Hospital Association for Precision Medication (JY202105).
CONFLICT OF INTEREST
The authors have no conflict of interest to report.
DATA AVAILABILITY
The dataset generated during and analyzed during the current study are available from the MR Base database (http://www.mrbase.org/).
REFERENCES
[1] | Chen YG ((2018) ) Research progress in the pathogenesis of Alzheimer’s disease. Chin Med J 131: , 1618–1624. |
[2] | Liu YS , Zhao HF , Li Q , Cui HW , Huang GD ((2023) ) Research progress on the etiology and pathogenesis of Alzheimer’s disease from the perspective of chronic stress. Aging Dis 14: , 1292. |
[3] | Pinky PD , Pfitzer JC , Senfeld J , Hong H , Bhattacharya S , Suppiramaniam V , Qureshi I , Reed MN ((2023) ) Recent insights on glutamatergic dysfunction in Alzheimer’s disease and therapeutic implications. Neuroscientist 29: , 461–471. |
[4] | Yin F ((2023) ) Lipid metabolism and Alzheimer’s disease: Clinical evidence, mechanistic link and therapeutic promise. FEBS J 290: , 1420–1453. |
[5] | Yu W , Ying J , Wang X , Liu X , Zhao T , Yoon S , Zheng Q , Fang Y , Yang D , Hua F ((2021) ) The involvement of lactosylceramide in central nervous system inflammation related to neurodegenerative disease. Front Aging Neurosci 13: , 691230. |
[6] | Zou G , Su J , Zhang Y ((2020) ) Effects of environmental enrichment on cognitive behavior and the expression of adenosine triphosphate binding cassette transporter A7 in hippocampus of adolescent mice with high fat diet. J Cent South Univ Med Sci 45: , 892–900. |
[7] | Koal T , Klavins K , Seppi D , Kemmler G , Humpel C ((2015) ) Sphingomyelin SM (d18:1/18:0) is significantly enhanced in cerebrospinal fluid samples dichotomized by pathological amyloid-β 42, tau, and phospho-tau-181 levels. J Alzheimers Dis 44: , 1193–1201. |
[8] | Christie M , Igreja C ((2023) ) eIF4E-homologous protein (4EHP): A multifarious cap-binding protein. FEBS J 290: , 266–285. |
[9] | Park MW , Cha HW , Kim J , Kim JH , Yang H , Yoon S , Boonpraman N , Yi SS , Yoo ID , Moon JS ((2021) ) NOX4 promotes ferroptosis of astrocytes by oxidative stress-induced lipid peroxidation via the impairment of mitochondrial metabolism in Alzheimer’s diseases. Redox Biol 41: , 101947. |
[10] | Jęśko H , Wieczorek I , Wencel PL , Gąssowska-Dobrowolska M , Lukiw WJ , Strosznajder RP ((2021) ) Age-related transcriptional deregulation of genes coding synaptic proteins in Alzheimer’s disease murine model: Potential neuroprotective effect of fingolimod. Front Mol Neurosci 14: , 660104. |
[11] | Khan MJ , Chung NA , Hansen S , Dumitrescu L , Hohman TJ , Kamboh MI , Lopez OL , Robinson RAS ((2022) ) Targeted lipidomics to measure phospholipids and sphingomyelins in plasma: A pilot study to understand the impact of race/ethnicity in Alzheimer’s disease. Anal Chem 94: , 4165–4174. |
[12] | Qiu S , Palavicini JP , Wang J , Gonzalez NS , He S , Dustin E , Zou C , Ding L , Bhattacharjee A , Van Skike CE , Galvan V , Dupree JL , Han X ((2021) ) Adult-onset CNS myelin sulfatide deficiency is sufficient to cause Alzheimer’s disease-like neuroinflammation and cognitive impairment. Mol Neurodegener 16: , 1–24. |
[13] | Lu Y , Xu Z , Georgakis MK , Wang Z , Lin H , Zheng L ((2021) ) Smoking and heart failure: A Mendelian randomization and mediation analysis. ESC Heart Fail 8: , 1954–1965. |
[14] | Titova OE , Michaëlsson K , Larsson SC ((2020) ) Sleep duration and stroke: Prospective cohort study and Mendelian randomization analysis. Stroke 51: , 3279–3285. |
[15] | Ahmed M , Mulugeta A , Lee SH , Mäkinen VP , Boyle T , Hyppönen E ((2021) ) Adiposity and cancer: A Mendelian randomization analysis in the UK biobank. Int J Obes 45: , 2657–2665. |
[16] | Hemani G , Zheng J , Elsworth B , Wade KH , Haberland V , Baird D , Laurin C , Burgess S , Bowden J , Langdon R , Tan VY , Yarmolinsky J , Shihab HA , Timpson NJ , Evans DM , Relton C , Martin RM , Davey Smith G , Gaunt TR , Haycock PC ((2018) ) The MR-Base platform supports systematic causal inference across the human phenome. Elife 7: , e34408. |
[17] | Sekula P , Del Greco M F , Pattaro C , Köttgen A ((2016) ) Mendelian randomization as an approach to assess causality using observational data. J Am Soc Nephrol 27: , 3253. |
[18] | Bowden J , Del Greco M F , Minelli C , Davey Smith G , Sheehan NA , Thompson JR ((2016) ) Assessing the suitability of summary data for two-sample Mendelian randomization analyses using MR-Egger regression: The role of the I2 statistic. Int J Epidemiol 45: , 1961–1974. |
[19] | Chen G , Wang Q , Xue R , Liu X , Yu H ((2021) ) Examining the causal inference of leptin and soluble plasma leptin receptor levels on schizophrenia: A Mendelian randomization study. Front Psychiatry 12: , 753224. |
[20] | Wang S , Zhu H , Pan L , Zhang M , Wan X , Xu H , Hua R , Zhu M , Gao P ((2023) ) Systemic inflammatory regulators and risk of acute-on-chronic liver failure: A bidirectional mendelian-randomization study. Front Cell Dev Biol 11: , 1125233. |
[21] | Bowden J , Del Greco M F , Minelli C , Davey Smith G , Sheehan NA , Thompson JR ((2016) ) Assessing the suitability of summary data for two-sample Mendelian randomization analyses using MR-Egger regression: The role of the I2 statistic. Int J Epidemiol 45: , 1961–1974. |
[22] | Burgess S , Thompson SG ((2017) ) Interpreting findings from Mendelian randomization using the MR-Egger method. Eur J Epidemiol 32: , 377–389. |
[23] | Gill D , Efstathiadou A , Cawood K , Tzoulaki I , Dehghan A ((2019) ) Education protects against coronary heart disease and stroke independently of cognitive function: Evidence from Mendelian randomization. Int J Epidemiol 48: , 1468–1477. |
[24] | Chen X , Kong J , Diao X , Cai J , Zheng J , Xie W , Qin H , Huang J , Lin T ((2020) ) Depression and prostate cancer risk: A Mendelian randomization study. Cancer Med 9: , 9160–9167. |
[25] | Nolte IM ((2020) ) Metasubtract: An R-package to analytically produce leave-one-out meta-analysis GWAS summary statistics. Bioinformatics 36: , 4521–4522. |
[26] | Varma VR , Oommen AM , Varma S , Casanova R , An Y , Andrews RM , O’Brien R , Pletnikova O , Troncoso JC , Toledo J , Baillie R , Arnold M , Kastenmueller G , Nho K , Doraiswamy PM , Saykin AJ , Kaddurah-Daouk R , Legido-Quigley C , Thambisetty M ((2018) ) Brain and blood metabolite signatures of pathology and progression in Alzheimer disease: A targeted metabolomics study. PLoS Med 15: , e1002482. |
[27] | Depp C , Sun T , Sasmita AO , Spieth L , Berghoff SA , Nazarenko T , Overhoff K , Steixner-Kumar AA , Subramanian S , Arinrad S , Ruhwedel T , Möbius W , Göbbels S , Saher G , Werner HB , Damkou A , Zampar S , Wirths O , Thalmann M , Simons M , Saito T , Saido T , Krueger-Burg D , Kawaguchi R , Willem M , Haass C , Geschwind D , Ehrenreich H , Stassart R , Nave KA ((2023) ) Myelin dysfunction drives amyloid-β deposition in models of Alzheimer’s disease. Nature 618: , 349–357. |
[28] | Zhu TB , Zhang Z , Luo P ((2019) ) Lipid metabolism in Alzheimer’s disease. Brain Res Bull 144: , 68–74. |
[29] | Kosicek M , Zetterberg H , Andreasen N , Peter-Katalinic J , Hecimovic S ((2012) ) Elevated cerebrospinal fluid sphingomyelin levels in prodromal Alzheimer’s disease. Neurosci Lett 516: , 302–305. |
[30] | Agarwal M , Khan S ((2020) ) Plasma lipids as biomarkers for Alzheimer’s disease: A systematic review. Cureus 12: , e12030. |
[31] | Cuyvers E , De Roeck A , Van den Bossche T , Van Cauwenberghe C , Bettens K , Vermeulen S , Mattheijssens M , Peeters K , Engelborghs S , Vandenbulcke M , Vandenberghe R , De Deyn PP , Van Broeckhoven C , Sleegers K ((2015) ) Mutations in ABCA7 in a Belgian cohort of Alzheimer’s disease patients: A targeted resequencing study. Lancet Neurol 14: , 814–822. |
[32] | Dehghan A , Pinto RC , Karaman I , Huang J , Durainayagam BR , Ghanbari M , Nazeer A , Zhong Q , Liggi S , Whiley L , Mustafa R , Kivipelto M , Solomon A , Ngandu T , Kanekiyo T , Aikawa T , Radulescu CI , Barnes SJ , Graça G , Chekmeneva E , Camuzeaux S , Lewis MR , Kaluarachchi MR , Ikram MA , Holmes E , Tzoulaki I , Matthews PM , Griffin JL , Elliott P ((2022) ) Metabolome-wide association study on ABCA7 indicates a role of ceramide metabolism in Alzheimer’s disease. Proc Natl Acad Sci U S A 119: , e2206083119. |


