
A Comparative Evaluation of Error Processing Performance and its Relationship with Cognitive Function in Patients with Alzheimer’s Disease, Individuals with Mild Cognitive Impairment, and Normal Controls Using the Event-Related Potentials
Abstract
Background:
Some pathological changes occur in patients with Alzheimer’s disease (AD) prior to the onset of clinical symptoms.
Objective:
In the present study, we aimed to investigate the potential of event-related potential (ERP) components in error processing performance as a neuromarker of mild cognitive impairment (MCI) and transition to AD and their relation with cognitive functions.
Methods:
We conducted an evaluation of 16 patients diagnosed with AD, 16 patients with MCI, and 15 normal controls using three subtests from the Cambridge Neuropsychological Testing Automated Battery (CANTAB). The ERP components of error processing were extracted and compared among the three groups using a modified version of the Eriksen flanker task. Additionally, we assessed the correlation between the cognitive results and the ERP components.
Results:
Significant differences were observed among the three groups in terms of providing correct responses following errors and the amplitude of error-related negativity (ERN). These differences were also significant between all paired groups. Regarding other ERP components of error processing and the peak latency of ERN, no significant differences were observed among the three groups. The findings revealed that the spatial working memory and new learning were correlated with the amplitude of ERN.
Conclusions:
In the context of error processing performance, both the accuracy of responses following an error and the amplitude of ERN can be considered as indicators of MCI and its progression to AD. The present findings do not support the use of other error processing components as differential markers in the three groups.
INTRODUCTION
Alzheimer’s disease (AD), as the most prevalent cause of dementia, accounts for approximately 60% to 70% of all dementia cases [1]. Currently, over 25 million people worldwide are afflicted with AD, and this number is projected to rise to 80 million by 2040 [2]. Deteriorations in attention, short-term memory processing, and stimulus evaluation and discrimination are associated with impairments in AD. Meanwhile, mild cognitive impairment (MCI) is viewed as a transitional stage between normal aging and dementia [3]. Generally, MCI is diagnosed based on the presence of cognitive changes, specifically a deficiency in at least one cognitive domain. Despite these cognitive changes, individuals with MCI maintain their independence in functional abilities and do not exhibit the clinical manifestations of dementia. This disorder can manifest in both amnestic and non-amnestic forms. All patients diagnosed with MCI are considered to be at risk of developing AD [1].
Despite considerable efforts to find an effective treatment for AD, we have yet to significantly halt its progression. One contributing factor to this challenge is that pathological changes emerge years prior to the manifestation of clinical symptoms [3]. Consequently, a significant amount of research has been directed towards the early stages of AD prior to the onset of dementia [4]. In the early stages of AD, deficits in executive function become noticeable, particularly in tasks that require cognitive flexibility, inhibition, and self-monitoring [1].
The ability to perform error monitoring is one of the components of human executive function [5]. In both human and animal studies, it has been observed that the trial immediately following an error tends to be slower yet more accurate. One of the roles of the anterior cingulate cortex (ACC) in executive function is error monitoring. Event-related functional MRI studies have shown an increase in activity within the ACC during error trials, which is associated with error detection. Furthermore, there is increased activity in the lateral prefrontal cortex following error trials, which is related to behavioral adjustments [6]. On the other hand, functional imaging studies have indicated that during the early stages of AD, the network involving the dorsolateral prefrontal cortex (DLPFC) and anterior cingulate is affected. This could potentially serve as a predictive marker for the transition from MCI to AD [1].
The error-related negativity (ERN) component of event-related potentials (ERPs) is believed to be associated with error monitoring [7]. This component is initiated with an error response and reaches its peak approximately 100 milliseconds after the error response [6]. The topography of this component is primarily located in the central and frontal areas of the cortex [8]. Additionally, a positive component of ERP, which is associated with error awareness, is observed to occur approximately 300 milliseconds after an error response [5, 8]. This component is referred to as the positivity associated with errors, or Pe. Its topography is primarily located in the midline parietal-central areas of the scalp [5].
A small component, similar to ERN, has been observed following correct responses. This component may reflect a variety of factors, including response comparison, emotional reaction, uncertainty of correctness, or the co-activation of correct and error responses. This component is referred to as correct response negativity (CRN), and it shares a similar topography with ERN [5, 8, 9]. In patients diagnosed with schizophrenia, pathological alterations have been observed in the ACC and DLPFC, similar to those seen in AD. These changes are associated with a smaller ERN compared to healthy individuals. Conversely, the CRN in these patients is larger than that in healthy individuals [10]. Also, there is another ERP component, called P300, which is related to attention and working memory. It has been stated that the amplitude of P300 is smaller in patients with AD compared to healthy individuals. Furthermore, the latency of this component in patients with MCI is longer compared to healthy individuals, yet it is shorter than that observed in patients with AD [3].
From a cognitive perspective, it is suggested that ERN is influenced by errors made despite the individual knowing the correct response. This is in contrast to mistakes, where the individual does not know the correct response [5]. In this regard, Horowits-Krause et al. (2009) proposed that the error detection mechanism is influenced by the characteristics of the working memory system. Specifically, a larger working memory capacity is associated with a greater amplitude of ERN [11]. A study conducted by Mathalon et al. revealed a reduction in the magnitude of ERN in AD patients. This decrease was attributed to the high likelihood of mistakes occurring due to a lack of awareness in these patients [5].
Working memory, which is a key stage in all cognitive processes [12], is impaired in MCI patients [13]. Also, patients with AD show deficits in a wide range of cognitive tasks [14], even in early stages, including visual spatial impairment, which is attributed to hippocampal defects [4]. Additionally, substantial evidence suggests that the recognition memory in AD patients is influenced by the neurodegenerative process [14]. The visual paired associate learning (PAL) is highly sensitive and effective in detecting memory deficits in individuals with amnestic MCI and those in the early stages of AD. The visual PAL is a form of episodic memory. In this process, pairs of visual stimuli, such as the shape and location of an object, are encoded into memory. Consequently, when one stimulus is presented, the corresponding paired stimulus is retrieved from memory [15].
Research has indicated that both MCI and AD present with clinical and pathological heterogeneity. This diversity complicates the reliable prediction of transition from MCI to AD. However, individuals with MCI may exhibit certain diagnostic biomarkers during this stage, which can offer valuable insights before irreversible deterioration occurs [3]. The ERP is a safe, noninvasive, accessible, cost-effective, and ideal tool for assessing the neural correlations of cognitive processes in AD. It is posited that AD is primarily a disorder of synaptic plasticity. The ERP components are predominantly generated by the summation of excitatory postsynaptic potentials and inhibitory postsynaptic potentials. These potentials are produced by the simultaneous firing of a large number of cortical pyramidal neurons. Therefore, ERPs can be utilized to assess synaptic dysfunction in AD [3].
Based on imaging findings that reveal abnormalities in areas associated with error processing in AD and MCI, it can be hypothesized that changes may occur in the ERP components related to error monitoring. The authors of the previous studies reviewed did not simultaneously assess error processing performance in AD, MCI, and normal controls under similar conditions, nor did they assess the association between cognitive functions and ERP components related to error processing in their studies. Therefore, we aimed to compare these components among three groups of AD patients, MCI patients, and normal control individuals. We also aimed to assess the relationship between these components and cognitive functions, including spatial working memory, pattern recognition memory, and PAL to determine if there are any neuromarkers that can detect MCI and predict its progression to AD.
MATERIALS AND METHODS
Participants
This study was performed on a total of 16 patients diagnosed with AD in the mild stage, as per the National Institute on Aging and Alzheimer’s Association (NIA-AA) 2011 criteria, with a Clinical Dementia Rating (CDR) score of one. Additionally, 16 patients diagnosed with MCI according to the NIA-AA 2011 criteria, with a CDR score of 0.5, were included. These groups were compared with a control group of 15 normal individuals who had a CDR score of zero. The patients were recruited from the Memory Clinic of Tehran University of Medical Sciences (Tehran, Iran).
The participants were in the age range of 50 to 90 years. They had no history of traumatic brain injury, major psychiatric disorders, vascular dementia, brain mass, or other neurodegenerative disorders, such as frontotemporal dementia, Parkinson’s disease dementia, Parkinson’s disease, or Lewy body dementia. Additionally, they did not have any orthopedic disorders that could prevent testing. This information was confirmed based on the participants’ medical records. The three groups were matched in terms of the mean age, years of education, and gender distribution. The diagnoses were established based on clinical interviews and neuropsychiatric examinations conducted by an experienced neurologist [16]. None of the participants smoked or used alcohol. Individuals who were on medication that could affect their memory were required to discontinue their use 48 hours prior to the tests with the permission of their neurologist.
Data collection measures
Hamilton Depression Inventory (HAM-D): The HAM-D is a 17-item scale used in a semi-structured interview format to assess the type and severity of depressive symptoms. The scores on this scale range from 0 to 52, with higher scores indicating more severe depressive symptoms [17]. The validity of the Farsi translation of this tool has been reported to be 0.55 and 0.39, respectively, when correlated with the Beck Depression Scale and the Dysfunctional Attitude Scale [18]. In previous studies conducted by Hamilton, the interrater reliability of the questionnaire was reported to be between 0.90 and 0.94, as determined by the correlation coefficient [19].
Mini-Mental State Examination (MMSE): This test was developed by Folstein et al. in 1975 [20]. The reliability of this scale was estimated to be 0.78, according to Cronbach’s alpha. The scale demonstrated a specificity of 80% and a sensitivity of 90% at a cutoff point of 23 [21]. It consists of 30 questions that assess various cognitive abilities, including attention, orientation, memory, encoding, recall, calculation, language skills, and the ability to draw a complex polygon. The total score represents the level of cognitive impairment. A score of 23/24 is considered as a criterion to identify patients with suspected cognitive impairment or dementia [22].
Cambridge Neuropsychological Test Automated Battery (CANTAB): The CANTAB was first developed in 1980 to measure cognitive function in patients with dementia. It contains 25 tests which assess different cognitive functions [23]. The following subtests of CANTAB were used in this study: 1) Spatial working memory (SWM) which evaluates the subject’s ability to retrieve spatial information and manipulate them [24]; 2) PAL which assesses visual memory and learning new things [25]; and 3) pattern recognition memory (PRM) which measures visual recognition memory [26].
Error monitoring paradigm
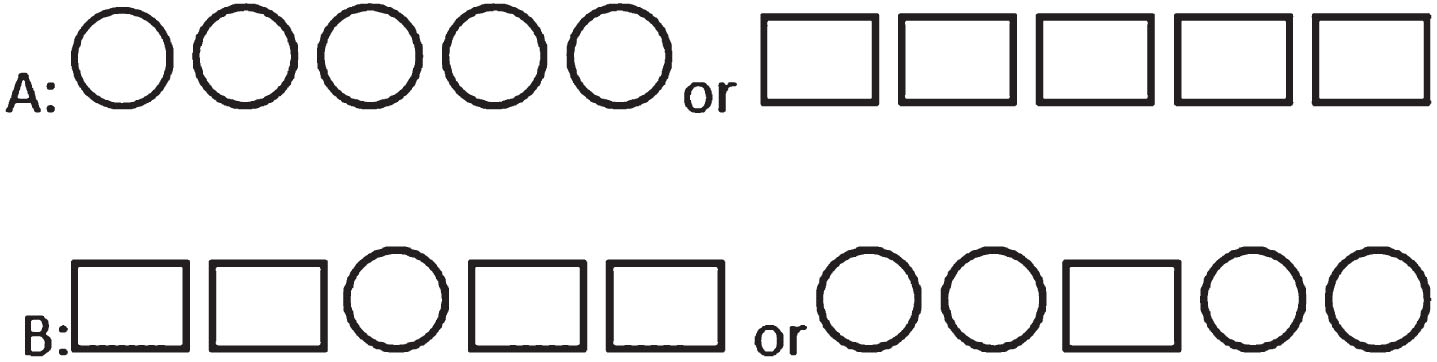
Based on numerous studies focusing on error monitoring, the Eriksen flanker task was chosen and adapted to suit the specific requirements of the current study [8, 27–32]. Regarding the Eriksen Flanker task, a simple adapted version could be designed that patients with AD could learn, and in this task, errors could be made on all trials, so more errors could be recorded for ERP assessment (in contrast to the Go no Go task, which errors could only be recorded on No Go trials). During the task, the participants responded to stimuli based on the central figure located in a chain of five figures in each trial. Two types of stimuli were presented during the task: congruent and incongruent. In the congruent type, all figures were identical, while in the incongruent type, the central figure differed from the others (Fig. 1).
Fig. 1
Congruent (A) and incongruent (B) stimuli.
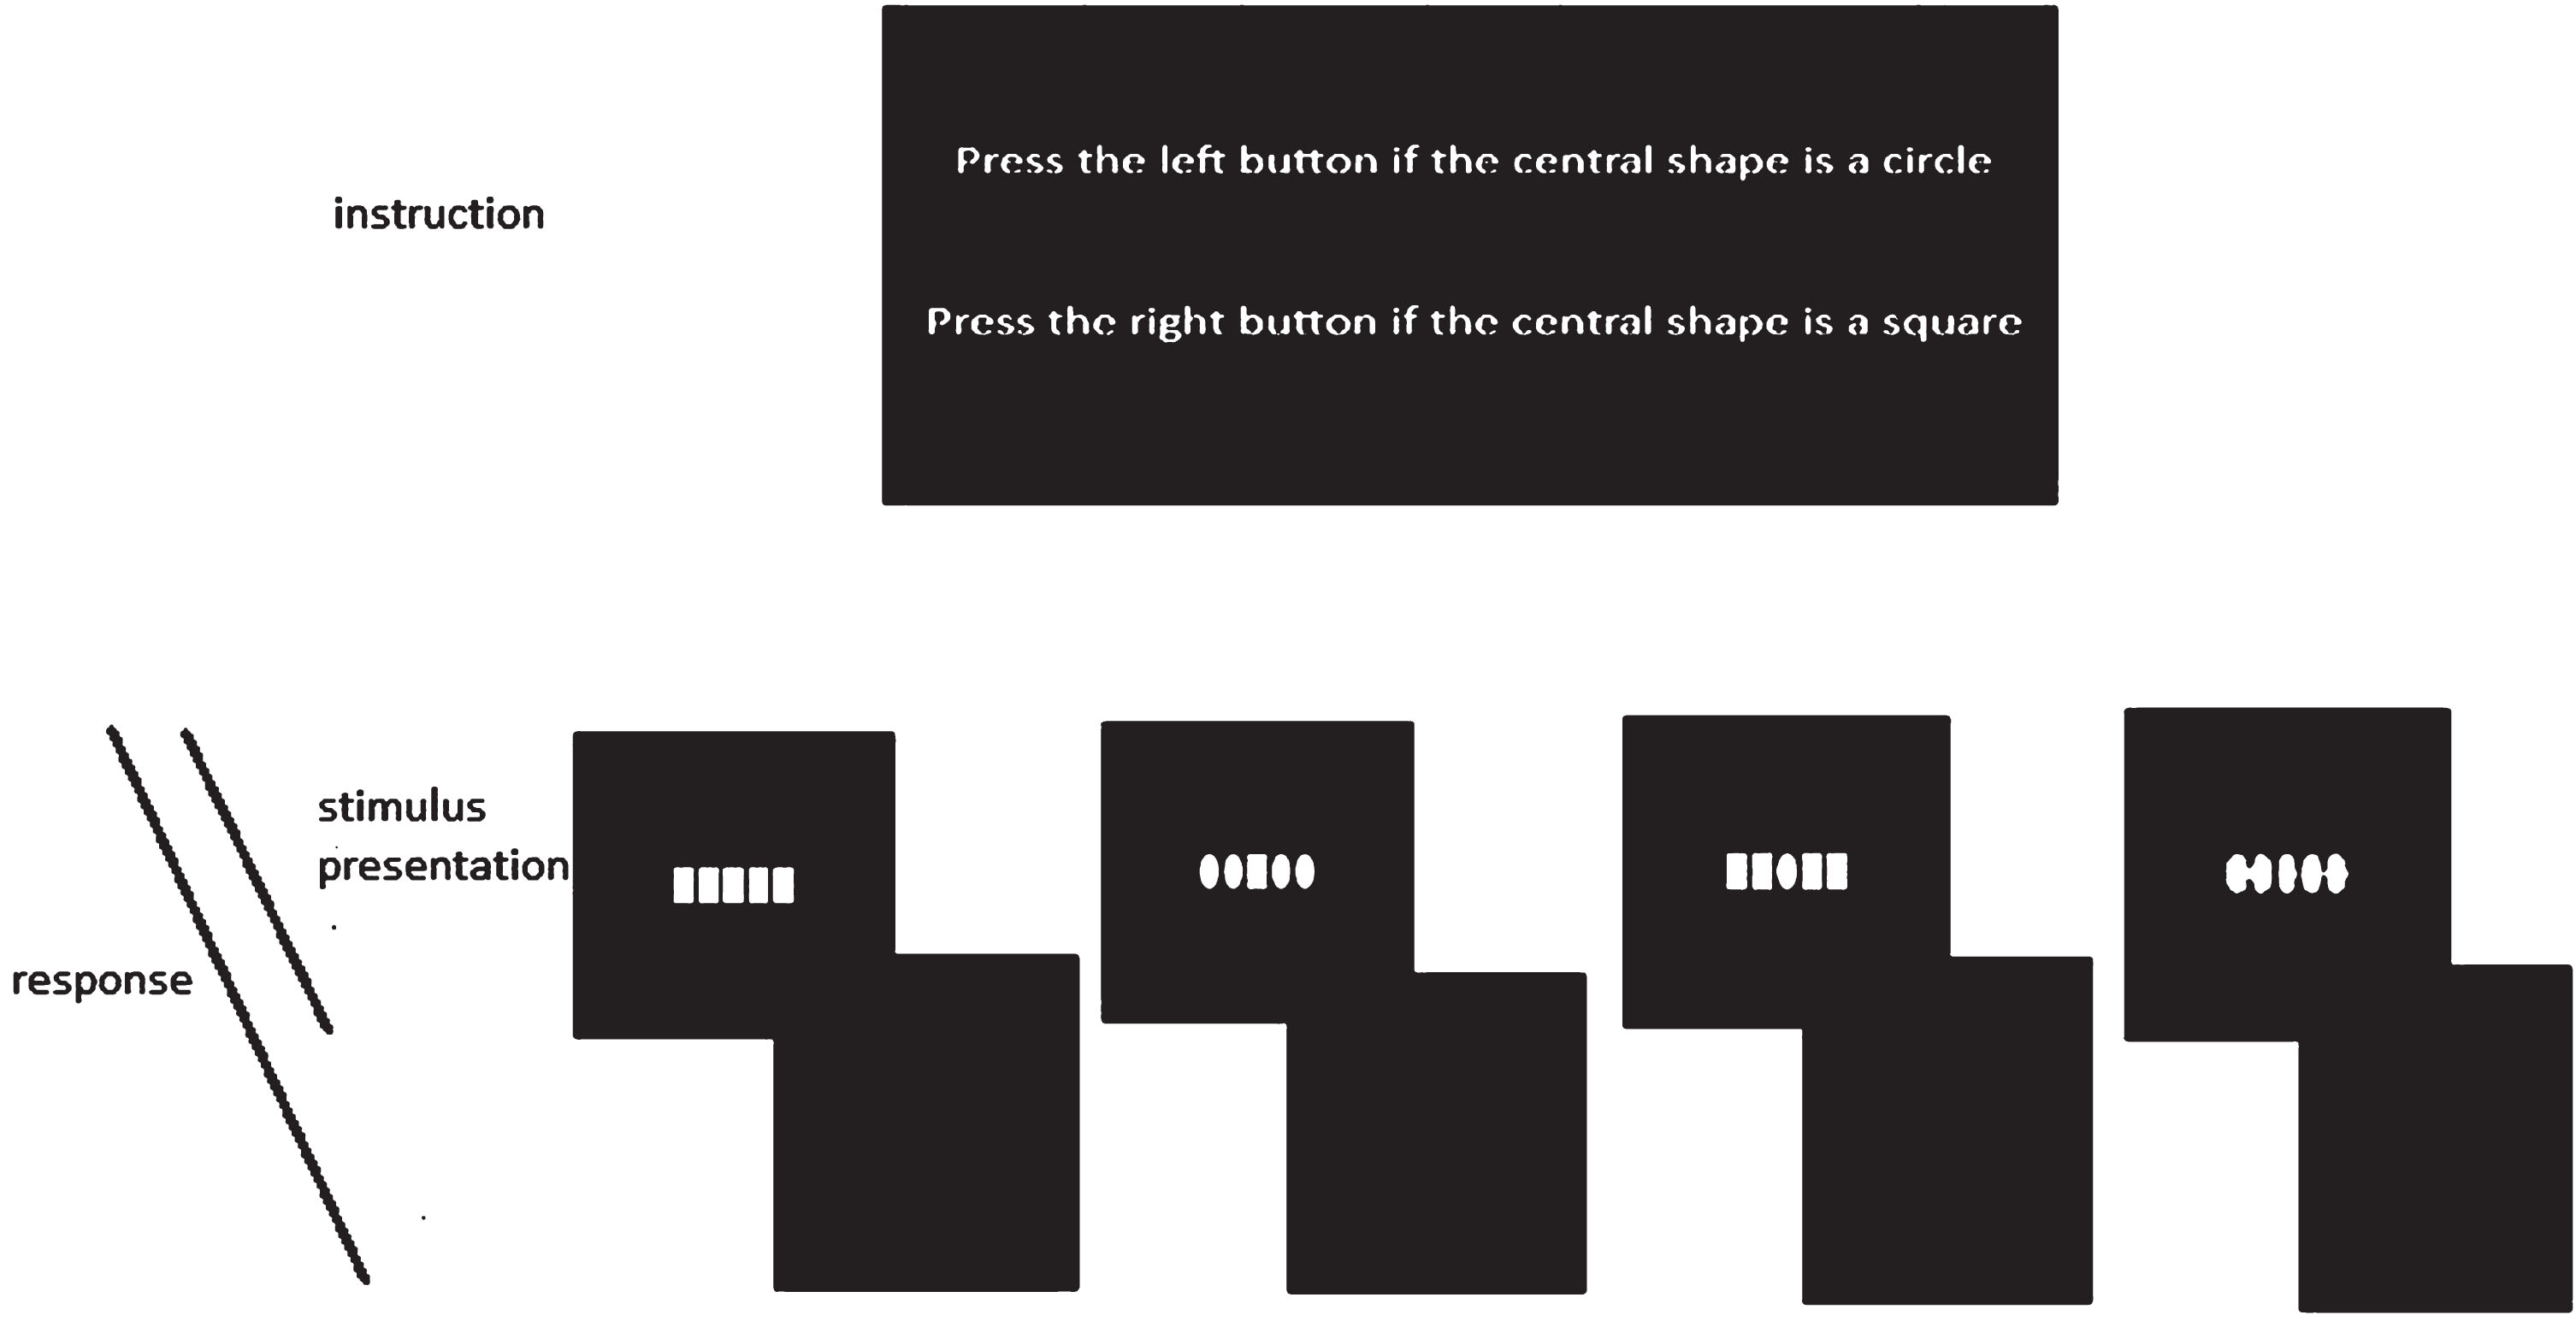
Each stimulus was displayed for a duration of 500 ms, followed by a blank period of 1500 ms. The participants were instructed to press the up-arrow key with their right index finger if the central figure was a square. Conversely, if the central figure was a circle, they were asked to press the Z-key with their left index finger. The participants initially practiced with 20 trials before proceeding to the main blocks of the task. The task consisted of a total of 400 trials, which were conducted in four blocks, each containing 100 trials. The flowchart of the task is presented in Fig. 2.
Fig. 2
Flowchart of the Eriksen Flanker task used in present study. In each trial one of the above stimuli appeared for 500 ms followed by 1500 ms blank. Participants were able to respond to stimulus from the onset of stimulus presentation until the next trial.
Signal recording
To record the EEG signals, we utilized a g.USBamp EEG device (g.tec Medical Engineering GmbH, Austria), along with a 32-channel cap. The cap was positioned in accordance with the international 10–20 system and was referenced to the right earlobe. The recording was conducted at a sampling rate of 512 Hz. Active electrodes were utilized, and the impedance was maintained at optimal levels, as indicated by the green color on the software’s indicator.
Signal processing
We processed the ERP components including the P300, ERN, CRN, and Pe in signal processing. Figures 3 and 4 show examples of the P300 component and the ERP signals following correct and incorrect responses in previous studies [33, 34].
Fig. 3
An example of error-related negativity following the production of an incorrect response. (Reprinted with permission from the study by Herrmann et al., 2010 [33]).
![An example of error-related negativity following the production of an incorrect response. (Reprinted with permission from the study by Herrmann et al., 2010 [33]).](https://content.iospress.com:443/media/adr/2024/8-1/adr-8-1-adr230104/adr-8-adr230104-g003.jpg)
Fig. 4
An example of the P300 (or P3) component of the event related potential in Pz. (Reprinted with permission from the book An Introduction to the Event-Related Potential Technique, written by Steven J. Luck, 2014 [34]).
![An example of the P300 (or P3) component of the event related potential in Pz. (Reprinted with permission from the book An Introduction to the Event-Related Potential Technique, written by Steven J. Luck, 2014 [34]).](https://content.iospress.com:443/media/adr/2024/8-1/adr-8-1-adr230104/adr-8-adr230104-g004.jpg)
For artifact rejection, we employed an offline filter with a band pass of 1–30 Hz. Additionally, we used the independent component analysis (ICA) method available in the EEGLAB toolbox within the MATLAB software. Time epochs were derived from the continuous EEG, with the extraction process based on both the presentation of the stimulus and the timing of the response. The average values were calculated for each participant, with the measurements based on the start time of the stimulus presentation and the response. These calculations were performed separately for both correct and erroneous responses.
The amplitude and latency of ERP components, including ERN, CRN, and Pe, were analyzed on the Fz, Cz, and Pz electrodes. Mathalon et al also reported response-synchronized data from Fz and Cz, (noting that ERNs are typically the largest in these electrodes), as well as from Pz for the Pe [5]. The P300 component was assessed in the P7, Pz, and P8 channels. The P300 wave is a parieto-central positive wave [35]. The analysis of events was conducted within a window of 200 ms before the stimulus and 800 ms following the stimulus, as well as 200 ms before and 800 ms after the response. To extract the CRN and ERN components, we considered a time window of 10–150 ms following both correct and error responses. For the Pe component, a time window of 150–450 ms was used following error responses. Junko Ito et al. also designated the negative component for error trials in the10–150 ms time window as Ne, that for correct trials as Nc, and the positive components following the Ne as Pe [7]. Finally, for the P300 component, we considered a time window of 350–650 ms after the stimulus presentation. All the ERP components were extracted using the ERPLAB toolbox.
Behavioral analysis
Behavioral variables were defined as reaction time and the number of correct responses. For each individual, the average reaction time was calculated for both error responses and responses following an error. The average values were then compared within each group and across different groups. In terms of response accuracy, we calculated two specific ratios for each individual. The first ratio was the number of correct responses following an error divided by the total number of error responses. The second ratio was the number of error responses that occurred after an initial error, divided by the total number of error responses.
Procedure
During the first session, the participants and their companions were given a detailed explanation of the study process. Subsequently, they were presented with an informed consent form to sign. The participants were then evaluated using the MMSE and the HAM-D. Next, they were requested to complete three subtests of the CANTAB, including SWM, PRM, and PAL. All participants were instructed to perform the tasks by touching the screen while sitting in a comfortable chair at a distance of 0.5 meters from the computer. These tests were performed at the Neurocognitive Laboratory of the Research Center for Cognitive and Behavioral Sciences, affiliated to Tehran University of Medical Sciences. In the second session, the participants were asked to perform the Eriksen flanker task while the brain signals were recording. The signal recordings were performed at the National Brain Mapping Laboratory (NBML). The Ethics Committee of the Institute for Cognitive Science Studies approved this study (ethical code: IR.UT.IRICSS.REC.1400.003).
Statistical analysis
The differences among the three groups were evaluated based on several factors. Gender differences were assessed using the Chi-square and Fisher’s exact tests, while age and years of education were analyzed using one-way ANOVA. Behavioral findings were analyzed using the one-way ANOVA test to evaluate differences among the three groups. Moreover, a post-hoc analysis was conducted to evaluate differences between each pair of groups. Additionally, a paired sample t-test was utilized to examine the differences within each group between the reaction times of error responses and the reaction times of responses following errors. One-way ANOVA was also utilized to analyze the differences in ERP data across the three groups. Finally, to identify associations between cognitive and ERP variables, the Pearson’s correlation coefficient was employed. Statistical analyses were performed in SPSS Version 24.
RESULTS
A total of 47 participants, including 30 women and 17 men, were recruited in three groups of AD, MCI, and normal controls. The differences between the groups in terms of gender distribution were not significant (p = 0.80). Also, there were no significant differences between the three groups regarding the years of education, depression score, and age (p = 0.47, p = 0.08, and p = 0.052, respectively). The participants differed significantly based on the MMSE score (p = 0.000). The comparison of the three groups in terms of the mentioned variables is presented in Table 1.
Table 1
Demographic characteristics of AD, MCI, and control groups
| Groups | AD | MCI | Control | p |
| N | 16 | 16 | 15 | |
| Mean age±SD | 68.87±6.04 | 68.81±5.83 | 64.26±5.50 | 0.052 |
| Mean of MMSE±SD | 19.56±3.68 | 25.06±3.15 | 28.80±1.47 | 0.000 |
| Mean of education y±SD | 9.12±3.98 | 9.87±5.38 | 11.20±4.79 | 0.470 |
| Mean of Hamilton±SD | 8.93±3.78 | 12±5.36 | 8.26±4.72 | 0.080 |
| Gender | ||||
| Female | 11 | 9 | 10 | 0.80 |
| Male | 5 | 7 | 5 |
Behavioral results
As indicated in Table 2, there were significant differences among the three groups in terms of correct performance, defined as the ratio of the number of correct responses following an error to the number of error responses (p = 0.000). The post-hoc analysis indicated significant differences in scores between the groups. The control group scored higher than both the AD group (p = 0.000) and the MCI group (p = 0.008). Similarly, the MCI group scored higher than the AD group (p = 0.000). Moreover, there were significant differences between the three groups with regard to error performance (the ratio of the number of error responses after the error to the number of error responses) (p = 0.002). The post-hoc analysis revealed significant differences between the control and AD groups (p = 0.001) and between the MCI and AD groups (p = 0.026). Specifically, the AD group had a higher ratio than both the control group (p = 0.001) and the MCI group (p = 0.026). However, the difference between the control and MCI groups was not significant (p = 0.143). On the other hand, significant differences were observed within each of the control, MCI, and AD groups when comparing the reaction time of error responses with that of responses following errors (p = 0.001, p = 0.005, and p = 0.014, respectively).
Table 2
Characteristics of participant’s performance after error responses and their reaction times
| AD | MCI | Control | p | ||||
| Correct performance | 0.4±0.24 | 0.74±0.20 | 0.93±0.07 | 0.000 | control-MCI | control-AD | MCI-AD |
| 0.008 | 0.000 | 0.000 | |||||
| Error performance | 0.19±0.14 | 0.09±0.1 | 0.04±0.05 | 0.002 | control-MCI | control-AD | MCI-AD |
| 0.143 | 0.001 | 0.026 | |||||
| Rt.error trials | 0.882±0.160 | 0.551±0.154 | 0.521±0.155 | 0.000 | control-MCI | control-AD | MCI-AD |
| 0.603 | 0.000 | 0.000 | |||||
| Rt.trial after error | 0.981±0.188 | 0.674±0.152 | 0.636±0.119 | 0.000 | control-MCI | control-AD | MCI-AD |
| 0.494 | 0.000 | 0.000 | |||||
| p* | 0.014 | 0.005 | 0.001 |
*Within group comparison between Rt.error trial and Rt.trial after error.
There were significant differences among the three groups in terms of the reaction time of error responses (p = 0.000). Specifically, the AD group had a longer reaction time than both the control group (p = 0.000) and the MCI group (p = 0.000). Moreover, significant differences were observed among the three groups in terms of the reaction time of responses following errors (p = 0.000). The post-hoc analysis showed that the AD group had a longer reaction time than both the control group (p = 0.000) and the MCI group (p = 0.000). However, the difference between the control and MCI groups was not significant (p = 0.494).
ERP component results
Significant differences were observed among the three groups in terms of the peak amplitude of the P300 component, as determined by one-way ANOVA. This was particularly evident in channels P7, Pz, and P8 (p = 0.045, 0.003, and 0.014, respectively). The post-hoc analysis revealed significant differences in the peak amplitude of the P300 component between the control and AD groups across all channels (p = 0.022, p = 0.001, and p = 0.007, respectively), with the control group showing a greater peak amplitude than the AD group. Similarly, significant differences were observed between the MCI and control groups (p = 0.042, p = 0.017, and p = 0.015, respectively), with the control group again showing a greater peak amplitude than the MCI group. However, the difference between the AD and MCI groups was not significant in any of these channels (p = 0.77, p = 0.26, and p = 0.77, respectively).
According to Table 3, significant differences were observed among the three groups in terms of the peak amplitude of the ERN component in channels Fz, Cz, and Pz (p = 0.001, 0.000, and 0.001, respectively). The post-hoc analysis revealed significant differences in the peak amplitude of the ERN component between the groups across all channels. Specifically, the control group had a greater peak amplitude than the AD group in all channels (p = 0.000, p = 0.000, and p = 0.000, respectively). When comparing the MCI and control groups, significant differences were observed in channels Fz and Cz, with the control group showing a greater peak amplitude (p = 0.015 and p = 0.014, respectively). However, no significant difference was found in the channel Pz (p = 0.277). Also, in the comparison between the AD and MCI groups, channels Cz and Pz showed significant differences, with the MCI group having a greater peak amplitude (p = 0.007 and p = 0.004, respectively). However, no significant difference was found in channel Fz (p = 0.118). Additionally, in terms of the peak amplitude of the CRN component, no significant differences were observed among the three groups in channels Fz, Cz, and Pz (p = 0.959, p = 0.249, and p = 0.976, respectively). Also, in terms of the peak amplitude of the Pe component, no significant differences were observed among the three groups in channels Fz, Cz, and Pz (p = 0.991, p = 0.727, and p = 0.836, respectively) (Table 3).
Table 3
Comparison of peak amplitude of P300, ERN, CRN, and Pe components in AD, MCI, and control groups
| AD | MCI | Control | p | |||||
| P300 | P7 | 1.91±1.47 | 2.09±1.27 | 3.46±2.50 | 0.045 | AD-MCI | AD-control | MCI-control |
| 0.77 | 0.022 | 0.042 | ||||||
| P8 | 1.87±1.16 | 2.08±1.52 | 4.02±3.22 | 0.014 | AD-MCI | AD-control | MCI-control | |
| 0.77 | 0.007 | 0.015 | ||||||
| Pz | 2.01±1.65 | 3±2.31 | 5.23±3.33 | 0.003 | AD-MCI | AD-control | MCI-control | |
| 0.268 | 0.001 | 0.017 | ||||||
| ERN | Fz | –2.92±1.99 | –4.75±3.86 | –7.70±3.55 | 0.001 | AD-MCI | AD-control | MCI-control |
| 0.118 | 0.000 | 0.015 | ||||||
| Cz | –1.61±1.84 | –5.10±3.86 | –8.27±4.25 | 0.000 | AD-MCI | AD-control | MCI-control | |
| 0.007 | 0.000 | 0.014 | ||||||
| Pz | –0.94±1.94 | –4.63±3.84 | –6.01±4.26 | 0.001 | AD-MCI | AD-control | MCI-control | |
| 0.004 | 0.000 | 0.277 | ||||||
| CRN | Fz | –1.22±2.75 | –1.33±2.24 | –1.07±2.48 | 0.959 | |||
| Cz | 0.28±2.67 | 0.81±2.91 | 2.09±3.52 | 0.249 | ||||
| Pz | 0.53±2.31 | 0.69±2.76 | 0.76±3.78 | 0.976 | ||||
| Pe | Fz | 4.91±6.77 | 4.68±4.38 | 4.87±3.03 | 0.991 | |||
| Cz | 4.63±4.69 | 4.38±4.05 | 5.61±4.7 | 0.727 | ||||
| Pz | 4.10±3.59 | 4.57±3.23 | 4.83±3.54 | 0.836 |
Significant differences were observed among the three groups in terms of the mean amplitude of the P300 component in channels P7, Pz, and P8 (p = 0.035, p = 0.005, and p = 0.023, respectively). The post-hoc analysis indicated significant differences in the mean amplitude of the P300 component between the control and AD groups across all channels (p = 0.020, p = 0.001, and p = 0.011, respectively). Similarly, significant differences were observed between the MCI and control groups (p = 0.028, p = 0.038, and p = 0.026, respectively). The difference between the AD and MCI groups was not significant in any of the mentioned channels (p = 0.87, p = 0.18, and p = 0.72, respectively).
Based on the results, significant differences were observed among the three groups in terms of the mean amplitude of the ERN component in channels Fz, Cz, and Pz (p = 0.022, p-0.001, and p = 0.001, respectively). The post-hoc analysis revealed significant differences in the mean amplitude of the ERN component between the groups across all channels. Specifically, the control group had a greater mean amplitude than the AD group in all channels (p = 0.007, p = 0.000, and p = 0.000, respectively). When comparing the MCI and control groups, significant differences were observed in channels Cz and Pz, but not in channel Fz (p = 0.035, p = 0.040, and p = 0.343, respectively). Also, the comparison of the AD and MCI groups showed a significant difference in channel Cz, but not in channels Fz and Pz (p = 0.044, p = 0.067, and p = 0.065, respectively). In terms of the mean amplitude of the CRN component, no significant differences were observed among the three groups in channels Fz, Cz, and Pz (p = 0.947, p = 0.354, and p = 0.287, respectively). Also, in terms of the mean amplitude of the Pe component, no significant differences were observed among the three groups in channels Fz, Cz, and Pz (p = 0.632, p = 0.526, and p = 0.752, respectively) (Table 4).
Table 4
Comparison of mean amplitude of P300, ERN, CRN, and Pe components in AD, MCI and control groups
| AD | MCI | Control | p | |||||
| P300 | P7 | 0.50±1.14 | 0.57±0.89 | 1.67±1.87 | 0.035 | AD-MCI | AD-control | MCI-control |
| 0.87 | 0.020 | 0.028 | ||||||
| P8 | 0.69±1.03 | 0.88±1.36 | 2.15±2.06 | 0.023 | AD-MCI | AD-control | MCI-control | |
| 0.72 | 0.011 | 0.026 | ||||||
| Pz | 0.40±1.44 | 1.31±2.03 | 2.79±2.21 | 0.005 | AD-MCI | AD-control | MCI-control | |
| 0.18 | 0.001 | 0.038 | ||||||
| ERN | Fz | 0.26±1.86 | –1.64±3.46 | –2.62±2.76 | 0.022 | AD-MCI | AD-control | MCI-control |
| 0.067 | 0.007 | 0.343 | ||||||
| Cz | 0.75±2.17 | –1.29±3.37 | –3.46±2.67 | 0.001 | AD-MCI | AD-control | MCI-control | |
| 0.044 | 0.000 | 0.035 | ||||||
| Pz | 1.11±1.94 | –0.54±2.93 | –2.41±2.42 | 0.001 | AD-MCI | AD-control | MCI-control | |
| 0.065 | 0.000 | 0.040 | ||||||
| CRN | Fz | 0.47±3.37 | 0.26±2.52 | 0.15±1.99 | 0.947 | |||
| Cz | 1.66±2.89 | 2.25±2.90 | 3.14±2.68 | 0.354 | ||||
| Pz | 1.42±2.27 | 2.67±2.67 | 2.53±2.23 | 0.287 | ||||
| Pe | Fz | 1.49±5.52 | 0.50±3.67 | –0.02±4.02 | 0.632 | |||
| Cz | 1.75±3.76 | 0.07±3.90 | 0.69±4.9 | 0.526 | ||||
| Pz | 1.36±2.86 | 0.56±3.15 | 0.72±3.38 | 0.752 |
Regarding the latency of the P300, ERN, Pe, and CRN components, there were no significant differences among the three groups in channels P7, Pz, and P8 (p = 0.909, p = 0.309, and p = 0.842 for P300; p = 0.381, p = 0.107, and p = 0.094 for ERN; p = 0.291, p = 0.336, and p = 0.137 for CRN; p = 0.648, p = 0.175, and p = 0.053 for Pe) (Table 5). The grand averaged ERP plots are presented in Figs. 5–7.
Fig. 5
Grand averaged plots of ERPs time-locked to stimulus obtained from 16 AD patients, 16 MCI patients, and 15 controls in P7, Pz, and P8 channels. The P300 components are pointed in figures. In the normal controls, the P300 component showed increased amplitude compared to the AD and MCI groups but no difference in latency.
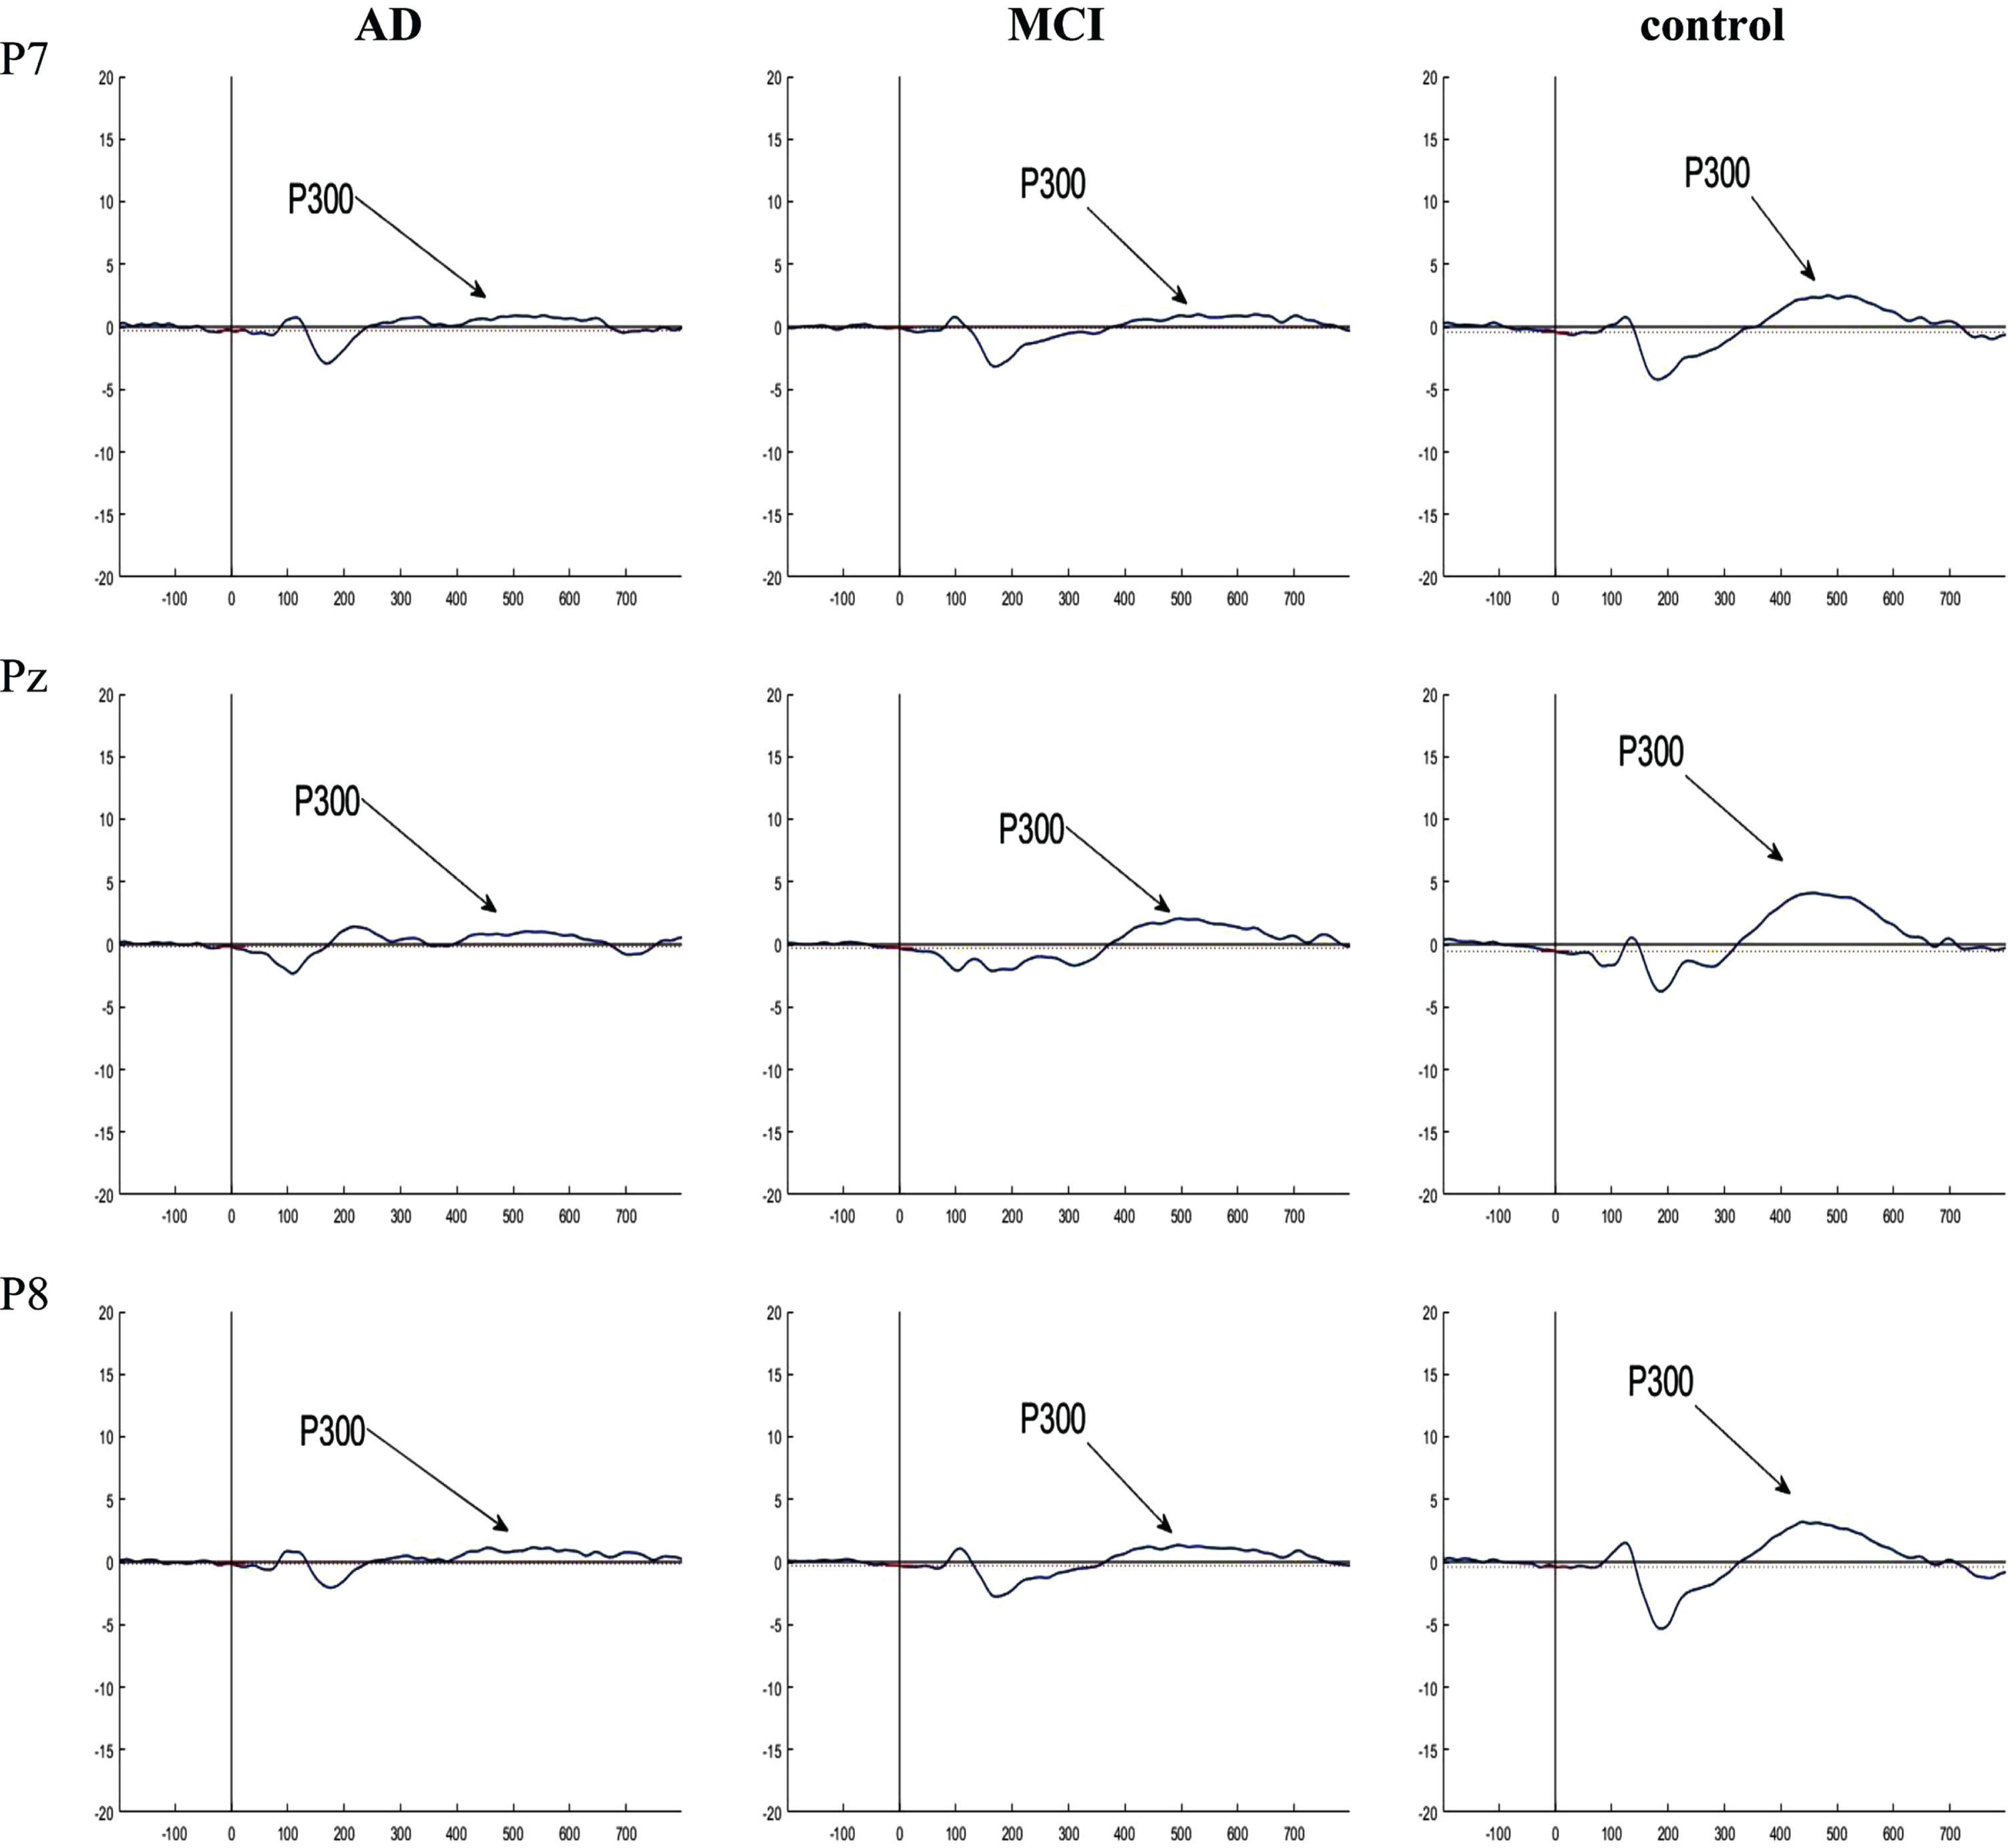
Fig. 6
Grand averaged plots of ERPs time-locked to error response obtained from 16 AD patients, 16 MCI patients, and 15 controls in Fz, Cz, and Pz channels. The peaks of ERN and Pe were visible in MCI and control groups but these components did not have obvious peak in AD group. In normal controls, the peak of the ERN showed increased amplitude in Fz and Cz compared to the MCI group, but no difference in latency. There is no difference in the Pe component between the groups.
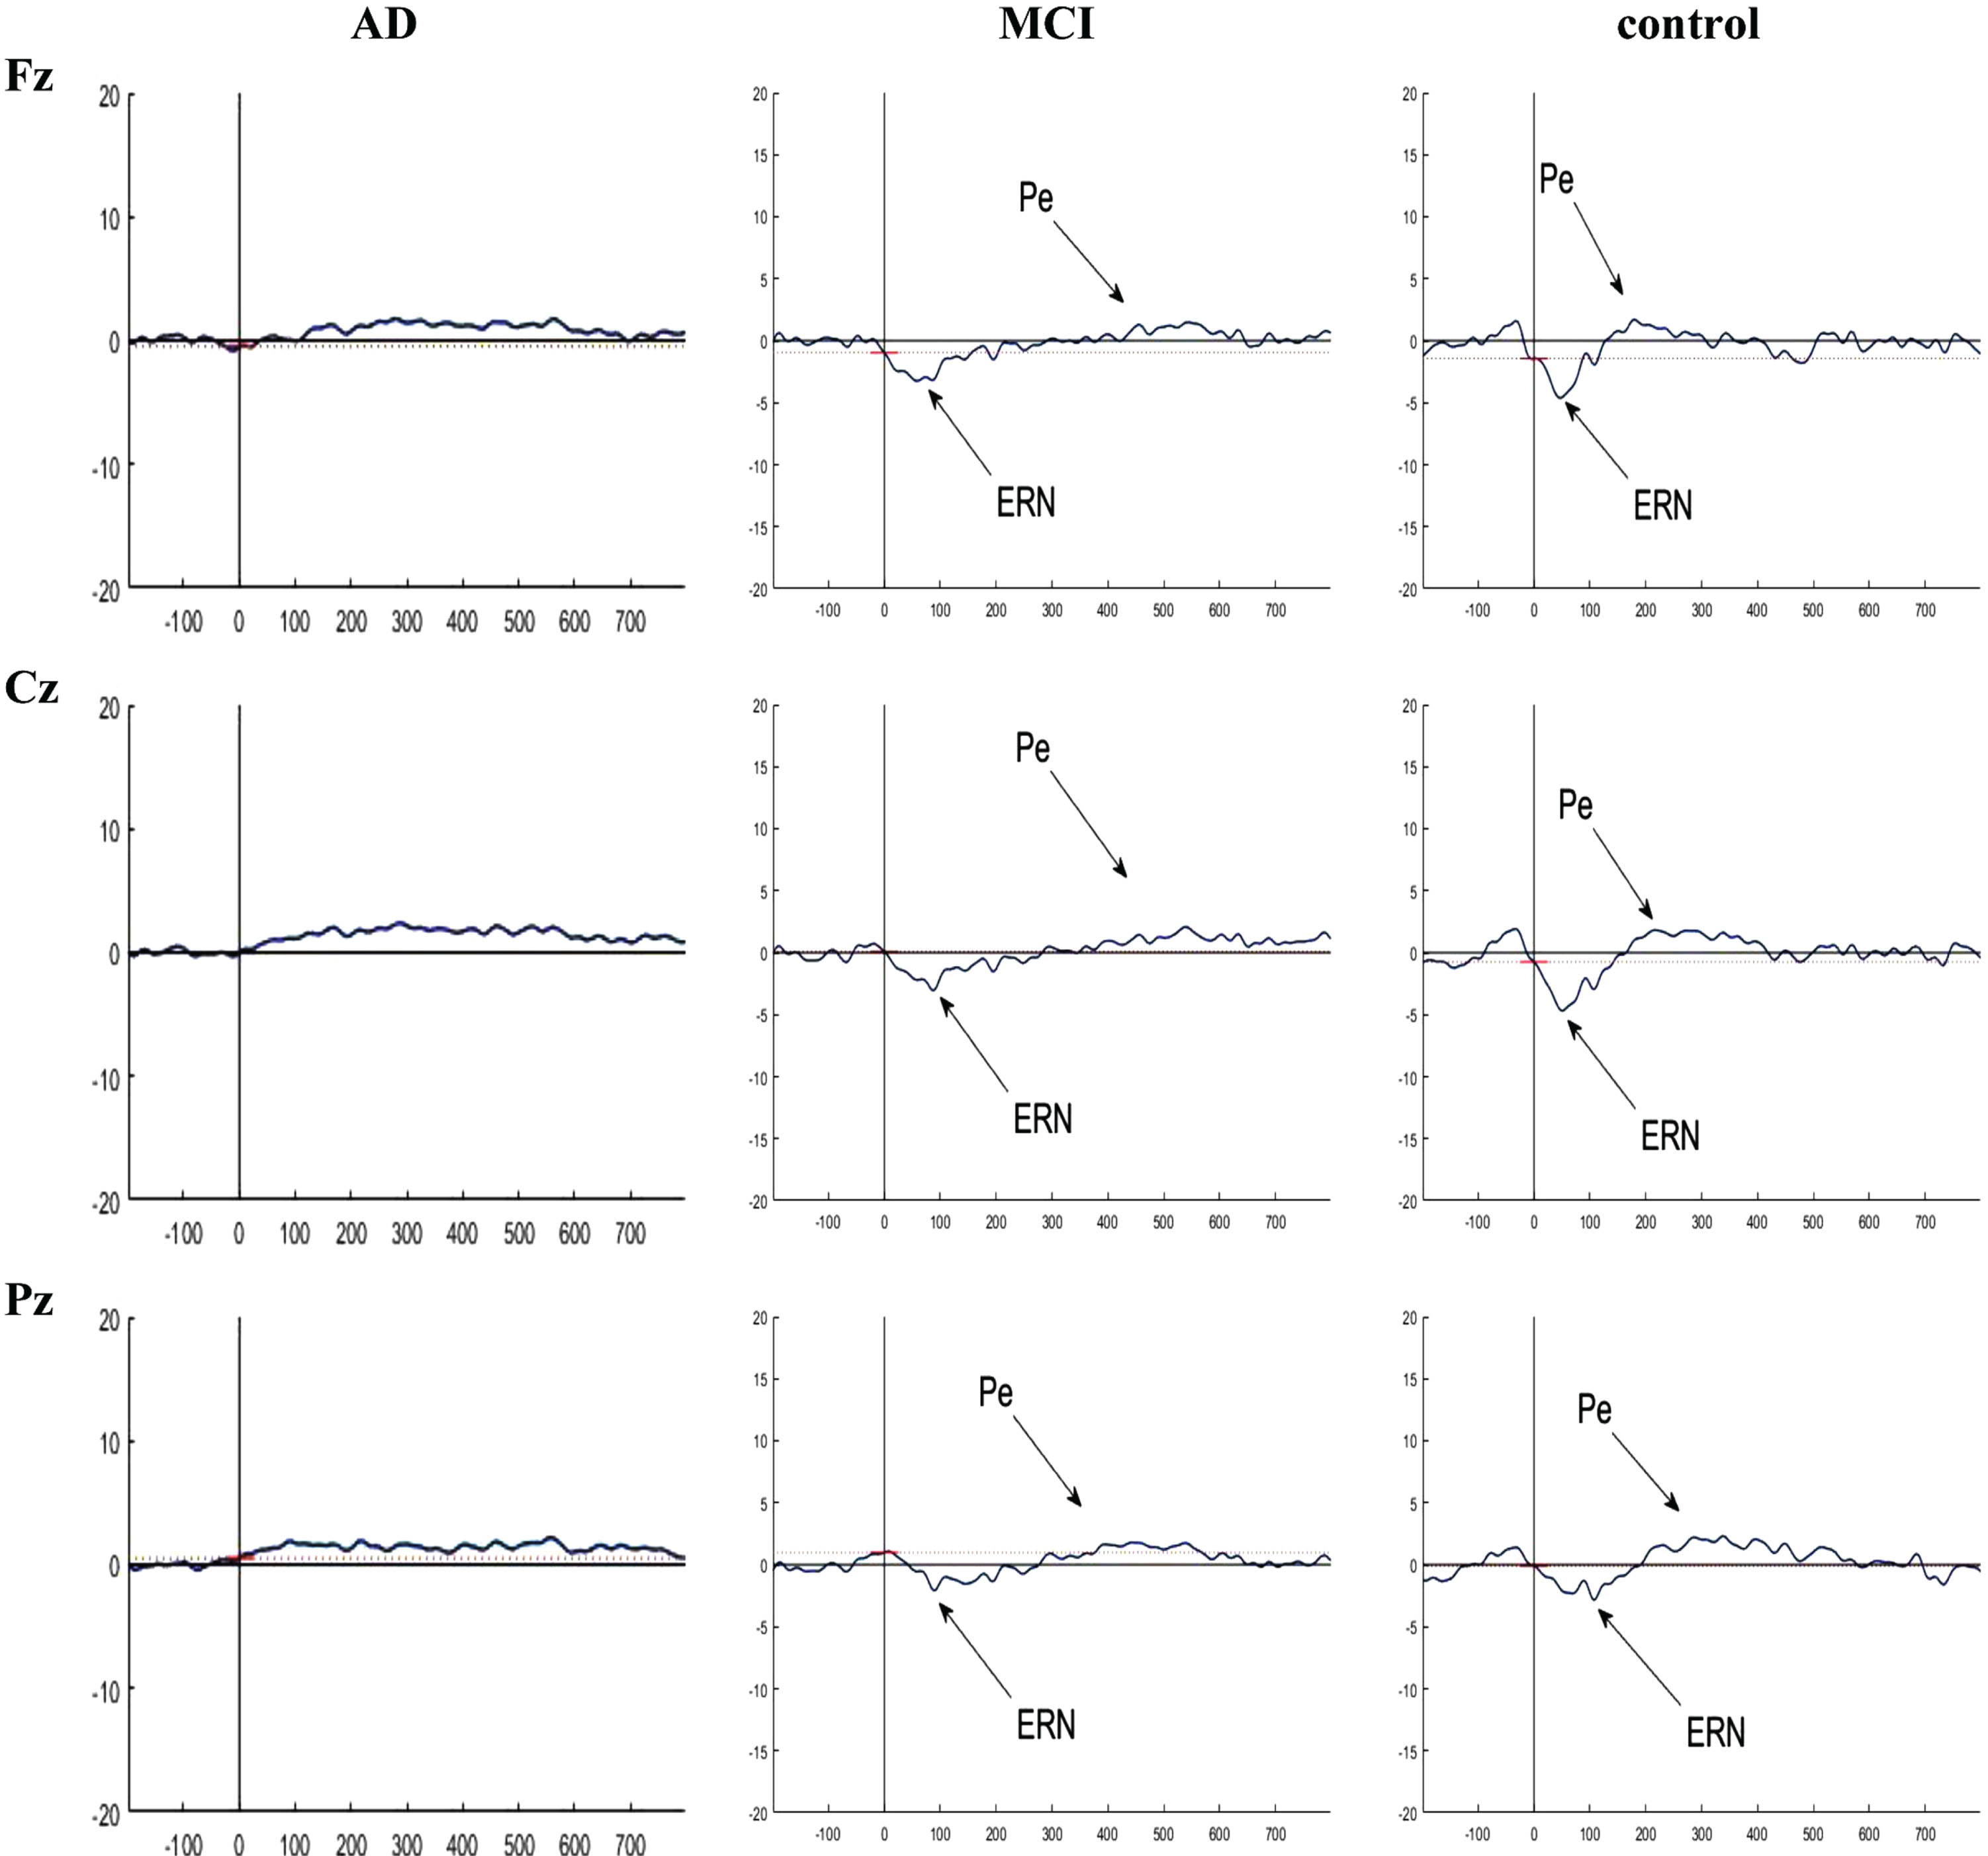
Fig. 7
Grand averaged plots of ERPs time-locked to correct response obtained from 16 AD patients, 16 MCI patients, and 15 controls in Fz, Cz, and Pz channels. The peaks of CRN were visible in MCI and control groups in Fz and Cz channels but there is no difference in the CRN component between the groups in these channels.
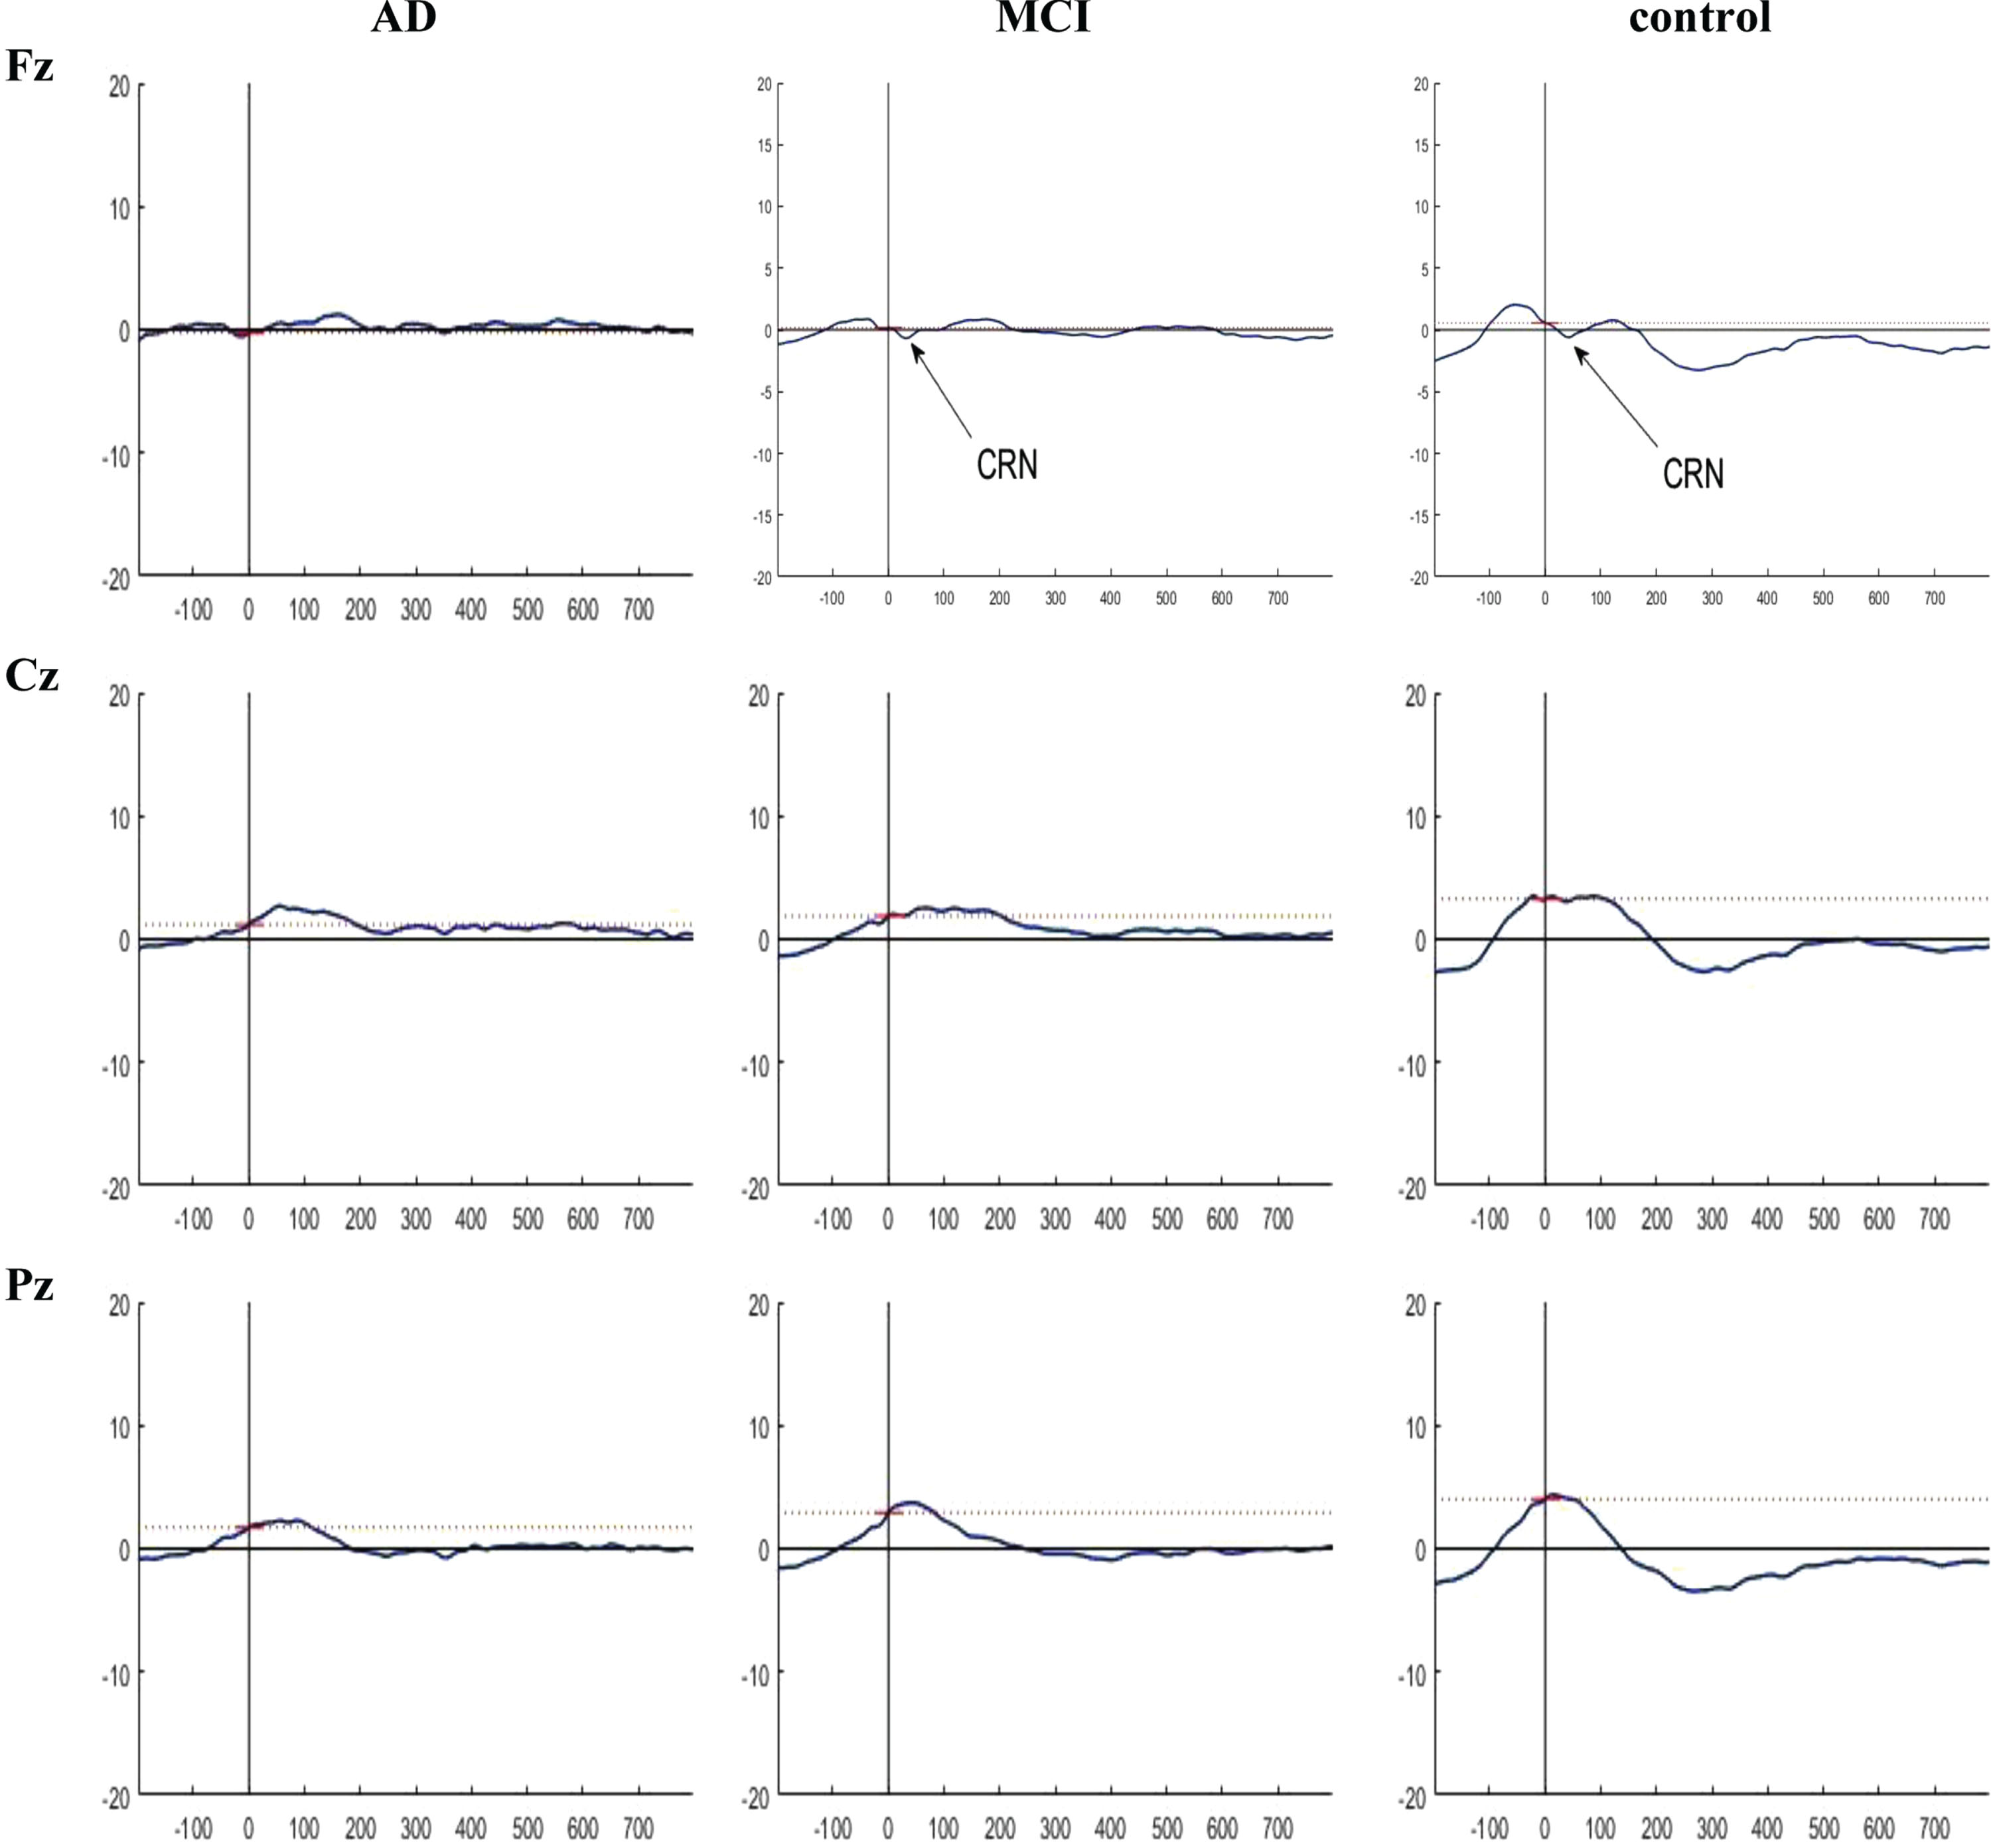
Table 5
Comparison of peak latency of P300, ERN, CRN, and Pe components in AD, MCI and control groups
| AD | MCI | Control | p | ||
| P300 | P7 | 519.89±87.71 | 523.43±93.33 | 510.80±62.71 | 0.909 |
| P8 | 500.85±87.34 | 516.23±83.89 | 503.25±64.33 | 0.842 | |
| Pz | 514.45±74.36 | 528.56±77.70 | 490.10±52.95 | 0.309 | |
| ERN | Fz | 63.84±46.77 | 83.12±47.73 | 64.58±35.27 | 0.381 |
| Cz | 69.94±48.07 | 91.91±39.51 | 62.36±28.02 | 0.107 | |
| Pz | 63.35±45.21 | 93.13±32.92 | 78.38±33.25 | 0.094 | |
| CRN | Fz | 69.45±46.26 | 59.32±37.07 | 48.3±22.93 | 0.291 |
| Cz | 78.61±47.38 | 55.78±40.17 | 72.13±45.47 | 0.336 | |
| Pz | 76.66±36.89 | 103.88±48.58 | 106.51±50.34 | 0.137 | |
| Pe | Fz | 263.79±73.90 | 273.07±77.14 | 248.82±65.80 | 0.648 |
| Cz | 266.72±76.23 | 299.07±79.18 | 251.30±55.93 | 0.175 | |
| Pz | 277.22±78.77 | 324.46±59.47 | 270.31±57.03 | 0.053 |
Correlation results
A positive correlation was observed between the ‘between error’ variable of the SWM test and the mean ERN amplitude in channels Cz and Pz (p = 0.005 and p = 0.040, respectively). Also, a significant positive correlation was observed between total errors and the mean ERN amplitude in channels Fz, Cz, and Pz (p = 0.034, p = 0.003, and p = 0.020, respectively). However, no correlation was observed between total errors and the mean amplitude of the Pe component. In terms of pattern recognition memory, no significant correlation was found between the mean amplitude of the ERN and Pe components and the mean correct latency or the number of correct responses. On the other hand, a negative correlation was observed between the number of correct responses and the mean amplitude of ERN in the Cz channel (p = 0.03).
In terms of PAL performance, negative correlations were observed between the first trial memory scores and the mean amplitude of ERN in channels Fz, Cz, and Pz (p = 0.01, p = 0.001, and p = 0.01, respectively). Conversely, a positive correlation was observed between adjusted total errors and the mean amplitude of ERN in channels Cz and Pz (p = 0.007 and p = 0.03, respectively). However, the correlation between adjusted total errors and the mean amplitude of the Pe component was not significant. Also, the performance accuracy was found to have a negative correlation with the mean amplitude of the ERN component in the Fz, Cz, and Pz channels (p = 0.01, p = 0.000, and p = 0.01, respectively). However, there was no significant correlation between performance accuracy and the mean amplitude of the Pe component. The results of analysis revealed a positive correlation between the reaction time in error trials and the mean amplitude of the ERN component in the Fz, Cz, and Pz channels (p = 0.005, p = 0.001, and p = 0.025, respectively). Nevertheless, the correlation between reaction time in error trials and the mean amplitude of the Pe component was not significant (Table 6).
Table 6
Correlations of SWM, PRM, PAL, and correct performance with mean amplitudes of ERN and Pe components
| SWM | PRM | PAL | Correct.performance | Rt. Error trial | ||||||
| Between errors | Total errors | Mean correct latency | Correct number | First trial memory score | Total error adjusted | |||||
| Mean±SD | 64.09±23.35 | 68.37±24.66 | 3536.6±1335.06 | 17.98±3.95 | 10.54±5.97 | 82.52±67.34 | 0.701±0.285 | 0.649±0.224 | ||
| ERN | Fz | Correlation coefficient | 0.273 | 0.306 | 0.094 | –0.123 | –0.357 | 0.238 | –0.373 | 0.407 |
| p | 0.061 | 0.034 | 0.52 | 0.40 | 0.013 | 0.10 | 0.01 | 0.005 | ||
| Cz | Correlation coefficient | 0.400 | 0.417 | 0.073 | –0.304 | –0.447 | 0.387 | –0.528 | 0.489 | |
| p | 0.005 | 0.003 | 0.62 | 0.03 | 0.001 | 0.007 | 0.000 | 0.001 | ||
| Pz | Correlation coefficient | 0.298 | 0.336 | 0.057 | –0.206 | –0.366 | 0.307 | –0.428 | 0.331 | |
| p | 0.04 | 0.02 | 0.70 | 0.16 | 0.011 | 0.03 | 0.001 | 0.025 | ||
| Pe | Fz | Correlation coefficient | 0.097 | 0.128 | 0.047 | –0.085 | –0.1 | 0.144 | –0.25 | 0.205 |
| p | 0.51 | 0.38 | 0.74 | 0.56 | 0.49 | 0.32 | 0.09 | 0.172 | ||
| Cz | Correlation coefficient | 0.028 | 0.054 | 0.014 | –0.123 | –0.004 | 0.138 | –0.177 | 0.091 | |
| p | 0.85 | 0.71 | 0.92 | 0.40 | 0.98 | 0.35 | 0.23 | 0.549 | ||
| Pz | Correlation coefficient | –0.025 | 0.036 | –0.028 | 0.01 | 0.045 | 0.024 | –0.081 | 0.037 | |
| p | 0.86 | 0.81 | 0.85 | 0.94 | 0.76 | 0.86 | 0.58 | 0.808 | ||
DISCUSSION
Since there is currently no definitive treatment for AD, the identification of biomarkers that indicate progression towards AD can play a crucial role in preventing or delaying the onset of this disease. The main hypothesis of this study is that error monitoring may be compromised in AD and MCI. To investigate this hypothesis, we conducted a study to assess the ERP components associated with this function, using the Eriksen flanker task and identify any correlations between these components and the primary cognitive functions that are impaired in AD and MCI groups in comparison to healthy individuals.
The findings of this study revealed that the control group exhibited higher accuracy in their responses following errors compared to both the MCI and AD groups. Furthermore, the MCI group demonstrated greater accuracy in their responses following errors compared to the AD group. It appears that the brain has a mechanism to detect erroneous responses and attempts to prevent future errors. This process enhances the accuracy of subsequent responses and increases the response time following an error, presumably to allow for additional processing to avoid repeated errors [36]. Research has indicated that the ACC and the DLPFC play pivotal roles in error monitoring [6]. It has been also shown that the ACC changes in individuals with MCI and mild AD [37]. Moreover, the DLPFC is affected in AD pathology, and there is evidence of its abnormal function and structure in AD [38]. Based on these findings, impaired error monitoring is expected in people with AD and MCI; this aligns with our findings regarding responses following an error. However, we observed that the time taken to respond after an error increased across all three groups. Despite the increased response time following an error, it appears that patients with MCI and AD were not able to enhance their performance to the same extent as individuals in the control group.
The current study revealed that the amplitude of the P300 and ERN components was greater in normal individuals compared to patients with MCI and AD. Interestingly, the amplitude of the ERN was larger in MCI patients compared to those with AD. These ERN findings were particularly noticeable in the central area (Cz), which aligns with the results reported by Mathalon et al. [5]. Moreover, the ERN amplitude had a negative correlation with the reaction time in error responses. Conversely, it had a positive association with correct performance after errors. In other words, a larger amplitude of ERN was associated with a quicker reaction time and more accurate responses following errors. Therefore, it seems that a higher amplitude of ERN is associated with improved error processing performance in behavioral tasks.
Our findings suggest that error processing performance is compromised in individuals with MCI and those in the early stages of AD. Furthermore, this deficit appears to be more pronounced in AD patients compared to those with MCI. From a cognitive perspective, error monitoring is taken into account when the participant is aware of the correct response, as opposed to when a mistake is made [5]. Additionally, the working memory capacity significantly influences this performance. Therefore, a larger working memory capacity results in a greater ERN amplitude [11]. It has been reported that deficits in working memory and episodic memory occur in the early stages of AD. These impairments begin during the phase of MCI and are indicators of progression towards AD [39]. The results of this study also revealed that working memory and PAL (which is associated with new learning and episodic memory) have a positive correlation with the amplitude of ERN. This suggests that individuals with better cognitive functions in these areas tend to have a greater ERN amplitude.
Horowitz-Kraus et al. suggested that while working memory and error detection are somewhat independent, superior working memory enhances error detection capabilities. They proposed that ERN is the outcome of a comparison between the actual response and the desired response. Furthermore, the amplitude of ERN was associated with the level of inconsistency between these representations. They theorized that as the storage capacity expands, more representations, including the desired response, are stored in working memory, resulting in a higher error negativity [11]. It can be inferred that the diminished amplitude of ERN in individuals with MCI and AD could be a consequence of impaired working memory. This finding is in line with Mathalon’s attribution of the reduction in the ERN amplitude to a lack of awareness, as well as deficits in the ACC. Therefore, it can be concluded that the ERN amplitude is a potential marker for the progression from MCI to AD.
In terms of the CRN component, no significant difference was observed in its amplitude among the three groups. A similar observation was made for the amplitude of the Pe component. Joseph et al. reported that neurodegeneration in AD patients initially occurs in the entorhinal cortex. This degeneration then progresses to the limbic structure and neocortex areas, including the DLPFC [38]. Considering the possible role of the DLPFC in the Pe component [38] [40], it seems that this component is not affected in the early stages of AD. Therefore, the amplitude of ERN, rather than its latency, can be utilized to monitor the progression from MCI to AD. However, this application may not be applicable to other components of error processing.
While previous studies have not compared error processing assessments across normal control, MCI, and AD groups, the findings of the current study align with previous research in numerous ways. In a study conducted by Junko Ito et al., they evaluated the ERP components associated with correct and error responses, using the lexical recognition paradigm in both AD patients and healthy individuals [7]. Consistent with our findings, they showed that the ERN amplitude significantly decreased in AD patients, while the amplitude of CRN did not show any significant differences between the two groups. Conversely, they reported findings that were inconsistent with our results. They observed a significant difference between the groups in terms of the peak latency of the ERN and Pe components, as well as the Pe amplitude. Moreover, they found slower reaction time of error and correct responses in patients with AD as compared to healthy individuals. This finding is in line with our findings in terms of the reaction time of only error responses.
In another study, Mathalon et al. assessed the ERP components using the name-picture verification task in three groups of healthy young people, healthy older people, and AD patients [5]. Their findings, which demonstrated that the amplitude of ERN was smaller in AD patients compared to healthy older individuals, align with our results. However, no such difference was observed in terms of the Pe amplitude. Alternatively, Razafimahatrata et al. conducted an evaluation of error monitoring in two groups of individuals with positive amyloid who progressed to AD and those with positive amyloid who did not progress to AD [41]. The results of their study revealed that the amplitude of the Pe component decreased in the first group at the time of AD diagnosis. However, the amplitude of ERN remained unchanged between the two assessment periods in both groups. These results appear to be inconsistent with the findings of our study. Thurm et al. also compared the amplitude of ERN and CRN in older patients with MCI, young controls, and elderly controls [42]. They did not find any significant differences between the two control groups in terms of the ERN and CRN components. They also showed that CRN was greater in patients with MCI compared to both control groups. Moreover, they discovered no significant difference in the amplitude of ERN and CRN in patients with MCI; these findings are not consistent with the results of ourstudy.
Limitations
A major limitation observed in this study was the small sample size. For more robust and generalizable results, it is recommended to conduct further studies with a larger number of participants. This would allow for a more comprehensive comparison among the three groups of AD, MCI, and normal individuals.
Conclusion
The results of this study suggest that in error processing, both the level of correct performance following errors and the amplitude of the ERN component can serve as indicators of MCI and progression towards AD. However, the amplitude of the P300 component can be only used to detect MCI, but not to track the progression to AD. Also, cognitive functions, including working memory and new learning, are related to the amplitude of the ERN component.
AUTHOR CONTRIBUTIONS
Mohammad Hedayatjoo (Conceptualization; Data curation; Formal analysis; Investigation; Project administration; Resources; Software; Writing – original draft); Mehdi Tehrani-Doost (Conceptualization; Formal analysis; Investigation; Methodology; Project administration; Supervision; Validation; Writing – review & editing); Zahra Vahabi (Conceptualization; Formal analysis; Methodology; Project administration; Supervision; Writing – review & editing); Malahat Akbarfahimi (Formal analysis; Writing – original draft; Writing – review & editing); Reza Khosrowabadi (Formal analysis; Methodology; Writing – original draft; Writing – review & editing).
FUNDING
This study received partial financial support from the Iran High-Tech Laboratory Network.
CONFLICT OF INTEREST
The authors declare no conflict of interest.
DATA AVAILABILITY
The data analysis supporting the findings of this study is available upon reasonable request to the first author.
ACKNOWLEDGMENTS
We would like to thank all individuals who participated in this study. We also thank the National Laboratory of Brain Mapping and the Research Center for Cognitive and Behavioral Sciences where the assessments were conducted.
REFERENCES
[1] | Reinvang I , Grambaite R , Espeseth T ((2012) ) Executive dysfunction in MCI: Subtype or early symptom. Int J Alzheimers Dis 2012: , 936272. |
[2] | Dhikav V , Anand K ((2011) ) Potential predictors of hippocampal atrophy in Alzheimer’s disease. Drugs Aging 28: , 1–11. |
[3] | Horvath A , Szucs A , Csukly G , Sakovics A , Stefanics G , Kamondi A ((2018) ) EEG and ERP biomarkers of Alzheimer’s disease: A critical review. Front Biosci 23: , 183–220. |
[4] | Iachini T , Iavarone A , Senese VP , Ruotolo F , Ruggiero G ((2009) ) Visuospatial memory in healthy elderly, AD and MCI: A review. Curr Aging Sci 2: , 43–59. |
[5] | Mathalon DH , Bennett A , Askari N , Gray EM , Rosenbloom MJ , Ford JM ((2003) ) Response-monitoring dysfunction in aging and Alzheimer’s disease: An event-related potential study. Neurobiol Aging 24: , 675–685. |
[6] | Ward J ((2015) ) The student’s guide to cognitive neuroscience, Psychology Press. |
[7] | Ito J , Kitagawa J ((2005) ) Error processing in patients with Alzheimer’s disease. Pathophysiology 12: , 97–101. |
[8] | Olvet DM , Hajcak G ((2009) ) Reliability of error-related brain activity. Brain Res 1284: , 89–99. |
[9] | Suchan B , Jokisch D , Skotara N , Daum I ((2007) ) Evaluation-related frontocentral negativity evoked by correct responses and errors. Behav Brain Res 183: , 206–212. |
[10] | Mathalon DH , Jorgensen KW , Roach BJ , Ford JM ((2009) ) Error detection failures in schizophrenia: ERPs and FMRI. Int J Psychophysiol 73: , 109–117. |
[11] | Horowitz-Kraus T , Breznitz Z ((2009) ) Can the error detection mechanism benefit from training the working memory? A comparison between dyslexics and controls—an ERP study. PloS One 4: , e7141. |
[12] | Stretton J , Thompson P ((2012) ) Frontal lobe function in temporal lobe epilepsy. Epilepsy Res 98: , 1–13. |
[13] | Saunders NL , Summers MJ ((2010) ) Attention and working memory deficits in mild cognitive impairment. J Clin Exp Neuropsychol 32: , 350–357. |
[14] | Viggiano MP , Galli G , Righi S , Brancati C , Gori G , Cincotta M ((2008) ) Visual recognition memory in Alzheimer’s disease: Repetition-lag effects. Exp Aging Res 34: , 267–281. |
[15] | O’Donnell J , Pietrzak RH , Ellis KC , Snyder PJ , Maruff P ((2011) ) Understanding failure of visual paired associate learning in amnestic mild cognitive impairment. J Clin Exp Neuropsychol 33: , 1069–1078. |
[16] | McKhann G , Drachman D , Folstein M , Katzman R , Price D , Stadlan EM ((1984) ) Clinical diagnosis of Alzheimer’s disease: Report of the NINCDS-ADRDA Work Group* under the auspices of Department of Health and Human Services Task Force on Alzheimer’s Disease. Neurology 34: , 939–939. |
[17] | Bucks RS , Nanthakumar S , Starkstein SS , Hillman DR , James A , McArdle N , Hatch K , Skinner TC ((2018) ) Discerning depressive symptoms in patients with obstructive sleep apnea: The effect of continuous positive airway pressure therapy on Hamilton Depression Rating Scale symptoms. Sleep 41: , zsy178. |
[18] | Shahrbabaki ME , Sabouri S , Sabahi A , Barfeh D , Divsalar P , Esmailzadeh M , Ahmadi A ((2020) ) The efficacy of probiotics for treatment of bipolar disorder-type 1: A randomized, double-blind, placebo controlled trial. Iran J Psychiatry 15: , 10. |
[19] | Faridhosseini F , Baniasadi M , Bordbar MRF , Pourgholami M , Ahrari S , Asgharipour N ((2017) ) Effectiveness of psychoeducational group training on quality of life and recurrence of patients with bipolar disorder. Iran J Psychiatry 12: , 21. |
[20] | Foroughan M , Jafari Z , Shirin BP , Ghaem MFZ , RAHGOZAR M ((2008) ) Validation of mini-mental state examination (MMSE) in the elderly population of Tehran. Adv Cogn Sci 10: , 29–37. |
[21] | Chabok SY , Kapourchali SR , Leili EK , Saberi A , Mohtasham-Amiri Z ((2012) ) Effective factors on linguistic disorder during acute phase following traumatic brain injury in adults. Neuropsychologia 50: , 1444–1450. |
[22] | Arevalo-Rodriguez I , Smailagic N , i Figuls MR , Ciapponi A , Sanchez-Perez E , Giannakou A , Pedraza OL , Cosp XB , Cullum S ((2015) ) Mini-Mental State Examination (MMSE) for the detection of Alzheimer’s disease and other dementias in people with mild cognitive impairment (MCI). Cochrane Database Syst Rev 2015: , CD010783. |
[23] | Lenehan ME , Summers MJ , Saunders NL , Summers JJ , Vickers JC ((2016) ) Does the Cambridge Automated Neuropsychological Test Battery (CANTAB) distinguish between cognitive domains in healthy older adults? Assessment 23: , 163–172. |
[24] | Égerházi A , Berecz R , Bartók E , Degrell I ((2007) ) Automated Neuropsychological Test Battery (CANTAB) in mild cognitive impairment and in Alzheimer’s disease. Prog Neuropsychopharmacol Biol Psychiatry 31: , 746–751. |
[25] | Soares FC , de Oliveira TCG ((2015) ) CANTAB object recognition and language tests to detect aging cognitive decline: An exploratory comparative study. Clin Interven Aging 10: , 37. |
[26] | Balbaid NT , Al-Dawalibi A , Khattab AM , Al-Saqr F , AbuSittah A , Alqarni S , Habib S , Iqbal M , Bashir S ((2020) ) The relationship between cognitive impairment and coronary artery disease in middle-aged adults. Cureus 12: , e6724. |
[27] | Völker M , Fiederer LD , Berberich S , Hammer J , Behncke J , Kršek P , Tomášek M , Marusič P , Reinacher PC , Coenen VA ((2018) ) The dynamics of error processing in the human brain as reflected by high-gamma activity in noninvasive and intracranial EEG. Neuroimage 173: , 564–579. |
[28] | Coleman JR , Watson JM , Strayer DL ((2018) ) Working memory capacity and task goals modulate error-related ERPs. Psychophysiology 55: , e12805. |
[29] | Endrass T , Klawohn J , Schuster F , Kathmann N ((2008) ) Overactive performance monitoring in obsessive-compulsive disorder: ERP evidence from correct and erroneous reactions. Neuropsychologia 46: , 1877–1887. |
[30] | Larson MJ , South M , Clayson PE ((2011) ) Sex differences in error-related performance monitoring. Neuroreport 22: , 44–48. |
[31] | Stemmer B , Segalowitz SJ , Witzke W , Schönle PW ((2004) ) Error detection in patients with lesions to the medial prefrontal cortex: An ERP study. Neuropsychologia 42: , 118–130. |
[32] | van Schie HT , Mars RB , Coles MG , Bekkering H ((2004) ) Modulation of activity in medial frontal and motor cortices during error observation. Nat Neurosci 7: , 549–554. |
[33] | Herrmann MJ , Mader K , Schreppel T , Jacob C , Heine M , Boreatti-Hümmer A , Ehlis A-C , Scheuerpflug P , Pauli P , Fallgatter AJ ((2010) ) Neural correlates of performance monitoring in adult patients with attention deficit hyperactivity disorder (ADHD). World J Biol Psychiatry 11: , 457–464. |
[34] | Luck SJ ((2014) ), An Introduction to the Event-Related Potential Technique, MIT press. |
[35] | Huang W , Chen W , Zhang X ((2015) ) The neurophysiology of P 300–an integrated review. Eur Rev Med Pharmacol Sci 19: , 1480–1488. |
[36] | Wessel JR ((2018) ) An adaptive orienting theory of error processing. Psychophysiology 55: , e13041. |
[37] | Plant C , Teipel SJ , Oswald A , Böhm C , Meindl T , Mourao-Miranda J , Bokde AW , Hampel H , Ewers M ((2010) ) Automated detection of brain atrophy patterns based on MRI for the prediction of Alzheimer’s disease. Neuroimage 50: , 162–174. |
[38] | Joseph S , Knezevic D , Zomorrodi R , Blumberger DM , Daskalakis ZJ , Mulsant BH , Pollock BG , Voineskos A , Wang W , Rajji TK ((2021) ) Dorsolateral prefrontal cortex excitability abnormalities in Alzheimer’s Dementia: Findings from transcranial magnetic stimulation and electroencephalography study. Int J Psychophysiol 169: , 55–62. |
[39] | Kirova A-M , Bays RB , Lagalwar S ((2015) ) Working memory and executive function decline across normal aging, mild cognitive impairment, and Alzheimer’s disease. Biomed Res Int 2015: , 748212. |
[40] | Masina F , Tarantino V , Vallesi A , Mapelli D ((2019) ) Repetitive TMS over the left dorsolateral prefrontal cortex modulates the error positivity: An ERP study. Neuropsychologia 133: , 107153. |
[41] | Razafimahatratra S , Guieysse T , Lejeune F-X , Houot M , Medani T , Dreyfus G , Klarsfeld A , Villain N , Pereira FR , La Corte V ((2022) ) Can a failure in the error monitoring system explain unawareness of memory deficits in Alzheimer’s disease? Cortex 166: , 428–440. |
[42] | Thurm F , Antonenko D , Schlee W , Kolassa S , Elbert T , Kolassa I-T ((2013) ) Effects of aging and mild cognitive impairment on electrophysiological correlates of performance monitoring. J Alzheimers Dis 35: , 575–587. |


