
Uncovering Diverse Mechanistic Spreading Pathways in Disease Progression of Alzheimer’s Disease
Abstract
Background:
The AT[N] research framework focuses on three major biomarkers in Alzheimer’s disease (AD): amyloid-β deposition (A), pathologic tau (T), and neurodegeneration [N].
Objective:
We hypothesize that the diverse mechanisms such as A⟶T and A⟶[N] pathways from one brain region to others, may underlie the wide variation in clinical symptoms. We aim to uncover the causal-like effect of regional AT[N] biomarkers on cognitive decline as well as the interaction with non-modifiable risk factors such as age and APOE4.
Methods:
We apply multi-variate statistical inference to uncover all possible mechanistic spreading pathways through which the aggregation of an upstream biomarker (e.g., increased amyloid level) in a particular brain region indirectly impacts cognitive decline, via the cascade build-up of a downstream biomarker (e.g., reduced metabolism level) in another brain region. Furthermore, we investigate the survival time for each identified region-to-region pathological pathway toward the AD onset.
Results:
We have identified a collection of critical brain regions on which the amyloid burdens exert an indirect effect on the decline in memory and executive function (EF) domain, being mediated by the reduction of metabolism level at other brain regions. APOE4 status has been found not only involved in many A⟶N mechanistic pathways but also significantly contributes to the risk of developing AD.
Conclusion:
Our major findings include 1) the region-to-region A⟶N⟶MEM and A⟶N⟶MEM pathways exhibit distinct spatial patterns; 2) APOE4 is significantly associated with both direct and indirect effects on the cognitive decline while sex difference has not been identified in the mediation analysis.
INTRODUCTION
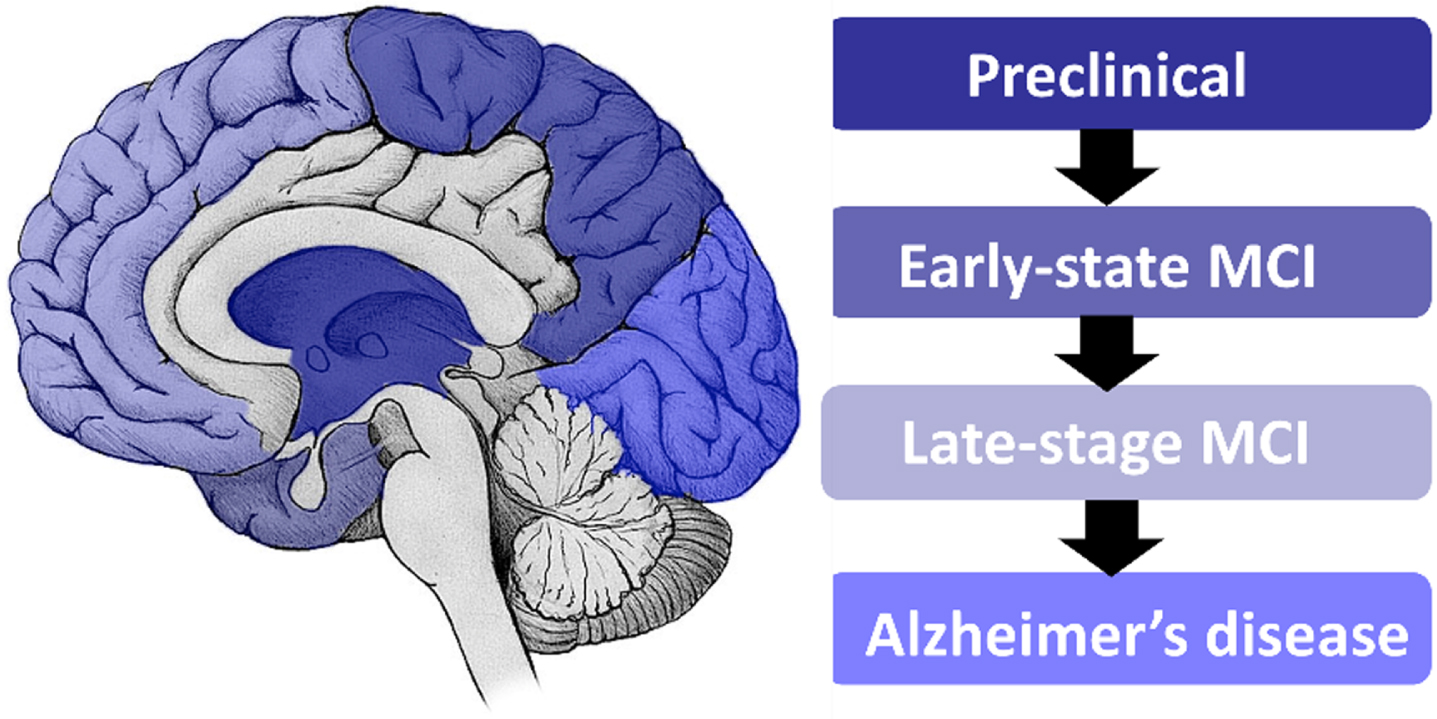
Alzheimer’s disease (AD), the most common neurodegenerative disorder, leads to gradually progressive memory loss, the decline in other cognitive domains, altered behavior, loss of functional abilities, and ultimately death [1–6]. As shown in Fig. 1, AD is a progressive disease such that it starts from the medial temporal lobe and gradually spreads throughout the brain until damaging the occipital lobe, which causes the visual problem. Convergent evidence shows that the spreading of neuropathological burdens such as amyloid plaque and neurofibrillary tangle commence several years prior to the cognitive decline, and such a time period has been estimated to last years, even decades before the onset of AD clinical symptoms [7, 8]. It is a common practice to stratify the disease progression into preclinical, early-state mild cognitive impairment (MCI), late-stage-MCI, and AD based on the severity of clinical symptoms. Since current therapeutic interventions are best utilized at the early stage of the disease, early detection of probable AD is very important for optimizing the benefit of AD treatments [7, 9–15].
Fig. 1
The progression stage of Alzheimer’s disease.
The research framework of AD was initiated by the National Institute of Aging (NIA) [16] to guide observational and interventional research in AD instead of routine clinical care. Specifically, AD is defined by its underlying pathologic processes that can be documented by postmortem examination or in vivo by biomarkers [16, 17]. The biomarkers are grouped into amyloid-β (Aβ) deposition (A biomarker), pathologic tau (T biomarker), and neurodegeneration ([N] biomarker), which constitute the backbone of AT[N] research framework of AD [16]. Although the AT[N] research framework is flexible to study the associations between different pathologic processes and cognitive symptoms, the causal pathway that provides a mechanistic explanation of how neuropathological events affect cognitive decline and how biological risk factors are involved in the neurodegeneration process is largely elusive.
Neuroimaging techniques such as magnetic resonance imaging (MRI) and positron emission tomography (PET) provide valuable information for the diagnosis and management of AD. For instance, PET imaging can track the progression of AD by detecting regional changes in brain metabolism, blood flow, and the accumulation of amyloid and tau proteins [18–20]. Compared to global measurements such as plasma biomarkers [21] and cerebrospinal fluid (CSF) biomarkers [22, 23], the rich spatial information in neuroimages allows us to localize the investigation of mechanistic pathways between AT[N] biomarkers across brain regions.
In this context, the overarching goal of this work is to answer the following important scientific questions that allow us to advance our current understanding of the diversity in the disease progression of AD.
1. Novel understanding of the pathophysiological mechanism at the imaging biomarker level. Although affected individuals with an increased magnitude of pathological burden often show a greater cognitive decline over time, the neurophysiological mechanisms by which AD pathology spreads in the brain and how this determines the associated trajectory of cognitive decline are still largely elusive. Since converging evidence shows that the neuropathological burdens spread throughout the brain in a prion-like manner [24], an interesting question is whether there exists the region-to-region mechanistic pathway between AT[N] biomarkers where the effect of excessive regional neuropathological event on cognitive decline is mediated by the development of other regional neuropathological events.
2. Role of APOE4 in diverse mechanistic pathways. There is a compelling body of evidence that the diversity of cognitive decline trajectory and the extent of neurodegeneration caused by AD is closely related to the pathogenesis process, where genetic factors (such as APOE4 status [25]) have various contributions to the development of neuropathological burdens at different brain regions [26, 27]. Since APOE4 has sex-dependent effects [28], we include APOE4 carrier/non-carrier, sex, and age in the statistical analysis and put the spotlight on the direct/indirect causal effect of these non-modifiable risk factors on the mechanistic pathways of AT[N] biomarker.
3. Survival analysis for cognitive decline on the mechanistic pathways. It is vital to quantify the survival rate of risk factors that lead to cognitive decline in the diagnosis and treatment of AD. Specifically, the questions include (i) What is the effect size of each non-modifiable risk factor on the cognitive decline?; (ii) Does lifestyle variable contribute to the neuropathological events on the particular mechanistic pathway?; (iii) Does sex difference occur on the identified mechanistic pathways?
To answer these questions, we apply a cutting-edge statistical model to uncover the synergistic effect of AD biomarkers resulting in cognitive decline by characterizing their inter-relationships. The data analysis is performed on the neuroimaging data, clinic assessment, and demographic data from Alzheimer’s Disease Neuroimaging Initiative (ADNI) database.
MATERIALS AND METHODS
Data demographics
Data used in the preparation of this article were obtained from the ADNI database (https://adni.loni.usc.edu). The ADNI was launched in 2003 as a public-private partnership, led by Principal Investigator Michael W. Weiner, MD. The primary goal of ADNI has been to test whether serial MRI, PET, other biological markers, and clinical and neuropsychological assessment can be combined to measure the progression of MCI and early AD. For up -to-date information, see https://www.adni-info.org.
ADNI enrolls participants between the ages of 55 and 90 who are recruited at 57 sites in the United States and Canada. After obtaining informed consent, participants undergo a series of initial tests that are repeated at intervals over subsequent years, including clinical evaluation, neuropsychological tests, genetic testing, lumbar puncture, and MRI and PET scans. There are four phases of the ADNI study (ADNI1, ADNI-GO, ADNI2, and ADNI3). Some participants were carried forward from previous phases for continued monitoring, while new participants were added with each phase to further investigate the progression of AD.
In this work, we put the spotlight on the effect of AD-related pathology on memory (MEM) decline and executive function (EF) decline, respectively. It is worth noting that we derived composite scores for MEM and EF using data from the ADNI neuropsychological battery using item response theory (IRT) methods. The formation of ADNI-MEM was complicated by the use of different word lists in the Rey Auditory Verbal Learning Test (RAVLT) and the ADAS-Cog, and by Logical Memory I data missing by design [29].
For each mechanic pathway, we select subjects from ADNI data based on the following two criteria: 1) each subject should have both two modalities and clinical outcome scores; 2) the data collection of upstream AD biomarker should be prior to the downstream biomarker in the mediation analysis. For example, the amyloid-PET scan is required to be earlier than FDG-PET scan in the A⟶N pathway, in order to characterize the mediation effect of amyloid on the metabolism level. We show the demographic information of participants for A-N pathway, A-T pathway, and T-N pathway in Table 1. The diagnostic information is shown at the bottom of Table 1, in which CN and MCI are the abbreviations for cognitive normal and mild cognitive impairment, respectively.
Table 1
Demographic characteristics of participants in A-N, A-T, and T-N pathways
| Resilience models | A-N pathway | A-T pathway | T-N pathway |
| (N = 669) | (N = 137) | (N = 25) | |
| Age | |||
| Mean (SD) | 72.8 (6.93) | 71.1 (6.61) | 68.9 (7.42) |
| Median [Min, Max] | 72.8 [55.0, 90.3] | 70.8 [55.0, 90.1] | 68.4 [55.0, 84.8] |
| Biological sex | |||
| Male | 358 (53.5%) | 72 (52.6%) | 13 (52.0%) |
| Female | 311 (46.5%) | 65 (47.4%) | 12 (48.0%) |
| Memory composite score | |||
| Mean (SD) | 0.176 (1.09) | 0.558 (0.917) | 0.476 (0.827) |
| Median [Min, Max] | 0.288 [–2.86, 3.14] | 0.683 [–2.56, 2.72] | 0.686 [–1.35, 2.10] |
| EF composite score | |||
| Mean (SD) | 0.128 (1.26) | 0.569 (1.08) | 0.797 (0.855) |
| Median [Min, Max] | 0.240 [–3.31, 2.99] | 0.648 [–2.49, 2.99] | 0.872 [–1.58, 2.23] |
| Diagnostic information | |||
| CN/MCI/AD | 193/211/265 | 50/47/40 | 0/14/11 |
Image processing
Each subject has T1-weighted MRI, amyloid-PET, tau-PET, and FDG-PET scans. Destrieux atlas [30] is used to parcellate each brain into 160 regions of interest (ROIs), which consist of 148 cortical regions (frontal lobe, insula lobe, temporal lobe, occipital lobe, parietal lobe, and limbic lobe) and 12 sub-cortical regions (left and right hippocampus, caudate, thalamus, amygdala, globus pallidum, and putamen). The major image preprocessing steps include 1) skull strip and tissue segmentation on T1-MRI; 2) brain parcellation using the Destrieux atlas; 3) constructing cortical surface using free-surfer [31]; and 4) calculating the standardized uptake value ratio (SUVR) where the cerebellum is selected as the reference region.
Covariates and confounders in the statistical inference
The initial set of covariates consists of 160 regional SUVRs from amyloid, 160 regional SUVRs from tau, and 160 regional SUVRs from FDG-PET, respectively. The confounders include biological sex, education, and age. To remove the effect of those potential confounders, we regress the value of 480 ROIs and MEM/EF score on them separately and independently. The residuals of regional SUVRs and MEM/EF scores are utilized as covariates and outcomes in the downstream integrative factor regression model to select the key regional SUVRs associated with MEM/EF score. The selected SUVRs are used in a further mediation analysis to construct the pathways of how they affect the MEM/EF scores. Mediators found in mediation analysis and the corresponding exposures are further involved as covariates in the Cox’s proportional hazard model [32] to study how they affect the time to cognitive decline. APOE4 status, sex, and age are adjusted in the Cox’s model.
Statistical approach
In general, our statistical inference consists of three major steps. Firstly, we apply a multi-variate variable selection method to reduce the number of brain regions for region-to-region mediation analysis. Secondly, we apply a set of mediation analyses to all possible pathways between regional AT[N] biomarkers. To make the analysis computationally tractable, each mediation analysis consists of one upstream regional biomarker, one downstream regional biomarker, and clinical outcomes (shown in Fig. 2). Thirdly, we apply survival analysis to examine the hazard ratio of identified critical brain regions (i.e., manifesting significant direct/indirect effect on clinical outcome in the mediation analysis) to the cognitive decline in each pathway analysis.
Fig. 2
Three SEMs of AT[N] pathway in this paper.
![Three SEMs of AT[N] pathway in this paper.](https://content.iospress.com:443/media/adr/2023/7-1/adr-7-1-adr230081/adr-7-adr230081-g002.jpg)
Variable selection
We use the integrative factor regression model [33] to select potentially influential variables (regional SUVRs) to be included in the second-stage mediation analysis. For each modality (amyloid, tau, and FDG-PET), we control the confounding effects on the observed regional SURVs by regressing raw values of ROIs on the confounders. Each two of them will be used as the exposure and mediator variables of the outcome (MEM/EF) in the mediation analysis. We first regress the outcome on every two of the three modalities (A&F, A&T, or T&F) and select regional SUVRs in these modalities that are associated with the outcome. Let xm be the vector of variables from the mth modality for m = 1, 2, and y be the residual of regressing MEM/EF on confounders. We consider a linear regression model of
Mediation analysis
After variable selection, we design the following region-to-region structural equation models (SEMs) to elucidate the mechanistic pathways between AT[N] biomarkers, as shown in Fig. 2.
1. SEM 1: Test whether FDG acts as a mediator of amyloid on MEM/EF score (A→F→MEM/EF).
2. SEM 2: Test whether tau acts as a mediator of amyloid on MEM/EF score (A→T→MEM/EF)
3. SEM 3: Test whether FDG acts as a mediator of tau on MEM/EF score (T→F→MEM/EF)
The input to each SEM consists of selected regional SUVRs and the clinical phenotype. Each SEM has an exposure variable, a mediator, and an outcome. To infer the causal relation, we need these three components to be ordered by time i.e., Texposure < Tmediator < Toutcome. In SEM 1 and SEM 2, we use the latest FDG/tau measurement (potential mediator) after amyloid (exposure) measurement but prior to MEM/EF measurement (outcome). Besides, subjects without records on APOE4, education, sex, and age are removed. This gives sample sizes of 669 and 137 in SEM 1 and SEM 2, respectively. Since the temporal changes of regional amyloid/FDG/tau SUVRs are slow, when performing SEM 3, we relax the time restriction by allowing FDG measurement to be no more than one year later than tau measurement, instead of being strictly earlier than tau measurement. This gives us a sample size of 41 in SEM 3.
To illustrate the mediation analysis, let’s take SEM 1 as an example. We let x be the exposure variable (i.e., the selected regional amyloid SUVR), y be the independent variable (i.e., the composite score of memory), m be the mediator (i.e., the selected regional FDG SUVR). Three regression models are constructed to evaluate the mediation effect:
Model 1: y = γ1 + τ1x + ∈ 1
Model 2: m = γ2 + αx + ∈ 2
Model 3: y = γ3 + τ2x + βm + ∈ 3
where γ1, γ2, and γ3 are the intercept terms, and ∈1, ∈2, and ∈3 are the error terms. In Model 1, τ1 measures the total exposure-outcome effect. In Model 2, α measures the exposure-mediator effect. In Model 3, τ2 measures the direct exposure-outcome effect after adjusting for the mediator effect and β measures mediator-outcome effect after adjusting for the exposure effect.
In the cliché of mediation analysis, αβ = τ1 - τ2 measures the mediation/indirect effect of exposure on the outcome and we perform the Sobel test to assess its significance. The null hypothesis of the non-existence of indirect effect is αβ = 0. The Sobel test statistic is
Table 2
Mediation analysis of A⟶N⟶MEM
| Left_dPCC | Left_Inferior frontal sulcus | Right_Lingual gyrus | Right_Superior parietal lobule | Right_Subparietal sulcus | Left_Hippo campus | |
| Left_Inferior temporal gyrus | M | M | –7.7202 (<0.001) | –7.719 (<0.001) | M | M |
| Right_Angular gyrus | M | –7.427 (<0.001) | –7.199 (<0.001) | –7.318 (<0.001) | M | M |
| Left_Putamen | –1.371 (0.288) | –1.2916 (0.288) | –1.0637 (0.288) | –1.141 (0.288) | –1.638 (0.288) | –1.363 (0.288) |
| Right_Putamen | –1.698 (0.169) | –1.549 (0.169) | –1.375 (0.169) | –1.397 (0.169) | –1.982 (0.169) | –1.584 (0.169) |
| Right_Pallidum | M | 0.215 (0.829) | 0.423 (0.829) | 0.372 (0.829) | M | M |
“M” standards for the mediation effect of amyloid burden (row) on memory decline is mediated by reduced metabolism level (column). Otherwise, we display the direct effect size of the amyloid burden on memory decline, where the significant direct effect (adjusted p < 0.05) is marked in red. dPCC, posterior-dorsal part of cingulate gyrus. All p-values are adjusted by Storey’s method to control the FDR.
Table 3
The effect sizes and FDR-controlled p-values for ten region-to-region A⟶N⟶MEM pathways showing a mediation effect
| Indirect Effect | A⟶N | N⟶MEM | |
| Left_Inferior temporal gyrus ⟶ Left_dPCC | –5.192 | –6.226 | 9.4069 |
| (<0.001) | (<0.001) | (<0.001) | |
| Left_Inferior temporal gyrus ⟶ Left_Inferior frontal sulcus | –2.412 | –2.848 | 4.534 |
| (0.0238) | (0.0066) | (<0.001) | |
| Left_Inferior temporal gyrus ⟶ Right_Subparietal sulcus | –4.172 | –5.188 | 7.0181 |
| (<0.001) | (<0.001) | (<0.001) | |
| Left_Inferior temporal gyrus ⟶ Left_Hippocampus | –3.942 | –4.399 | 8.8803 |
| (<0.001) | (<0.001) | (<0.001) | |
| Right_Angular gyrus ⟶Left_dPCC | –5.416 | –6.7039 | 9.189 |
| (<0.001) | (<0.001) | (<0.001) | |
| Right_Angular gyrus ⟶ Right_Subparietal sulcus | –4.471 | –6.00237 | 6.70012 |
| (<0.001) | (<0.001) | (<0.001) | |
| Right_Angular gyrus ⟶ Left_Hippocampus | –4.493 | –5.292 | 8.5027 |
| (<0.001) | (<0.001) | (<0.001) | |
| Right_Pallidum ⟶ Left_dPCC | 3.4604 | 3.684 | 10.0764 |
| (0.0016) | (<0.001) | (<0.001) | |
| Right_Pallidum ⟶ Right_Subparietal sulcus | 3.672 | 4.221 | 7.449 |
| (0.0014) | (<0.001) | (<0.001) | |
| Right_Pallidum ⟶ Left_Hippocampus | 2.9029 | 3.0631 | 9.0966 |
| (0.0074) | (0.0044) | (<0.001) |
dPCC, posterior-dorsal part of cingulate gyrus.
Survival analysis
We further study how the exposure and mediator variables affect the time from baseline to the time of Mini-Mental State Examination (MMSE) score falling below 28 using the Cox’s proportional hazard model. Subjects with MMSE score lower than 28 at baseline are excluded from the analysis and subjects with MMSE score greater than 28 during the whole study are treated as right-censored. All exposure variables and significant mediators are included in the Cox’s model. APOE4 status, sex, and age are also adjusted in the model.
RESULTS
In the following, we present the region-to-region A⟶N⟶MEM and A⟶N⟶EF pathway analysis. In each pathway analysis, we first examine the brain regions that exhibit significant association with the clinical outcome. Then, we investigate whether the accumulation of amyloid burden at a specific brain region exerts a direct effect on the decline of cognition or whether such an effect is mediated by the reduced metabolism level at the underlying or other brain regions. Lastly, we estimate the contribution of each identified brain region as well as non-modifiable risk factors (such as age and APOE4) through a survival test.
Effect of AT[N] pathways on memory decline
Variable selection
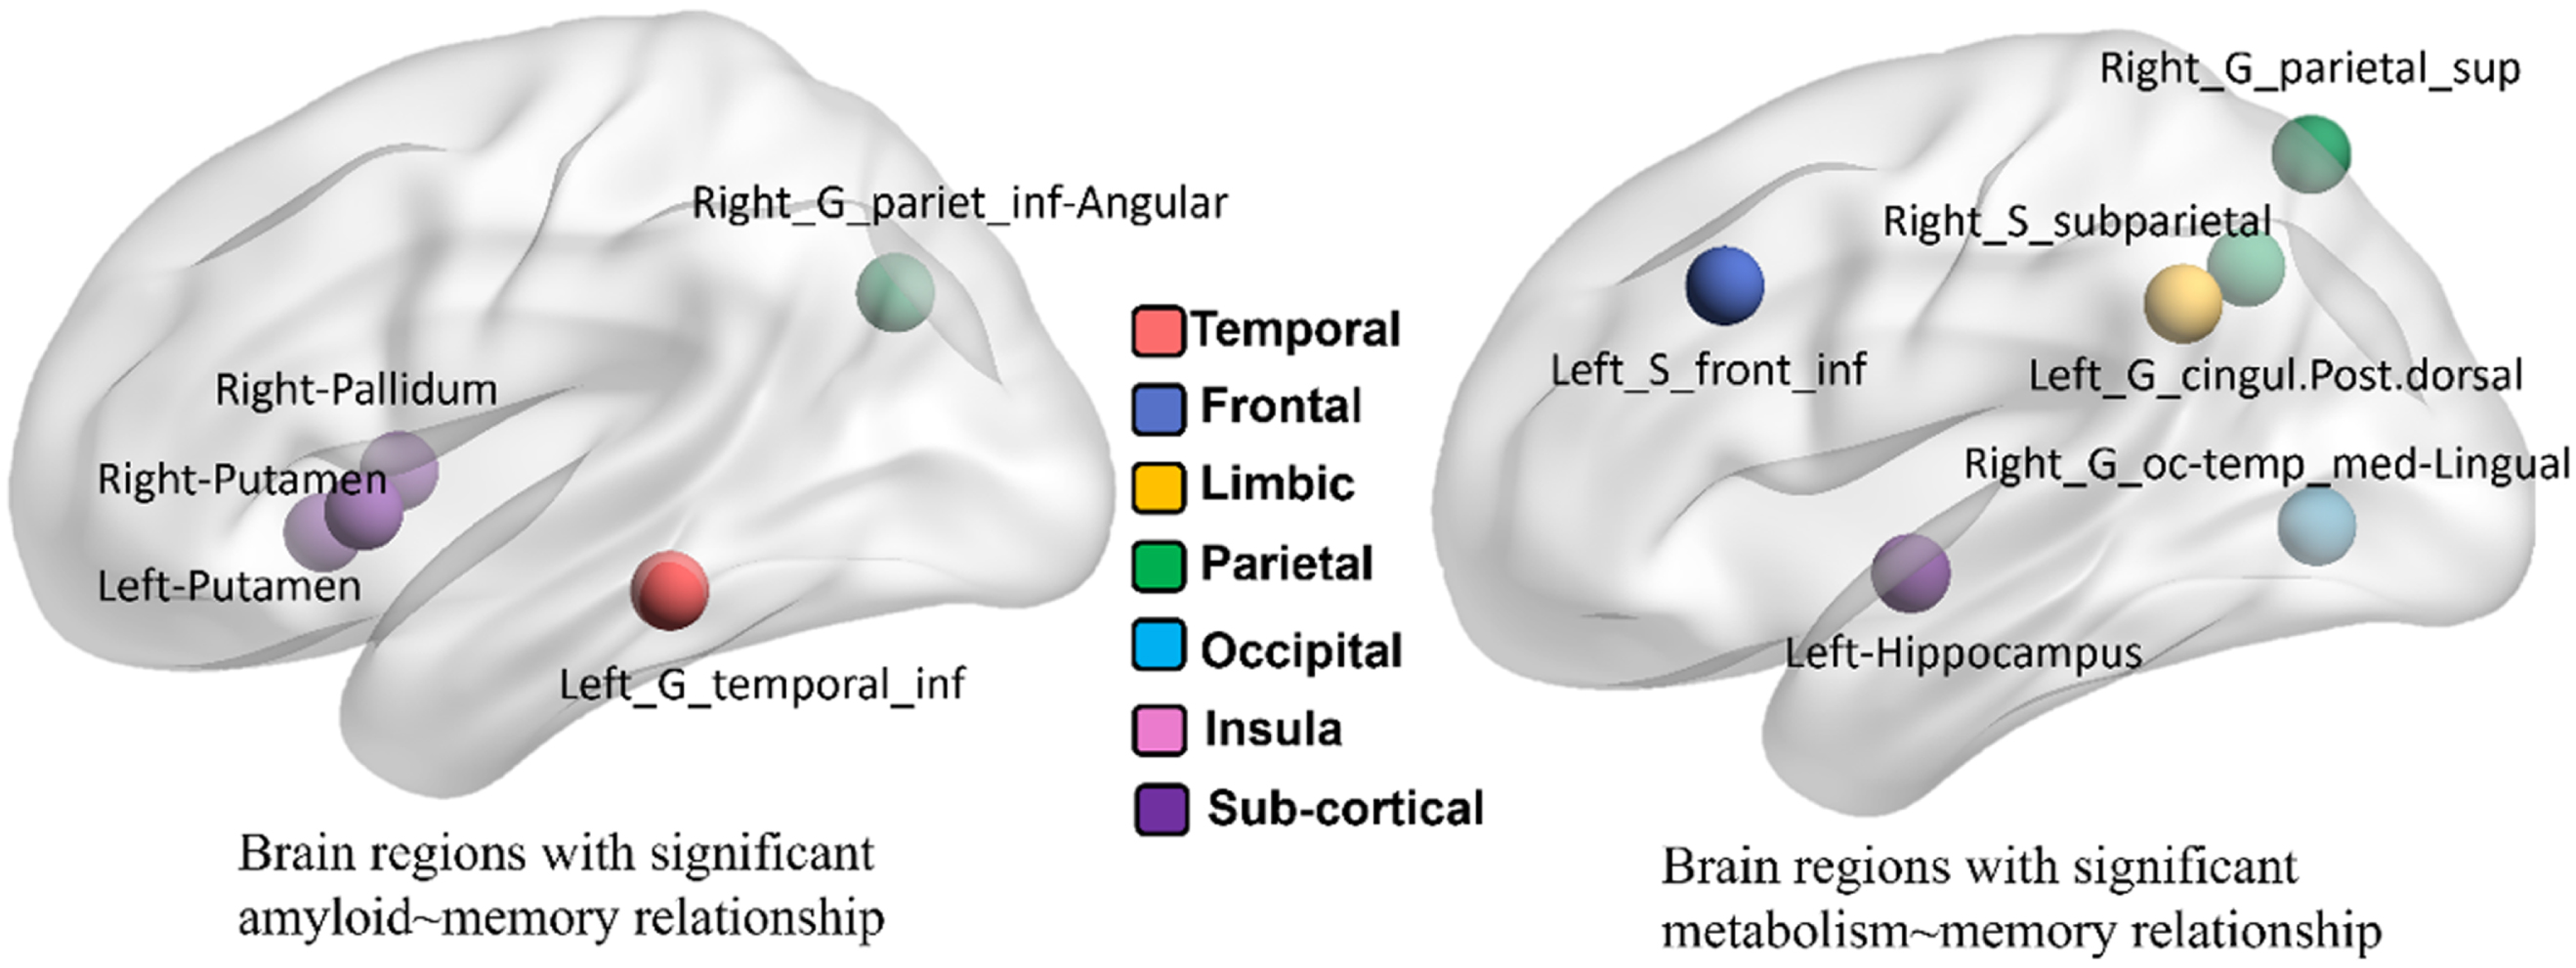
The variable selection results are shown in Fig. 3. For amyloid SUVRs, five regions (left inferior temporal gyrus, left/right putamen, right pallidum, and right inferior angular parietal gyrus) have been identified with significant association to the clinical outcome. For FDG-PET images, we have identified six brain regions after variable selection, which include the right superior parietal gyrus, right subparietal sulcus, right occipital temporal gyrus, left posterior cingular gyrus, left inferior frontal lobe, and left hippocampus. Due to the small sample size, we have not found any brain regions showing a significant statistical association between tau SUVRs and outcome scores. In this regard, we only apply SEM 1 for memory and executive function.
Fig. 3
Selected brain regions from amyloid-PET (left) and FDG-PET (right) w.r.t. memory score.
A-[N]-MEM mechanistic pathway analysis
Since five brain regions in the amyloid modality and six brain regions in the FDG modality have been identified in the region selection step, there are 30 region-to-region A⟶N⟶MEM pathways. We summarize the mediation analysis results in Tables 2 and 3. First, 5 out of 30 possible region-to-region pathways (highlighted in red in Table 2) manifest a direct effect of amyloid accumulation on the decrease of memory composite score at the significance level of p = 0.05. Second, we have found 10 region-to-region pathways show mediated effects on memory decline, that is, the concentration of amyloid deposition affects memory status through the other brain region that shows changes of metabolism level. In Table 3, we show the overall indirect effect sizes (1st column) and the effect sizes (with the adjusted p-values) on A⟶N link (2nd column) and N⟶MEM link (3rd column). It is worth noting that the effect of increased amyloid burden at the left inferior temporal gyrus and right angular gyrus on memory decline is mediated by reduced metabolism levels.
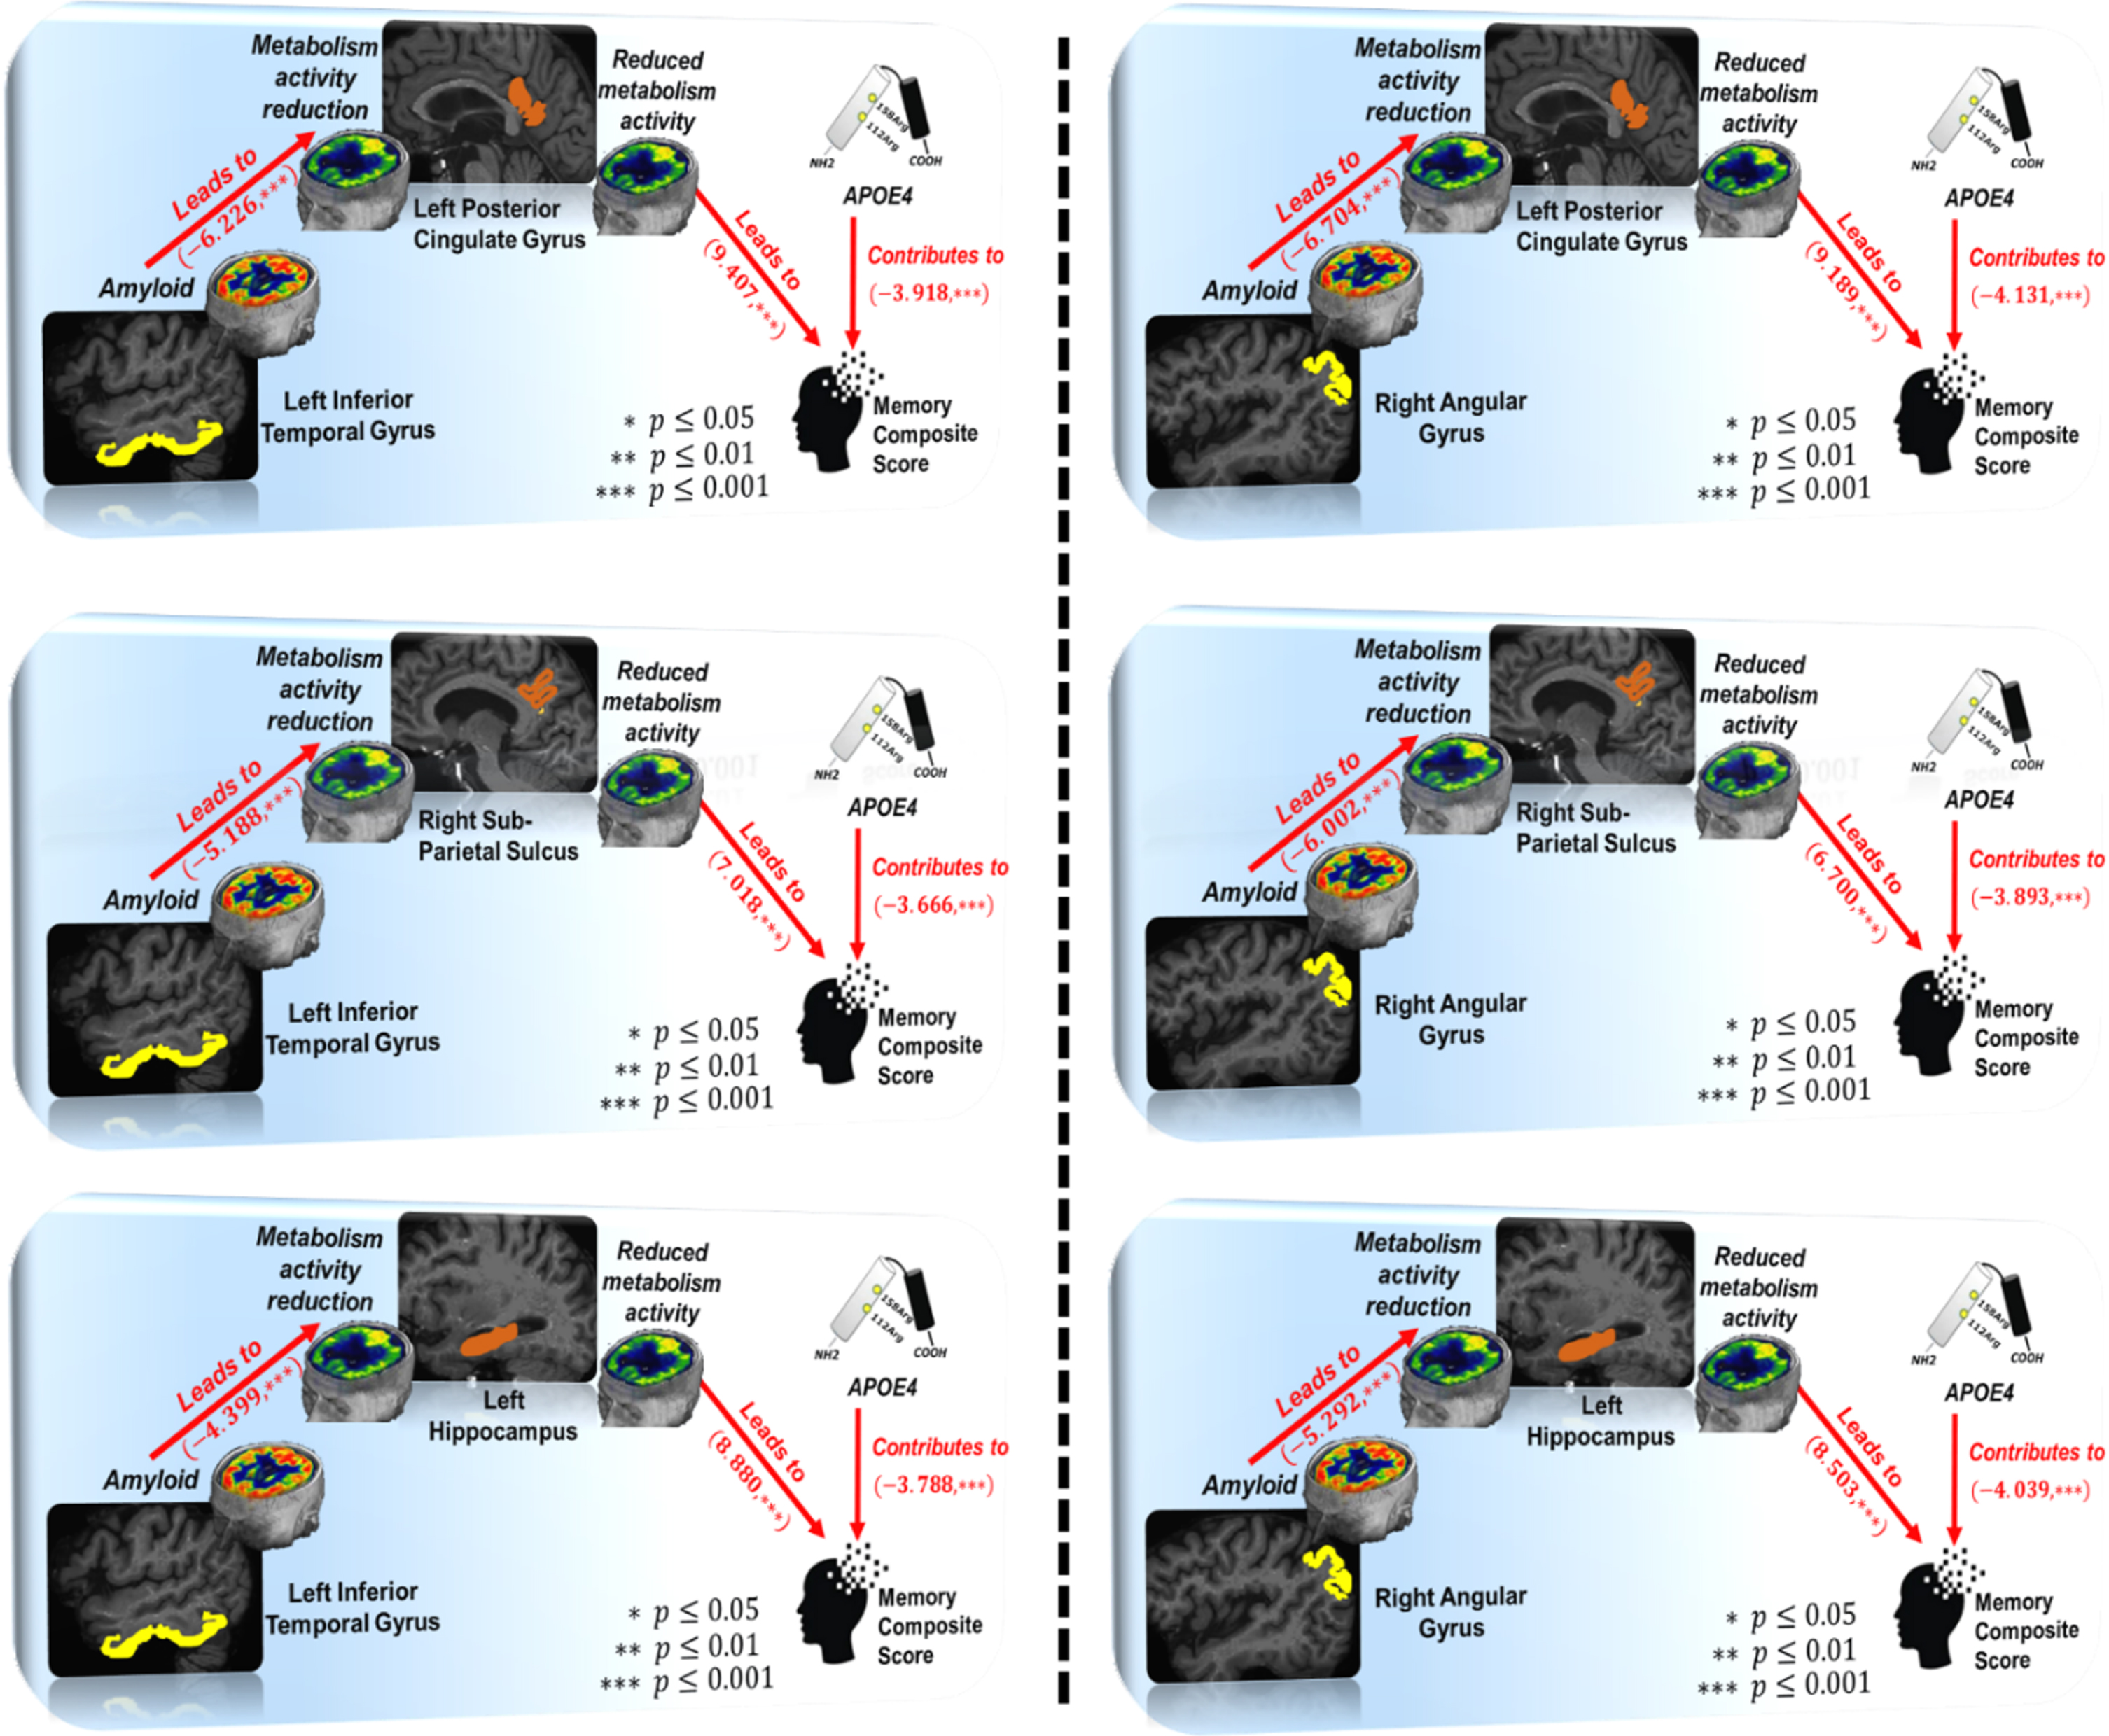
We have included APOE4 status in SEM1, where ‘1’ stands for APOE4 carrier (with at least one ɛ4 allele) and ‘0’ otherwise. APOE4 shows a strong effect on ten mediated pathways shown in Table 3 at a significance level p = 0.05. In Fig. 4, we show three mediated region-to-region pathways associated with the inferior temporal gyrus (left panel) and another three mediated pathways associated with angular gyrus, where the average adverse effect size of APOE4 carriers is –3.406.
Fig. 4
Graphic demonstration of mediated pathways in structural equation model A⟶F⟶MEM.
Survival analysis
As shown in Table 2, there are three regions associated with amyloid deposits and another three brain regions involved in metabolism level are included in the ten mediated pathways. The survival analysis results on these six brain regions are summarized in Table 4. Specifically, only the amyloid depositions at the right pallidum and left inferior temporal gyrus potentially have a significant impact on the risk of developing AD. The hazard of developing AD for a patient with one additional unit of amyloid increment on the left inferior temporal gyrus or right pallidum is multiplicatively increased by 2.19 times and 0.51 times, respectively. Age and male/female differences are not significant on the hazard of developing AD. Regarding APOE4 status, APOE4 carrier with only one ɛ4 allele does not show a significant impact on the risk of developing AD. However, two ɛ4 alleles have a substantial contribution to dementia risk compared with APOE4 non-carrier, as shown at the bottom of Table 4. The likelihood ratio test is implemented to compare the full model including the above six regions and control variables (age, sex, APOE4) and the null model that only includes control variables. The full model is significantly better than the null model (p < 0.001) in prediction.
Table 4
Survival analysis of the six brain regions involved in mediated A⟶N⟶MEM pathways
| Coefficient | Hazard Ratio | 95% CI | p | ||
| Left_Inferior temporal gyrus | 0.785 | 2.193 | 1.156 | 4.156 | 0.016 |
| Right_Pallidum | –0.676 | 0.509 | 0.314 | 0.825 | 0.006 |
| Right_Angular gyrus | 0.133 | 1.143 | 0.664 | 1.967 | 0.631 |
| Right_Subparietal sulcus | –0.609 | 0.544 | 0.157 | 1.881 | 0.336 |
| Left_dPCC | –0.028 | 0.972 | 0.348 | 2.721 | 0.958 |
| Left_Hippocampus | –0.659 | 0.518 | 0.107 | 2.503 | 0.413 |
| Age | 0.002 | 1.002 | 0.986 | 1.018 | 0.802 |
| Male versus Female | 0.025 | 1.024 | 0.838 | 1.253 | 0.812 |
| One APOE ɛ4 allelev | 0.151 | 1.164 | 0.922 | 1.468 | 0.201 |
| Two APOE ɛ4 alleles | 0.473 | 1.604 | 1.118 | 2.302 | 0.01 |
dPCC, posterior-dorsal part of cingulate gyrus.
Effect of AT[N] pathways on the decline of executive function
Variable selection
The variable selection results with respect to EF score are shown in Fig. 5, where we list the selected region names for amyloid and FDT-PET in the left and right panels of Table 5. There are 14 brain regions showing the association between amyloid burden and EF score. Similarly, there are 24 brain regions showing the association between metabolism level (measured by FDG-PET) and EF score. Again, we have not found any brain regions showing association in the tau∼EF relationship, due to the small sample size. In the following, we apply mediation analysis of SEM 1 to 14 × 24 = 336 A⟶N⟶EF pathways.
Fig. 5
Selected brain regions from amyloid-PET (left) and FDG-PET (right) images with respect to EF score.
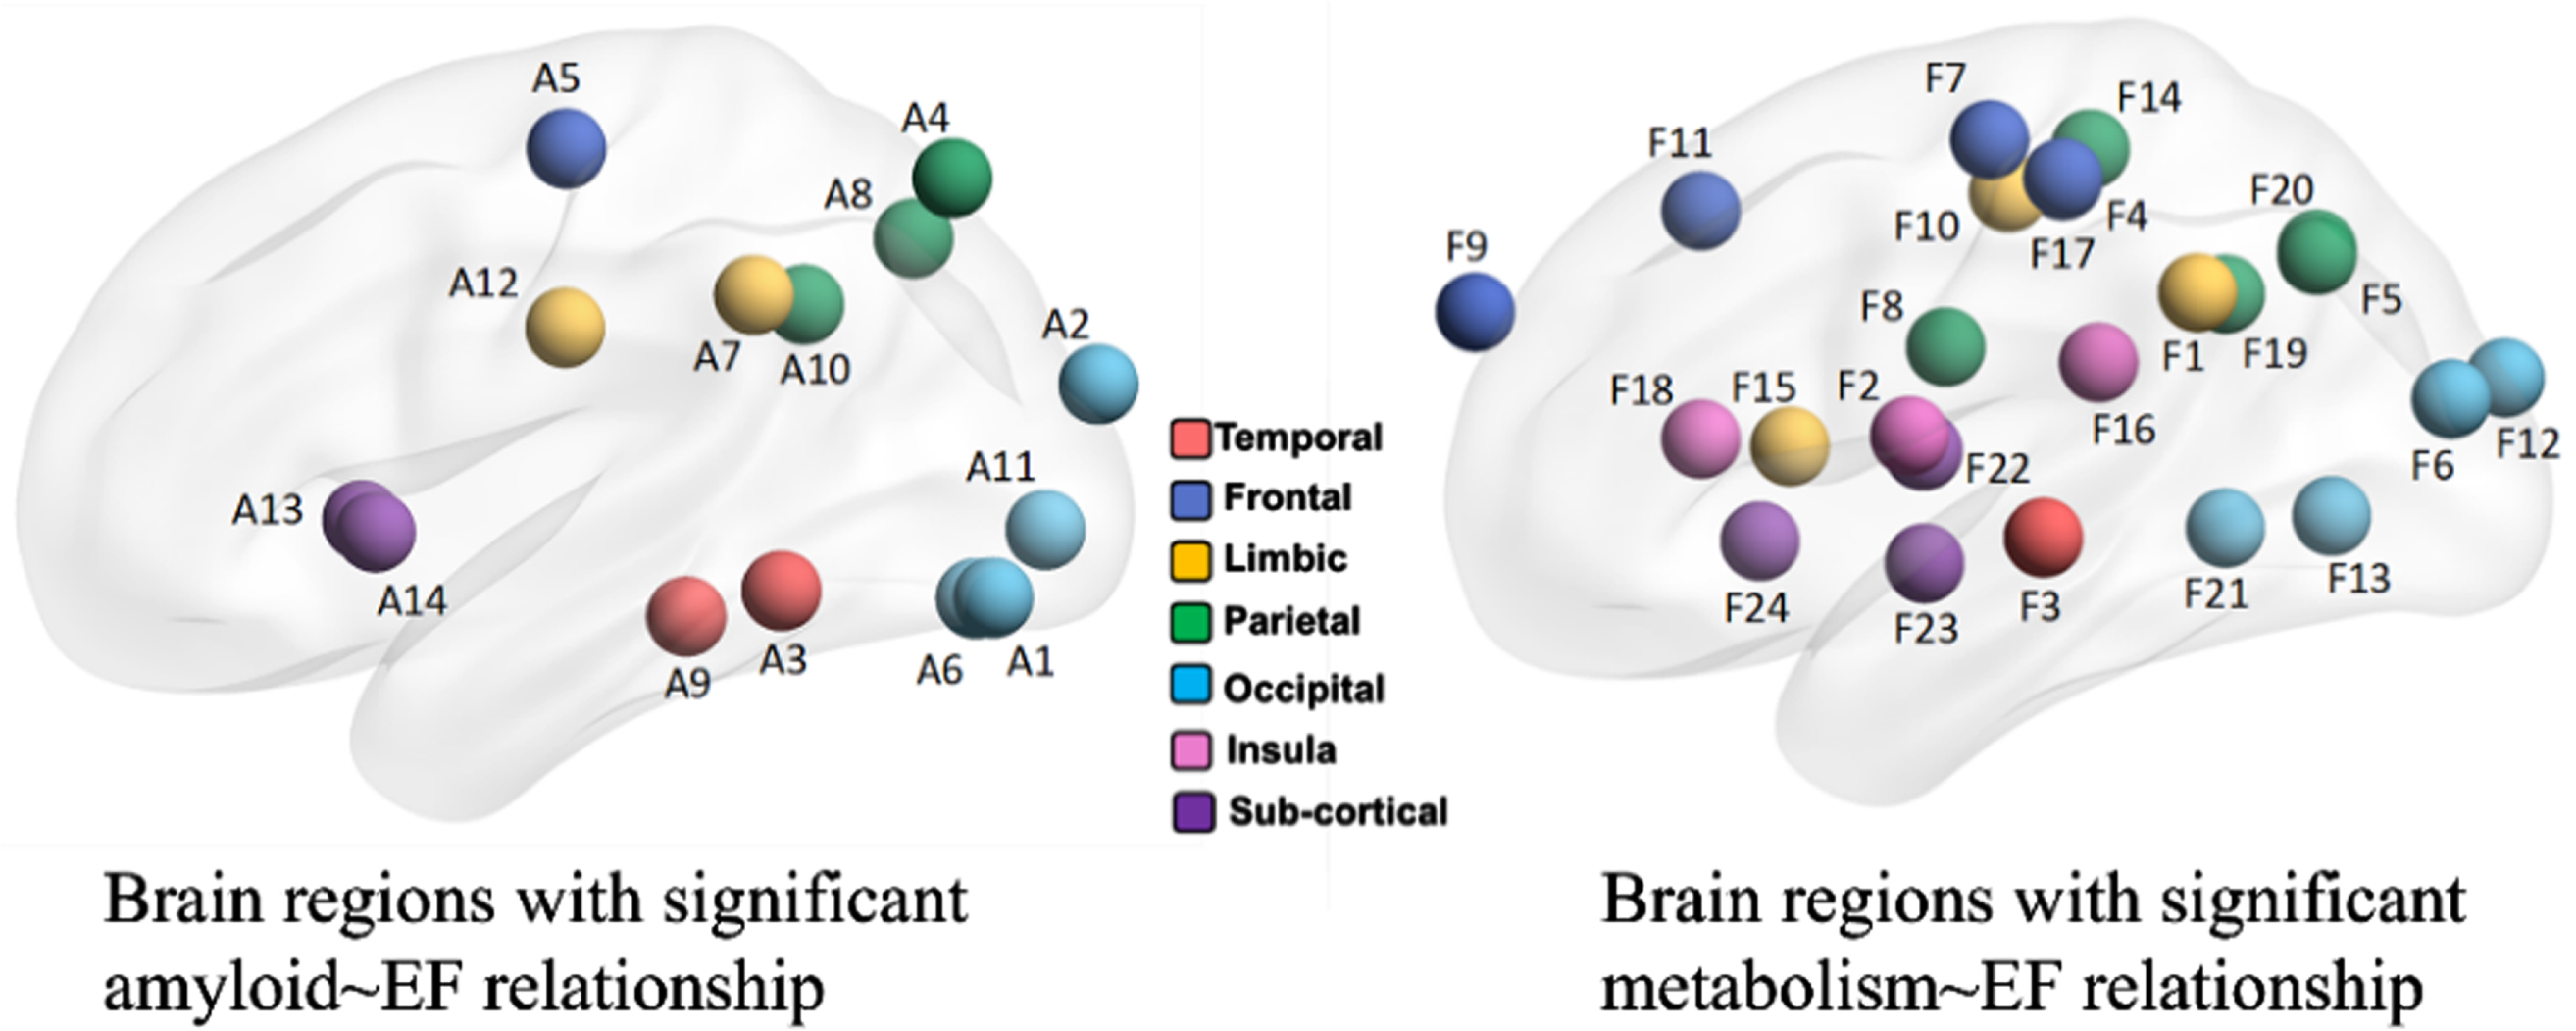
Table 5
Selected brain regions with significant amyloid∼EF relationship (left) and significant metabolism∼EF relationship (right)
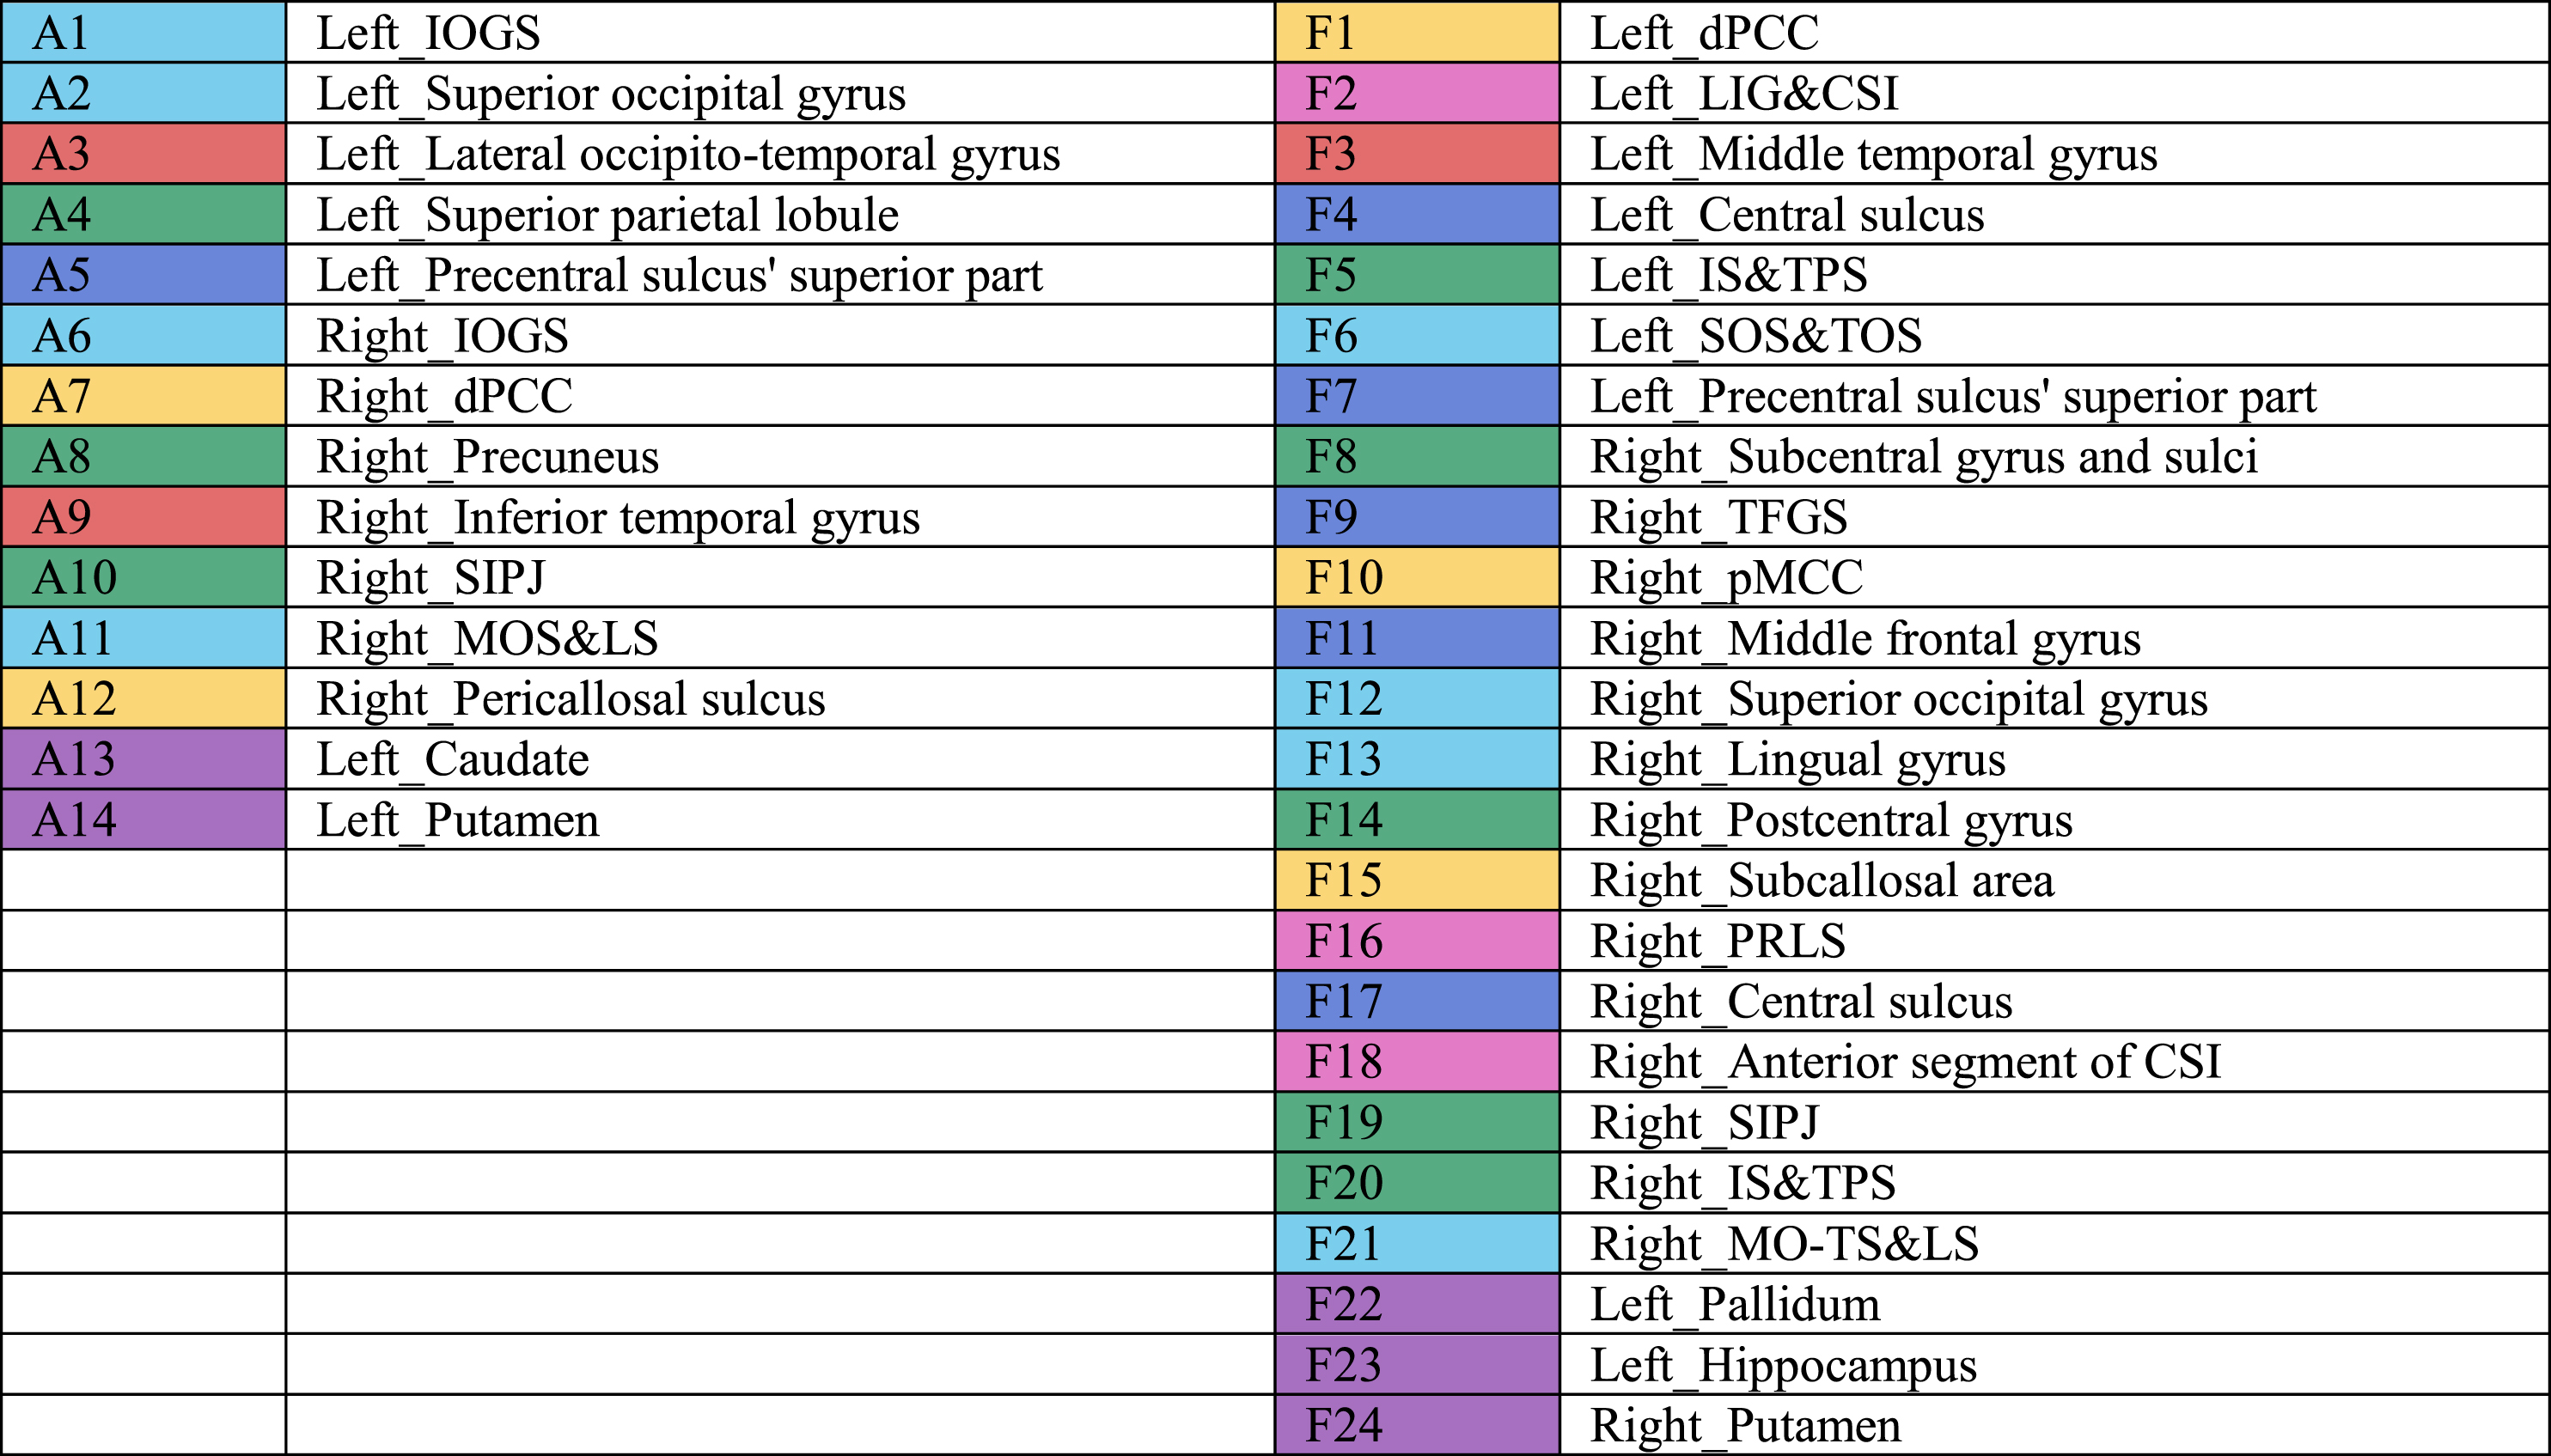 |
IOGS, inferior occipital gyrus and sulcus; dPCC, posterior-dorsal part of cingulate gyrus; SIPJ, sulcus intermedius primus of Jensenl MOS&LS, middle occipital sulcus and lunatus sulcus; LIG&CSI, long insular gyrus and central sulcus of the insula; IS&TPS, intraparietal sulcus and transverse parietal sulci; SOS&TOS, superior occipital sulcus and transverse occipital sulcus; TFGS, transverse frontopolar gyri and sulci; pMCC, middle-posterior part of the cingulate gyrus and sulcus; PRLS, posterior ramus of the lateral sulcus; CSI, circular sulcus of the insula; MO-TS&LS, medial occipito-temporal sulcus and lingual sulcus.
A-[N]-EF mechanistic pathway analysis
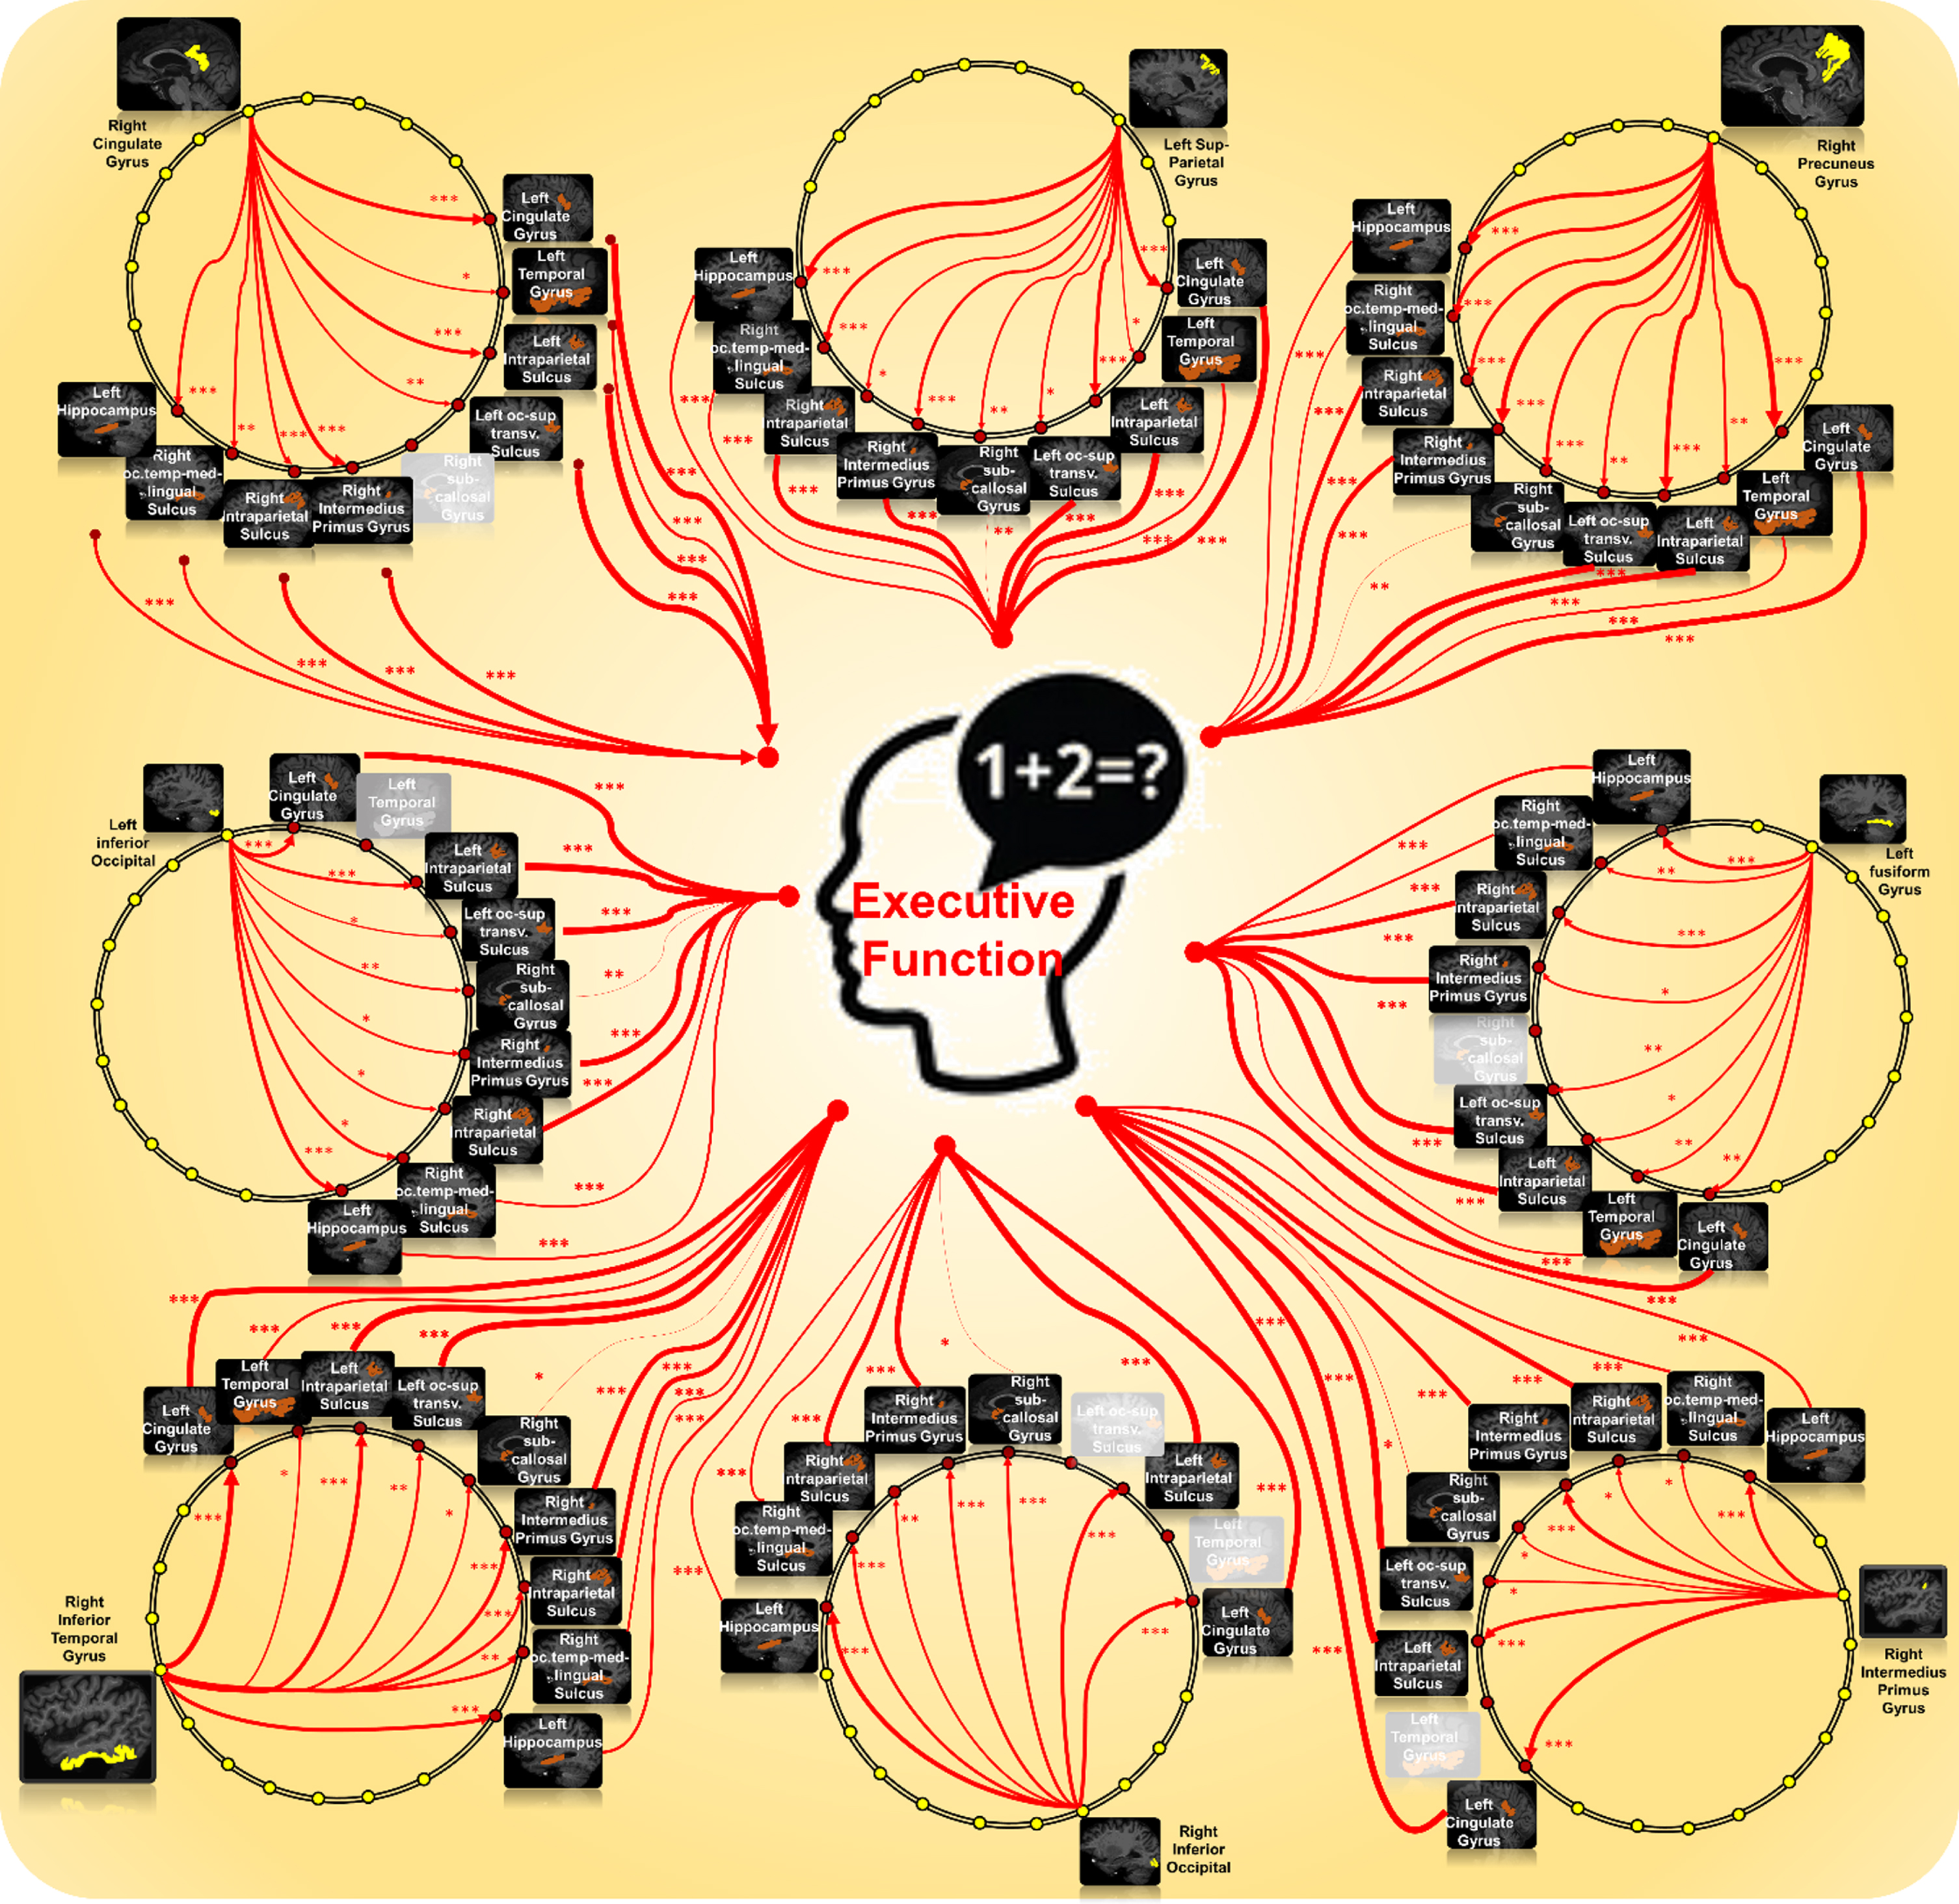
We summarize the mediation analysis result in Tables 6 and 7. First, 64% region-to-region pathways (highlighted in red in Table 6) manifest a direct effect of amyloid accumulation on the decrease of EF composite score at the significance level p = 0.05. Second, we have found 69 (20.5%) region-to-region pathways show mediated effects on memory decline, that is, the concentration of amyloid deposition affects executive function performance through the other brain region that shows changes of metabolism level. In Table 7, we show the overall indirect effect sizes (1st column) and the effect sizes on A⟶N link (2nd column) and N⟶EF link (3rd column), where we use color to indicate the effect sizes. The effect sizes marked in blue are negative effects, while red ones are positive effects. The darker the color is, the stronger the effect. Since eight brain regions with amyloid are involved in the 69 mediated pathways, we display the mediated pathways in Fig. 6, where the yellow dot represents each of these eight brain regions and red dots represent the mediated brain regions with significant metabolism∼EF relationship. We use ‘*’, ‘**’, and ‘***’ to denote the FDR-controlled p < 0.05, p < 0.001, and p < 0.0001 on A⟶N and N⟶EF links.
Table 6
Mediation analysis of A⟶N⟶EF. The selected region names for amyloid and FDT-PET correspond to the variable selection results in Fig. 5 and are listed in Table 5
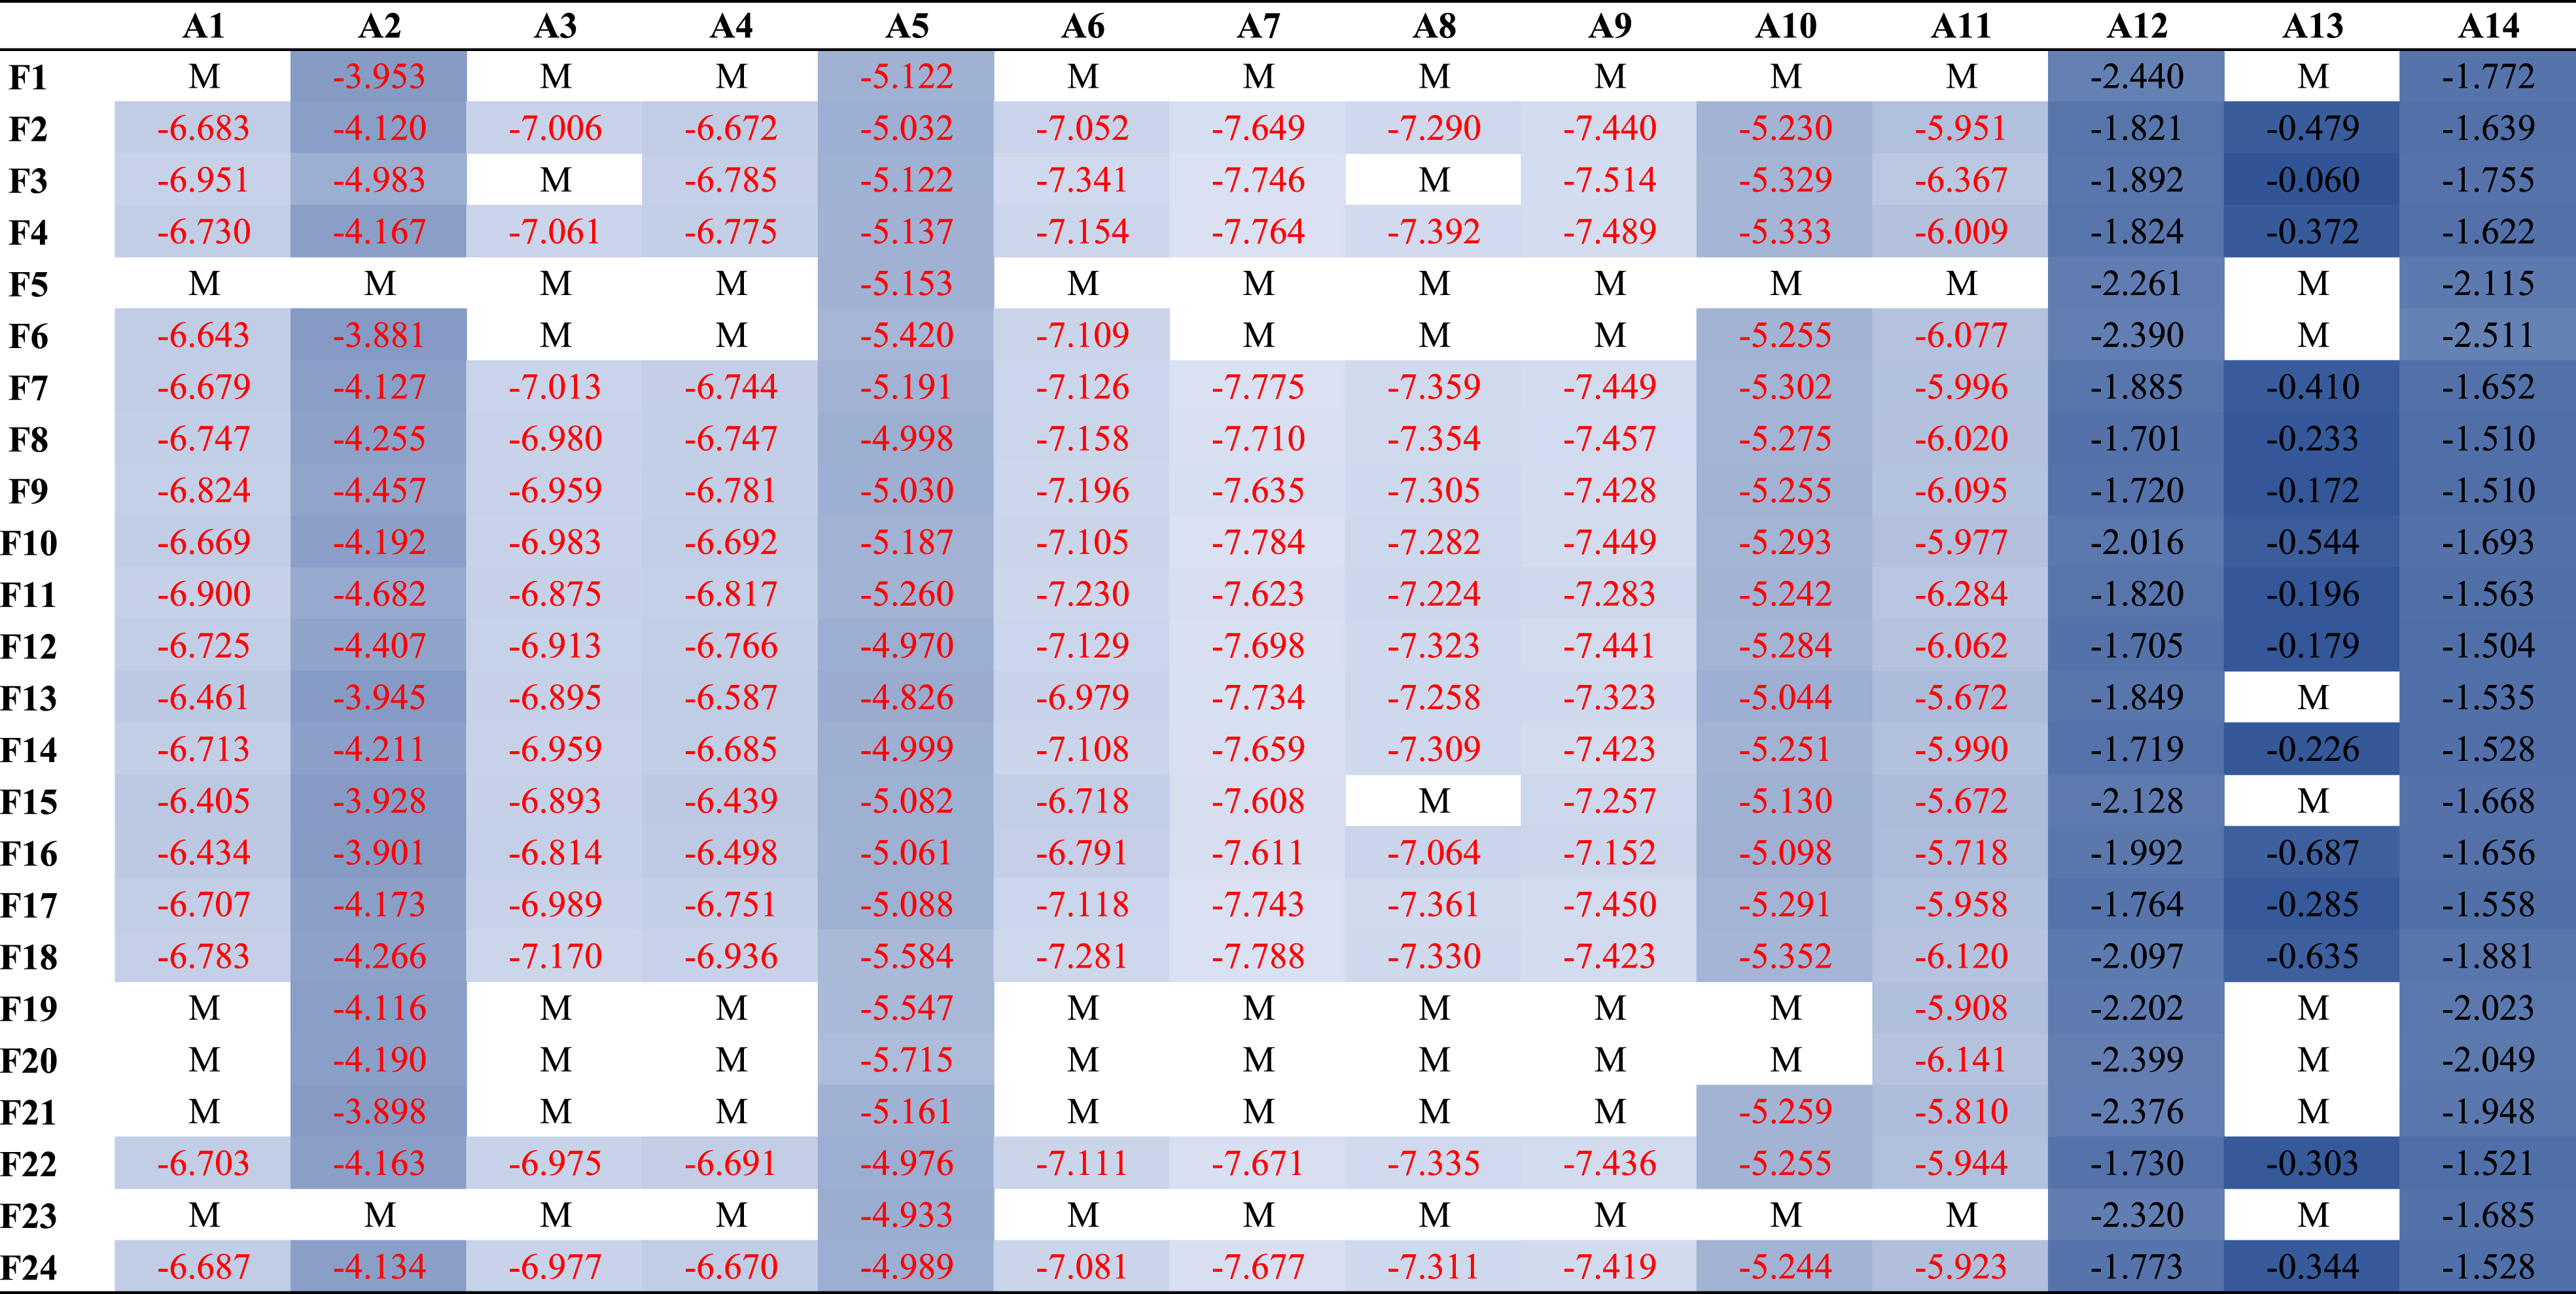 |
“M” stands for the mediation effect of amyloid burden (row) on EF decline is mediated by reduced metabolism level (column). Otherwise, we display the direct effect size of the amyloid burden on EF decline, where the significant direct effect (p < 0.05) is marked in red.
Table 7
The effect sizes for 69 region-to-region A⟶N⟶EF pathways showing a mediation effect
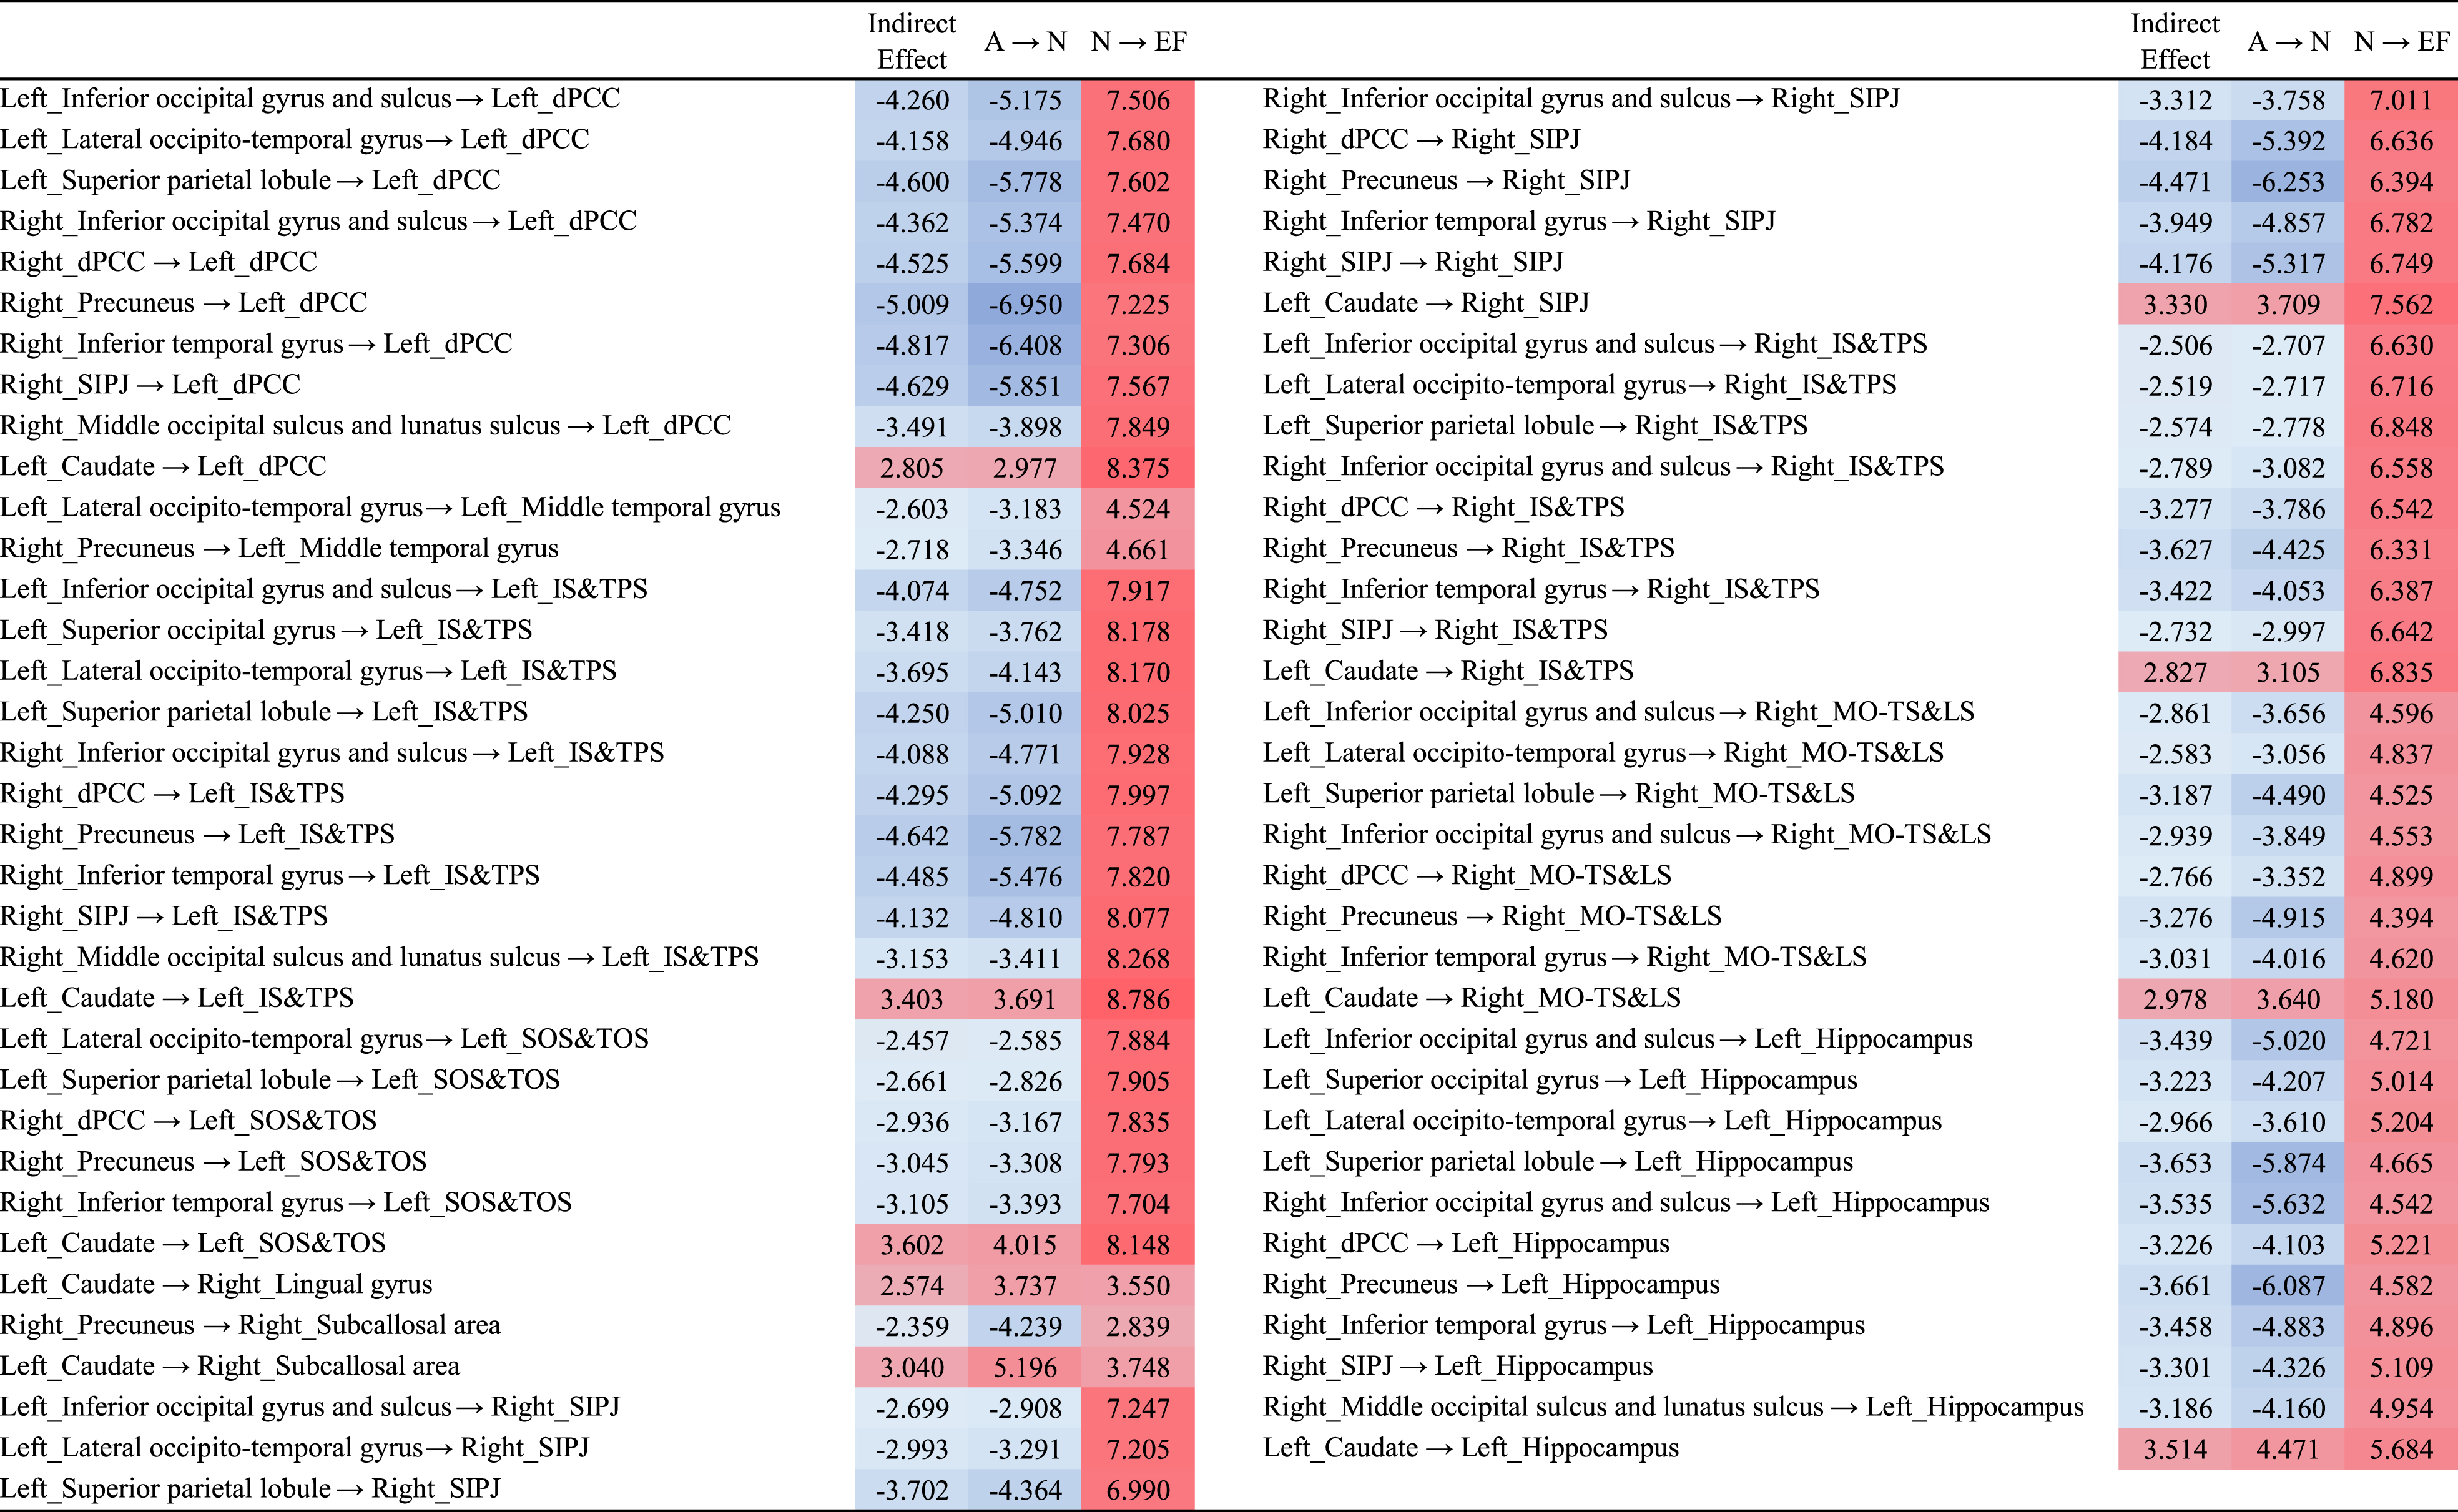 |
dPCC, posterior-dorsal part of cingulate gyrus; SIPJ, sulcus intermedius primus of Jensen; IS&TPS, intraparietal sulcus and transverse parietal sulci; SOS&TOS, superior occipital sulcus and transverse occipital sulcus; MO-TS&LS, medial occipito-temporal sulcus and lingual sulcus.
Fig. 6
Graphic presentation of all 69 mediated A⟶N⟶EF region-to-region pathways.
Survival analysis
The survival analysis results on these nineteen brain regions are summarized in Table 8. Specifically, only the amyloid depositions at the left superior occipital sulcus have a significant impact on the risk of developing AD, where the hazard of dementia risk for a patient with one additional unit of metabolism level increment on the left superior occipital sulcus is multiplicatively decreased by 0.34 times. Age and male/female differences are not significant on the hazard of developing AD. Regarding APOE4 status, APOE4 carrier with only one ɛ4 allele does not show a significant impact on the risk of developing AD. However, two ɛ4 alleles have a substantial contribution to the decline of executive function compared with APOE4 non-carrier, as shown at the bottom of Table 8. The likelihood ratio test is implemented by comparing the full model including nineteen regions and control variables (age, sex, APOE4) with the null model including only control variables. The full model is significantly better than the null model (p < 0.01) in prediction, which justifies the necessity of including the brain regions in the survival model.
Table 8
Survival analysis of the nineteen brain regions involved in mediated A⟶N⟶EF pathways
| Coefficient | Hazard Ratio | 95% CI | p | ||
| Left_Inferior occipital gyrus and sulcus | 0.072 | 1.075 | 0.374 | 3.085 | 0.893 |
| Left_Superior occipital gyrus | –0.417 | 0.659 | 0.311 | 1.394 | 0.275 |
| Left_Lateral occipito-temporal gyrus | 0.656 | 1.927 | 0.763 | 4.866 | 0.165 |
| Left_Superior parietal lobule | 0.273 | 1.313 | 0.588 | 2.932 | 0.505 |
| Right_Inferior occipital gyrus and sulcus | 0.053 | 1.055 | 0.417 | 2.661 | 0.910 |
| Right_dPCC | 0.236 | 1.265 | 0.539 | 2.968 | 0.587 |
| Right_Precuneus | 0.407 | 1.503 | 0.606 | 3.725 | 0.379 |
| Right_Inferior temporal gyrus | 0.211 | 1.234 | 0.473 | 3.222 | 0.666 |
| Right_Sulcus intermedius primus of Jensen | –0.51 | 0.6 | 0.325 | 1.107 | 0.102 |
| Right_MOS&LS | –0.742 | 0.476 | 0.2011 | 1.127 | 0.092 |
| Left_Caudate | 0.233 | 1.262 | 0.704 | 2.264 | 0.434 |
| Left_dPCC | –0.171 | 0.842 | 0.279 | 2.539 | 0.761 |
| Left_Middle temporal gyrus | 0.109 | 1.115 | 0.382 | 3.247 | 0.841 |
| Left_IS&TPS | 0.225 | 1.252 | 0.321 | 4.873 | 0.745 |
| Left_SOS&TOS | –1.066 | 0.345 | 0.121 | 0.983 | 0.046 |
| Right_Sulcus intermedius primus of Jensen | –0.218 | 0.804 | 0.287 | 2.247 | 0.677 |
| Right_IS&TPS | 0.335 | 1.398 | 0.440 | 4.436 | 0.569 |
| Right_MO-TS&LS | –0.186 | 0.83 | 0.197 | 3.482 | 0.799 |
| Left_Hippocampus | –0.94 | 0.391 | 0.059 | 2.592 | 0.33 |
| Age | 0.002 | 1.002 | 0.986 | 1.0186 | 0.781 |
| Male versus Female | –0.001 | 0.999 | 0.8127 | 1.227 | 0.989 |
| One APOE ɛ4 allele | 0.189 | 1.207 | 0.954 | 1.527 | 0.116 |
| Two APOE ɛ4 alleles | 0.559 | 1.749 | 1.221 | 2.508 | 0.002 |
dPCC, posterior-dorsal part of cingulate gyrus; MOS&LS, middle occipital sulcus and lunatus sulcus; IS&TPS, intraparietal sulcus and transverse parietal sulci; SOS&TOS, superior occipital sulcus and transverse occipital sulcus; MO-TS&LS, medial occipito-temporal sulcus and lingual sulcus.
DISCUSSION
Although the root cause of AD is largely elusive, the amyloid hypothesis has been widely used in the AD research framework, where amyloidosis induces or facilitates the spread of pathologic tau followed by immediate neurodegeneration and progressive cognitive decline. As the massive heterogeneities manifested in the clinical symptoms, it is critical to understand the pathophysiological mechanism of how whole-brain AT[N] biomarkers exert a synergistic effect on cognitive decline in the long period of disease progression. To answer this important scientific question, we present a novel multi-variate statistical inference approach to uncover the causal-like effect of AT[N] biomarkers on cognitive decline as well as the underlying non-modifiable risk factors through high-dimensional neuroimaging phenotypes. Here, we specifically discuss the mechanistic roles of identified brain regions and risk factors in the A⟶N⟶MEM and A⟶N⟶EF pathways.
Mechanistic roles of identified brain regions
We found a majority of identified critical brain regions exhibit a direct effect on cognitive decline. The identified brain regions on which the amyloid burdens exert an indirect effect on cognitive decline are oftentimes mediated by the reduction of metabolism levels at other brain regions. We conduct the same statistical analysis to the memory and executive function score separately. The absence of region overlap between memory-specific and EF-specific pathways that manifest the indirect effect on cognitive decline indicates that the pathophysiological pathways associated with memory and EF domain might have distinct spatial patterns. We have not identified any T⟶N and A⟶T mechanistic pathways that manifest an indirect effect on any clinical domain.
Role of non-modifiable risk factors in diverse mechanistic pathways
As frequently reported in the literature, we found APOE4 status plays a role not only in the indirect effect but also in the direct effect of amyloid burden on cognitive decline. The sex difference has not been detected in all mediation analyses. We have not discovered the contribution of lifestyle factors (such as education level) is significant in the identified A⟶N⟶MEM and A⟶N⟶EF pathways.
Survival analysis for cognitive decline on the mechanistic pathways
We found that having two APOE ɛ4 alleles significantly increases the risk of developing AD in our survival model, where the hazard ratio is 1.60 regarding memory problems and 1.75 for the decline of executive functions, both at the significant level of p < 0.05.
In our main result, we only use FDG-PET as the neurodegeneration biomarker. Since cortical thickness from structure MRI is also widely used as a [N] biomarker in many studies, it is worthwhile to investigate the A⟶N⟶MEM and A⟶N⟶EF pathways between regional amyloid burden and cortical thickness. Using the same data analysis workflow, we first apply our multi-variate feature selection method to screen critical brain regions. Figure 7 displays the most significant brain regions that manifest significance in the amyloid∼MEM relationship (top-left), cortical thickness∼MEM relationship (top-right), amyloid∼EF relationship (bottom∼left), and cortical thickness∼EF relationship (bottom right).
Fig. 7
Brain regions survival after the variable selection method in the context of amyloid∼MEM relationship (top-left), cortical thickness∼MEM relationship (top-right), amyloid∼EF relationship (bottom∼left), and cortical thickness∼EF relationship (bottom right). The color indicates the anatomical lobe parcellation.
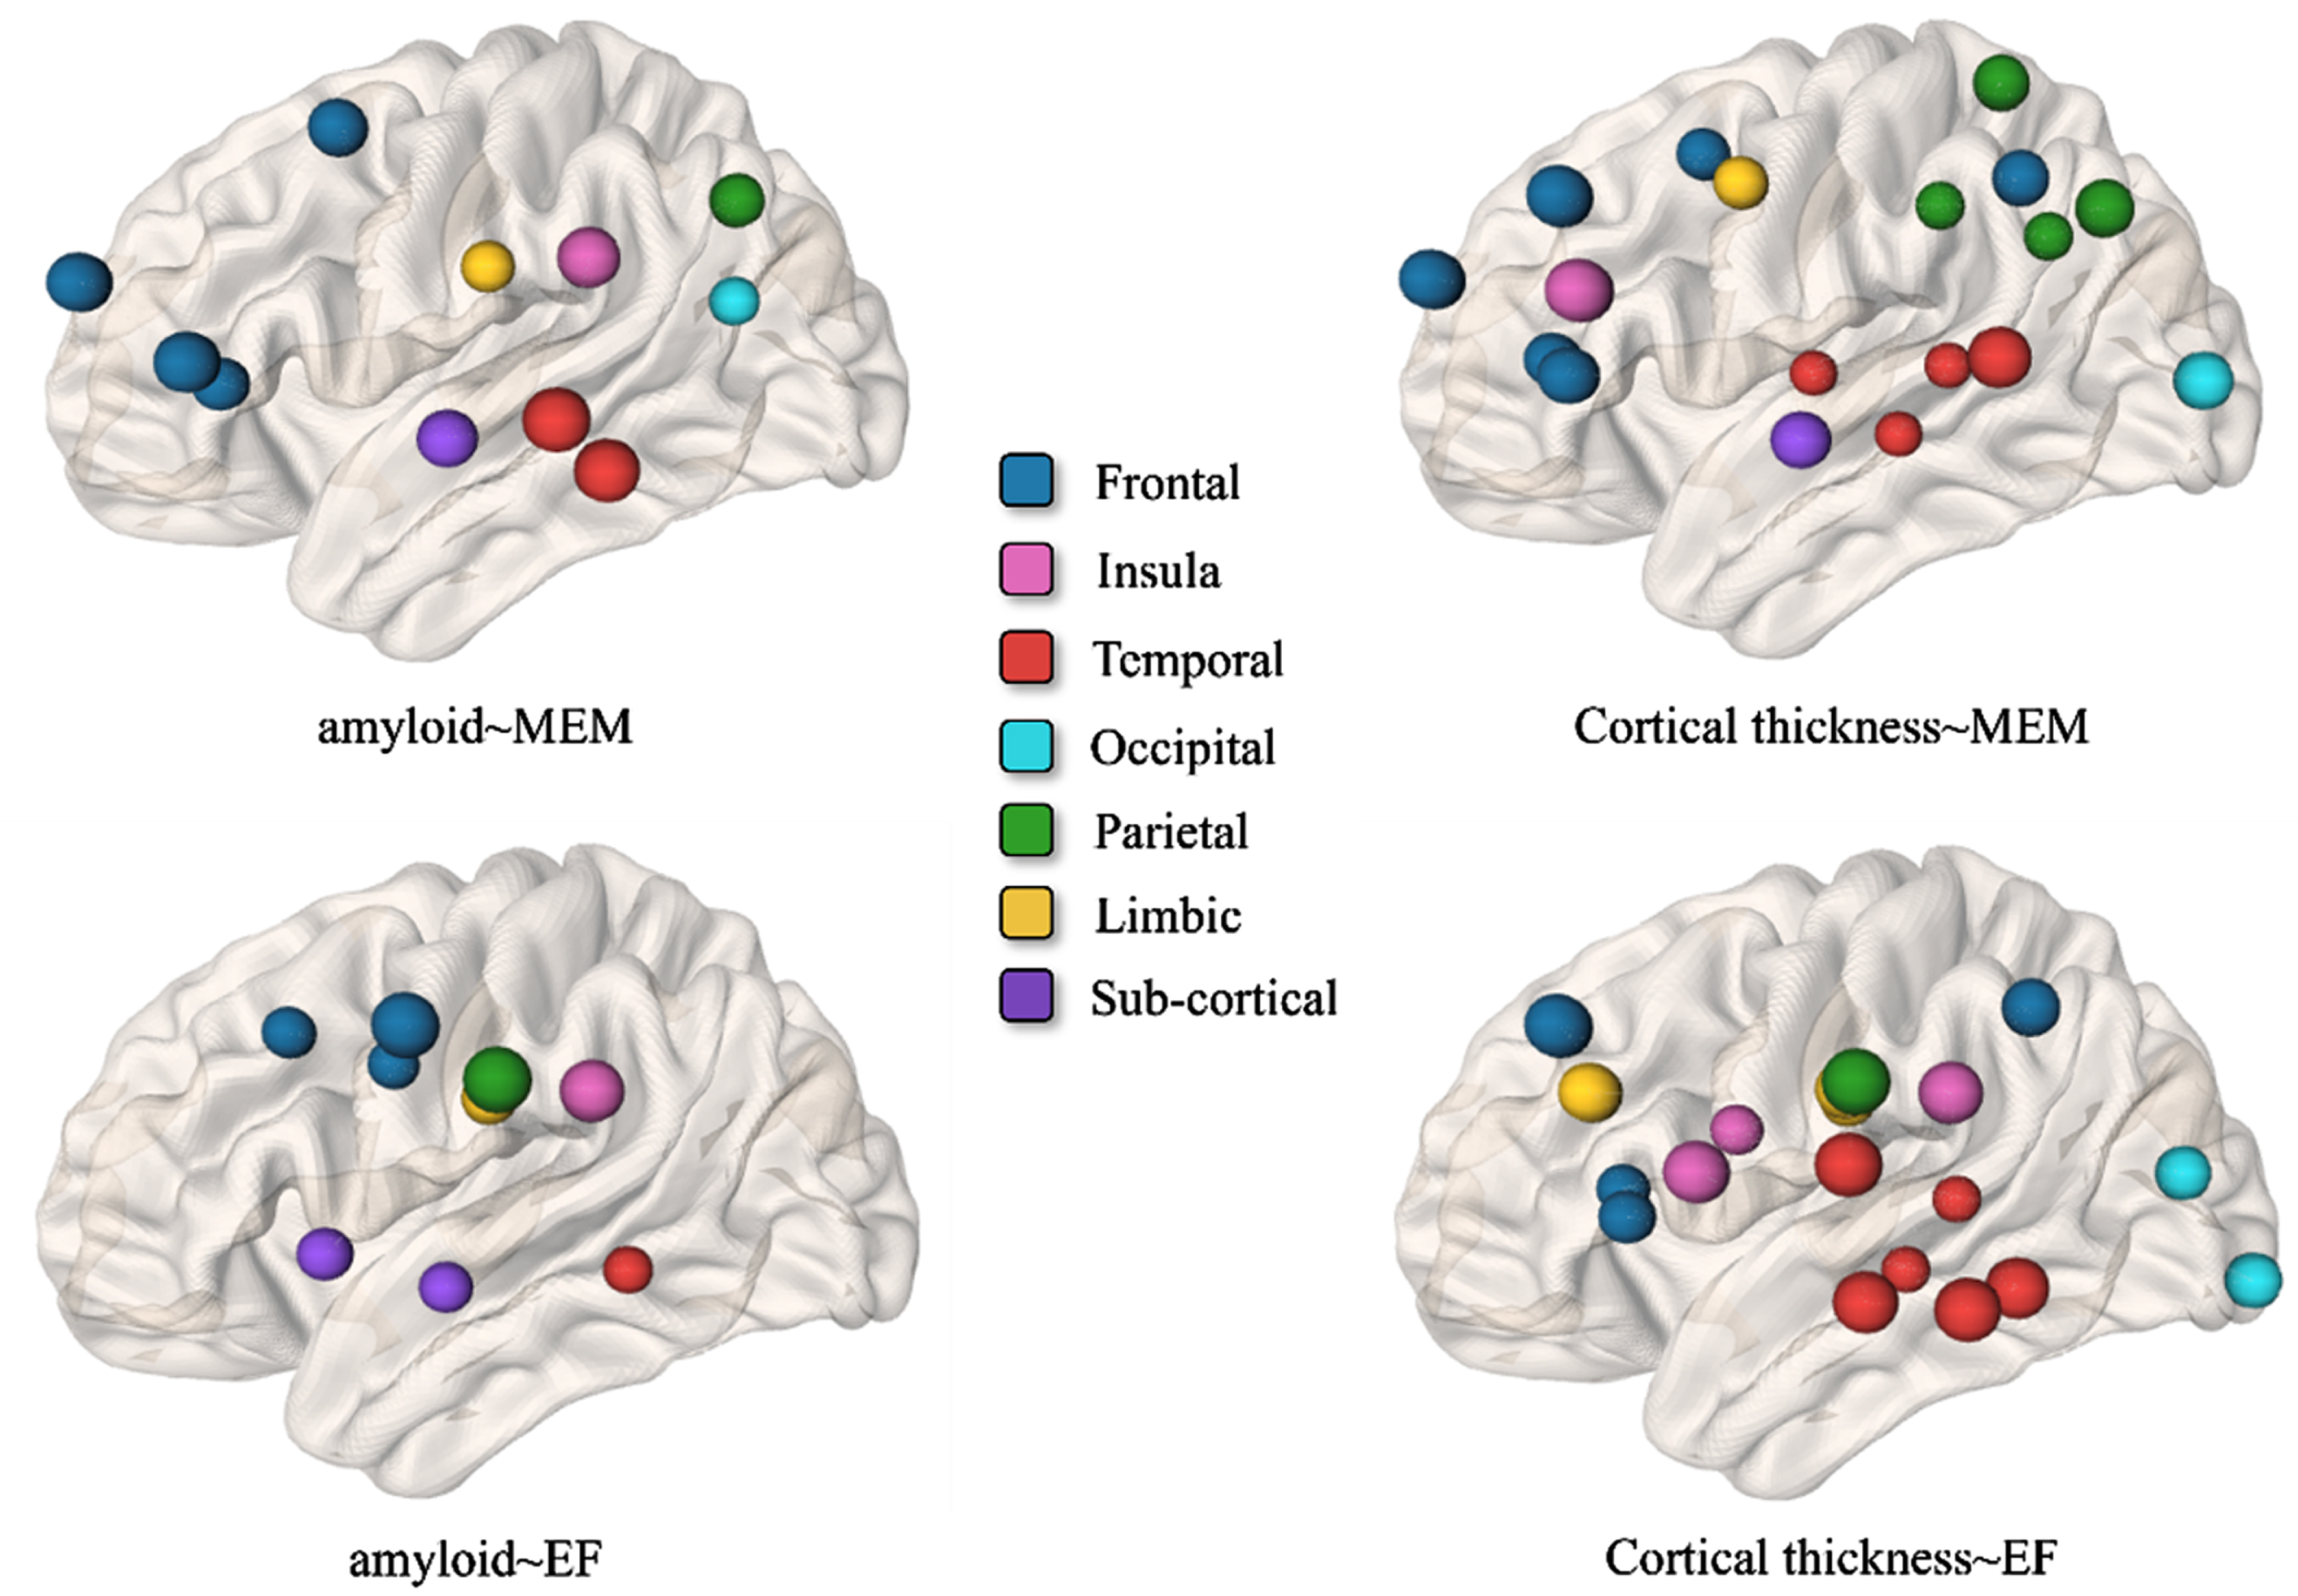
Next, we examine whether the effect of amyloid cascade on memory score is mediated by the reduced cortical thickness. Although most brain regions in Fig. 7 top-left exert a direct effect on the declined memory performance, we have identified eight mediated pathways at the significance level of 0.05, where the total indirect effect sizes, effect sizes on A⟶N pathway, and effect size on N⟶MEM are summarized in Table 9. Regarding the mediation analysis of region-to-region A⟶N⟶EF, all the brain regions manifest a direct effect on the decline of executive function performance. Comparing the mediation analysis between using the metabolism level and cortical thickness, it is apparent that the causal-like relationship between amyloid cascade and reduced metabolism level is stronger than that between amyloid and reduced cortical thickness.
Table 9
The effect sizes for eight region-to-region A⟶N⟶MEM pathways showing a mediation effect
| Indirect | A ⟶ N | N ⟶ MEM | |
| G_temporal_inf ⟶ S_temporal_sup | –3.032 | –3.981 | 4.681 |
| G_and_S_transv_frontopol ⟶ sub_lh_hippo | –3.615 | –4.428 | 6.261 |
| G_orbital ⟶ sub_lh_hippo | –3.226 | –3.687 | 6.664 |
| G_precuneus ⟶ sub_lh_hippo | –3.158 | –3.611 | 6.511 |
| G_temporal_inf ⟶ sub_lh_hippo | –3.092 | –3.493 | 6.646 |
| G_temporal_middle ⟶ sub_lh_hippo | –3.049 | –3.432 | 6.639 |
| G_rectus ⟶ sub_lh_hippo | –3.790 | –4.773 | 6.237 |
| sub_lh_hippo ⟶ sub_lh_hippo | 3.988 | 5.329 | 6.014 |
Our work has several clinical benefits. First, the region-to-region mechanistic pathway between AT[N] biomarkers allows us to advance our understanding of the etiology for AD. One possible application is to stratify the heterogeneity of decline trajectories and discover latent subtypes associated with characteristic pathophysiological pathways. Second, the elucidated role of risk factors in the survival analysis provides useful information in developing personalized intervention plans for AD and AD-related dementias.
Related works
Understanding the causal relationship between AD biomarkers is an important topic in the AD field. Mediation analysis has been widely used to investigate whether these biomarkers act as mediators, linking the pathogenic processes involved in AD [36–39]. For example, mediation analysis has been used in investigating whether age-related changes in cognition are partially mediated by the presence of neuropathology and neurodegeneration (measured by CSF biomarker of Aβ and tau) [37]. Their study found age effects on cognitive decline are fully mediated by disease and neurodegeneration variables. However, the age effect on baseline cognition manifests differences between memory and executive function domains. In this regard, we stratify our mediation studies on regional imaging biomarkers for memory and EF domains. In our result, we found the A⟶[N]⟶MEM and A⟶[N]⟶EF exhibit different spatial patterns region-to-region mediation pathways, which supports previous studies that the relationship between AD biomarkers and cognitive decline is domain-specific.
Our hypothesis of the causal relationship between AT[N] biomarkers is rooted in the biological synergy between Aβ and tau in AD [38] and the NIA-AA research framework [16]. Furthermore, our work is inspired by the pioneering work on staging of Aβ, tau, regional atrophy rates, and cognitive change [40]. In their study, researchers discovered a direct correlation between amyloid accumulation, as measured by CSF biomarkers, and regional atrophy rates as well as memory loss in the cognitively normal group. Interestingly, this correlation was found to occur without any mediating factors. During the early stage of MCI, the presence of Aβ was observed to impact memory through the atrophy of the hippocampus. Subsequently, Aβ continued to affect memory, with the specific mediation of medial temporal atrophy, and without the involvement of intermediate tau. Our results (A⟶[N]⟶MEM medication pathways) align closely with these findings. As shown in Table 9, we have discovered that the amyloid burden at orbital gyrus, precuneus gyrus, temporal gyrus, and rectus gyrus manifest indirect effect on memory performance via hippocampus. In addition, the effect of Aβ accumulation at inferior temporal gyrus on memory decline is mediated by the atrophy at superior temoral sulcus. Comparing our results with the findings in [40], our results provide a more fine-grained brain mapping of A⟶[N]⟶MEM medication pathways since our data analysis is performed on regional SUVR level.
By examining the mediating role of amyloid, tau, and neurodegeneration biomarkers, researchers can better understand the causal pathways and identify potential targets for intervention. However, current work mainly uses global measurements such as CSF biomarkers and whole-brain concentration levels from PET scans. In this work, we investigate the causal relationship at the granularity of brain region, which provides much richer spatial information to link brain function and network organization. To address the new challenge of higher data dimensionality, we applied a multi-variate statistical approach [33] to select the most relevant brain regions.
Our current analysis has several limitations. First, the requirement of having complete paired imaging biomarkers in the mediation analysis raises the issue of a small sample size. In light of this, we have not found the region-to-region pathway related to tau pathology. One possible solution is to include other public datasets, such as OASIS [41]. Second, a well-designed structural equation model is needed to take the gene-by-environment interactions into account, which sets the stage for understanding the diversity in cognitive decline and health disparities in the incidence and prevalence of AD.
ACKNOWLEDGMENTS
Data collection and sharing for this project was funded by the Alzheimer’s Disease Neuroimaging Initiative (ADNI) (National Institutes of Health Grant U01 AG024904) and DOD ADNI (Department of Defense award number W81XWH-12-2-0012). ADNI is funded by the National Institute on Aging, the National Institute of Biomedical Imaging and Bioengineering, and through generous contributions from the following: AbbVie, Alzheimer’s Association; Alzheimer’s Drug Discovery Foundation; Araclon Biotech; BioClinica, Inc.; Biogen; Bristol-Myers Squibb Company; CereSpir, Inc.; Cogstate; Eisai Inc.; Elan Pharmaceuticals, Inc.; Eli Lilly and Company; EuroImmun; F. Hoffmann-La Roche Ltd and its affiliated company Genentech, Inc.; Fujirebio; GE Healthcare; IXICO Ltd.; Janssen Alzheimer Immunotherapy Research & Development, LLC.; Johnson & Johnson Pharmaceutical Research & Development LLC.; Lumosity; Lundbeck; Merck & Co., Inc.; Meso Scale Diagnostics, LLC.; NeuroRx Research; Neurotrack Technologies; Novartis Pharmaceuticals Corporation; Pfizer Inc.; Piramal Imaging; Servier; Takeda Pharmaceutical Company; and Transition Therapeutics. The Canadian Institutes of Health Research is providing funds to support ADNI clinical sites in Canada. Private sector contributions are facilitated by the Foundation for the National Institutes of Health (http://www.fnih.org). The grantee organization is the Northern California Institute for Research and Education, and the study is coordinated by the Alzheimer’s Therapeutic Research Institute at the University of Southern California. ADNI data are disseminated by the Laboratory for Neuro Imaging at the University of Southern California.
FUNDING
This work was supported by the National Institutes of Health AG073259, AG049089, AG059065, AG073927, AG068399, and Foundation of Hope.
CONFLICT OF INTEREST
The authors have no conflict of interest to report.
DATA AVAILABILITY
This work is mainly a secondary data analysis on ADNI data, where all the imaging data and phenotyping data are available at https://adni.loni.usc.edu/
REFERENCES
[1] | Filley C ((1995) ) Alzheimer’s disease: It’s irreversible but not untreatable. Geriatrics 50: , 18–23. |
[2] | Vemuri P , Gunter JL , Senjem ML , Whitwell JL , Kantarci K , Knopman DS , Boeve BF , Petersen RC , Jack CR Jr ((2008) ) Alzheimer’s disease diagnosis in individual subjects using structural MR images: Validation studies. Neuroimage 39: , 1186–1197. |
[3] | Aisen PS , Petersen RC , Donohue MC , Gamst A , Raman R , Thomas RG , Walter S , Trojanowski JQ , Shaw LM , Beckett LA , Jack CR , Jagust W , Toga AW , Saykin AJ , Morris JC , Green RC , Weiner MW ((2010) ) Clinical core of the Alzheimer’s Disease Neuroimaging Initiative: Progress and plans. Alzheimers Dement 6: , 239–246. |
[4] | Dickerson BC , Sperling RA , Hyman BT , Albert MS , Blacker D ((2007) ) Clinical prediction of Alzheimer disease dementia across the spectrum of mild cognitive impairment. Arch Gen Psychiatry 64: , 1443–1450. |
[5] | Grimmer T , Henriksen G , Wester HJ , Forstl H , Klunk WE , Mathis CA , Kurz A , Drzezga A ((2009) ) Clinical severity of Alzheimer’s disease is associated with PIB uptake in PET. Neurobiol Aging 30: , 1902–1909. |
[6] | Braak H , Braak E ((1991) ) Neuropathological stageing of Alzheimer-related changes. Acta Neuropathol 82: , 239–259. |
[7] | Viola KL , Sbarboro J , Sureka R , De M , Bicca MA , Wang J , Vasavada S , Satpathy S , Wu S , Joshi H , Velasco PT , MacRenaris K , Waters EA , Lu C , Phan J , Lacor P , Prasad P , Dravid VP , Klein WL ((2015) ) Towards non-invasive diagnostic imaging of early-stage Alzheimer’s disease. Nat Nanotechnol 10: , 91–98. |
[8] | Thompson PM , Hayashi KM , Dutton RA , Chiang MC , Leow AD , Sowell ER , De Zubicaray G , Becker JT , Lopez OL , Aizenstein HJ , Toga AW ((2007) ) Tracking Alzheimer’s disease. Ann N Y Acad Sci 1097: , 198–214. |
[9] | Chetelat Ga , Baron J-C ((2003) ) Early diagnosis of Alzheimer’s disease: Contribution of structural neuroimaging. Neuroimage 18: , 525–541. |
[10] | Chincarini A , Sensi F , Rei L , Gemme G , Squarcia S , Longo R , Brun F , Tangaro S , Bellotti R , Amoroso N , Bocchetta M , Redolfi A , Bosco P , Boccardi M , Frisoni GB , Nobili F ((2016) ) Integrating longitudinal information in hippocampal volume measurements for the early detection of Alzheimer’s disease. Neuroimage 125: , 834–847. |
[11] | Cummings JL , Doody R , Clark C ((2007) ) Disease-modifying therapies for Alzheimer disease: Challenges to early intervention. Neurology 69: , 1622–1634. |
[12] | Gauthier SG ((2005) ) Alzheimer’s disease: The benefits of early treatment. Eur J Neurol 12: , 11–16. |
[13] | Geldmacher D , Kirson N , Birnbaum H , Eapen S , Kantor E , Cummings A , Joish V ((2014) ) Implications of early treatment among Medicaid patients with Alzheimer’s disease. Alzheimers Dement 10: , 214–224. |
[14] | Nestor PJ , Schelterns P , Hodges JR ((2004) ) Advances in the early detection of Alzheimer’s disease. Nat Rev Neurosci 5: , S34–41. |
[15] | Weimer D , Sager M ((2009) ) Early identification and treatment of Alzheimer’s disease: Social and fiscal outcomes. Alzheimers Dement 5: , 215–226. |
[16] | Jack CR , Bennett DA , Blennow K , Carrillo MC , Dunn B , Haeberlein SB , Holtzman DM , Jagust W , Jessen F , Karlawish J , Liu E , Molinuevo JL , Montine T , Phelps C , Rankin KP , Rowe CC , Scheltens P , Siemers E , Snyder HM , Sperling R , Elliott C , Masliah E , Ryan L , Silverberg N ((2018) ) NIA-AA Research Framework: Toward a biological definition of Alzheimer’s disease. Alzheimers Dement 14: , 535–562. |
[17] | Jack CR , Knopman DS , Jagust WJ , Petersen RC , Weiner MW , Aisen PS , Shaw LM , Vemuri P , Wiste HJ , Weigand SD , Lesnick TG , Pankratz VS , Donohue MC , Trojanowski JQ ((2013) ) Tracking pathophysiological processes in Alzheimer’s disease: An updated hypothetical model of dynamic biomarkers. Lancet Neurol 12: , 207–216. |
[18] | Liu Q , Yang D , Zhang J , Wei Z , Wu G , Chen M ((2021) ) Analyzing the spatiotemporal interaction and propagation of ATN biomarkers in Alzheimer’s disease using longitudinal neuroimaging data. International Symposium on Biomedical Imaging, Nice, France. |
[19] | Nichols E , Szoeke CEI , Vollset SE , Abbasi N , Abd-Allah F , Abdela J , Aichour MTE , Akinyemi RO , Alahdab F , Asgedom SW , Awasthi A , Barker-Collo SL , Baune BT , Béjot Y , Belachew AB , Bennett DA , Biadgo B , Bijani A , Bin Sayeed MS , Brayne C , Carpenter DO , Carvalho F , Catalá-López F , Cerin E , Choi J-YJ , Dang AK , Degefa MG , Djalalinia S , Dubey M , Duken EE , Edvardsson D , Endres M , Eskandarieh S , Faro A , Farzadfar F , Fereshtehnejad S-M , Fernandes E , Filip I , Fischer F , Gebre AK , Geremew D , Ghasemi-Kasman M , Gnedovskaya EV , Gupta R , Hachinski V , Hagos TB , Hamidi S , Hankey GJ , Haro JM , Hay SI , Irvani SSN , Jha RP , Jonas JB , Kalani R , Karch A , Kasaeian A , Khader YS , Khalil IA , Khan EA , Khanna T , Khoja TAM , Khubchandani J , Kisa A , Kissimova-Skarbek K , Kivimäki M , Koyanagi A , Krohn KJ , Logroscino G , Lorkowski S , Majdan M , Malekzadeh R , März W , Massano J , Mengistu G , Meretoja A , Mohammadi M , Mohammadi-Khanaposhtani M , Mokdad AH , Mondello S , Moradi G , Nagel G , Naghavi M , Naik G , Nguyen LH , Nguyen TH , Nirayo YL , Nixon MR , Ofori-Asenso R , Ogbo FA , Olagunju AT , Owolabi MO , Panda-Jonas S , Passos VMdA , Pereira DM , Pinilla-Monsalve GD , Piradov MA , Pond CD , Poustchi H , Qorbani M , Radfar A , Reiner RC , Robinson SR , Roshandel G , Rostami A , Russ TC , Sachdev PS , Safari H , Safiri S , Sahathevan R , Salimi Y , Satpathy M , Sawhney M , Saylan M , Sepanlou SG , Shafieesabet A , Shaikh MA , Sahraian MA , Shigematsu M , Shiri R , Shiue I , Silva JP , Smith M , Sobhani S , Stein DJ , Tabarés-Seisdedos R , Tovani-Palone MR , Tran BX , Tran TT , Tsegay AT , Ullah I , Venketasubramanian N , Vlassov V , Wang Y-P , Weiss J , Westerman R , Wijeratne T , Wyper GMA , Yano Y , Yimer EM , Yonemoto N , Yousefifard M , Zaidi Z , Zare Z , Vos T , Feigin VL , Murray CJL ((2019) ) Global, regional, and national burden of Alzheimer’s disease and other dementias, 1990–2016: A systematic analysis for the Global Burden of Disease Study 2016. Lancet Neurol 18: , 88–106. |
[20] | Tan M-S , Ji X , Li J-Q , Xu W , Wang H-F , Tan C-C , Dong Q , Zuo C-T , Tan L , Suckling J , Yu J-T , Alzheimer’s Disease Neuroimaging Initatitive ((2020) ) Longitudinal trajectories of Alzheimer’s ATN biomarkers in elderly persons without dementia. Alzheimers Res Ther 12: , 55. |
[21] | Araújo DC , Veloso AA , Gomes KB , de Souza LC , Ziviani N , Caramelli P ((2022) ) A novel panel of plasma proteins predicts progression in prodromal Alzheimer’s disease. J Alzheimers Dis 88: , 549–561. |
[22] | Shigemizu D , Akiyama S , Higaki S , Sugimoto T , Sakurai T , Boroevich KA , Sharma A , Tsunoda T , Ochiya T , Niida S , Ozaki K ((2020) ) Prognosis prediction model for conversion from mild cognitive impairment to Alzheimer’s disease created by integrative analysis of multi-omics data. Alzheimers Res Ther 12: , 145. |
[23] | Varatharajah Y , Ramanan VK , Iyer R , Vemuri P , Weiner MW , Aisen P , Petersen R , Jack CR , Saykin AJ , Jagust W , et al. ((2019) ) Predicting short-term MCI-to-AD progression using imaging, CSF, genetic factors, cognitive resilience, and demographics. Sci Rep 9: , 2235. |
[24] | Goedert M ((2015) ) Neurodegeneration. Alzheimer’s and Parkinson’s diseases: The prion concept in relation to assembled Aβ, tau, and α-synuclein. Science 349: , 1255555. |
[25] | Adams HHH , Hibar DP , Chouraki V , Stein JL , Nyquist PA , Rentería ME , Trompet S , Arias-Vasquez A , Seshadri S , Desrivières S , et al. ((2016) ) Novel genetic loci underlying human intracranial volume identified through genome-wide association. Nat Neurosci 19: , 1569. |
[26] | Lambert J-C , Mann D , Richard F , Tian J , Shi J , Thaker U , Merrot S , Harris J , Frigard B , Iwatsubo T , Lendon C , Amouyel P ((2005) ) Is there a relation between APOE expression and brain amyloid load in Alzheimer’s disease? J Neurol Neurosurg Psychiatry 76: , 928–933. |
[27] | Gottschalk WK , Mihovilovic M , Roses AD , Chiba-Falek O ((2016) ) The role of upregulated APOE in Alzheimer’s disease etiology. J Alzheimers Dis Parkinsonism 6: , 209. |
[28] | Gamache J , Yun Y , Chiba-Falek O ((2020) ) Sex-dependent effect of APOE on Alzheimer’s disease and other age-related neurodegenerative disorders. Dis Model Mech 13: , dmm045211. |
[29] | Gibbons LE , Carle AC , Mackin RS , Harvey D , Mukherjee S , Insel P , Curtis SM , Mungas D , Crane PK ((2012) ) A composite score for executive functioning, validated in Alzheimer’s Disease Neuroimaging Initiative (ADNI) participants with baseline mild cognitive impairment. Brain Imaging Behav 6: , 517–527. |
[30] | Destrieux C , Fischl B , Dale A , Halgren E ((2010) ) Automatic parcellation of human cortical gyri and sulci using standard anatomical nomenclature. Neuroimage 53: , 1–15. |
[31] | Fischl B ((2012) ) FreeSurfer. Neuroimage 62: , 774–781. |
[32] | Breslow NE ((1975) ) Analysis of survival data under the proportional hazards model. Int Stat Rev 43: , 45–58. |
[33] | Li Q , Li L ((2022) ) Integrative factor regression and its inference for multimodal data analysis. J Am Stat Assoc 117: , 2207–2221. |
[34] | Bai J , Ng S ((2002) ) Determining the number of factors in approximate factor models. Econometrica 70: , 191–221. |
[35] | Fan J , Li R ((2001) ) Variable selection via nonconcave penalized likelihood and its oracle properties. J Am Stat Assoc 96: , 1348–1360. |
[36] | Mattsson N , Insel PS , Donohue M , Landau S , Jagust WJ , Shaw LM , Trojanowski JQ , Zetterberg H , Blennow K , Weiner MW ((2015) ) Independent information from cerebrospinal fluid amyloid-β and florbetapir imaging in Alzheimer’s disease. Brain 138: , 772–783. |
[37] | Hohman TJ , Tommet D , Marks S , Contreras J , Jones R , Mungas D ((2017) ) Evaluating Alzheimer’s disease biomarkers as mediators of age-related cognitive decline. Neurobiol Aging 58: , 120–128. |
[38] | Busche MA , Hyman BT ((2020) ) Synergy between amyloid-β and tau in Alzheimer’s disease. Nat Neurosci 23: , 1183–1193. |
[39] | Toledo JB , Xie SX , Trojanowski JQ , Shaw LM ((2013) ) Longitudinal change in CSF tau and Aβ biomarkers for up to 48 months in ADNI. Acta Neuropathol 126: , 659–670. |
[40] | Fletcher E , Filshtein TJ , Harvey D , Renaud A , Mungas D , DeCarli C ((2018) ) Staging of amyloid β, t-tau, regional atrophy rates, and cognitive change in a nondemented cohort: Results of serial mediation analyses. Alzheimers Dement (Amst) 10: , 382–393. |
[41] | LaMontagne PJ , Keefe S , Lauren W , Xiong C , Grant EA , Moulder KL , Morris JC , Benzinger TLS , Marcus DS ((2018) ) OASIS-3: Longitudinal neuroimaging, clinical, and cognitive dataset for normal againg and Alzheimer’s disease. Alzheimers Dement 14: , P1097. |


