
Skipping of FCER1G Exon 2 Is Common in Human Brain But Not Associated with the Alzheimer’s Disease Genetic Risk Factor rs2070902
Abstract
Background:
Understanding the mechanisms whereby genetic variants influence the risk of Alzheimer’s disease (AD) may provide insights into treatments that could reduce AD risk.
Objective:
Here, we sought to test the hypothesis that a single nucleotide polymorphism (SNP) associated with AD risk, rs2070902, influences splicing of FCER1G exon 2.
Methods:
AD and non-AD brain samples were analyzed for FCER1G expression by genotyping, immunohistochemistry, immunofluorescence, and qPCR.
Results:
The protein encoded by FCER1G, FcRγ, is robustly expressed in microglia in both AD and non-AD brain. The FCER1G isoform lacking exon 2 (D2-FCER1G) was readily detectable. Moreover, the proportion of FCER1G expressed as this isoform was increased in brains with high AD neuropathology. However, the proportion of FCER1G expressed as the D2-FCER1G isoform was not associated with rs2070902 genotype.
Conclusions:
In summary, the proportion of FCER1G expressed as the D2-FCER1G isoform is increased with AD neuropathology but is not associated with rs2070902.
INTRODUCTION
Genome-wide association studies have identified a set of polymorphisms that are associated with AD risk [1–6] by revealing single nucleotide polymorphisms (SNPs) with a statistically significant difference in allele frequency between AD and non-AD populations. Hence, these SNPs modulate AD risk but are not sufficient to cause AD. Among these SNPs is rs2070902 which is located within the gene FCER1G [2]. This SNP has a minor allele frequency of 25%, 37%, and 43% in Caucasians, Africans, and Asians, respectively. Within the Caucasian subjects involved with this study, the rs2070902 major allele homozygous CC individuals were 56% of the population, heterozygous CT individuals 36%, and homozygous TT individuals 6%. Whether rs2070902 acts through FCER1G or is a proxy for other SNPs in the region that act on neighboring genes, including ADAMTS4, is unclear [2].
The protein encoded by FCER1G, Fc receptor gamma chain (FcRγ) [7], is a signaling adaptor that pairs with multiple receptors, including FcɛRI, FcγRI, FcγRIIIa, FcαRI, GPVI, OSCAR, PIR-A, Dectin-2, γδTCR, and IL-3R [8]. Many of these receptors are expressed in microglia, including FcɛRI, FcγRI, FcγRIIIa, FcαRI, and OSCAR [9]. Ligand binding to the receptor complex results in phosphorylation of the FcRγ immunoreceptor tyrosine-based activation motif (ITAM), which leads to activation of SYK, CARD9 and NF-kappa-B in a process that appears to parallel that of activated TREM2 [8, 9], another gene linked to AD risk by genetics [10]. Whether FCER1G expression is altered in AD has not been reported. However, FCER1G has been reported to be upregulated in two murine models of AD as part of a larger network of microglia gene expression changes in these models [11, 12]. Indeed, FCER1G expression is increased approximately 50% in disease-associated microglia, relative to homeostatic microglia [13]. In summary, FcRγ signals through an ITAM that, at least in the case of TREM2, affects microglial activation and influences AD risk. However, the effects of genetics or AD status on FCER1G expression in the human brain has not yet been reported.
Since rs2070902 is located 16 base pairs (bp) upstream of exon 2 in FCER1G, Schwartzentruber et al. hypothesized that rs2070902 may affect exon 2 splicing [2]. To test this hypothesis, we quantified the expression of FCER1G with exon 2 present (P2-FCER1G) and with exon 2 deleted (D2-FCER1G) in a series of human AD and non-AD brains. We report FcRγ is robustly expressed in microglia and that D2-FCER1G is a common FCER1G isoform. Moreover, expression of D2-FCER1G is increased in brains of individuals with high AD neuropathology. However, we did not detect an association between rs2070902 and FCER1G exon 2 splicing.
MATERIALS AND METHODS
Human brain DNA and cDNA
Genomic DNA and RNA for this study were obtained from autopsied anterior cingulate brain samples and the RNA converted to cDNA as previously described [14–17]. The anterior cingulate cortex was used because the area is moderately affected in AD but does not have extensive neuronal death that could skew cell type-specific RNA proportions [18]. The National Institute on Aging-Reagan Institute (NIARI) criteria for neuropathological diagnosis of AD based on amyloid and tau deposition were used as a measure of AD neuropathology, where samples from brains with a score of “intermediate likelihood” or below were defined as low AD neuropathology (n = 28), and samples from brains with a score of “high likelihood” were defined as high AD neuropathology (n = 26) (reviewed in [19]). The age at death of the high pathology individuals was 82.0±6.4 (mean±SD) and that of the low pathology individuals was 82.6±8.7. The postmortem intervals for the high and low pathology samples were similar, 3.5±0.6 and 2.7±0.8 h, respectively.
The study was conducted according to the guidelines of the Declaration of Helsinki and approved by the Institutional Review Board at the University of Kentucky (2018–3028).
Immunohistochemistry
Formalin-fixed paraffin embedded coronal sections were deparaffinized through consecutive washes in SafeClear solution and decreasing concentrations of ethanol. Following a PBS wash, sections were subjected to antigen retrieval in citrate buffer (pH 6.0) for 30 min at 95°C and then washed in PBS. Endogenous peroxidase was quenched by washing slides in 3% hydrogen peroxide in methanol for 30 min. Sections were blocked in PBS with 10% horse serum and 0.1% Tween-20 for 2 h at room temperature. Slides were then incubated with an antibody against FcRγ (ab: 06-727, Millipore) at a 1:1000 dilution in the blocking solution overnight at 4°C in a humidified chamber. Slides were washed in PBS containing 0.1% Tween-20 and incubated with a biotinylated secondary antibody (BA-1400-2.1, Vector Laboratories) at a 1:50 dilution in blocking buffer for 30 min at room temperature. Then sections were washed in PBS, incubated in biotin amplification solution (ABC Elite kit, Vector Laboratories) for 30 min, and staining developed by using DAB peroxidase substrate kit (Vector Laboratories). To label for amyloid-beta, slides were washed in 3% hydrogen peroxide in methanol for 30 min, washed in PBS, incubated with blocking buffer for 1 h, washed in PBS, and incubated with an amyloid-beta antibody (6E10, Covance) at a 1:500 dilution overnight at 4°C. The slides were then incubated for 30 minutes at room temperature with a biotinylated secondary antibody, washed in PBS, incubated in biotin amplification solution, washed in PBS, and staining developed by using an SG peroxidase substrate kit (Vector Laboratories). Sections were then dehydrated through increasing concentrations of ethanol and SafeClear solution. The slides were then mounted, cover-slipped and representative images obtained on an Olympus BX51 microscope with a 40× objective.
Immunofluorescence
Formalin-fixed paraffin embedded coronal sections were deparaffinized and subjected to antigen retrieval as described above. Sections were blocked in PBS with 10% horse serum and 0.1% Tween-20 for 2 h at room temperature. Slides were then incubated with an antibody against FcRγ (ab: 06-727, Millipore) at a 1:1000 dilution and an IBA1 antibody (ab5076, Abcam) at a 1:100 dilution in the blocking solution overnight at 4°C in a humidified chamber. Slides were washed in PBS containing 0.1% Tween-20 and incubated with an Alexa Fluor 488 nm donkey anti-goat secondary antibody (RRID:AB_2534102, ThermoFisher) at a 1:1000 dilution and an Alexa Fluor 594 nm donkey anti-rabbit (RRID:AB_2340621, Jackson ImmunoResearch) at a 1:500 dilution in blocking buffer for 1 h at room temperature. Sections were then washed in PBS and mounted with Prolong Glass with NucBlue (ThermoFisher). Fluorescence was then visualized by confocal microscopy (Nikon A1R HD) and representative images obtained with a 40× objective.
PCR
Genomic DNA samples were genotyped for rs2070902 using TaqMan Genotyping (Thermo) as directed by the manufacturer: initial genomic denaturation at 98°C for 30 s, and PCR cycling at 98°C, 10 s; 60°C, 1 min; 40 cycles. To identify FCER1G splice variants in human brain, cDNA samples corresponding to 30 ng of RNA from eight individuals (4 AD; 4 non-AD) were subjected to polymerase chain reaction (PCR) with primers corresponding to sequences within exon 1 and exon 5, GGCCGATCTCCAGCCCAAG and ACAGGGAGGAGGAACCACTG, respectively. After 28 cycles with Platinum Taq DNA Polymerase (Thermo), PCR products were separated by electrophoresis on a 10% polyacrylamide gel and visualized with SYBR Gold staining. The PCR products were excised from the gel, reamplified, and sequenced to confirm their identity (ACGT, Inc).
qPCR
To quantify FCER1G with and without exon 2, we used qPCR assays targeting each isoform by using a PerfeCTa SYBR Green master mix and PCR products as standards, an approach previously described [14–17]. FCER1G with exon 2 present (P2-FCER1G) was quantified using primers corresponding to sequences within exons 1 and 2, TGATTCCAGCAGTGGTCTTGC and GTAGAGGAGGGTGAGGACAAT, respectively. FCER1G lacking exon 2 (D2-FCER1G) was quantified using primers corresponding to exon 1 and the exon 1–3 junction, CTCCAGCCCAAGATGATT and TCGCACTTGGATCTGCTT, respectively. Total FCER1G was quantified as the summation of P2-FCER1G and D2-FCER1G. AIF-1 and ITGAM expression were quantified as described [20]. For each assay, copy numbers present in cDNA samples were determined relative to standard curves executed in parallel [15–17]. The standard curves were generated with a quantified PCR product that was serially diluted.
Statistics
Since FCER1G expression was restricted to microglia and the proportion of microglial cells can vary among samples, FCER1G expression was compared to the geometric mean of the microglial genes AIF-1 and ITGAM by using linear regression of the log-normalized copy number values. To determine the effects of AD neuropathology and rs2070902 status on FCER1G expression, we then analyzed the ratio of FCER1G: geometric mean of AIF-1 and ITGAM by using a general linear model (SPSS versus 28). Similarly, the expression of D2-FCER1G was compared to P2-FCER1G by using linear regression of the log-normalized copy number values. The effects of AD neuropathology and rs2070902 genotype on the ratio of D2-FCER1G: P2-FCER1G was then analyzed by using a general linear model. As noted above in the description of these brain samples, AD neuropathology was modeled as high versus low pathology. Rs2070902 was modeled as major allele CC homozygotes (n = 28) versus minor allele T carriers (CT and TT combined, n = 26).
RESULTS
The overall experimental design of this study can be outlined in three steps. First, we focused on FcRγ protein expression in the human brain with and without AD pathology. Second, we identified the FCER1G isoforms that are expressed in these brains. Third, we compared expression of these FCER1G isoforms in brains as a function of AD neuropathology and AD genetics (rs2070902).
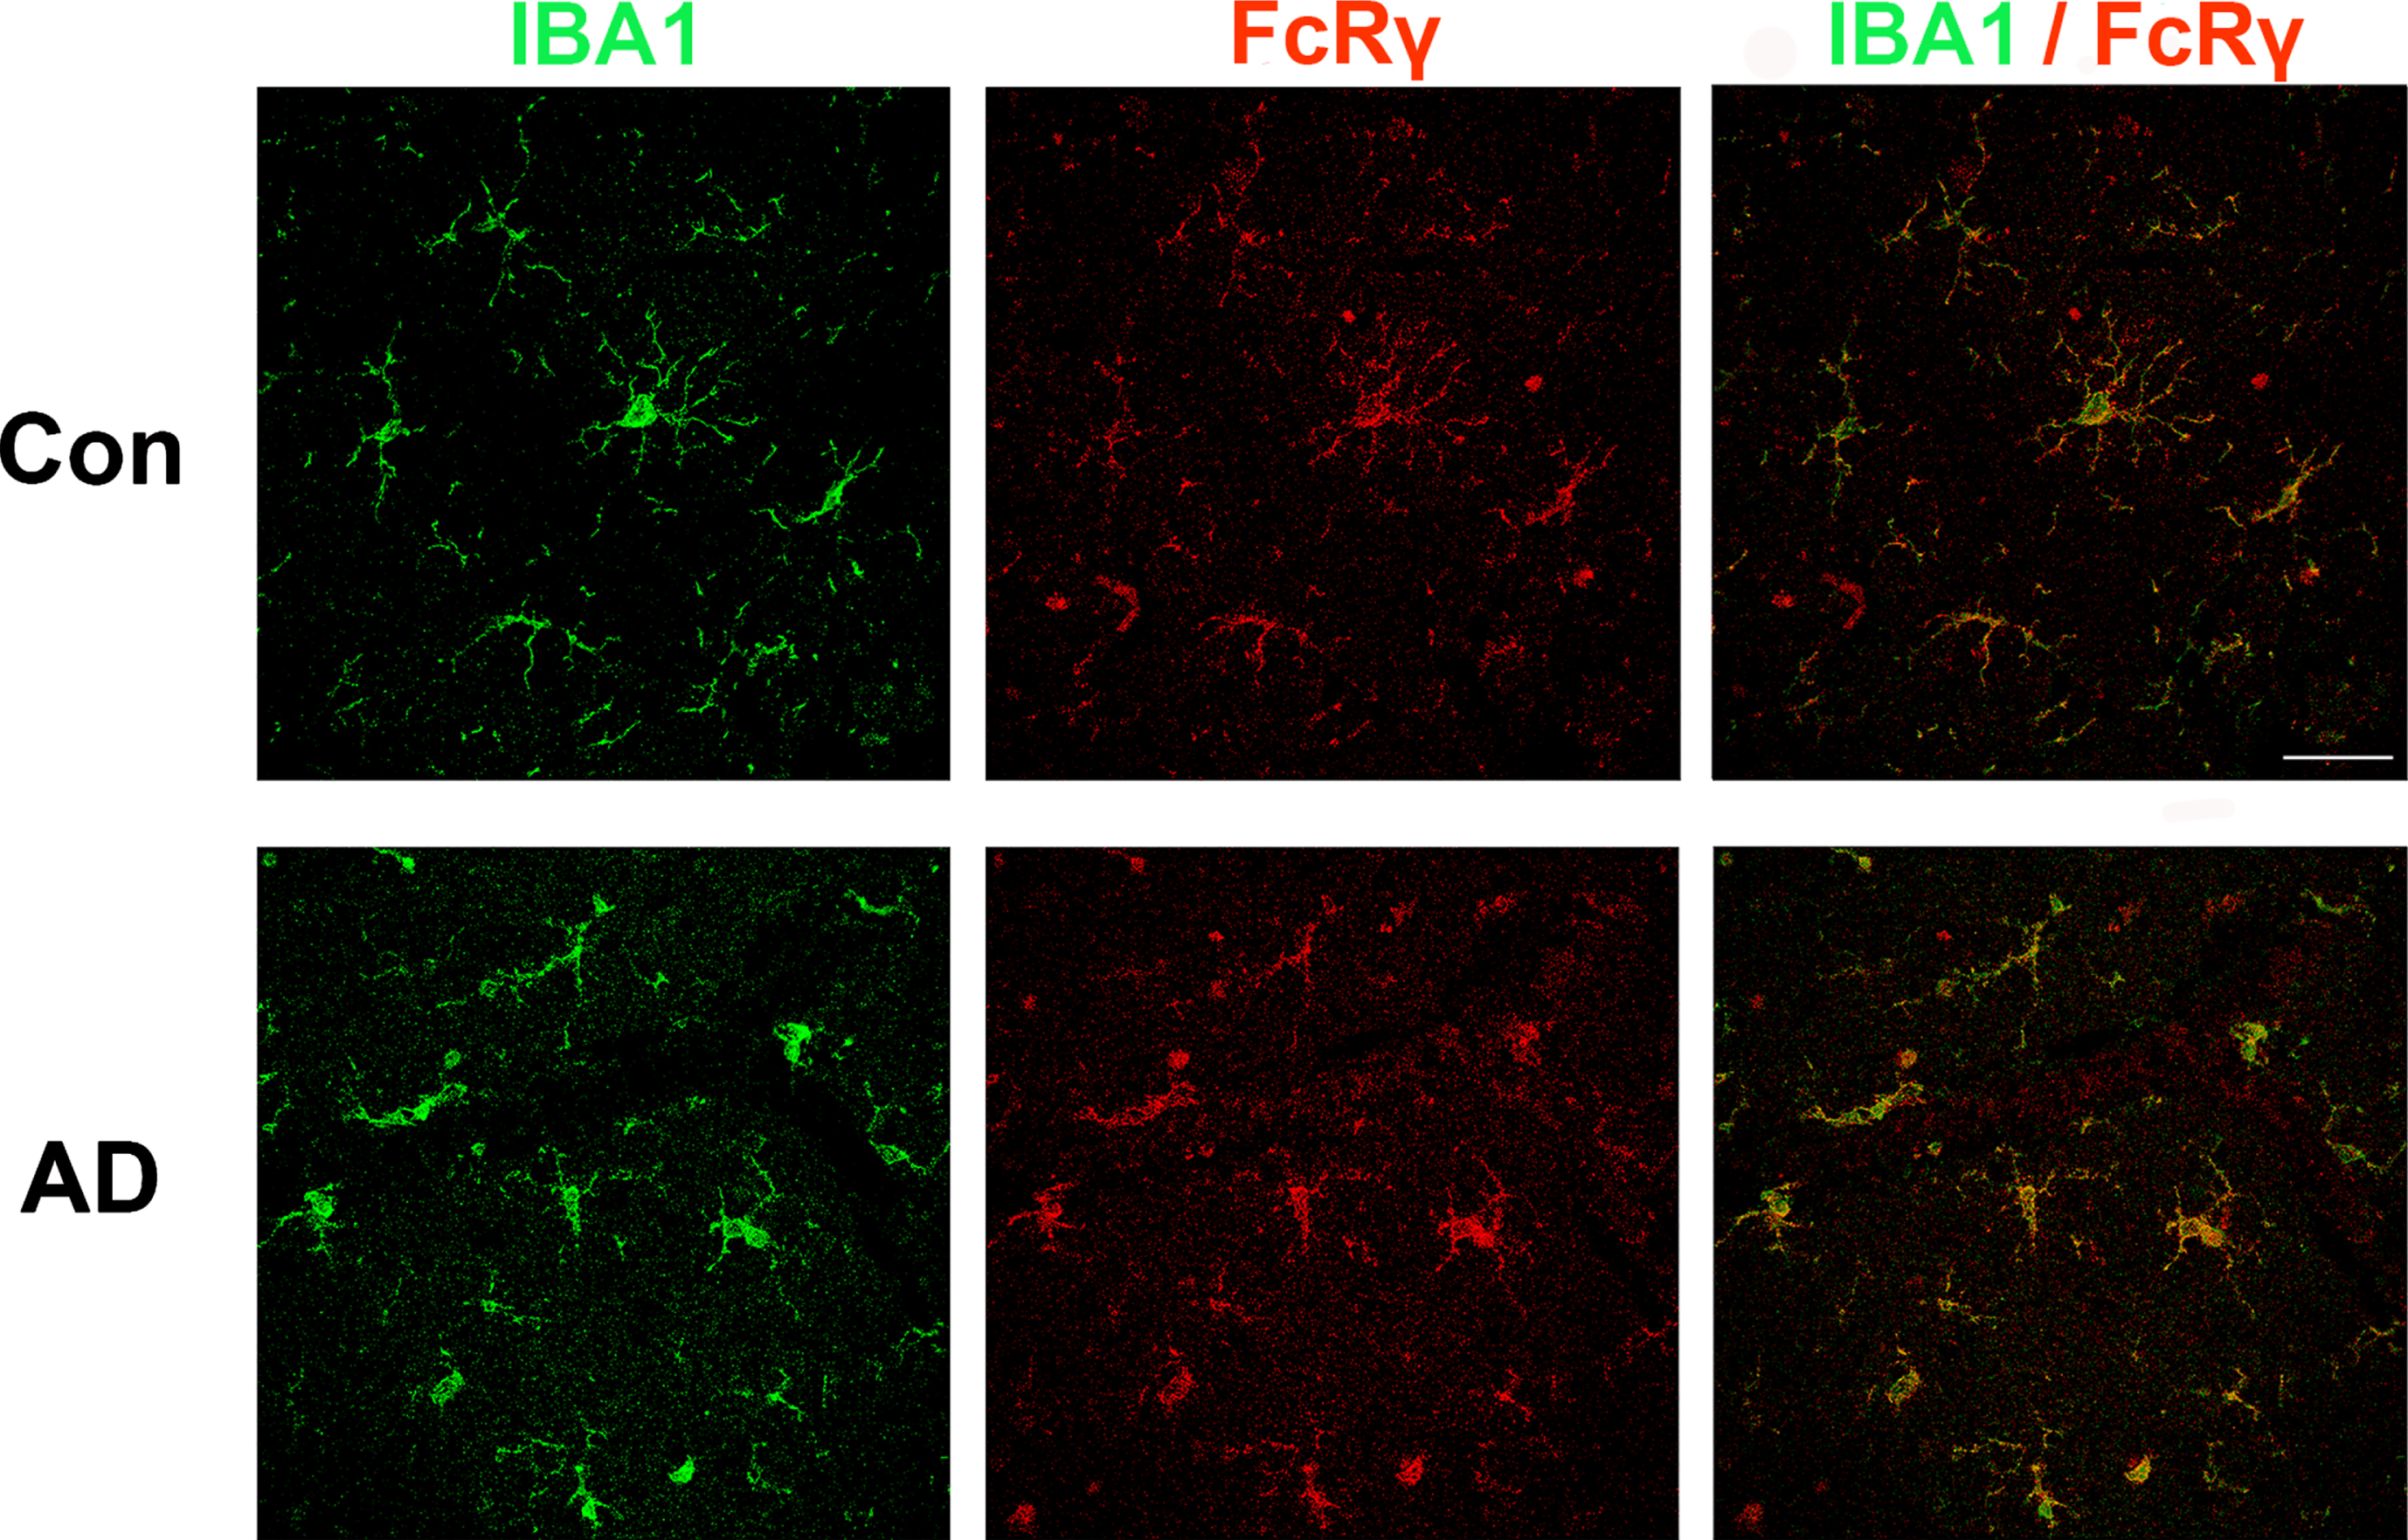
Prior immunostaining studies reported that FcRγ is expressed in cells with microglial morphology [21, 22]. Consistent with this finding, single cell RNAseq studies indicate that FCER1G expression is restricted to microglia [23]. To confirm and extend these findings, we performed a double-label study wherein human brain sections were immunolabeled for both FcRγ and for IBA1, a well-known microglial protein (Fig. 1). We found that antibodies against FcRγ (red) and IBA1 (green) labeled the same population of cells (yellow). Microglial morphology included both highly ramified and amoeboid microglia. In summary, FcRγ was robustly expressed in microglia in both AD and non-AD brain tissue(Fig. 1).
Fig. 1
FcRγ and IBA1 co-expression in human brain. Brains sections from individuals with or without AD were immunolabeled for IBA1 (green) and FCER1G (red). The merged image at the right shows that cells labeled by FcRγ are also labeled by IBA1, consistent with the concept that FcRγ is primarily expressed by microglia in the brain. Scale bar = 50μm.
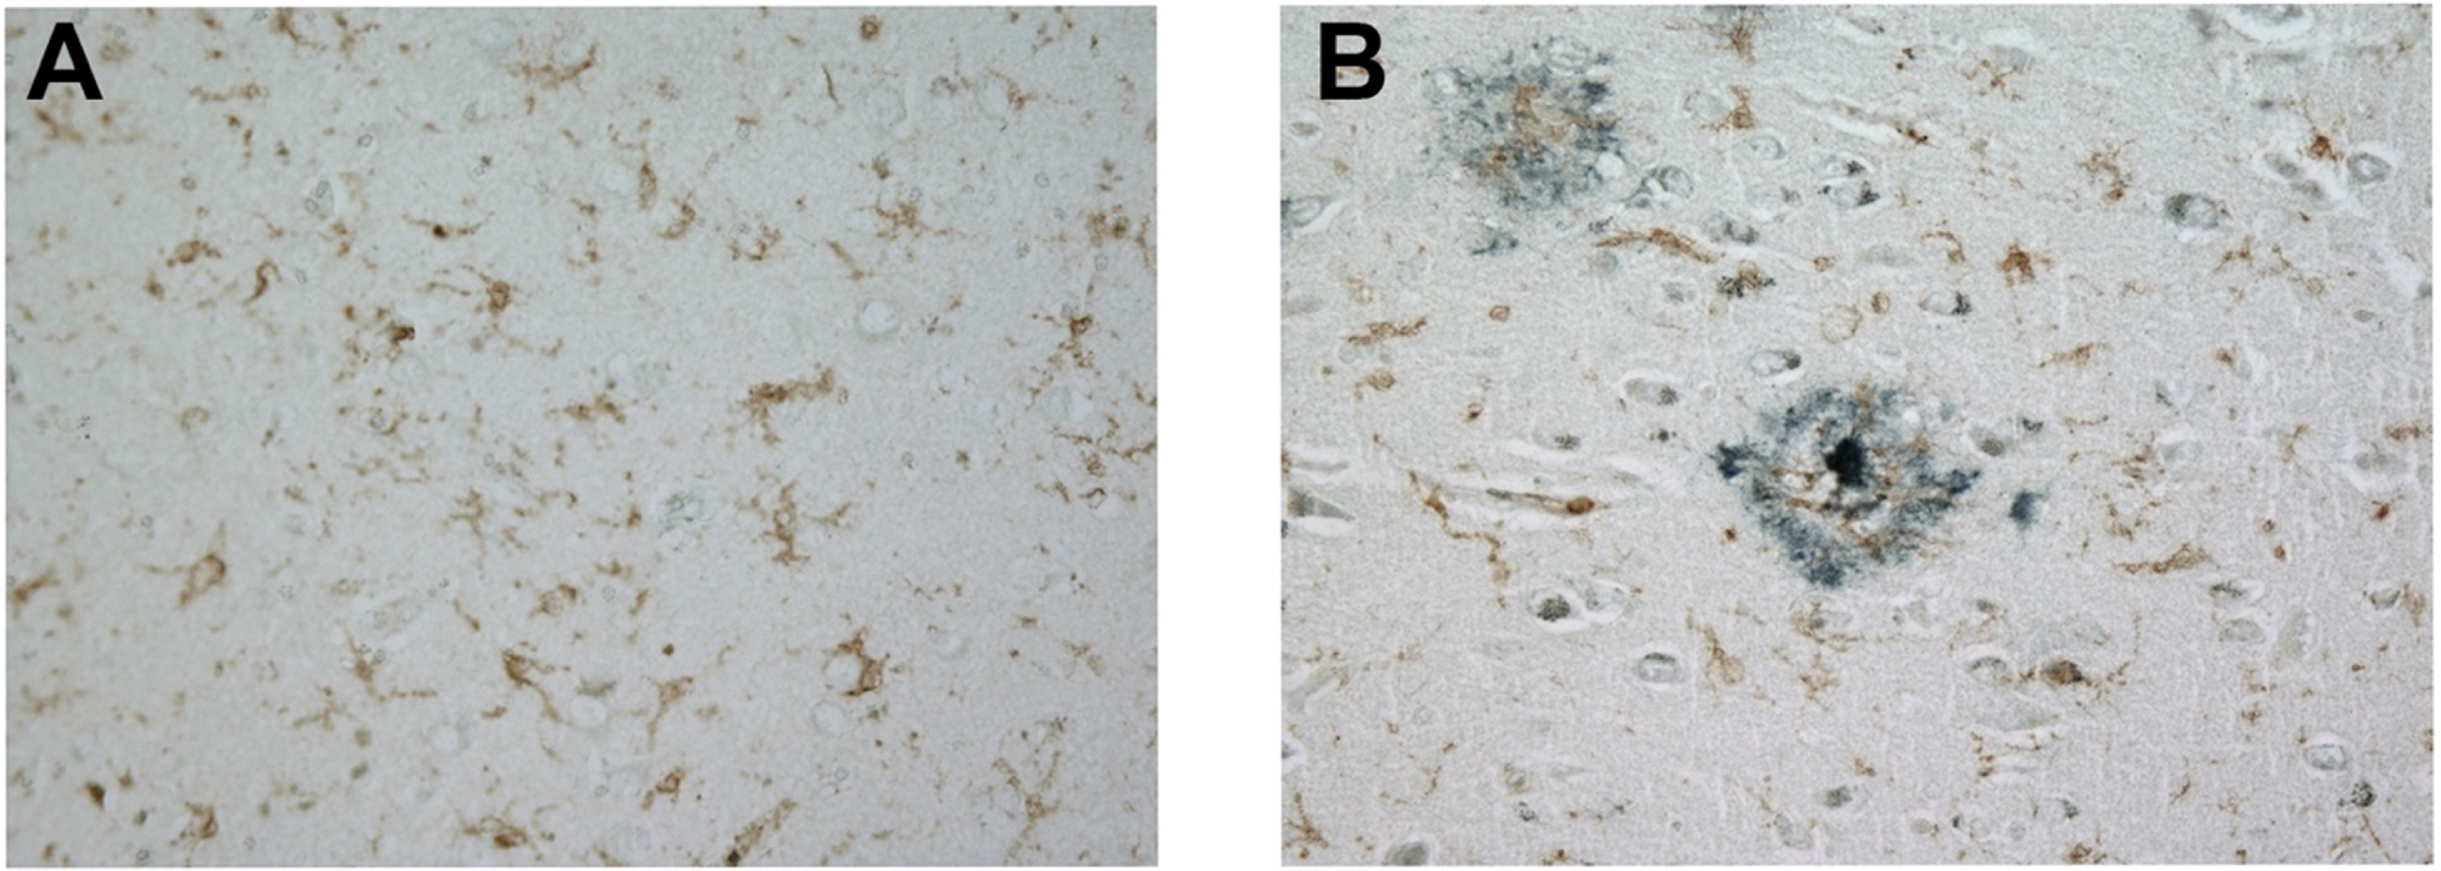
We next examined microglial FcRγ expression in the presence and absence of senile plaques. For this effort, brain sections were doubled-labeled for FcRγ and the principal proteinaceous component of senile plaques, amyloid-beta. Microglia express FcRγ robustly regardless of their proximity to amyloid plaques, as shown in a non-AD brain (Fig. 2A) and in an AD brain (Fig. 2B).
Fig. 2
FcRγ is expressed robustly in a non-AD brain in the absence of amyloid plaques (A) and in an AD brain in the presence of amyloid plaques (B). These representative images were obtained with a 40× objective. Brown label represents FcRγ staining while blue-black label represents amyloid-beta staining.
To begin to evaluate FCER1G expression and genetics, we first identified the primary FCER1G isoforms present in AD and non-AD brains. The prototypic FCER1G isoform consists of five exons that encode a protein consisting of 86 amino acids [24, 25] (Fig. 3A). Schwartzentruber et al. suggested that rs2070902 may be associated with the splicing efficiency of exon 2 because rs2070902 is within the first intron, 16 bp before exon 2 [2]. To qualitatively determine the primary FCER1G splicing variants in human brain as a function of AD status and rs2070902, we performed PCR with primers corresponding to sequence within exon 1 and exon 5. For this study, we used cDNA prepared from RNA isolated from AD and non-AD human brain samples that were homozygous for the rs2070902 major allele (CC), heterozygous (CT) or homozygous for the minor allele (TT) (Fig. 3B). With this approach, the predominant PCR product for all the samples was found to correspond to the canonical full-length, five-exon FCER1G, which manifests as a 440 bp PCR product (Fig. 3B). The second most abundant isoform corresponds to D2-FCER1G and migrates at 348bp (Fig. 3B). The identities of these PCR products were confirmed by direct sequencing. Note that direct sequencing also established that the PCR product marked by an asterisk was derived from HSPA1B and hence represents a non-specific product. Overall, we interpreted this qualitative result as indicating that exon 2 skipping was moderately common in human brain and that exons 3 and 4 were constitutively present.
Fig. 3
FCER1G isoforms present in human brain. Canonical FCER1G consists of five exons (A). PCR amplification from exon 1 to exon 5 in AD and non-AD brain samples with different rs2070902 genotypes (CC, CT, or TT) generated qualitatively similar results in that (i) the primary FCER1G isoform consists of prototypic FCER1G that contains exons 1, 2, 3, 4, and 5, and (ii) D2-FCER1G, which lacks exon 2, was the primary variant FCER1G isoform and was present regardless of AD neuropathology or rs2070902 genotype status (B). Note that these PCR products were directly sequenced to confirm the identities of P2-FCER1G and D2-FCER1G. Further, the PCR product labeled * was found to be derived from HSPA1B and hence represents a non-specific PCR product (B). Prototypic FcRγ exists as a disulfide linked dimer that uses its ITAM domains to mediate signaling from antibody-stimulated FcɛRIα (C). Although only FcɛRIα is depicted, FcRγ also mediates signaling from other Fc receptors such as FcγRI, FcγRIIIa, and FcαRI as well as immune receptors such as GPVI, OSCAR, PIR-A, Dectin-2, γδTCR, and IL-3R [8]. Loss of FCER1G exon 2 results in a premature stop codon such that D2-FCER1G encodes only a nine amino acid peptide fragment (C). This fragment consists of the signal peptide sequence and does not include the ITAM domain (C). Hence, the peptide encoded by D2-FCER1G appears to represent a complete loss of functional FcRγ.
![FCER1G isoforms present in human brain. Canonical FCER1G consists of five exons (A). PCR amplification from exon 1 to exon 5 in AD and non-AD brain samples with different rs2070902 genotypes (CC, CT, or TT) generated qualitatively similar results in that (i) the primary FCER1G isoform consists of prototypic FCER1G that contains exons 1, 2, 3, 4, and 5, and (ii) D2-FCER1G, which lacks exon 2, was the primary variant FCER1G isoform and was present regardless of AD neuropathology or rs2070902 genotype status (B). Note that these PCR products were directly sequenced to confirm the identities of P2-FCER1G and D2-FCER1G. Further, the PCR product labeled * was found to be derived from HSPA1B and hence represents a non-specific PCR product (B). Prototypic FcRγ exists as a disulfide linked dimer that uses its ITAM domains to mediate signaling from antibody-stimulated FcɛRIα (C). Although only FcɛRIα is depicted, FcRγ also mediates signaling from other Fc receptors such as FcγRI, FcγRIIIa, and FcαRI as well as immune receptors such as GPVI, OSCAR, PIR-A, Dectin-2, γδTCR, and IL-3R [8]. Loss of FCER1G exon 2 results in a premature stop codon such that D2-FCER1G encodes only a nine amino acid peptide fragment (C). This fragment consists of the signal peptide sequence and does not include the ITAM domain (C). Hence, the peptide encoded by D2-FCER1G appears to represent a complete loss of functional FcRγ.](https://content.iospress.com:443/media/adr/2023/7-1/adr-7-1-adr230076/adr-7-adr230076-g003.jpg)
Exon 2 encodes a large proportion of FcRγ, including the signal peptide, short FcRγ extracellular domain, transmembrane domain, and part of the cytosolic domain (Fig. 3C). Hence, loss of exon 2 deletes these structures from FcRγ. Moreover, loss of the 92-bp exon 2 results in a codon reading frameshift and a premature termination codon. Hence, the ITAM encoded by exons 4 and 5 is also not present in D2-FCER1G. Instead, D2-FCER1G encodes a short peptide consisting largely of the signal peptide and likely represents a complete loss of FcRγ protein function (Fig. 3C).
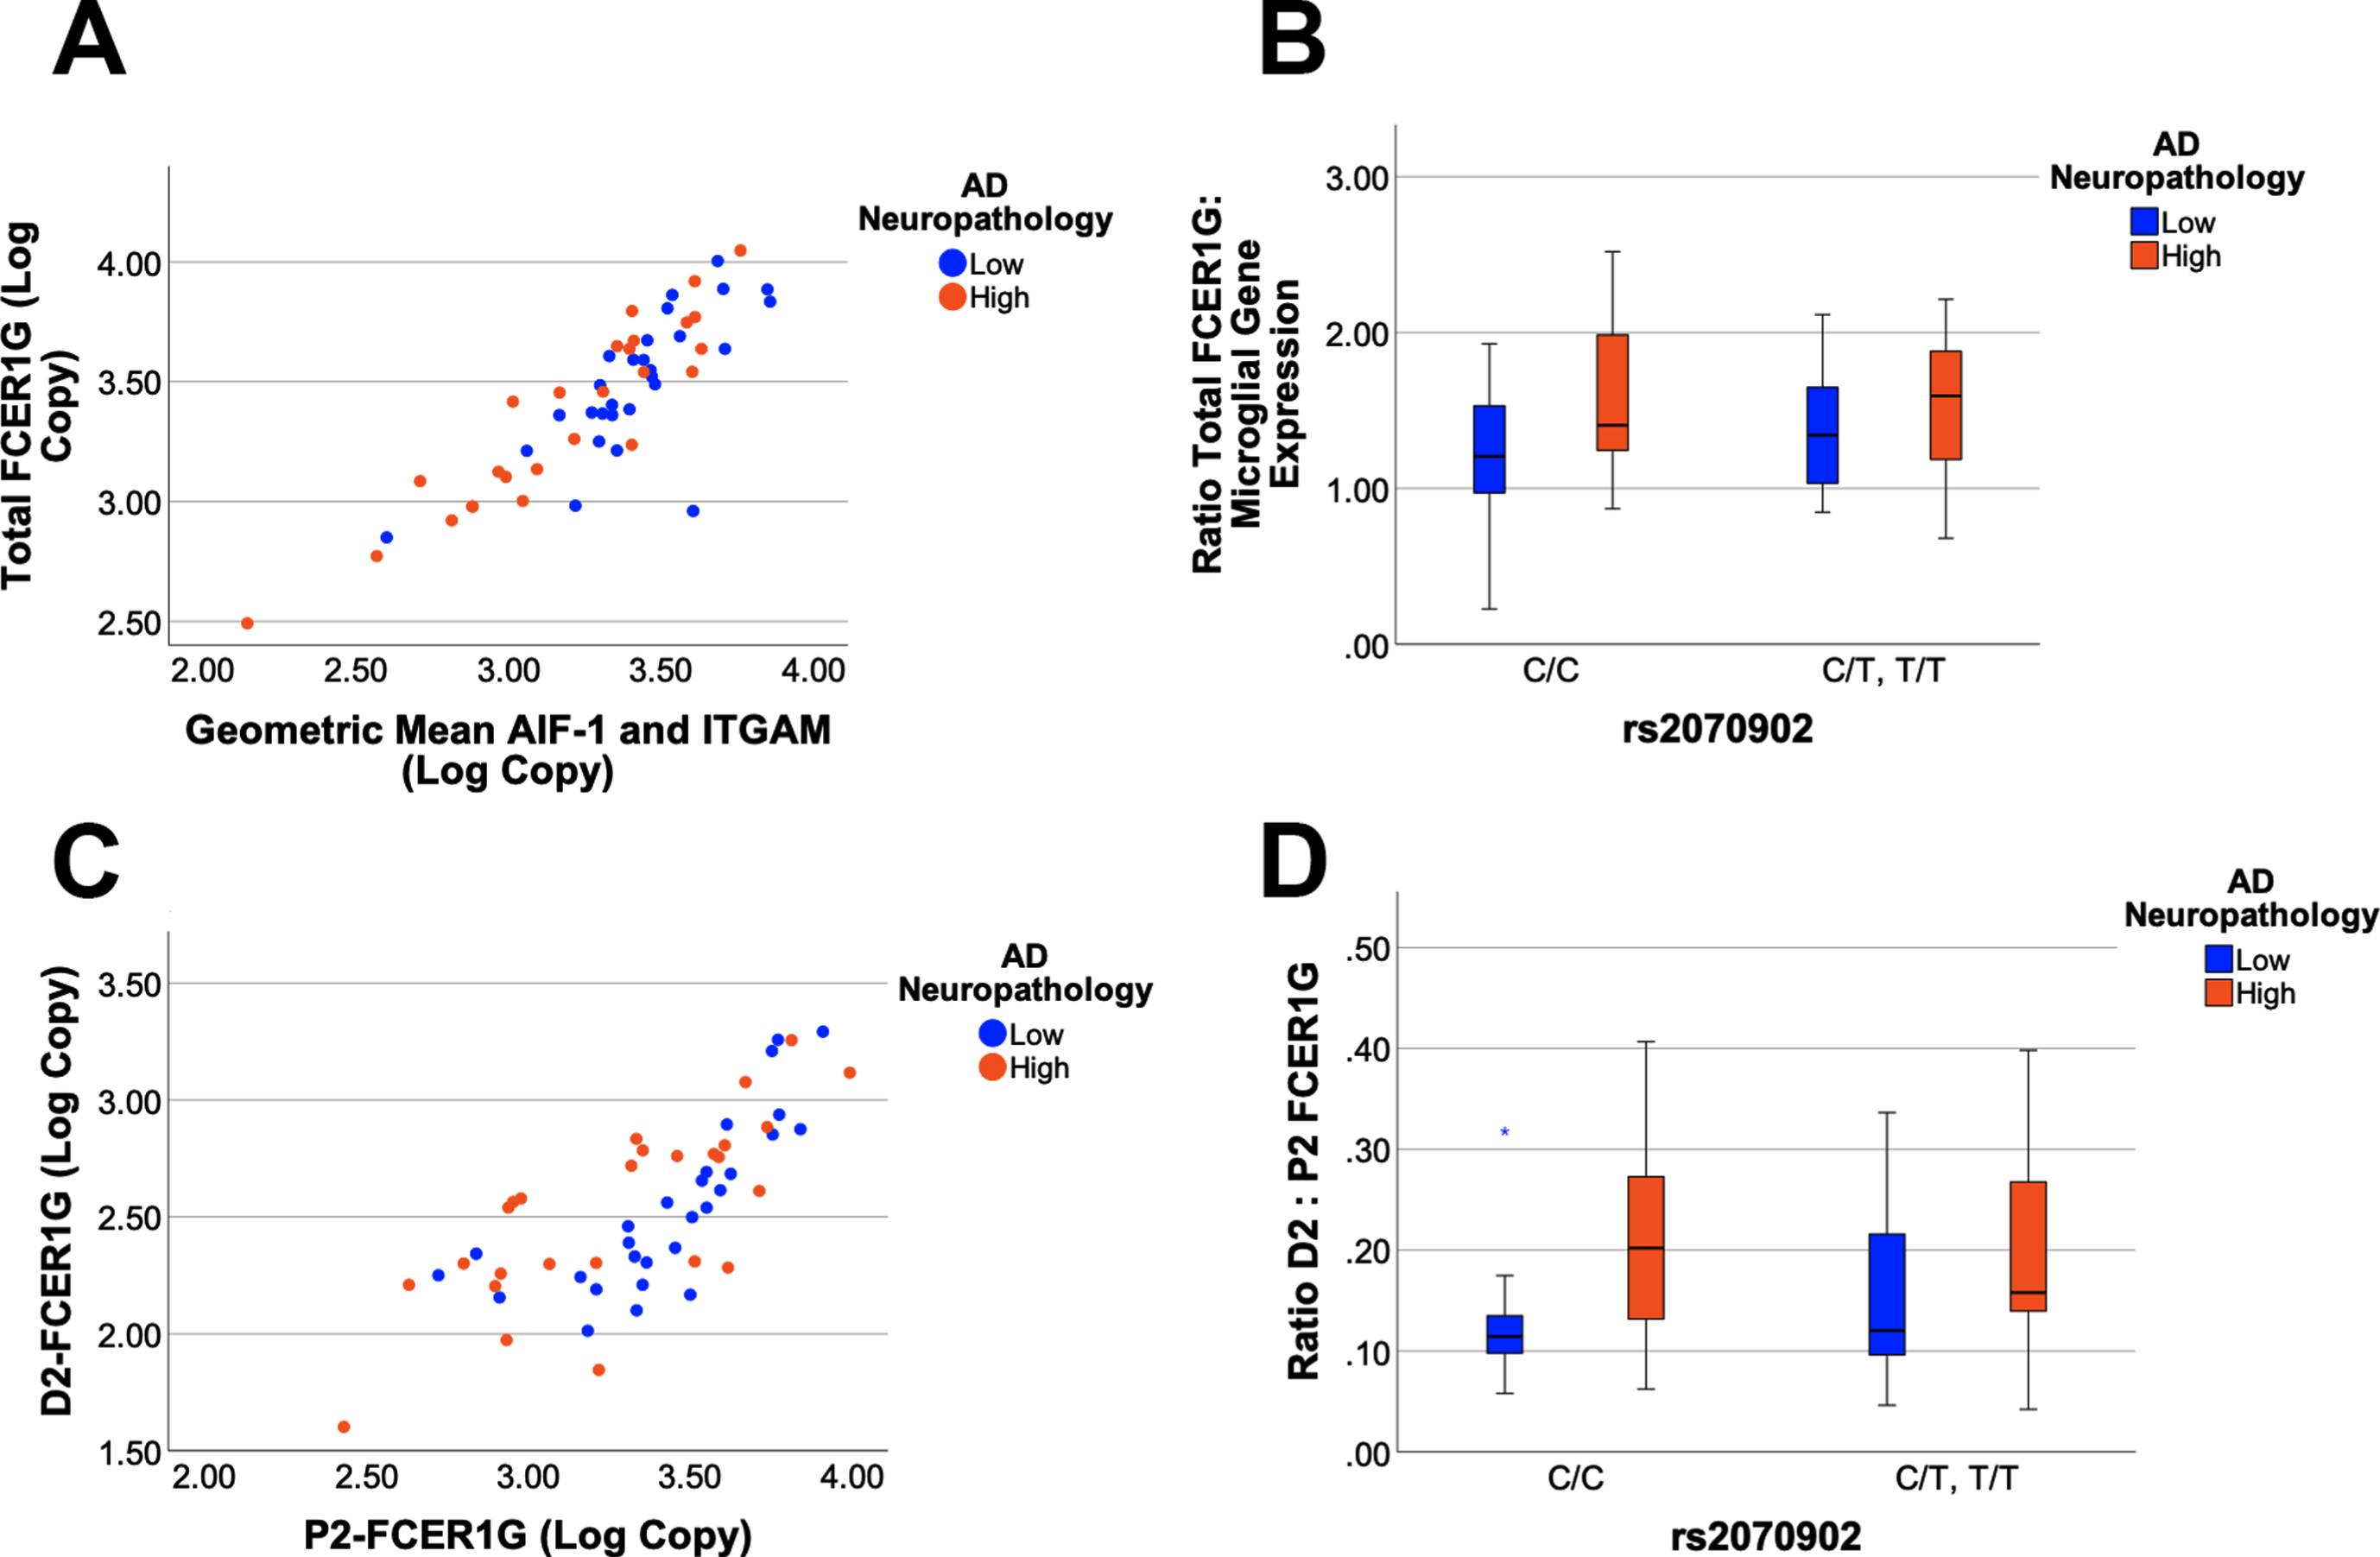
To quantify the expression of FCER1G with exon 2 present (P2-FCER1G) and without exon 2 (D2-FCER1G), qPCR assays were developed that were specific to each isoform. Total FCER1G was defined as the sum of P2-FCER1G and D2-FCER1G. The cDNA samples were grouped as either low or high AD neuropathology and as either homozygous for the major C allele of rs2070902, or as rs2070902 minor allele carriers (CT and TT). Since FCER1G expression is robust in microglia (Figs. 1 and 2), we compared FCER1G expression with the geometric mean of the microglial genes AIF-1 and ITGAM. Total FCER1G expression strongly correlated with microglial gene expression (p < 0.0001, r2 = 0.740, Fig. 4A). Comparison of the ratio of total FCER1G to microglial gene expression found that total FCER1G was modestly increased with AD neuropathology (p = 0.04, F1,51 = 4.27) but not with the AD-associated SNP (p > 0.05, Fig. 4B). Expression of FCER1G with exon 2 present strongly correlated with expression of FCER1G with exon 2 skipped (p < 0.0001, r2 = 0.563, Fig. 4C). Comparison of the ratio of D2-FCER1G to P2- FCER1G found an increase in D2-FCER1G with AD neuropathology (p = 0.02, F1,51 = 5.80) but not with the AD-associated SNP (p > 0.05, Fig. 4D). Quantitatively, the D2-FCER1G: P2-FCER1G ratio changed from 0.144±0.081 (mean±SD, n = 28) to 0.208±0.111 (mean±SD, n = 26) for low and high AD neuropathology samples, respectively.
Fig. 4
FCER1G isoform expression as a function of AD neuropathology and genetics. Total FCER1G expression correlates strongly with the expression of microglial genes (p < 0.0001, r2 = 0.740), which are modeled as the geometric mean of mean of AIF-1 and ITGAM expression (A). A General Linear Model analysis found that the ratio of total FCER1G: microglial gene expression is increased with AD neuropathology (p = 0.04) but not associated with rs2070902 (p > 0.05) (B). The expression of D2-FCER1G correlated well with P2-FCER1G (p < 0.0001, r2 = 0.563) (C). The ratio of D2- FCER1G: P2-FCER1G expression was increased in samples with high AD neuropathology (p = 0.02) but was not associated with rs2070902 (p > 0.05) (D). In the box plots, the median and middle interquartile range are represented by the horizontal bar and accompanying box, respectively. The whiskers demarcate 1.5 times the interquartile range while an asterisk (D) denotes outliers beyond this range.
DISCUSSION
The primary findings of this study are three-fold. First, FcRγ is robustly expressed in human microglia in vivo. Second, FCER1G lacking exon 2 represents approximately 15% of total FCER1G expression and the proportion of FCER1G expressed as this isoform is significantly increased in brains with high AD neuropathology. Since D2-FCER1G encodes a signal peptide but lacks the FcRγ ITAM, we predict that D2-FCER1G represents a loss of function relative to P2-FCER1G. Lastly, rs2070902 is not associated with FCER1G splicing. Hence, this SNP is associated with AD by genetics but does not appear to impact total FCER1G expression or FCER1G splicing. In summary, D2-FCER1G is commonly present in the human brain and increased in AD but is not by affected by AD genetics.
AD genetic risk factors have been an area of intense scrutiny because they may reveal insights into the mechanisms underlying AD risk. Schwartzentruber et al. identified rs2070902 as associated with AD risk and hypothesized that this SNP may affect FCER1G splicing [2]. Our findings did not support this hypothesis because we did not detect an association between the SNP and D2-FCER1G expression. We also did not detect an association between total FCER1G expression and rs2070902. Thus, FCER1G does not appear to mediate the association between rs2070902 and AD risk. Other genes in the vicinity that may mediate this risk should be scrutinized instead, noting that rs2070902 appears associated with expression of ADAMTS4, NDUFS2 and B4GALT3 in at least a few tissues [26]. Among these candidates, ADAMTS4 has been found to generate N-terminally truncated forms of amyloid-beta peptide, and therefore may be the best target for the actions of rs2070902 relevant to AD [27].
Positive findings from this study included that FcRγ was primarily expressed in microglia in both AD and non-AD brains. Moreover, D2-FCER1G was the primary FCER1G variant isoform in the brain. Additionally, D2-FCER1G was significantly increased in brains with high AD neuropathology. While statistically significant (p = 0.02), the extent of this increase was somewhat modest, i.e., the D2-FCER1G: P2-FCER1G ratio changed from 0.144±0.081 (mean±SD, n = 28) to 0.208±0.111 (mean±SD, n = 26) for low and high AD neuropathology samples, respectively. Since D2-FCER1G encodes a peptide that lacks an ITAM and is hence incapable of mediating normal FcRγ signaling, we interpret this result overall as suggesting a modest reduction in FCER1G transcripts encoding functional FcRγ in brains with high AD pathology. Whether this change in FCER1G splicing is sufficient to impact microglial function will require further work. For example, a future target of experimentation could be comparison of motility or phagocytosis in cells expressing FCER1G normally versus cells hemizygous for FCER1G exon 2 deletion. Ultimately, a mouse model that expresses the D2-FCER1G isoform may be necessary to definitively show how, if at all, FCER1G splicing affects microglial function and AD-related pathology in vivo.
Since the loss of exon 2 results in a codon reading frameshift and a premature translation termination codon, the possibility exists that D2-FCER1G may undergo nonsense-mediated RNA decay (NMD). Indeed, NMD often occurs when a ribosome encounters a termination codon upstream of an exon junction complex [28]. However, D2-FCER1G may not be subject to NMD because mRNA transcripts with translation start sites near premature termination codons commonly escape NMD [29–31]. This occurs because binding of UPF1 to the translation complex is necessary for NMD, and this binding is blocked by the interaction of the poly(A)-binding protein 1 with the eukaryotic translation initiation factors eIF4G and eIF3 [29–31] when the mRNA begins translation. In summary, if D2-FCER1G is expressed as protein, the protein would consist of a nine- amino acid peptide. Whether D2-FCER1G undergoes NMD is unlikely because of the proximity of the premature termination codon to the translation start site.
FCER1G is a member of a larger gene family that contains ITAMs to mediate signaling. A common model used to study the role of activating FcγRs in vivo are mice deficient for this Fcγ chain, who lack expression of functional activating FcγRs. Activating FcγR deficient mice show decreased antibody mediated phagocytosis, abnormal platelet activation and an attenuated immune response to immune complexes [32]. However, some of these effects may be mediated by other immune receptors, such as C-type lectins, which also depend on Fcγ chain signaling [33]. In contrast to activating Fcγ receptors, the expression and therefore function of the inhibitory Fcγ receptor (FcγRIIb) is maintained. Human FcγRIIa carries an intrinsic ITAM in its cytoplasmic domain. Ligation of IgG-immune complexes by activating FcγRs results in the crosslinking of the receptor and the phosphorylation of ITAMs in the cytoplasmic chain. This forms a binding site for the Spleen tyrosine kinase (Syk), which then activates downstream signaling cascades such as the PI3K pathway. Cellular calcium levels are increased, and the cell becomes activated which can result in increased proliferation, cytokine/chemokine release, phagocytosis, and antigen presentation [34]. The inhibitory FcγRIIb signals through an intrinsic cytoplasmic immunotyrosine inhibitory motif (ITIM), cross-linking with an activating receptor results in ITIM phosphorylation leading to the inhibition of cellular activation [34]. The process of FcγR mediated activation or inhibition of an effector cell is outlined in Fig. 1.
The primary limitation of this study may be the number of available brain samples. However, studies involving larger numbers of samples such as those described in Genotype-Tissue Expression (GTEx) have also generally not found an association between rs2070902 and either FCER1G splicing or total FCER1G expression in brain [26]. The minor allele of rs2070902 was associated with increased expression of FCER1G in blood [26].
Conclusions
This study represents a test of the hypothesis that rs2070902 modulated splicing of FCER1G exon 2 in human brain. Our results do not support this hypothesis although we did find that FCER1G is robustly expressed in microglia and that the proportion of FCER1G expressed as the D2-FCER1G isoform is increased in brain samples with high AD neuropathology. Overall, these studies add to our understanding of FCER1G expression and splicing in particular and AD genetic mechanisms in general.
ACKNOWLEDGMENTS
The authors acknowledge Susan Kraner, Ph.D., for her helpful consultations regarding immunohistochemistry.
FUNDING
This research was funded by NIH, grant numbers RF1AG059717 (SE) and R21AG068370 (SE).
CONFLICT OF INTEREST
The authors declare no conflict of interest.
DATA AVAILABILITY
The data supporting the findings of this study are available within the article.
REFERENCES
[1] | Wightman DP , Jansen IE , Savage JE , Shadrin AA , Bahrami S , Holland D , Rongve A , Borte S , Winsvold BS , Drange OK , Martinsen AE , Skogholt AH , Willer C , Brathen G , Bosnes I , Nielsen JB , Fritsche LG , Thomas LF , Pedersen LM , Gabrielsen ME , Johnsen MB , Meisingset TW , Zhou W , Proitsi P , Hodges A , Dobson R , Velayudhan L , Heilbron K , Auton A , and Me Research T , Sealock JM , Davis LK , Pedersen NL , Reynolds CA , Karlsson IK , Magnusson S , Stefansson H , Thordardottir S , Jonsson PV , Snaedal J , Zettergren A , Skoog I , Kern S , Waern M , Zetterberg H , Blennow K , Stordal E , Hveem K , Zwart JA , Athanasiu L , Selnes P , Saltvedt I , Sando SB , Ulstein I , Djurovic S , Fladby T , Aarsland D , Selbaek G , Ripke S , Stefansson K , Andreassen OA , Posthuma D ((2021) ) A genome-wide association study with 1,126,563 individuals identifies new risk loci for Alzheimer’s disease. Nat Genet 53: , 1276–1282. |
[2] | Schwartzentruber J , Cooper S , Liu JZ , Barrio-Hernandez I , Bello E , Kumasaka N , Young AMH , Franklin RJM , Johnson T , Estrada K , Gaffney DJ , Beltrao P , Bassett A ((2021) ) Genome-wide meta-analysis, fine-mapping and integrative prioritization implicate new Alzheimer’s disease risk genes. Nat Genet 53: , 392–402. |
[3] | Jansen IE , Savage JE , Watanabe K , Bryois J , Williams DM , Steinberg S , Sealock J , Karlsson IK , Hagg S , Athanasiu L , Voyle N , Proitsi P , Witoelar A , Stringer S , Aarsland D , Almdahl IS , Andersen F , Bergh S , Bettella F , Bjornsson S , Braekhus A , Brathen G , de Leeuw C , Desikan RS , Djurovic S , Dumitrescu L , Fladby T , Hohman TJ , Jonsson PV , Kiddle SJ , Rongve A , Saltvedt I , Sando SB , Selbaek G , Shoai M , Skene NG , Snaedal J , Stordal E , Ulstein ID , Wang Y , White LR , Hardy J , Hjerling-Leffler J , Sullivan PF , van der Flier WM , Dobson R , Davis LK , Stefansson H , Stefansson K , Pedersen NL , Ripke S , Andreassen OA , Posthuma D ((2019) ) Genome-wide meta-analysis identifies new loci and functional pathways influencing Alzheimer’s disease risk. Nat Genet 51: , 404–413. |
[4] | Wijsman EM , Pankratz ND , Choi Y , Rothstein JH , Faber KM , Cheng R , Lee JH , Bird TD , Bennett DA , Diaz-Arrastia R , Goate AM , Farlow M , Ghetti B , Sweet RA , Foroud TM , Mayeux R ((2011) ) Genome-wide association of familial late-onset Alzheimer’s disease replicates BIN1 and CLU and nominates CUGBP2 in interaction with APOE. PLoS Genet 7: , e1001308. |
[5] | Lambert JC , Heath S , Even G , Campion D , Sleegers K , Hiltunen M , Combarros O , Zelenika D , Bullido MJ , Tavernier B , Letenneur L , Bettens K , Berr C , Pasquier F , Fievet N , Barberger-Gateau P , Engelborghs S , De Deyn P , Mateo I , Franck A , Helisalmi S , Porcellini E , Hanon O , de Pancorbo MM , Lendon C , Dufouil C , Jaillard C , Leveillard T , Alvarez V , Bosco P , Mancuso M , Panza F , Nacmias B , Bossu P , Piccardi P , Annoni G , Seripa D , Galimberti D , Hannequin D , Licastro F , Soininen H , Ritchie K , Blanche H , Dartigues JF , Tzourio C , Gut I , Van Broeckhoven C , Alperovitch A , Lathrop M , Amouyel P ((2009) ) Genome-wide association study identifies variants at CLU and CR1 associated with Alzheimer’s disease. Nat Genet 41: , 1094–1099. |
[6] | Harold D , Abraham R , Hollingworth P , Sims R , Gerrish A , Hamshere ML , Pahwa JS , Moskvina V , Dowzell K , Williams A , Jones N , Thomas C , Stretton A , Morgan AR , Lovestone S , Powell J , Proitsi P , Lupton MK , Brayne C , Rubinsztein DC , Gill M , Lawlor B , Lynch A , Morgan K , Brown KS , Passmore PA , Craig D , McGuinness B , Todd S , Holmes C , Mann D , Smith AD , Love S , Kehoe PG , Hardy J , Mead S , Fox N , Rossor M , Collinge J , Maier W , Jessen F , Schurmann B , van den Bussche H , Heuser I , Kornhuber J , Wiltfang J , Dichgans M , Frolich L , Hampel H , Hull M , Rujescu D , Goate AM , Kauwe JS , Cruchaga C , Nowotny P , Morris JC , Mayo K , Sleegers K , Bettens K , Engelborghs S , De Deyn PP , Van Broeckhoven C , Livingston G , Bass NJ , Gurling H , McQuillin A , Gwilliam R , Deloukas P , Al-Chalabi A , Shaw CE , Tsolaki M , Singleton AB , Guerreiro R , Muhleisen TW , Nothen MM , Moebus S , Jockel KH , Klopp N , Wichmann HE , Carrasquillo MM , Pankratz VS , Younkin SG , Holmans PA , O’Donovan M , Owen MJ , Williams J ((2009) ) Genome-wide association study identifies variants at CLU and PICALM associated with Alzheimer’s disease. Nat Genet 41: , 1088–1093. |
[7] | Brandsma AM , Hogarth PM , Nimmerjahn F , Leusen JH ((2016) ) Clarifying the confusion between cytokine and Fc receptor common gamma chain. Immunity 45: , 225–226. |
[8] | Miyake Y , Toyonaga K , Mori D , Kakuta S , Hoshino Y , Oyamada A , Yamada H , Ono K , Suyama M , Iwakura Y , Yoshikai Y , Yamasaki S ((2013) ) C-type lectin MCL is an FcRgamma-coupled receptor that mediates the adjuvanticity ofmycobacterial cord factor. Immunity 38: , 1050–1062. |
[9] | Zhang Y , Chen K , Sloan SA , Bennett ML , Scholze AR , O’Keeffe S , Phatnani HP , Guarnieri P , Caneda C , Ruderisch N , Deng S , Liddelow SA , Zhang C , Daneman R , Maniatis T , Barres BA , Wu JQ ((2014) ) An RNA-sequencing transcriptome and splicing database of glia, neurons, and vascular cells of the cerebral cortex. J Neurosci 34: , 11929–11947. |
[10] | Jay TR , von Saucken VE , Landreth GE ((2017) ) TREM2 in neurodegenerative diseases. Mol Neurodegener 12: , 56. |
[11] | Matarin M , Salih DA , Yasvoina M , Cummings DM , Guelfi S , Liu W , Nahaboo Solim MA , Moens TG , Paublete RM , Ali SS , Perona M , Desai R , Smith KJ , Latcham J , Fulleylove M , Richardson JC , Hardy J , Edwards FA ((2015) ) A genome-wide gene-expression analysis and database in transgenic mice during development of amyloid or tau pathology. Cell Rep 10: , 633–644. |
[12] | Lambracht-Washington D , Fu M , Hynan LS , Rosenberg RN ((2021) ) Changes in the brain transcriptome after DNA Abeta42 trimer immunization in a 3xTg-AD mouse model. Neurobiol Dis 148: , 105221. |
[13] | Keren-Shaul H , Spinrad A , Weiner A , Matcovitch-Natan O , Dvir-Szternfeld R , Ulland TK , David E , Baruch K , Lara-Astaiso D , Toth B , Itzkovitz S , Colonna M , Schwartz M , Amit I ((2017) ) A unique microglia type associated with restricting development of Alzheimer’s disease. Cell 169: , 1276–1290 e1217. |
[14] | Grear KE , Ling IF , Simpson JF , Furman JL , Simmons CR , Peterson SL , Schmitt FA , Markesbery WR , Liu Q , Crook JE , Younkin SG , Bu G , Estus S ((2009) ) Expression of SORL1 and a novel SORL1 splice variant in normal and Alzheimers disease brain. Mol Neurodegener 4: , 46. |
[15] | Malik M , Chiles J 3rd , Xi HS , Medway C , Simpson J , Potluri S , Howard D , Liang Y , Paumi CM , Mukherjee S , Crane P , Younkin S , Fardo DW , Estus S ((2015) ) Genetics of CD33 in Alzheimer’s disease and acute myeloid leukemia. Hum Mol Genet 24: , 3557–3570. |
[16] | Shaw BC , Katsumata Y , Simpson JF , Fardo DW , Estus S ((2021) ) Analysis of genetic variants associated with levels of immune modulating proteins for impact on Alzheimer’s disease risk reveal a potential role for SIGLEC14. Genes (Basel) 12: , 1008. |
[17] | Shaw BC , Snider HC , Turner AK , Zajac DJ , Simpson JF , Estus S ((2022) ) An alternatively spliced TREM2 isoform lacking the ligand binding domain is expressed in human brain. J Alzheimers Dis 87: , 1647–1657. |
[18] | Tan RH , Pok K , Wong S , Brooks D , Halliday GM , Kril JJ ((2013) ) The pathogenesis of cingulate atrophy in behavioral variant frontotemporal dementia and Alzheimer’s disease. Acta Neuropathol Commun 1: , 30. |
[19] | Nelson PT , Braak H , Markesbery WR ((2009) ) Neuropathology and cognitive impairment in Alzheimer disease: A complex but coherent relationship. J Neuropathol Exp Neurol 68: , 1–14. |
[20] | Malik M , Simpson JF , Parikh I , Wilfred BR , Fardo DW , Nelson PT , Estus S ((2013) ) CD33 Alzheimer’s risk-altering polymorphism, CD33 expression, and exon 2 splicing. J Neurosci 33: , 13320–13325. |
[21] | Akiyama H , McGeer PL ((1990) ) Brain microglia constitutively express beta-2 integrins. J Neuroimmunol 30: , 81–93. |
[22] | Peress NS , Fleit HB , Perillo E , Kuljis R , Pezzullo C ((1993) ) Identification of Fc gamma RI, II and III on normal human brain ramified microglia and on microglia in senile plaques in Alzheimer’s disease. J Neuroimmunol 48: , 71–79. |
[23] | Olah M , Patrick E , Villani AC , Xu J , White CC , Ryan KJ , Piehowski P , Kapasi A , Nejad P , Cimpean M , Connor S , Yung CJ , Frangieh M , McHenry A , Elyaman W , Petyuk V , Schneider JA , Bennett DA , De Jager PL , Bradshaw EM ((2018) ) A transcriptomic atlas of aged human microglia. Nat Commun 9: , 539. |
[24] | Cunningham F , Allen JE , Allen J , Alvarez-Jarreta J , Amode MR , Armean IM , Austine-Orimoloye O , Azov AG , Barnes I , Bennett R , Berry A , Bhai J , Bignell A , Billis K , Boddu S , Brooks L , Charkhchi M , Cummins C , Da Rin Fioretto L , Davidson C , Dodiya K , Donaldson S , El Houdaigui B , El Naboulsi T , Fatima R , Giron CG , Genez T , Martinez JG , Guijarro-Clarke C , Gymer A , Hardy M , Hollis Z , Hourlier T , Hunt T , Juettemann T , Kaikala V , Kay M , Lavidas I , Le T , Lemos D , Marugan JC , Mohanan S , Mushtaq A , Naven M , Ogeh DN , Parker A , Parton A , Perry M , Pilizota I , Prosovetskaia I , Sakthivel MP , Salam AIA , Schmitt BM , Schuilenburg H , Sheppard D , Perez-Silva JG , Stark W , Steed E , Sutinen K , Sukumaran R , Sumathipala D , Suner MM , Szpak M , Thormann A , Tricomi FF , Urbina-Gomez D , Veidenberg A , Walsh TA , Walts B , Willhoft N , Winterbottom A , Wass E , Chakiachvili M , Flint B , Frankish A , Giorgetti S , Haggerty L , Hunt SE , GR II , Loveland JE , Martin FJ , Moore B , Mudge JM , Muffato M , Perry E , Ruffier M , Tate J , Thybert D , Trevanion SJ , Dyer S , Harrison PW , Howe KL , Yates AD , Zerbino DR , Flicek P ((2022) ) Ensembl 2022. Nucleic Acids Res 50: , D988–D995. |
[25] | McAleese SM , Miller HR ((2003) ) Cloning and sequencing of the equine and ovine high-affinity IgE receptor beta-and gamma-chain cDNA. Immunogenetics 55: , 122–125. |
[26] | Consortium GT ((2013) ) The Genotype-Tissue Expression (GTEx) project. Nat Genet 45: , 580–585. |
[27] | Walter S , Jumpertz T , Huttenrauch M , Ogorek I , Gerber H , Storck SE , Zampar S , Dimitrov M , Lehmann S , Lepka K , Berndt C , Wiltfang J , Becker-Pauly C , Beher D , Pietrzik CU , Fraering PC , Wirths O , Weggen S ((2019) ) The metalloprotease ADAMTS4 generates N-truncated Abeta4-x species and marks oligodendrocytes as a source of amyloidogenic peptides in Alzheimer’s disease. Acta Neuropathol 137: , 239–257. |
[28] | Silva AL , Romao L ((2009) ) The mammalian nonsense-mediated mRNA decay pathway: To decay or not to decay! Which players make the decision? FEBS Lett 583: , 499–505. |
[29] | Peixeiro I , Inacio A , Barbosa C , Silva AL , Liebhaber SA , Romao L ((2012) ) Interaction of PABPC1 with the translation initiation complex is critical to the NMD resistance of AUG-proximal nonsense mutations. Nucleic Acids Res 40: , 1160–1173. |
[30] | Neu-Yilik G , Amthor B , Gehring NH , Bahri S , Paidassi H , Hentze MW , Kulozik AE ((2011) ) Mechanism of escape from nonsense-mediated mRNA decay of human beta-globin transcripts with nonsense mutations in the first exon. RNA 17: , 843–854. |
[31] | Inacio A , Silva AL , Pinto J , Ji X , Morgado A , Almeida F , Faustino P , Lavinha J , Liebhaber SA , Romao L ((2004) ) Nonsense mutations in close proximity to the initiation codon fail to trigger full nonsense-mediated mRNA decay. J Biol Chem 279: , 32170–32180. |
[32] | Takai T , Li M , Sylvestre D , Clynes R , Ravetch JV ((1994) ) FcR gamma chain deletion results in pleiotrophic effector cell defects. Cell 76: , 519–529. |
[33] | Geijtenbeek TB , Gringhuis SI ((2009) ) Signalling through C-type lectin receptors: Shaping immune responses. Nat Rev Immunol 9: , 465–479. |
[34] | Nimmerjahn F , Ravetch JV ((2008) ) Anti-inflammatory actions of intravenous immunoglobulin. Annu Rev Immunol 26: , 513–533. |


