
Modulation of Cytosolic Phospholipase A2 as a Potential Therapeutic Strategy for Alzheimer’s Disease
Abstract
Background:
Alzheimer’s disease (AD) is a neurodegenerative disorder lacking any curative treatment up to now. Indeed, actual medication given to the patients alleviates only symptoms. The cytosolic phospholipase A2 (cPLA2-IVA) appears as a pivotal player situated at the center of pathological pathways leading to AD and its inhibition could be a promising therapeutic approach.
Objective:
A cPLA2-IVA inhibiting peptide was identified in the present work, aiming to develop an original therapeutic strategy.
Methods:
We targeted the cPLA2-IVA using the phage display technology. The hit peptide PLP25 was first validated in vitro (arachidonic acid dosage [AA], cPLA2-IVA cellular translocation) before being tested in vivo. We evaluated spatial memory using the Barnes maze, amyloid deposits by MRI and immunohistochemistry (IHC), and other important biomarkers such as the cPLA2-IVA itself, the NMDA receptor, AβPP and tau by IHC after i.v. injection in APP/PS1 mice.
Results:
Showing a high affinity for the C2 domain of this enzyme, the peptide PLP25 exhibited an inhibitory effect on cPLA2-IVA activity by blocking its binding to its substrate, resulting in a decreased release of AA. Coupled to a vector peptide (LRPep2) in order to optimize brain access, we showed an improvement of cognitive abilities of APP/PS1 mice, which also exhibited a decreased number of amyloid plaques, a restored expression of cPLA2-IVA, and a favorable effect on NMDA receptor expression and tau protein phosphorylation.
Conclusions:
cPLA2-IVA inhibition through PLP25 peptide could be a promising therapeutic strategy for AD.
Introduction
Alzheimer’s disease (AD) is a neurodegenerative disorder characterized by a progressive and irreversible loss of the cognitive functions. The two main hallmarks of AD are the extracellular accumulation of amyloid-β peptide (Aβ) leading to the formation of amyloid plaques (AP), and the intracellular aggregation of the hyperphosphorylated tau protein forming neurofibrillary tangles.
Actual approved therapies for AD include cholinesterase inhibitors (donepezil, galantamine, and rivastigmine) and the NMDA receptor (NMDAR) antagonist memantine. However, these drugs are mainly symptomatic and only slow the disease progression with very limited effects. Since the approval of memantine by the FDA in 2003, no new drug was approved for AD therapy. Despite an active research in this field, more than 95% of new candidates failed during clinical trials [1].
Many therapeutic strategies were focused on Aβ or tau protein because of their direct involvement in AD (modulation of Aβ production, improvement of Aβ clearance, blocking of Aβ and tau aggregation, etc.), as well as on neuroinflammation and neurotransmitters [2–4]. Nevertheless, none of these strategies gave convincing results to date, and the AD therapy remains a real challenge. Faced with this observation, it is necessary to move towards other strategies targeting different key phenomena observed in AD.
The cytosolic phospholipase A2 (cPLA2-IVA) is a hydrolytic enzyme cleaving phospholipids at the sn-2 position, preferentially releasing arachidonic acid (AA) from phosphatidylcholine (PC) [5]. AA and its metabolites are beneficial under physiological conditions and are involved in synaptic plasticity and long-term potentiation (LTP) [6–8]. However, AA is the principal substrate of cyclooxygenases and lipoxygenases involved in the production of inflammatory mediators such as prostaglandins and leukotrienes. Interestingly, cPLA2-IVA is found overexpressed and/or overactivated in AD [9, 10], leading to an important production of AA and inflammatory mediators, but also to reactive oxygen species (ROS) generation [11–13]. These molecules are directly involved in Aβ production by modulating amyloid-β protein precursor (AβPP) expression and secretases activity [14–17], in tau protein phosphorylation [18–23] and in apoptosis [24]. In parallel, Aβ itself can activate cPLA2-IVA [24–26], leading to the exacerbation of its activity and the establishment of a vicious circle between cPLA2-IVA and Aβ. It was shown that the cPLA2-IVA KO protects mice from spatial memory loss induced by Aβ injection and neurons against apoptosis [27]. This latest point was also seen in vitro with the use of anti-sense oligonucleotides against cPLA2-IVA[24, 28].
Interestingly, cPLA2-IVA also plays a key role in other CNS diseases such as Parkinson’s disease [29] or multiple sclerosis [30], and in other troubles, i.e., rheumatoid polyarthritis [31], pulmonary fibrosis [32], allergies [33], and cancers [34–36].
Due to its obvious involvement in many pathologies, the interest in cPLA2-IVA as therapeutic target was explored and some inhibitors were developed. They protect neurons from Aβ-induced apoptosis [28, 37] or decrease the severity in the Experimental Autoimmune Encephalomyelitis [38], a mouse model of multiple sclerosis, but most of them are non-specific and/or irreversible, leading to adverse effects [39, 40]. Some natural products show indirect modulation of the cPLA2-IVA, such as Gingko biloba [41] or lithium [42]. More recently, the use of anti-sense oligonucleotides or antibodies showed interesting effects in AD as previously mentioned, but also in the amyotrophic lateral sclerosis [43] or in ischemic injury [44].
We identified by phage display a peptide able to inhibit the cPLA2-IVA. Being an important enzyme in physiologic processes such as in LTP or inflammation, our strategy was to indirectly modulate its activity and reversibly block its binding to its substrate. For this purpose, the phage display was performed against the C2 domain of the cPLA2-IVA involved in translocation and binding to membrane phospholipids.
The hit peptide PLP25, associated to the C2 domain by binding to the Ca2+ ions and phospholipid headgroups epitope shown by in silico docking analysis, was able to reduce in vitro the AA released by H2O2- or glutamate-stimulated cells, this effect being accentuated by coupling to another peptide (LRPep2) identified by our team and able to cross the blood-brain barrier (BBB) [45]. We also showed that PLP25 acts on cPLA2-IVA intracellular translocation and on cellular processes connecting cells. In vivo, PLP25 contributed to memory improvement in an AD mouse model and reduced AP and phosphorylation of tau in brain. Moreover, PLP25-treated mice showed a cPLA2-IVA and NMDAR expression in the range of healthy mice, as compared to non-treated AD mice. Taken together, these results show the potential of the cPLA2-IVA as a therapeutic target in AD.
Material and Methods
Phage display experiments
The identification of specific peptides against cPLA2-IVA was performed by the screening of a random library of linear dodecapeptides (Ph.D.-12, New England Biolabs Inc., Bioké, Leiden, The Netherlands) against the C2 domain of the cPLA2-IVA (C2-cPLA2-IVA, Recombinant cPLA2, MyBioSource, San Diego, USA), as previously described [45]. Selection steps were the evaluation of (a) the apparent dissociation constant (K*d) reflecting the affinity of phage clones to the C2-cPLA2-IVA, and (b) the half-maximal inhibitory concentration IC50, reflecting their ability to block the binding of cPLA2-IVA to PC. For the Kd* determination, a range of 10 concentrations for each phage clone was used, reflecting dose-dependence binding to this domain. Complete protocols concerning these specific steps are available in Supplementary Methods.
Selected peptides were synthesized coupled with biotin at their N-terminus (Eurogentec, Seraing, Belgium), allowing their detection. The biotin was spaced from the peptides by a small polyethylene glycol molecule (PEG; 8-amino-3,6-dioxaoctanoic acid). The C-terminus was blocked by amidation.
Evaluation of the peptides’ binding to brain slices by immunohistochemistry (IHC)
Brain slices obtained from healthy NMRI (Naval Medical Research Institute, Harlan, Horst, The Netherlands) and 2 years old APP/PS1 (B6.Cg-Tg(APPswe, PSEN1dE9)85Dbo/J, Guerbet, Aulnay-sous-Bois, France) mice were deparaffined by successive baths in toluene and alcohol 95% before being rehydrated in water. After three washes in TBS (Tris-Buffered Saline: Tris-HCl 50 mM, NaCl 150 mM, pH 7.4), endogenous peroxidases were inactivated with 200 μL of PBS (Phosphate-Buffered Saline: NaCl 137 mM, KCl 2.7 mM, Na2HPO4 10 mM, KH2PO4 1.76 mM, pH 7.4) containing H2O2 0.7% for 15 min. Slices were rinsed and endogen biotins were blocked using a Streptavidin/Biotin Blocking Kit (Vector Labconsult, Brussels, Belgium). After new washes, a final blocking step with PFBB (Protein-Free [TBS] Blocking Buffer, Pierce, Fisher Scientific, Brussels, Belgium) was done for 1 h.
Slices were rinsed in HCN buffer (HEPES 160 mM, CaCl2 20 mM, NaCl 300 mM, pH 7.4) supplemented with Tween-20 0.1% (HCN-T) and then in HCN before adding peptide solutions (20 μM in HCN) for an overnight incubation at 4°C. Blank was incubated with HCN.
After 3 washes in HCN-T, peptides were detected using the anti-biotin antibody made in goat (Vector Labconsult) prepared at 5 μg/mL in phosphate buffer 10 mM (Na2HPO4 •12 H2O 10 mM, NaH2PO4 •H2O 10 mM, NaCl 150 mM, pH 7.8) supplemented with Bovine Serum Albumin (BSA) 0.2% (1 h, room temperature). Slices were rinsed as previously before adding the anti-goat IgG antibody made in horse and coupled to biotin (Vector Labconsult; same concentration, same buffer, and same incubation time as for anti-biotin antibody). After washing in TBS-T and TBS, the Vectastain ABC complex (Vector Labconsult) prepared in TBS was added for 1 h at room temperature. After final washes in TBS and incubation for 5 min with Tris-HCl (Tris-HCl 50 mM, pH 7.4), the revelation was performed using DAB 0.05% solution (3,3′-Diaminobenzidine tetrachlorhydrate, Sigma-Aldrich, Bornem, Belgium) prepared in PBS and supplemented with 0.02% H2O2.
Slices were counterstained using Mayer’s Hemalun (VWR International, Leuven, Belgium), dehydrated by successive baths in alcohol, butanol, and toluene and mounted in permanent medium (Leica Microsystems, Groot Bijgaarden, Belgium). Slices were observed with a Leica DM2000 microscope equipped with a DFC 425 C camera (Leica Microsystems).
Cell culture
The pluripotent human testicular embryonal carcinoma cell line NT2/D1 (NTERA-2 clone D1, Sigma-Aldrich) was cultured in DMEM (4.5 g/L glucose, L-glutamine, sodium pyruvate) supplemented with fetal bovine serum (FBS) 10% and penicillin/streptomycin 1% (all from Fisher Scientific). These cells were maintained at high density (4.5 x 10⁵ cells/cm2 in T75 flasks) to avoid cell differentiation and allow cell multiplication.
For the different experiments, NT2/D1 cells were differentiated into neuron-like cells (NT2/D1n) by decreasing cell density (8x10⁴ cells/cm2 in T25 flasks) and exposing cells for 35 days to retinoic acid (RA) 10 μM (stock at 10 mM in DMSO, Sigma-Aldrich). Medium was renewed 3 times a week. At the end of the differentiation, cells were plated on the appropriate support. RA was used until the beginning of the experiment.
The human brain astrocytoma cells (1321N1, given by Dr Erneux, ULB, Brussels, Belgium) were cultured in the same culture medium as NT2/D1 cells except penicillin/streptomycin 2%.
The human differentiated hepatocytes (HepaRG, Life Technologies, Gent, Belgium) were cultured in William E medium without phenol red supplemented with FBS 10%, GlutaMAX 1% and Thaw, Plate & General Purpose Medium Supplement 13.4% (all from Fisher Scientific). For toxicity assays, Tox medium was used (William E without phenol red supplemented with GlutaMAX 1% and TOX supplement 13.4%, Fisher Scientific).
Multivalent complexes of PLP25
For in vitro experiments, PLP25 was coupled to LRPep2 using streptavidin and their respective biotin.
LRPep2 (HPWCCGLRLDLR, coupled to 8-amino-3,6-dioxaoctanoic acid [PEG2] at the N-terminus; Eurogentec) was biotinylated using the EZ-Link Sulfo-NHS-Biotin kit (Fisher Scientific), according to recommended protocol. Peptide solution was purified by dialysis (MWCO: 100–500 Da, Spectra/Por Dialysis membrane, Biotech CE Tubing, Spectrumlabs, USA) in H2Od. Biotinylated LRPep2 was retrieved by lyophilization and resolubilized in 1 mL of DMSO/H2Od 1 : 5. The LRPep2 concentration was determined with Pierce Biotin Quantitation Kit (Life Technologies).
Streptavidin from Streptomyces avidinii (Sigma-Aldrich) was solubilized in sterile distillated H2O at a concentration of 334 μM. The multivalent complexes were formed by mixing biotinylated peptides and streptavidin in specific stoichiometries depending on the desired complexes, i.e., streptavidin 100 μM, PLP25 300 μM, and 100 μM LRPep2 for St-(PLP25)3-(LRPep2)1, for 2 h on a rotator. The complexation feasibility was verified by mass spectrometry with ESI source (WATERS LC-Q-Tof Ultima, Waters Corporation, Milford, USA).
In vivo, the selected complex St-(PLP25)3-(LRPep2)1 was replaced by a synthetic covalently coupled complex called MAP-(PLP25)3-(LRPep2)1. This complex was formed by covalent linkage of the N-terminus of PLP25 and LRPep2 peptides on a dendrimer (MAP - Multiple Antigenic Peptides; Biosynthesis, Lewisville, USA), spaced from it by PEG4, whereas C-terminus extremities were blocked by amidation aiming to avoid unspecific off-target binding of this pharmacological compound. The functional groups on lateral chains of amino acids were not involved in covalent linkages to optimize the specific target binding.
Dosage of the AA released by cells
1321N1 and NT2/D1n cells were plated on 96-well plate (3 x 10⁴ cells/well) and used three days later.
Cells were pre-incubated with PLP25 (alone, multivalent or coupled to LRPep2) at the desired concentration (the PLP25 concentration used as reference) for 30 min before adding for 2 h H2O2 500 μM on 1321N1 or glutamate 50 μM (prepared at 5 mM in PBS, Sigma-Aldrich) on NT2/D1n. Negative (non-inhibited and non-stimulated [medium only at both steps] cells) and positive controls (non-inhibited [medium only] and stimulated [H2O2 or glutamate] cells) were treated in the same way.
At the end of the incubation, supernatants were collected, centrifuged 15 min at 1000 g and 4°C and the AA was analyzed the same day using the Human Arachidonic Acid ELISA kit (MyBiosource) according to the manufacturer’s protocol.
In parallel, cells were rinsed with warm PBS, detached using TrypLE (Fisher Scientific), and centrifuged 10 min at 3000 rpm. The cells were then lysed in 50 μL of lysis buffer (extraction buffer [Invitrogen™ Novex™ Cell Extraction Buffer, Fisher Scientific] supplemented with protease inhibitors [Protease Inhibitor Cocktail, Sigma Aldrich; dilution 10x] and PMSF 1 mM [phenylmethanesulfonyl fluoride, Sigma Aldrich]). At the end, cells were centrifuged 10 min at 13000 rpm and 4°C. Protein concentration was determined in supernatants using the BCA assay kit (Thermo Scientific Pierce BiCinchoninic Acid assay, Fisher Scientific) according to the manufacturer’s protocol.
AA concentrations (in ng/mL) were individually normalized to the protein concentrations. Results were expressed as percentage of the positive control (established at 100%).
Detection of the cPLA2-IVA by immunofluorescence
Cells (1321N1 : 3x10⁴ cells, NT2/D1n: 7x10⁴ cells) were seeded on collagen precoated (200 μg/mL in PBS, dried overnight, rinsed with H2Od before use; Collagen solution, type I from rat tail, Sigma Aldrich) 4-well slides (Millicell EZ slide, Merck, Overijse, Belgium). Experiments were performed three days later.
Cells were treated with cPLA2-IVA stimulator (H2O2 500 μM or glutamate 50 μM) and 20 μM of peptides St-(PLP25)3-(LRPep2)1 or of non-specific peptide (NSP) according to the same protocol as described previously in a total volume of 600 μL. All dilutions were done in medium containing FBS 0.2% (without RA for NT2/D1n).
Aiming to determine the IC50 of MAP-(PLP25)3-(LRPep2)1 to inhibit cPLA2-IVA translocation within cell processes, NT2/D1n cells were treated with a range of peptide complex concentrations (2, 4, 6, and 8 μM) or with non-specific peptide NSP2 (both used further in in vivo studies) at the same concentrations. Positive control cells were treated with glutamate alone and were used to determine the maximal effect (Emax: 100%) induced by glutamate on cPLA2-IVA translocation. The inhibitory effect produced by peptides on this cellular phenomenon was expressed in percentage compared to Emax (% E/Emax). The IC50 value was estimated using SigmaPlot® 11.0 software after cPLA2-IVA observation by immunofluorescence as explained below.
The detection of cPLA2-IVA was performed by fixing cells with methanol 100% (10 minutes, -20°C), blocking with PFBB (1 h, room temperature), and using a goat polyclonal anti-cPLA2 [153–166] antibody (Antibodies-Online GmbH, Aachen, Germany) prepared at 10 μg/mL in PBS (4°C overnight incubation) and a horse anti-goat IgG antibody coupled to Dylight 594 (Vector Labconsult) prepared at 20 μg/mL in phosphate buffer supplemented with BSA 0.5% (1 h, room temperature). Cells were rinsed 2 times with PBS between each step. Slides were mounted using the Vectashield Mounting Medium with 4’,6-diamidine-2’-phenylindole dihydrochloride (DAPI, Vector Labconsult) and observed using EL600 fluorescent light source on the LEICA DM2000 microscope.
The cPLA2-IVA staining in cell processes was quantified using the ImageJ software. Fluorescence pictures were converted to grey scale (8-bit) and the option INVERT LUT was used to better visualize cells. Then a threshold allowing the isolation of the processes (and excluding the cell bodies) was established on the negative control pictures and applied on other conditions. The application of this threshold provides a mask corresponding to the signal to quantify using the particle analysis in the software (Supplementary Figure 1).
Toxicity assay (MTT) on HepaRG cells
HepaRG cells were seeded (day 0) at 1.4x10⁴ cells/well in 96-well plate. The medium was changed on day 1 and day 4 by Tox medium. On day 7, cells were incubated for 2 or 24 h with MAP-(PLP25)3-(LRPep2)1 prepared at 200 μM, 20 μM, 2 μM, and 0.2 μM in Tox medium (100 μL/well). Controls were incubated with Tox medium.
At the end of the incubation, cells were rinsed with PBS before adding 100 μL of Tox medium and 10 μL of MTT (3-[4,5dimethylthiazol-2-yl]-2,5-diphenyl tetrazolium bromide, Sigma Aldrich) per well. After 3 h of incubation (37°C, 5% CO2), the plate was centrifuged, the supernatants were discarded, and purple formazan crystals were dissolved with 100 μL of DMSO (Sigma Aldrich). The absorbance was read at 570 nm (differential filter 690 nm).
Results are expressed as percentage of viability compared to negative control cells (not incubated with peptide), established at 100%.
In vivo administration of PLP25 peptide targeting cPLA2-IVA
All in vivo experiments are approved by UMONS Animal Care and Use Committee in accordance with the guidelines specified by EU directive (2010/63/EU) and the animal welfare service of SPF Wallonia (Agreement: LA1500020).
Mice used in our studies were: 1) male APP/PS1 mice (B6C3Tg(APPswe,PSEN1dE9)85Dbo/Mmjax, The Jackson Laboratory, Maine, USA) expressing two mutations associated to the familial form of AD (Swedish [K595N/M596L] on APP and truncated [exon 9 deletion] of PS1); 2) male control mice (C57BL/6J x C3H/Hej; B6C3Tg(APPswe,PSEN1dE9) 85Dbo/Mmjax NCAR Noncarrier, The Jackson Laboratory), these mice being the same strain as the transgenic mice without the mutations; 3) healthy NMRI mice (RjHan: NMRI, Janvier Laboratories S.A.S., St Berthevin, France).
MAP-(PLP25)3-(LRPep2)1 or NSP2 as control (N = 5 per group, 2 μmol/kg) were administrated to APP/PS1 mice by i.v. injection, starting from 5.5 months of age, 3 times per week for 6 weeks. First injection was performed 4 days after the first Barnes maze (see next section Barnes maze). The mice were anesthetized with isoflurane 2% (Tem Sega, Lormont, France) in O2 1 L/min.
Barnes maze
Mice were acclimated to the Barnes maze before starting to learn (day 1) and the test was performed according to a protocol adapted from the literature [46]. The learning was done for 4 days (days 2 to 5), the protocol being performed 4 times per day with 15 min delay. At the end of learning, the tests were carried out once a week (first test at day 8 before the first peptide injection at day 12). Each session (learning and tests) was recorded using a camera (Hercules Dualpix HD720p) allowing to analyze four parameters: 1) the total time needed to perform the maze, 2) the primary time, corresponding to the time taken by the mouse to reach the hole leading to the hiding place on the platform of the Barnes maze, even if it does not fit into it, 3) the number of errors made over these two timings, and 4) the percentage of time spent in the quadrant of interest, corresponding to the quadrant centered on the hole leading to the hiding place.
Amyloid deposits detection by MRI
Aβ deposits were detected by MRI using USPIO-PHO, a MRI negative contrast agent developed by our laboratory [47–49]. The anesthesia (isoflurane 2%, 0.7 mL/L) was monitored during MRI acquisitions (respiration rate) and the body temperature was maintained at 37°C.
MRI images were acquired with a T2-weighted RARE (Rapid Acquisition with Relaxation Enhancement) imaging protocol (TR/TE=3000/60 ms, RARE factor = 4, NEX = 6, FOV = 2.5 cm, matrix = 512x512, spatial resolution = 48 μm x 48 μm, TA = 38 min 24 s) on a 300 MHz 7T Bruker Pharmascan imaging system (Bruker, Ettlingen, Germany) equipped with a horizontal magnet and a circular polarized MRI transceiver coil (55 x 23 mm, 3 MHz, maximum RF of 5 ms). USPIO-PHO was injected in the tail vein (0.2 mmol Fe/kg) after a pre-contrast acquisition and a follow-up until 90 min post-injection was performed.
The negative contrast observed on MRI images, caused by the targeting of Aβ with USPIO-PHO, was determined by measuring the surface occupied by black pixels (total area and % Area) using the ImageJ software. After ROI selection, a threshold of black pixels established on the pre-contrast images was then transferred to the post-contrast images.
Brain and blood collection for immunohisto-chemistry and measurement of plasma ALT, creatinine, blood urea nitrogen, and glucose
After MRI experiments, mice were sacrificed by a lethal dose of Nembutal (500 mg/kg i.p., Sanofi, Brussels, Belgium). The brains were harvested, placed in PBS to be briefly rinsed before placing them in paraformaldehyde 4% for 24 h. Brains were dehydrated by successive baths of alcohol and butanol and finally were embedded in paraffin. Paraffin embedded brains were then cut in 5 μm thickness slices. IHC were performed on slices passing through the hippocampus, allowing to observe the cortex and the hippocampus on the same slice.
Blood was collected on heparin and plasma was recovered after blood centrifugation at 7000 rpm for 30 min. Alanine transaminase (ALT, a biomarker of liver damage), creatinine, and blood urea nitrogen (BUN) (biomarkers of kidney function) as well as glucose were measured using the mouse ALT ELISA kit (Antibodies.com Europe AB, Stockholm, Sweden), creatinine colorimetric assay kit (VWR International, Leuven, Belgium) and SPOTCHEM II Multi Panel-1 kit (ARKRAY, Inc, Kyoto Japan) respectively, using the manufacturers’ operation procedures. Briefly, the mouse ALT ELISA kit is based on a sandwich ELISA principle, creatinine measurement uses the Jaffe’s colorimetric reaction, whereas BUN and glucose were measured on SPOTCHEMTM EZ SP-4430 equipment (ARKRAY, Inc.).
Amyloid plaques detection by IHC
AP were detected using the mouse monoclonal anti-Aβ 17–24 (clone 4G8) antibody (Biolegend, London, England), prepared at 1 μg/mL in PBS, and the goat anti-mouse IgG antibody coupled to peroxidase (Abcam, Cambridge, England), prepared at 4 μg/mL in phosphate buffer pH 7.2 supplemented with BSA 0.5% and Tween-20 0.05%, following the protocol described previously [47].
Detection of AD-relevant biomarkers by IHC
Brain slices were deparaffined and rehydrated before antigen retrieval in citrate buffer (C6H5Na3O7 •2H2O 10 mM, pH 6.0) supplemented with Tween-20 0.05%. Brain slices were then incubated with PBS/H2O2 0.7% for inhibition of endogen peroxidases, Streptavidin/Biotin Blocking Kit for endogen biotins and PFBB as described above.
The biomarkers studied and the antibodies used were: cPLA2-IVA, anti-cPLA2 [153–166] antibody (5 μg/mL) and the horse anti-goat IgG antibody coupled to biotin at 20 μg/mL in phosphate buffer pH 7.8 containing Tween-20 0.1%; NMDAR, rabbit polyclonal anti-GRIN1 antibody (2.5 μg/mL, MyBiosource) and a goat anti-rabbit IgG antibody coupled to biotin (Vector Labconsult) at 10 μg/mL in phosphate buffer pH 7.8; phosphorylated tau protein, rabbit anti-P-tau (Ser199) antibody (8 μg/mL, Antibodies-Online) and the goat anti-rabbit IgG antibody coupled to biotin (15 μg/mL in phosphate buffer); APP, rabbit anti-AβPP (Amyloid beta A4 Precursor Protein [380–430], 10 μg/mL, Antibodies-Online) and the goat anti-rabbit IgG antibody coupled to biotin (20 μg/mL in 0.1% Tween-20 phosphate buffer). Primary antibodies were prepared in PBS.
The end of the protocol is identical to the previously described one (Vectastain ABC complex, Tris-HCl, DAB). Negative controls by omission of primary or secondary antibodies or by substitution of specific antibodies by non-immune serum in the procedure were used to test the specificity of the IHC. No labeling was detected in the tissue section under such conditions.
The staining obtained on brain slices was quantified similarly as previously described. In this case, the threshold was specifically determined to isolate DAB staining in cell bodies (Supplementary Figure 2).
Statistical analysis
The SigmaPlot® software was used for statistical analysis of the results. The normality of data distribution was checked by a Shapiro-Wilk test. For non-normal data distribution, the Mann-Whitney test was employed to evaluate the significance of group differences. For the normally distributed data, the equality of variances was checked by a Brown-Forsythe test. The Student t test was used to evaluate the difference between groups, with a p < 0.05 being considered as statistically significant.
Results and discussion
Characteristics of C2-cPLA2-targeted peptides
The therapeutic strategy of this work is based on the targeting of C2-cPLA2-IVA with phage display-derived peptides to indirectly modulate the enzyme’s activity by preventing its binding to cell membrane phospholipids, while preserving its basal activity.
The pool of phages obtained after three rounds of panning was used to arbitrarily isolate 50 phage clones. Their affinity was evaluated by ELISA against C2-cPLA2-IVA and PFBB and their specific affinity to the target was calculated by the ratio of the two signals (Supplementary Figure 3A, B). Based on these results, 20 phage clones were selected thanks to their higher specific affinity compared to the mean value (16.79±6.77). DNA sequencing revealed 13 different peptide sequences (Table 1) with variable probabilities of expression. Interestingly, 5 sequences (expressed by clones 1, 2, 3, 6, 30, and 45) have low probabilities to be expressed in the library (p < 10%), suggesting their specific selection. Contrariwise, sequences with p > 90% (clones 31 and 39) are suggested to be more represented in the library, favoring their selection. The analysis of these sequences showed consensus amino acid motifs (PR, SF, WR, or HLL) with four of them (L, W, S, and R) having frequencies of appearance higher than the mean±SD (Fig. 1A). These amino acids play important roles in cPLA2-IVA activity, Leu and Trp being involved in the binding to hydrophobic chains of phospholipids and Arg to their polar heads [50], supporting the specific selection of these sequences.
Table 1
Amino acid sequences of the 20 clones isolated from the 3rd round of biopanning and their probability of expression in the phage library (P). Consensus motifs are underlined (PR, SF and WR with a simple underline, HLL with a bold underline)
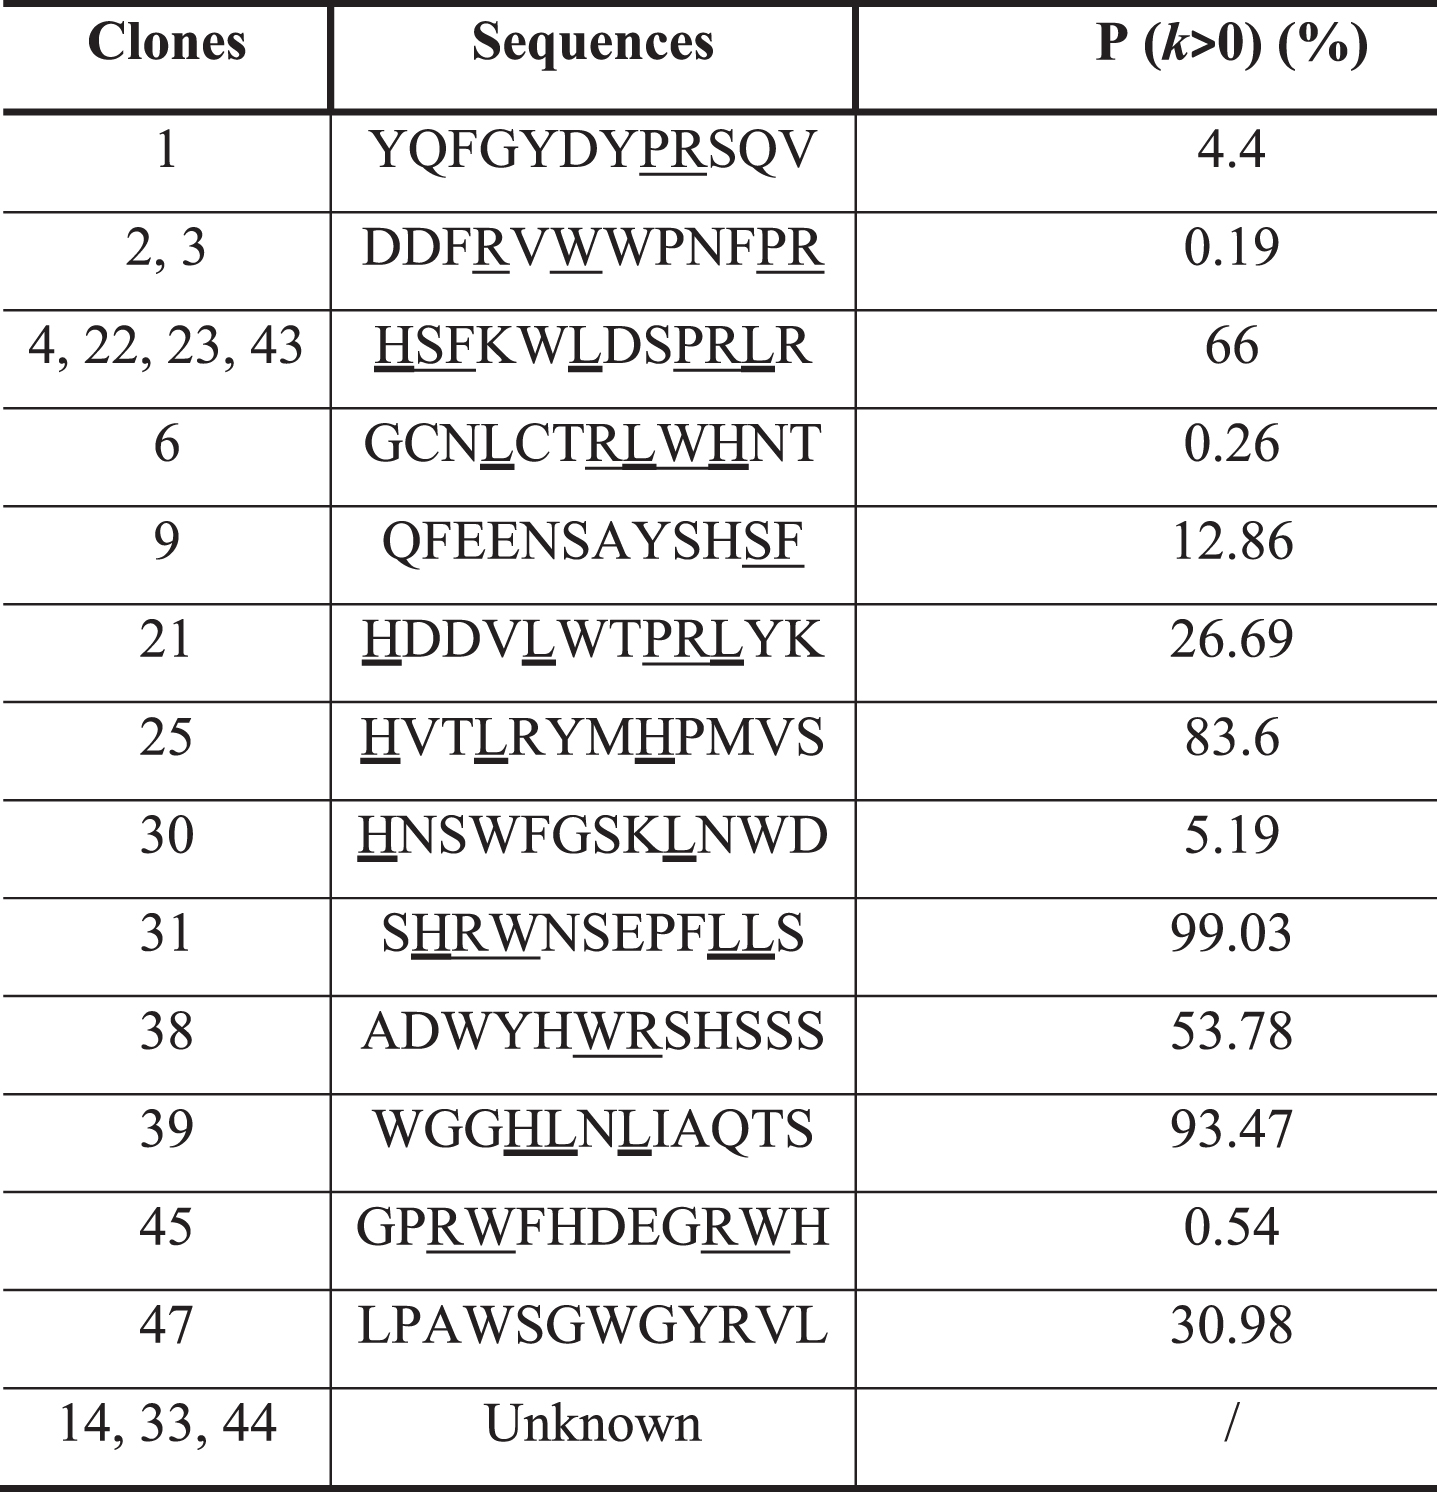 |
Fig. 1
A) Frequency of amino acids in the 13 different peptide sequences obtained after DNA sequencing. B) Apparent dissociation constants (K*d) of the 13 representative clones against the C2-cPLA2-IVA. In green: selected clones based on their low K*d, reflecting a high affinity. C) K*d and IC50 of the 6 best clones.
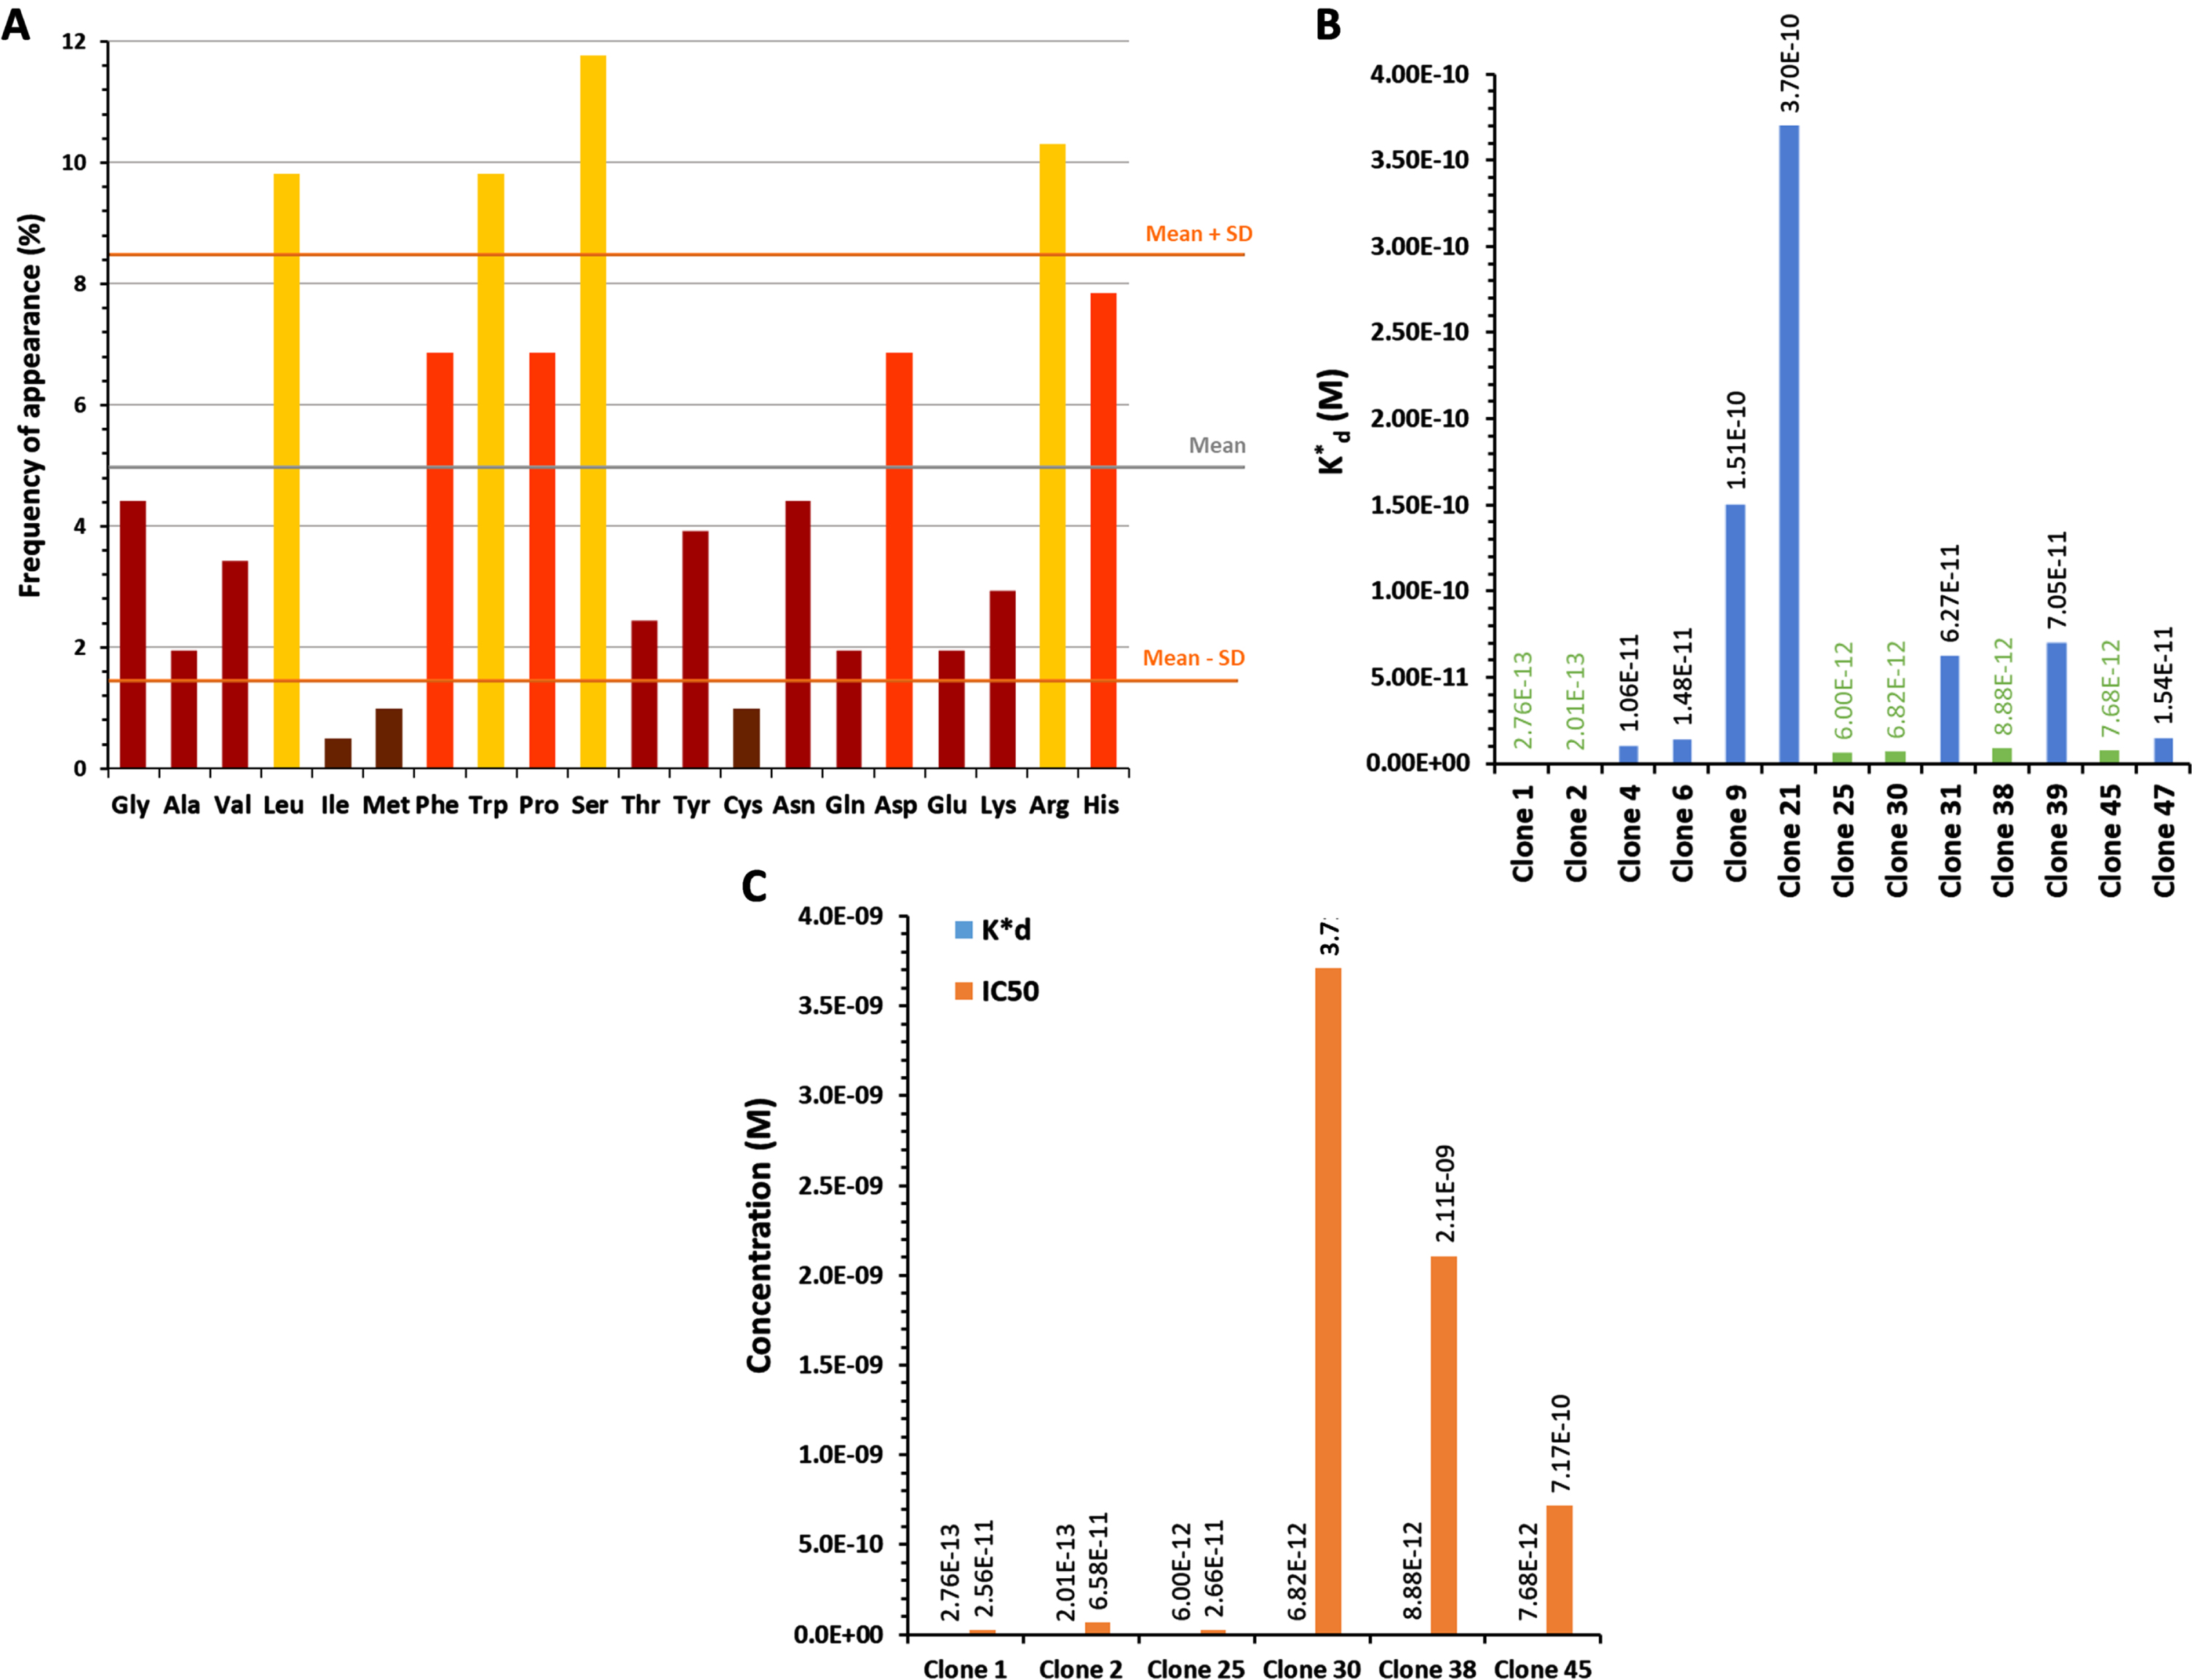
We evaluated the K*d of the clones expressing these 13 peptides (one clone per sequence) by ELISA (Fig. 1B, dose-dependence curves in Supplementary Figure 4). Among them, six were selected (clones 1, 2, 25, 30, 38, and 45 in green in the Fig. 1B) because of their higher affinity to the C2-cPLA2-IVA (K*d in the range of nanomolar, 10–9 M).
The final selection was based on the ability of these clones to inhibit the binding of C2-cPLA2-IVA to phospholipids, particularly to PC, by evaluating their IC50, reflecting the concentration needed to inhibit by 50% the binding of C2-cPLA2-IVA to its substrate. The IC50 was evaluated at a concentration of C2-cPLA2-IVA equal to its K*d for PC (3.12 •10–7 M or 312 nM, Supplementary Figure 5), revealing that clones 1, 2 and 25 have the most promising inhibitory potential (Fig. 1 C).
Selection of the most interesting cPLA2-IVA-targeted peptide: apparent affinity observed by IHC
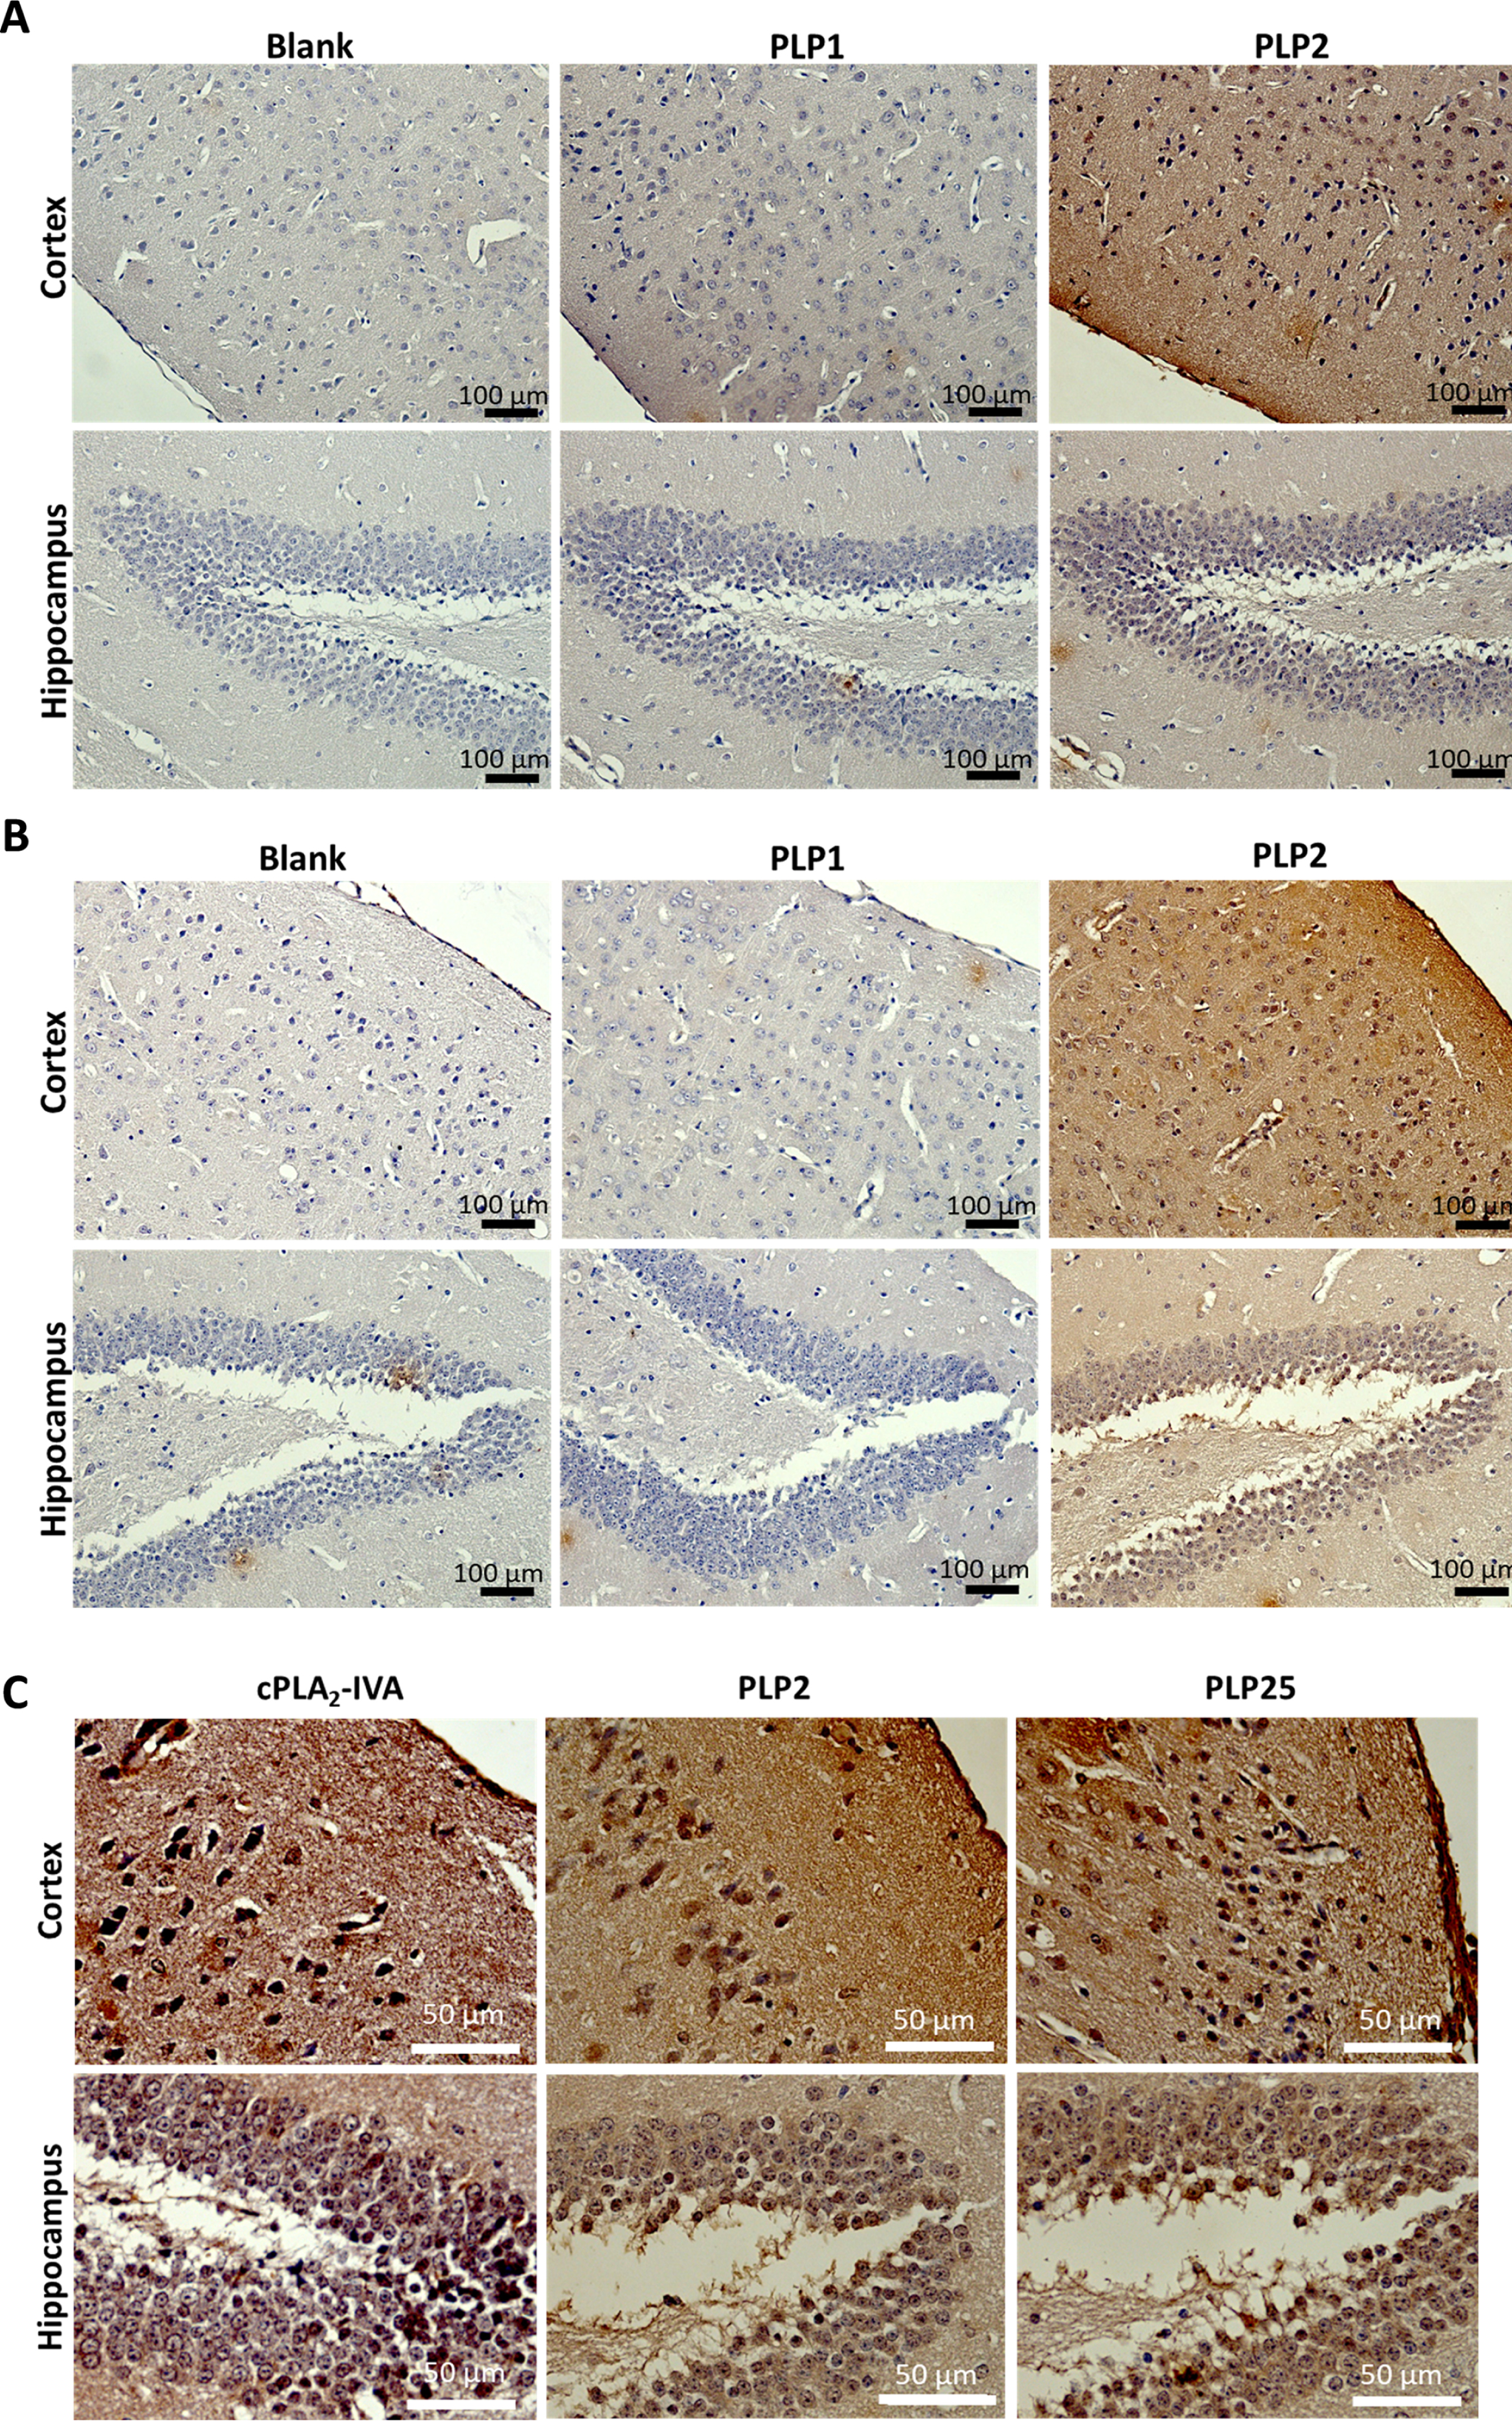
Peptides carried by clones 1, 2 and 25 were synthesized for a final selection: PLP1 (YQFGYDYPRSQV), PLP2 (DDFRVWWPNFPR), and PLP25 (HVTLRYMHPMVS) respectively. Their binding to cPLA2-IVA expressed in mouse brain was evaluated by IHC. This evaluation was performed on both healthy and aged APP/PS1 mouse brains, these last ones overexpressing the cPLA2-IVA (Supplementary Figure 6) as in AD [10]. PLP1 was unable to bind the brain tissue, whereas PLP2 and PLP25 allowed to obtain a good staining in both healthy and APP/PS1 mouse brain slices (Fig. 2A, B). Moreover, we observed a higher staining of APP/PS1 brain slices by PLP25 (Fig. 2B), probably linked to the target overexpression, this staining being similar to that obtained with anti-cPLA2-IVA antibody (Fig. 2 C). Based on these results, PLP25 was selected as a first potential therapeutic peptide, without total exclusion of PLP2.
Fig. 2
Detection of PLP1, PLP2, and PLP25 binding to NMRI (A) or APP/PS1 (B) brain slices. Peptides are in brown, highlighted by DAB. C) Comparison of the cPLA2-IVA staining with those obtained for PLP2 and PLP25 peptides in the cortex and the hippocampus of APP/PS1 mice.
In silico analysis of three selected peptides
Table 2 shows the theoretical biochemical properties of the three selected peptides (PLP1, PLP2, PLP25) estimated by the ExPaSy proteomics web server and the MarvinSketch 19.18 software. Figure 3A shows the three-dimensional structures of these peptides represented using ACD/ChemSketch 2015 and MarvinSketch 19.18 software.
Table 2
Theoretical biochemical parameters of PLP1, PLP2, and PLP25 determined by the ExPaSy proteomics web server and the MarvinSketch 19.18 software
| Theoretical biochemical parameters | PLP1 | PLP2 | PLP25 |
| pI | 5.83 | 5.96 | 8.76 |
| logP | –5.09 | –2.78 | –4.65 |
| Aliphatic index | 24.17 | 24.14 | 80.83 |
| T1/2 | 2.8 h | 1.1 h | 3.5 h |
Fig. 3
A) Tridimensional structures (upper pictures) and spatial conformations (lower pictures) of the PLP1, PLP2, and PLP25 peptides, drawn with ACD/ChemSketch 2.0 and MarvinSketch 19.2 software respectively. B) Predictive models of PLP1, PLP2, and PLP25 binding to the C2-cPLA2-IVA, determined by the HPEPDOCK software. 1) View of the area involved in the interaction of the C2-cPLA2-IVA to phospholipids. 2) Opposite view of the C2-cPLA2-IVA.
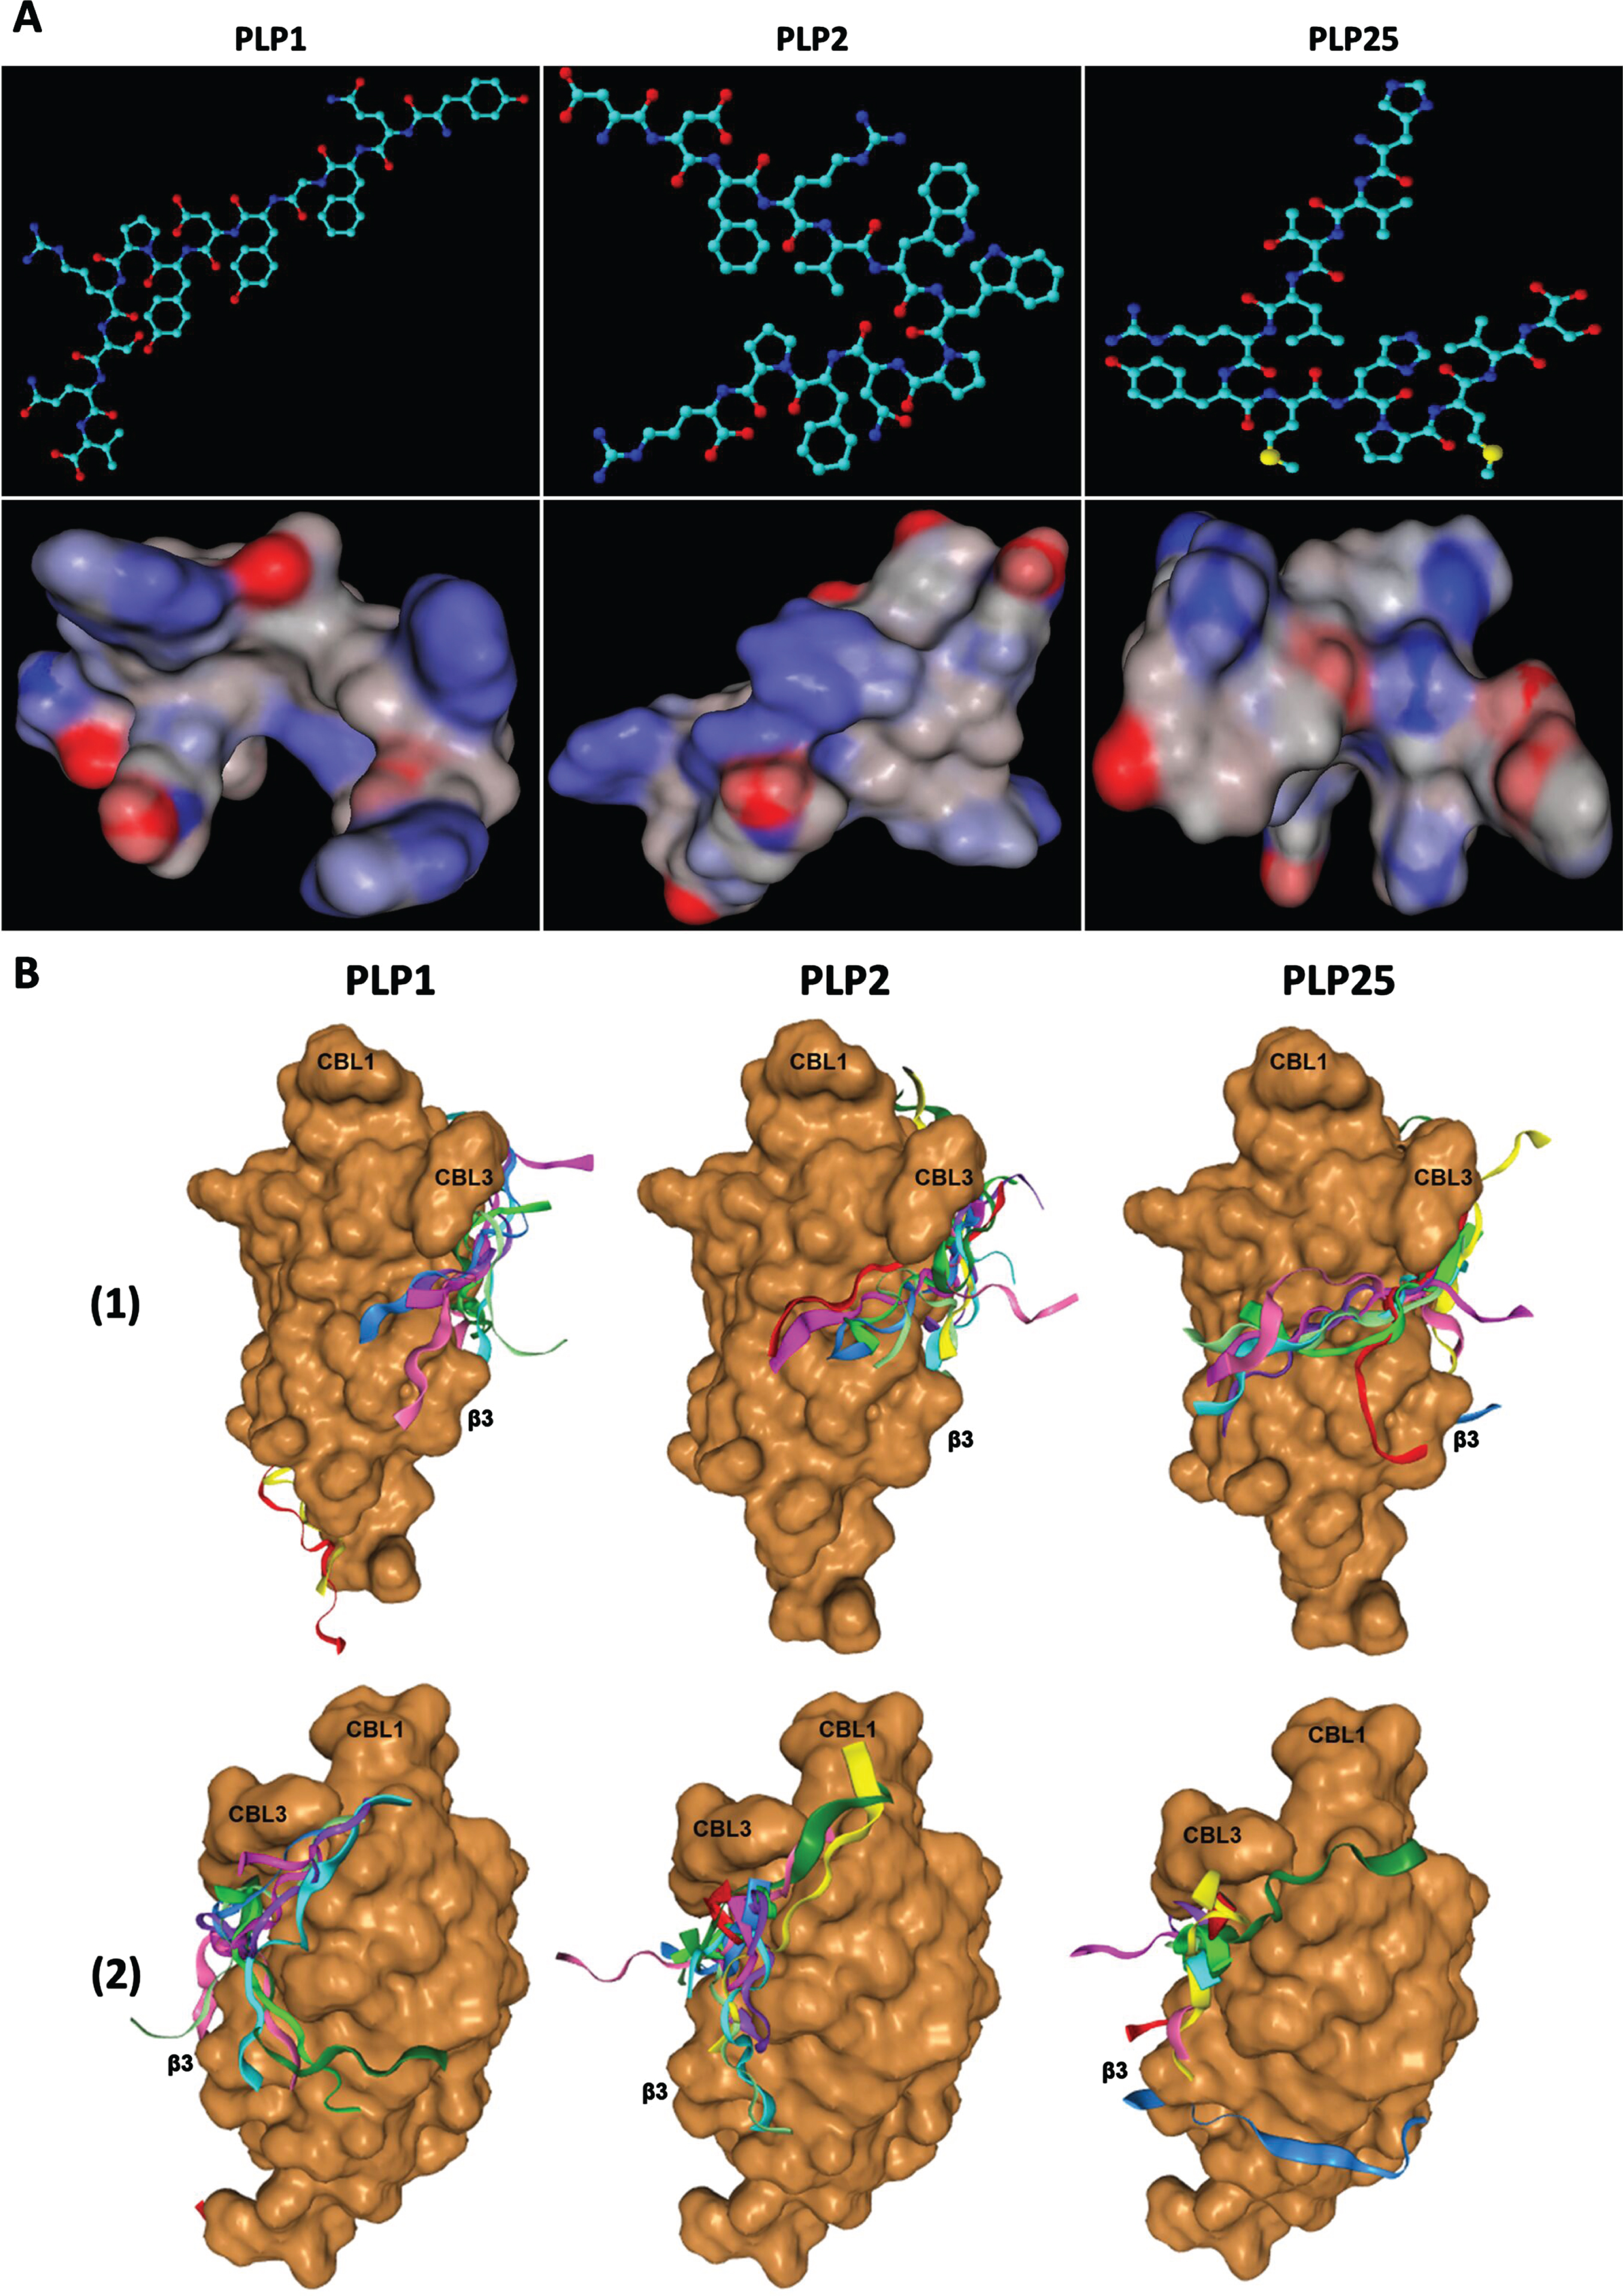
These three peptides contain many hydrophobic amino acids (Tyr, Phe, Trp, Val) (Table 1) putatively involved in their binding to C2-cPLA2-IVA. Indeed, the calcium binding loop (CBL) 1 and CBL3 of this domain have hydrophobic residues allowing their interaction with the hydrophobic chains of phospholipids. They also contain a Pro (induces a turn in the amino acid sequence), suggesting the importance of three-dimensional structure of the peptides for their binding to C2-cPLA2-IVA.
Interestingly, the PLP25 peptide has 3 positively charged residues (2 His and 1 Arg), while PLP1 and PLP2 have 1 and 2 respectively, these two peptides comprising also Asp, a negatively charged residue. PLP25 is globally positively charged at physiological pH, with an isoelectric point (pI) of 8.76 that may be responsible for its binding to the Ca2+ binding sites (preventing Ca2+ binding), located between the three CBL carrying negative charges. The hydrophobic residues of the peptide would interact with those of C2-cPLA2-IVA [50], preventing its interaction with phospholipids. Conversely, PLP1 and PLP2 are globally negatively charged at physiological pH (pI < 7.4). These two peptides are therefore likely to bind the cationic amino acids of the β-sheets of the C2 domain.
The aliphatic index corresponds to the volume occupied by the aliphatic side chains and reflects the hydrophobic character of peptides. The PLP25 peptide has a much higher aliphatic index than PLP1 and PLP2, reflecting a hydrophobic character likely able to facilitate its binding to C2-cPLA2-IVA; these three peptides are nevertheless relatively hydrophilic, shown by their negative logP values.
These hypotheses are corroborated by the analysis of the binding mechanism of these peptides to C2-cPLA2-IVA (Fig. 3B) thanks to the HPEPDOCK web server (http://huanglab.phys.hust.edu.cn/hpepdock/) [51]. Thus, PLP1 binds preferentially to the β-sheets of C2-cPLA2-IVA, with 5 models out of the 10 best predicted by the program being anchored to the protein region involved in its interaction with membrane phospholipids through electrostatic interactions [50]. PLP2 (6 models out of the best 10) and especially PLP25 (7 models out of the best 10) bind closer to CBL1 and 3, these loops being directly involved in the Ca2+ fixation and the binding to membrane phospholipids [50]. Moreover, PLP25 seems optimally anchored on the protein interface known to interact with the polar heads of membrane phospholipids, particularly at the level of the basic residues (R57, K58, R59, and R61) of β3-sheet of C2-cPLA2-IVA [50].
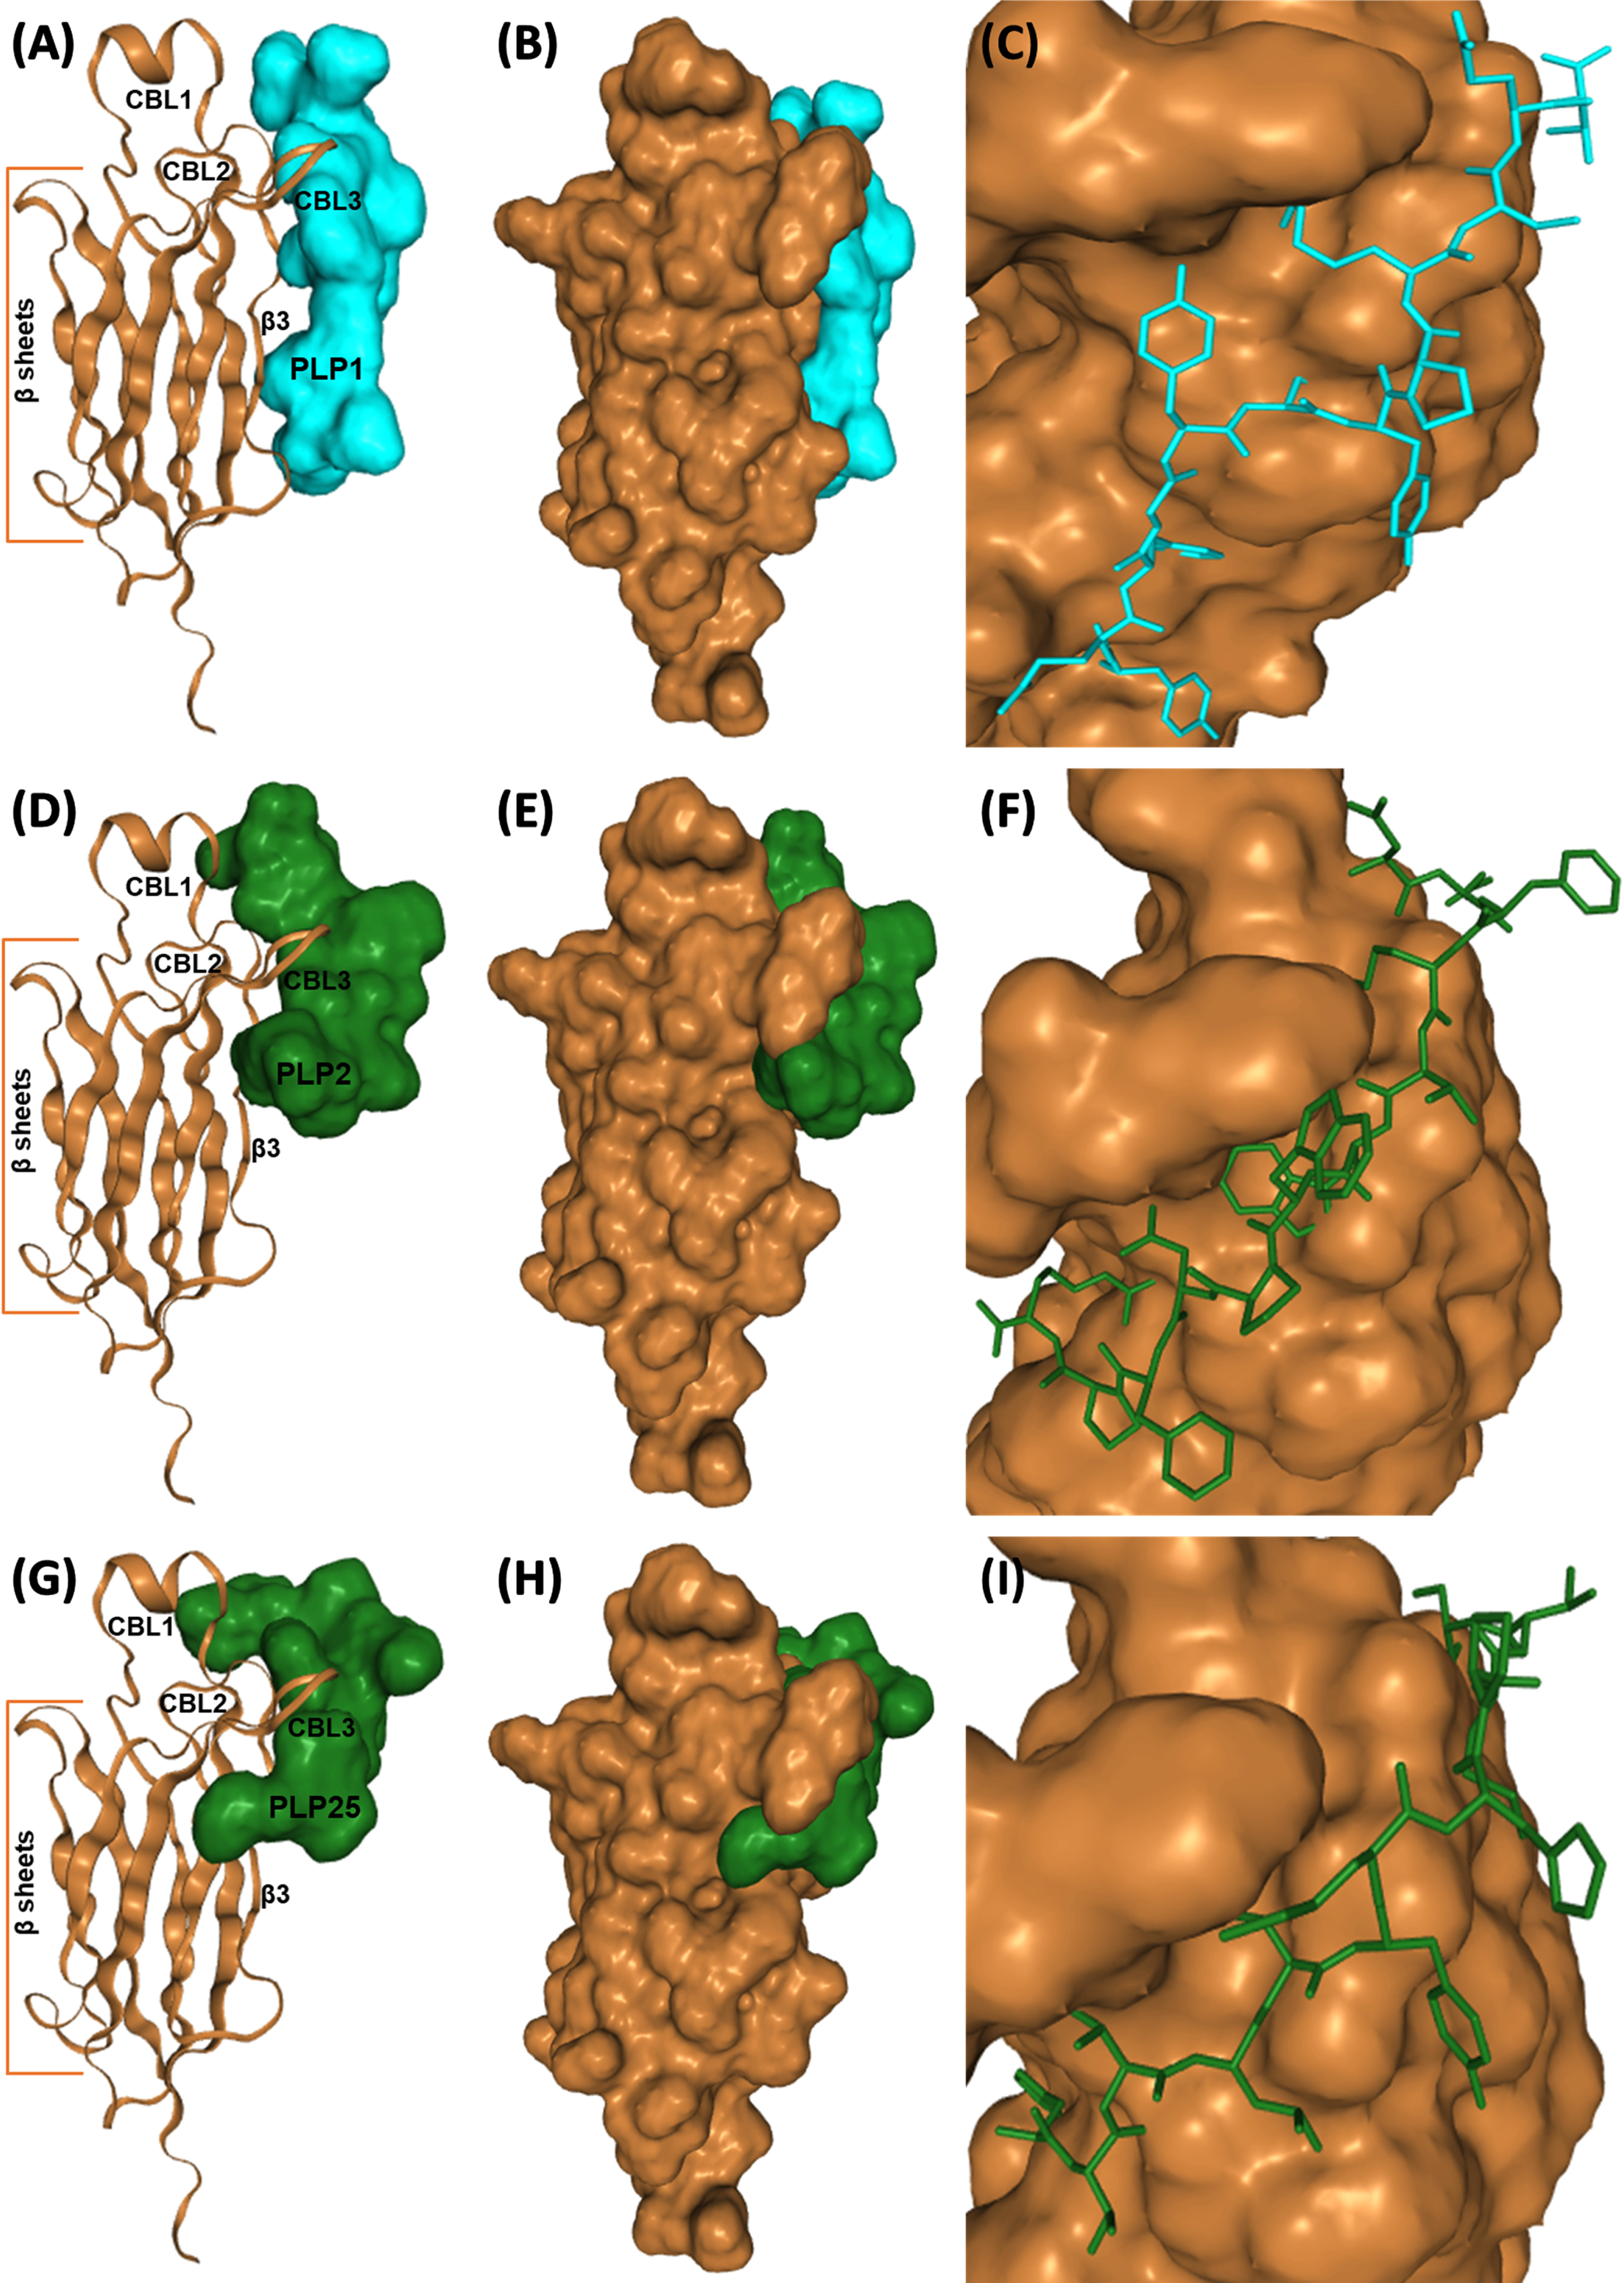
For each peptide, the best model was chosen to study their interactions in detail (Fig. 4). Interestingly, PLP25 binds at the Ca2+ binding site between the CBL1 and 3 loops, as well as with β3-sheet, the three-dimensional structure of this peptide allowing its intertwining within C2-cPLA2-IVA (Fig. 4 G) and maximum interaction with this domain (Fig. 4I). PLP2 shows a similar bond (Fig. 4D), but with an amino acid orientation suggesting a weaker interaction via a few residues in direct contact with CBL1, CBL3 and β3-sheet (Fig. 4F). PLP1 clearly shows an interaction with the β3-sheet and the CBL3(Fig. 4A).
Fig. 4
Interaction of PLP1 (A-C), PLP2 (D–F), and PLP25 (G–I) with C2-cPLA2-IVA predicted by the HPEPDOCK software. C2-cPLA2-IVA appears in brown, PLP1 in cyan, PLP2 and PLP25 in green (colors are depending on the chosen model).
To conclude, PLP2 and preferably PLP25 peptides are the most promising for the inhibition of cPLA2-IVA. Indeed, the binding of these peptides would prevent the translocation of the enzyme following the Ca2 + binding, and therefore inhibit cPLA2-IVA activity.
In vitro evaluation of PLP25 peptide alone or combined to LRPep2 peptide
Effect on the release of arachidonic acid by overactivated cPLA2-IVA
To verify the inhibitory potential of our peptide in vitro, we first evaluated the activity of cPLA2-IVA by assaying the AA released in the cell culture medium. Aiming to simulate pathological conditions specific to brain tissue in AD, 1321N1 astrocytic cells were stimulated with H2O2, while neuronal cells NT2/D1n were stimulated with glutamate, oxidative stress and glutamate excitotoxicity being two conditions known to activate cPLA2-IVA in AD. ROS are responsible for the activation of MAPK [52] activating cPLA2-IVA [25], while the activation of NMDAR by glutamate is directly related to the activation of this enzyme through Ca2+ inflow [7].
These studies were initially carried out on 1321N1 cells and aimed to optimize our enzyme inhibition protocol. Two concentrations of PLP25 were tested, 20 and 40 μM (20 •10–6 M and 40 •10–6 M), used alone or in combination with streptavidin (St-(PLP25)4) to obtain a multivalent pharmacological compound.
PLP25 reduced the amount of AA released by 1321N1 cells, with an effect varying from 20% to 60% depending on the concentration and type of compound (Fig. 5A). Using a higher concentration of PLP25 does not lead to a better inhibition, both for monovalent or multivalent form. This may be explained by a tolerance phenomenon that could appear more quickly at 40 μM (40 •10–6 M) [53] or by a steric hindrance phenomenon. On the other hand, the multivalent complex induces a significant inhibitory effect at both 40 μM (40 •10–6 M, p < 0.05) and 20 μM (20 •10–6 M, p < 0.001), which could be explained by a greater avidity of St-(PLP25)4, similar to that observed when peptides are fused to the pIII protein of the M13 bacteriophage [54].
Fig. 5
Inhibitory effect of PLP25 (alone or multivalent) evaluated by the dosage of AA released by 1321N1 (A, B, and D) and NT2/D1n (C and E) cells. Negative control corresponds to non-stimulated and non-inhibited cells, positive control to cPLA2-IVA-stimulated cells (H2O2 in 1321N1, glutamate in NT2/D1n). The inhibitory effect is expressed as percentage compared to the positive control. Results are normalized to protein content and the positive control of the day. *p < 0.05, **p < 0.001 (Student’s t-test).
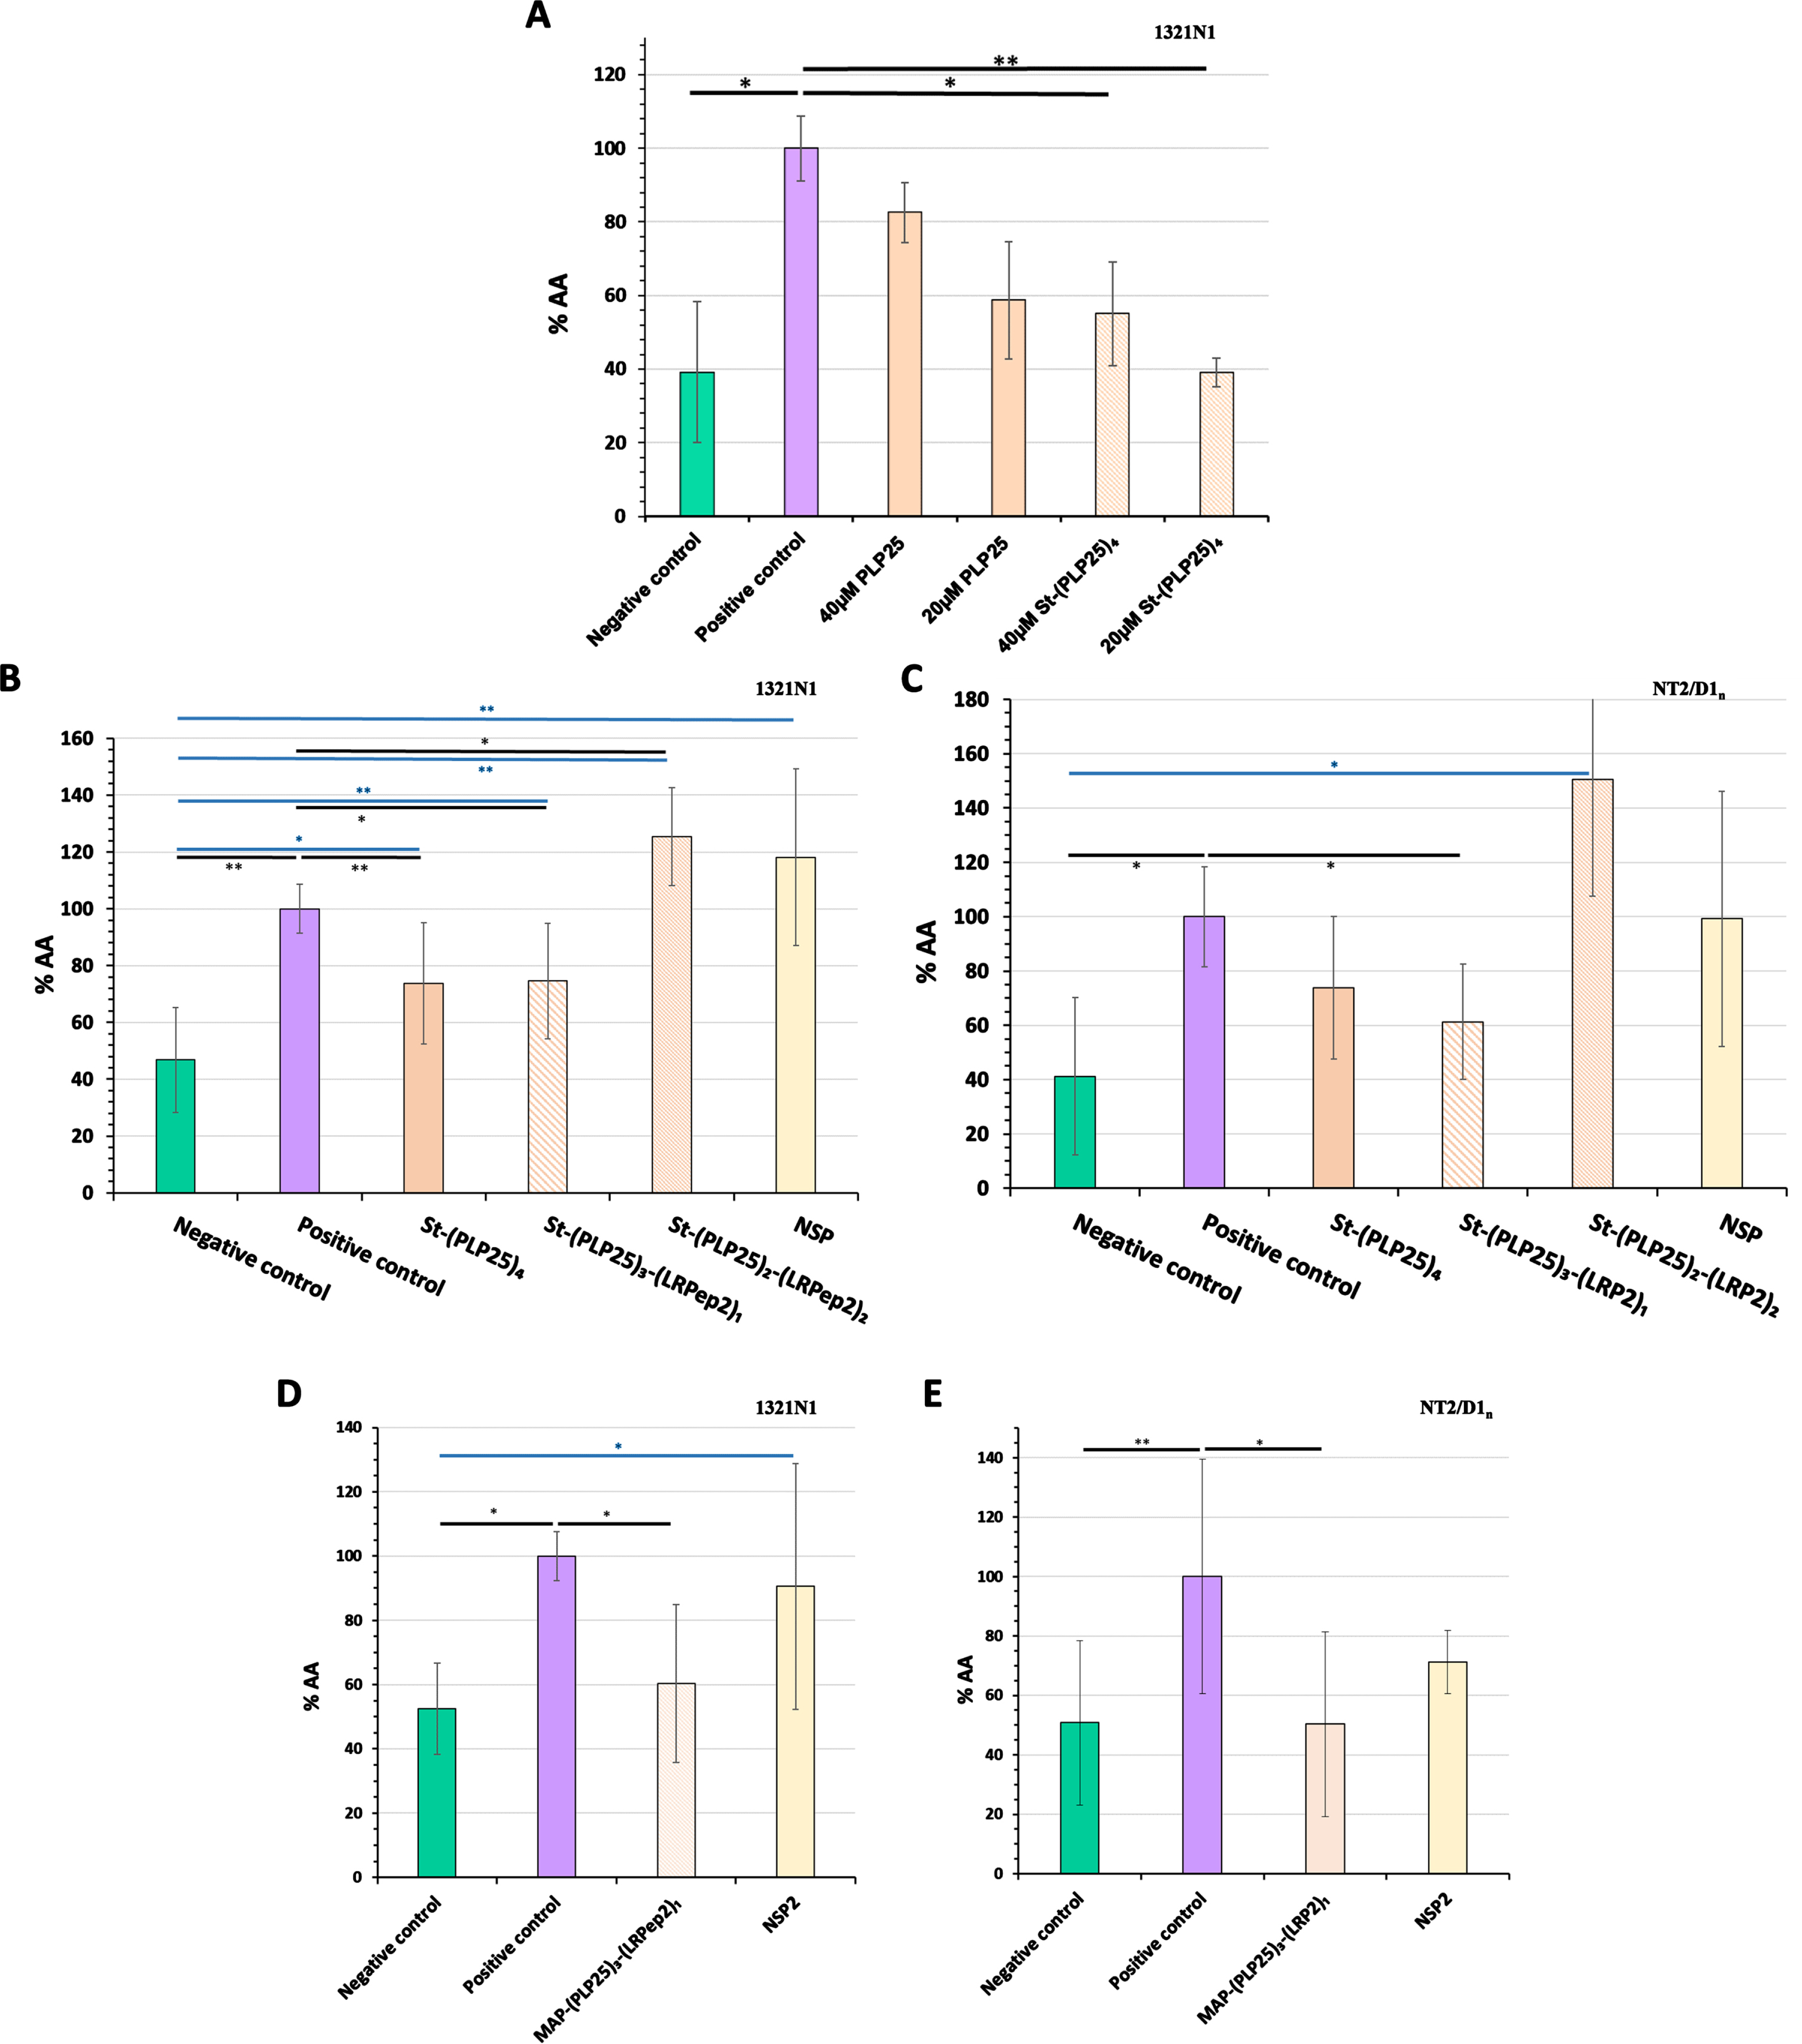
Subsequently, we have integrated the LRPep2 peptide into the multivalent complex aiming to facilitate the BBB passage of PLP25 in vivo and characterized in vitro the complexes that can be formed based on the streptavidin tetravalence, namely St-(PLP25)3-(LRP2)1 and St-(PLP25)2-(LRP2)2, aiming to verify if LRPep2 integration prevents the pharmacological effect of PLP25.
These multivalent complexes were tested on 1321N1 (Fig. 5B) and NT2/D1n (Fig. 5C) cells. NSP has been used as a control peptide during our various validation tests of PLP25.
H2O2 on 1321N1 cells and glutamate on NT2/D1n cells significantly increased the amount of AA released (1321N1: p < 0.001, NT2/D1n: p < 0.05). Among the two complexes integrating the peptide LRPep2, St-(PLP25)3-(LRPep2)1 shows a promising inhibitory effect, observable on 1321N1 (Fig. 5B, p < 0.05) and NT2/D1n (Fig. 5C, p < 0.05) cells. Interestingly, the inhibitory effect of the complex containing 3 PLP25 peptides seems to be minimally influenced by the loss of a PLP25 peptide. The integration of LRPep2 into the complex is suggested to promote the entry of PLP25 into the cells, which can potentiate the inhibitory effect of the latter as we observe very slightly in NT2/D1n cells. Conversely, St-(PLP25)2-(LRPep2)2 causes in both types of cells an increased release of AA beyond positive control (p < 0.05 for 1321N1). The low-density lipoprotein receptor (LDLR), targeted by LRPep2, is primarily involved in endocytosis mechanisms, but can also cause the activation of intracellular pathways via its intracellular domain that can interact with certain adaptive proteins. Some transduction pathways can be triggered following LDLR activation, including MAPK involved in the cPLA2-IVA activation [55–57]. In our case, the presence of 2 LRPep2 peptides could lead to a greater affinity for LDLR, which would indirectly trigger the activation of cPLA2-IVA. Finally, the incubation of cells with NSP does not cause a significant change in the release of AA compared to positive control.
Taken together, these results confirm the potential of the PLP25 peptide to inhibit cPLA2-IVA, the St-(PLP25)3-(LRPep2)1 complex bringing the characteristics that interest us in this research, i.e., it comprises the LRPep2 to facilitate the BBB passage, while exerting a satisfactory inhibitory effect on cPLA2-IVA.
For in vivo studies, a MAP dendrimer allowed to covalently couple three PLP25 peptides and one LRPep2 peptide [MAP-(PLP25)3-(LRPep2)1]. The MAP-(PLP25)3-(LRPep2)1 complex inhibited cPLA2-IVA in 1321N1 (Fig. 5D) and NT2/D1n (Fig. 5E) cells, as already observed for the St-(PLP25)3-(LRPep2)1 complex, with an inhibitory effect of about 40%. The NSP2 used in these studies as a control peptide does not cause an effect on AA release.
Effect on cPLA2-IVA translocation within cells, observed by IF
Our therapeutic peptide PLP25 is specific to C2-cPLA2-IVA, which is responsible for the translocation to the cell membranes following an intracellular Ca2+ increase. The stimulation of cPLA2-IVA under our conditions should induce its relocation to the cell membranes, while the peptide should prevent this phenomenon. We have therefore detected cPLA2-IVA by IF in our two cell models (Fig. 6A).
Fig. 6
A) IF detection of the cPLA2-IVA in 1321N1 and NT2/D1n cells. cPLA2-IVA appears in red thanks to the Dylight594, nuclei in blue by the DAPI. White arrows highlight filopodia processes, green arrows lamellipodia. B, C) Total area stained by the cPLA2-IVA in the cell processes of 1321N1 (B) and NT2/D1n (C), measured by the ImageJ software after threshold determination allowing the isolation of processes from the cell body. D) Filopodia/lamellipodia ratio stained by the cPLA2-IVA in NT2/D1n cells. Negative control corresponds to non-stimulated and non-inhibited cells, positive control to cPLA2-IVA-stimulated cells (H2O2 in 1321N1, glutamate in NT2/D1n). * p < 0.05 (Mann-Whitney).
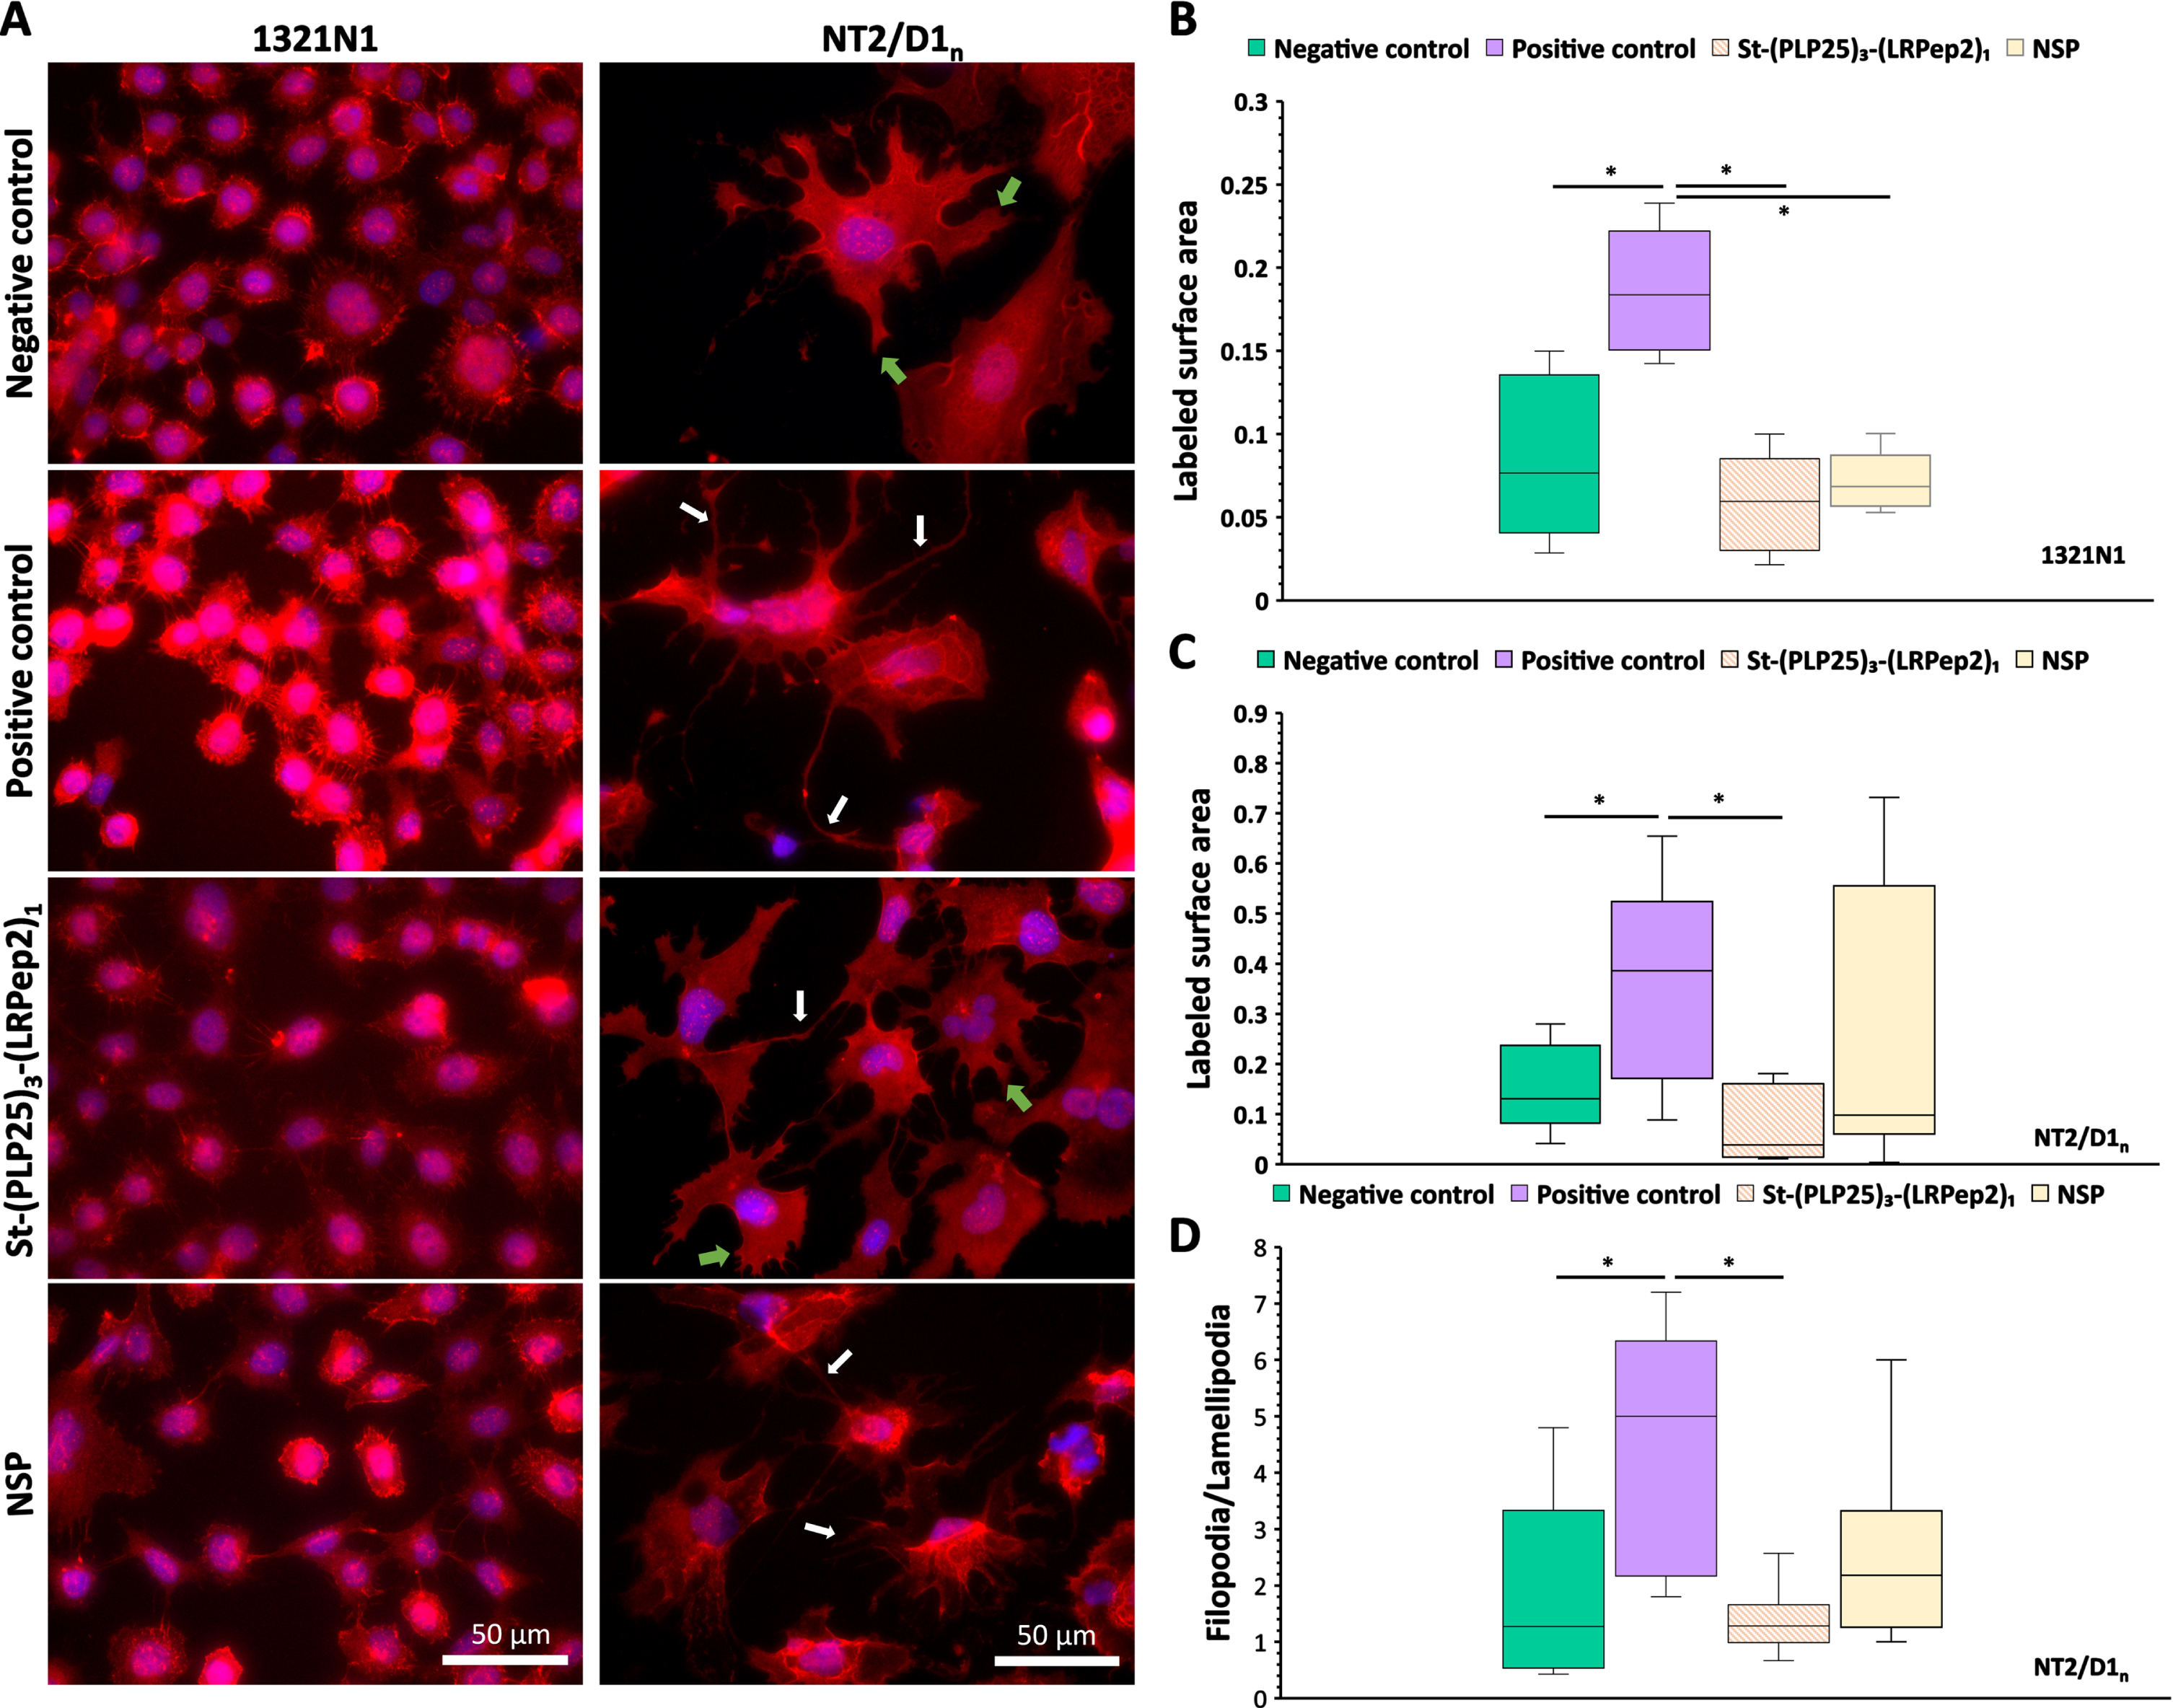
In 1321N1 cells, H2O2 causes an increase in overall fluorescence, as well as a more marked labeling of cell membrane projections. The increase in fluorescence may be the result of the cPLA2-IVA translocation at the membrane level, and probably to the nuclear envelope, giving an impression of local “concentration” or stimulation of its expression. The labeling of membrane projections also suggests a translocation of cPLA2-IVA at this level. In NT2/D1n cells, glutamate causes the appearance of long and filiform projections (filopodia type) unlike the shorter and spread projections observed on the negative control (lamellipodia type). Moreover, a “network” intracellular labeling is also observable, probably related to the endoplasmic reticulum and/or the Golgi apparatus, as well as a nuclear labeling which seems more important. In both cell types studied, St-(PLP25)3-(LRPep2)1 blocks these phenomena, suggesting that it correctly inhibits the cPLA2-IVA translocation.
The translocation of cPLA2-IVA to membrane projections was quantified using ImageJ software, whereby a threshold was determined to highlight the IF labeled structures (Fig. 6B, C). This analysis confirms our observations, i.e., the stimulation of cPLA2-IVA in 1321N1 (Fig. 6B) or NT2/D1n cells (Fig. 6C) significantly increases the labeled surface area of the projections (p < 0.05), while our complex St-(PLP25)3-(LRPep2)1 reduces this area to a level close to negative control (p < 0.05 versus positive control). In NT2/D1n cells, a manual counting of the projections was carried out to discriminate the two morphologies observed, namely lamellipodia and filopodia (Fig. 6D). A significantly increased filopodia/lamellipodia ratio is observed following incubation with glutamate (p < 0.05; p < 0.01), while St-(PLP25)3-(LRPep2)1 reduces this ratio to the level of negative control (p < 0.05; p < 0.0001).
During this experience, NSP seemed to play a variable role on cPLA2-IVA, causing an effect similar to St-(PLP25)3-(LRPep2)1 in 1321N1 cells (p < 0.05), while no significant differences were observed on NT2/D1n cells; likewise, no significant effect was observed with NSP peptide on NT2/D1n cells.
IC50 and toxicity assessment of MAP-(PLP25)3-(LRPep2)1
Before injecting this new peptide complex into mice, it was necessary to determine its IC50 (i.e., the concentration of MAP-(PLP25)3-(LRPep2)1 able to inhibit by 50% the cPLA2-IVA translocation to membrane of cell processes, and thus the release of AA) on NT2/D1n cells and to check its impact on HepaRG cell viability by MTT assay.
Based on the immunofluorescent localization of cPLA2-IVA in cell processes, an IC50 of 5.08 •10–6 M (5.08 μM) was determined for MAP-(PLP25)3-(LRPep2)1 (Supplementary Figure 7A). NSP2 did not induce a dose-dependent effect, preventing thus the estimation of an IC50 in its case. Moreover, MAP-(PLP25)3-(LRPep2)1 produced a statistically significant inhibitory effect compared to NSP2 at all assessed concentrations (2, 4, 6, and 8 μM).
As shown in Supplementary Figure 7B, the MAP-(PLP25)3-(LRPep2)1 complex does not induce significant mortality of HepaRG cells (i.e., human hepatocytes preserving the physiological properties of primary cells) at any of the concentrations (0.2, 2, 20, and 200 μM) or incubation times (2 or 24 h) assessed, confirming the non-toxicity of our complex.
Altogether, these investigations allowed us to choose a dose of 2 μmol (2 •10–6 mol)/kg b.w. for in vivo studies performed on animal models described below.
In vivo evaluation of the PLP25 peptide
Animal models
Several experimental groups are presented in the different experiments that were carried out in this work.
Initially, Barnes maze was performed on two groups of APP/PS1 mice, a double transgenic mouse model of AD. The first group of APP/PS1 mice is considered naive because Barnes maze was the first cognitive test the mice underwent. The second group was kindly provided by Prof. Laurence Ris and these mice have previously undergone a Morris maze. In addition, we used healthy mice that did not carry the mutations (C57BL/6JxC3H/Hej) but that underwent the Morris maze, also kindly provided by Prof. Laurence Ris. After learning the maze, naive APP/PS1 mice were divided into two groups based on the received treatment, i.e., MAP-(PLP25)3-(LRPep2)1 or NSP2. The APP/PS1 mice are known to develop amyloid deposits in the brain as early as 6 to 7 months and show learning difficulties in Morris maze. The treatment of mice with peptides therefore began at 5.5 months of age, for a period of 1.5 months, with the aim of observing a potential beneficial effect of MAP-(PLP25)3-(LRPep2)1. At this stage, non-naive APP/PS1 mice were distinguished from other APP/PS1 mice by their age; like healthy mice, they were indeed older than mice treated with peptides and were 10 months old at the time of their sacrifice. These mice were not treated.
Different biomarkers were detected by IHC in these 4 groups of mice, to which brain histological sections from healthy NMRI and 2-year-old APP/PS1 mice were added. NMRI mice were the same age as mice treated with peptides and were initially used instead of C57BL/6JxC3H/Hej mice in Barnes tests. Unfortunately, it turned out that these mice were not actually learning the maze. After performing all the tests over the same period as the APP/PS1 mice, these mice were sacrificed, and their brains were preserved for IHC, while the blood plasma was used for the measurement of ALT, creatinine, BUN, and glucose. Concerning the 2-year-old APP/PS1 mice, these were used in a previous project, their brains being preserved in the laboratory. These mice received no treatment and did not undergo Barnes maze. Sections of these histological blocks were used to complete some of our histologicalstudies.
Evaluation of the spatial memory of mice treated with MAP-(PLP25)3-(LRPep2)
There are several maze tests for assessing the spatial memory of mice [58]. Barnes maze was used as part of this project because it is easy to set up and causes less stress in mice than Morris water maze. The analyses performed during the learning period revealed that all mice correctly learned the location of the hiding place and that mice provided by Prof. Laurence Ris could be included in our study (Supplementary Figure 8).
Once the task was learned, the mice were tested weekly in Barnes maze for the treatment duration. Test 1 was performed 3 days after the end of the learning, and the treatment of mice began 4 days after this first test.
Two parameters show interesting results, namely the number of total errors made (Fig. 7A) and the percentage of time spent in the quadrant of interest (Fig. 7B). First, before the treatment period (T1), we noticed that mice treated with MAP-(PLP25)3-(LRPep2)1 or with NSP2 show similar results for both parameters. On the other hand, healthy and older APP/PS1 mice, having already undergone another spatial memory test, make significantly more errors (Supplementary Table 1), while remaining mostly in the quadrant of interest. This is due to the exploration of nearby environment over the entire duration of the test, as these mice are probably less fearful and more exploratory. As treatment progresses, the results between the groups begin to diverge. Thus, mice treated with the MAP-(PLP25)3-(LRPep2)1 generally commit few errors (Fig. 7A) and retain a percentage of time in the quadrant close to 100% until the 5th test, this evolution being similar to that of healthy mice (Fig. 7B). Conversely, mice treated with NSP2 spend much less time in the quadrant of interest from the 2nd test, and their results gradually drop until the 4th test, in the same way as untreated and older APP/PS1 mice, the results being significantly different from healthy mice and mice treated with MAP-(PLP25)3-(LRPep2)1 (Supplementary Table 2). This suggests that treatment with MAP-(PLP25)3-(LRPep2)1 improves the spatial memory of APP/PS1 mice.
Fig. 7
Evaluation of the spatial memory (Barnes maze) of healthy (C57BL/6J x Hej, n = 8) and APP/PS1 mice treated with MAP-(PLP25)3-(LRP2)1 (n = 5), NSP2 (n = 5) or non-treated (APP/PS1 10 months, n = 8). A) Total number of errors; B) Percentage of time spent in the quadrant of interest normalized to the individual performances in the last learning day. Green arrows correspond to the start of the treatment (4 days after the first test), red arrows correspond to the “relearning” step. Tests 1 to 7 were performed once a week, while test 8 was carried out 4 days after the test 7. Statistics are regrouped in the Supplementary Tables 1 and 2.
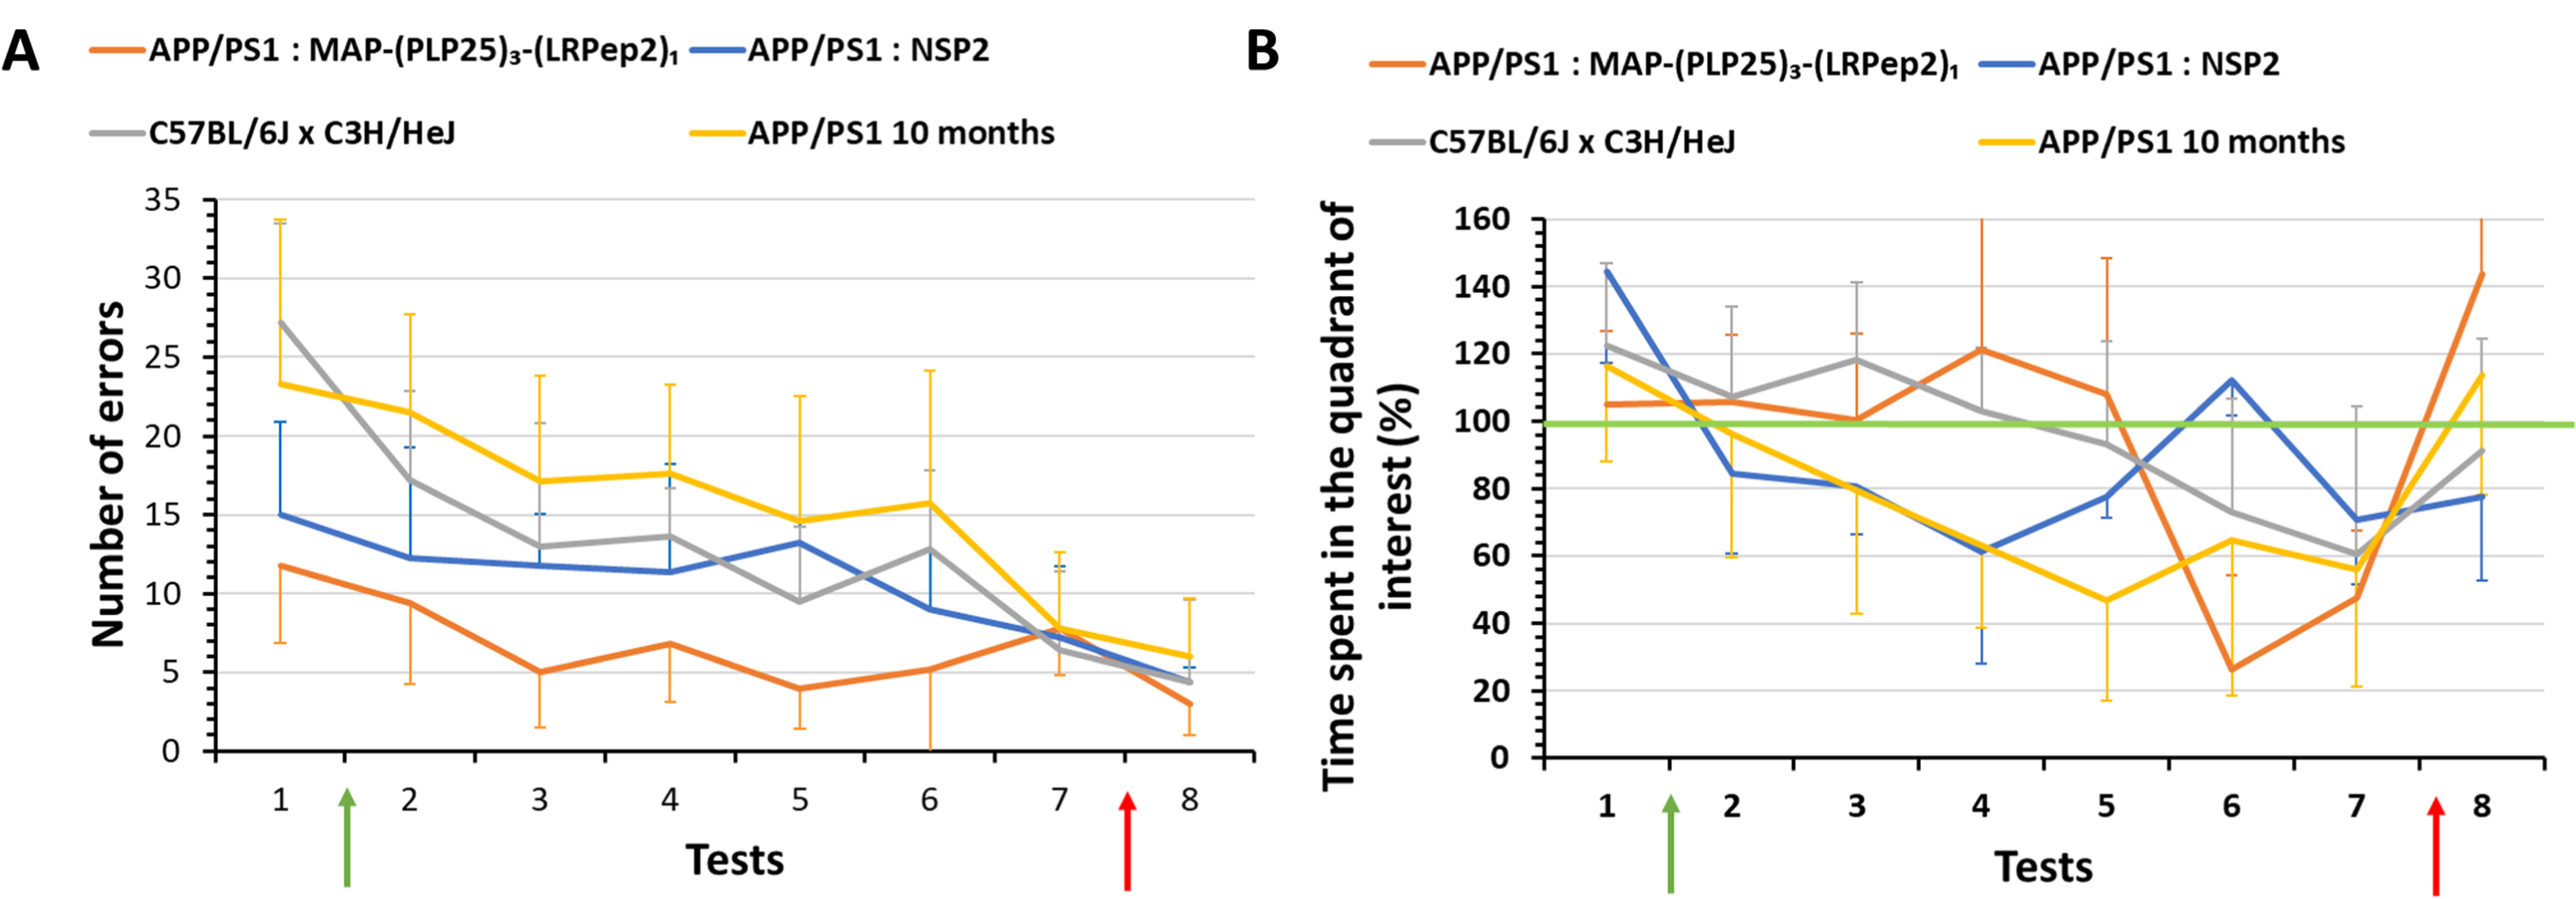
From the 6th test, we noticed a drop in the percentage of time spent in the quadrant of interest for MAP-(PLP25)3-(LRPep2)1 and healthy mice, with a still relatively low number of errors. These results are explained by the loss of mice motivation to perform the test; after more than a month, the mice seem to no longer want to perform the test, and this is more noticeable for the mice treated with MAP-(PLP25)3-(LRPep2)1. This loss of motivation was also observed, but to a lesser extent, in NSP2 treated mice and in untreated APP/PS1 mice.
Following these observations and being at the end of the treatment period, we have chosen to put back the hiding place during a “relearning” step (red arrows on Fig. 7A, B) in order to remotivate the mice. We then performed a final test (T8) which confirmed our hypothesis. It is very interesting to note that, even though all groups improve their results in this last test, the percentage of time spent in the quadrant of interest of MAP-(PLP25)3-(LRPep2)1 treated mice rises drastically (Fig. 7B) by making very few errors (Fig. 7A). These results suggest that in the absence of motivation loss, mice treated with MAP-(PLP25)3-(LRPep2)1 appear to have retained the location of the hiding place, unlike NSP2 mice which do not seem to know exactly what task they need to perform.
Measurement of ALT, creatinine, BUN, and glucose in blood plasma of mice
ALT, creatinine, BUN, and glucose were measured in the blood plasma of mice after in vivo experiments aiming to identify the potential liver damage (ALT) and kidney disfunction (creatinine, BUN) respectively, as well as the eventual deregulation of glucose homeostasis (Supplementary Figure 9). Neither MAP-(PLP25)3-(LRPep2)1 nor NSP2 induced statistically significant effects on ALT, creatinine, and BUN, suggesting the absence of in vivo toxicological consequences of their administration for 1.5 months. Likewise, no statistically significant differences were identified between the different experimental groups, although a tendency to higher blood creatinine was observed in APP/PS1 mice aged 10 months. Additionally, MAP-(PLP25)3-(LRPep2)1 induced a statistically significant decrease of blood plasma glucose compared to the mice treated with NSP2 (p < 0.01) and to APP/PS1 mice aged 10 months (p < 0.05).
Detection of AP in the brains of APP/PS1 mice
The APP/PS1 mice used in this project have two mutations promoting the release of Aβ and the formation of AP. Moreover, as explained in the Introduction, cPLA2-IVA is involved in the accumulation of Aβ by diverse mechanisms and its decreased expression reduces significantly the number of AP [59]. Consequently, it is interesting to know whether inhibition of cPLA2-IVA in the brains of APP/PS1 mice reduces the development of AP.
Initially, Aβ was detected by MRI using a superparamagnetic contrast agent (causing negative contrast) developed in our laboratory, USPIO-PHO, targeting Aβ with PHO peptide previously identified by phage display [47–49]. Briefly, PHO peptide, a Cys-constraint cyclic heptapeptide, was grafted to iron nanoparticles, allowing to highlight Aβ by MRI. The accumulation of USPIO-PHO bound to Aβ induces a negative contrast on MRI images, and brains appear darker than the controls. As shown in Fig. 8A, a darkening of the brains of NSP2-treated mice is visible at the two studied post-contrast times, while this darkening is less marked in mice treated with MAP-(PLP25)3-(LRPep2)1. The difference in contrast is more visible on colored images (Fig. 8B).
Fig. 8
Representative raw (A) and colored (B) images of APP/PS1 mice treated with NSP2 or MAP-(PLP25)3-(LRPe2)1, acquired with a RARE sequence, before (pre-contrast) and after (post-contrast) injection of USPIO-PHO targeting Aβ. C) Percentage of the area labeled with black pixels (USPIO-PHO is a negative contrast agent generating black contrast) as compared to the total area (brain), reflecting the accumulation of USPIO-PHO to AP. *p < 0.05 (Student’s t-test).
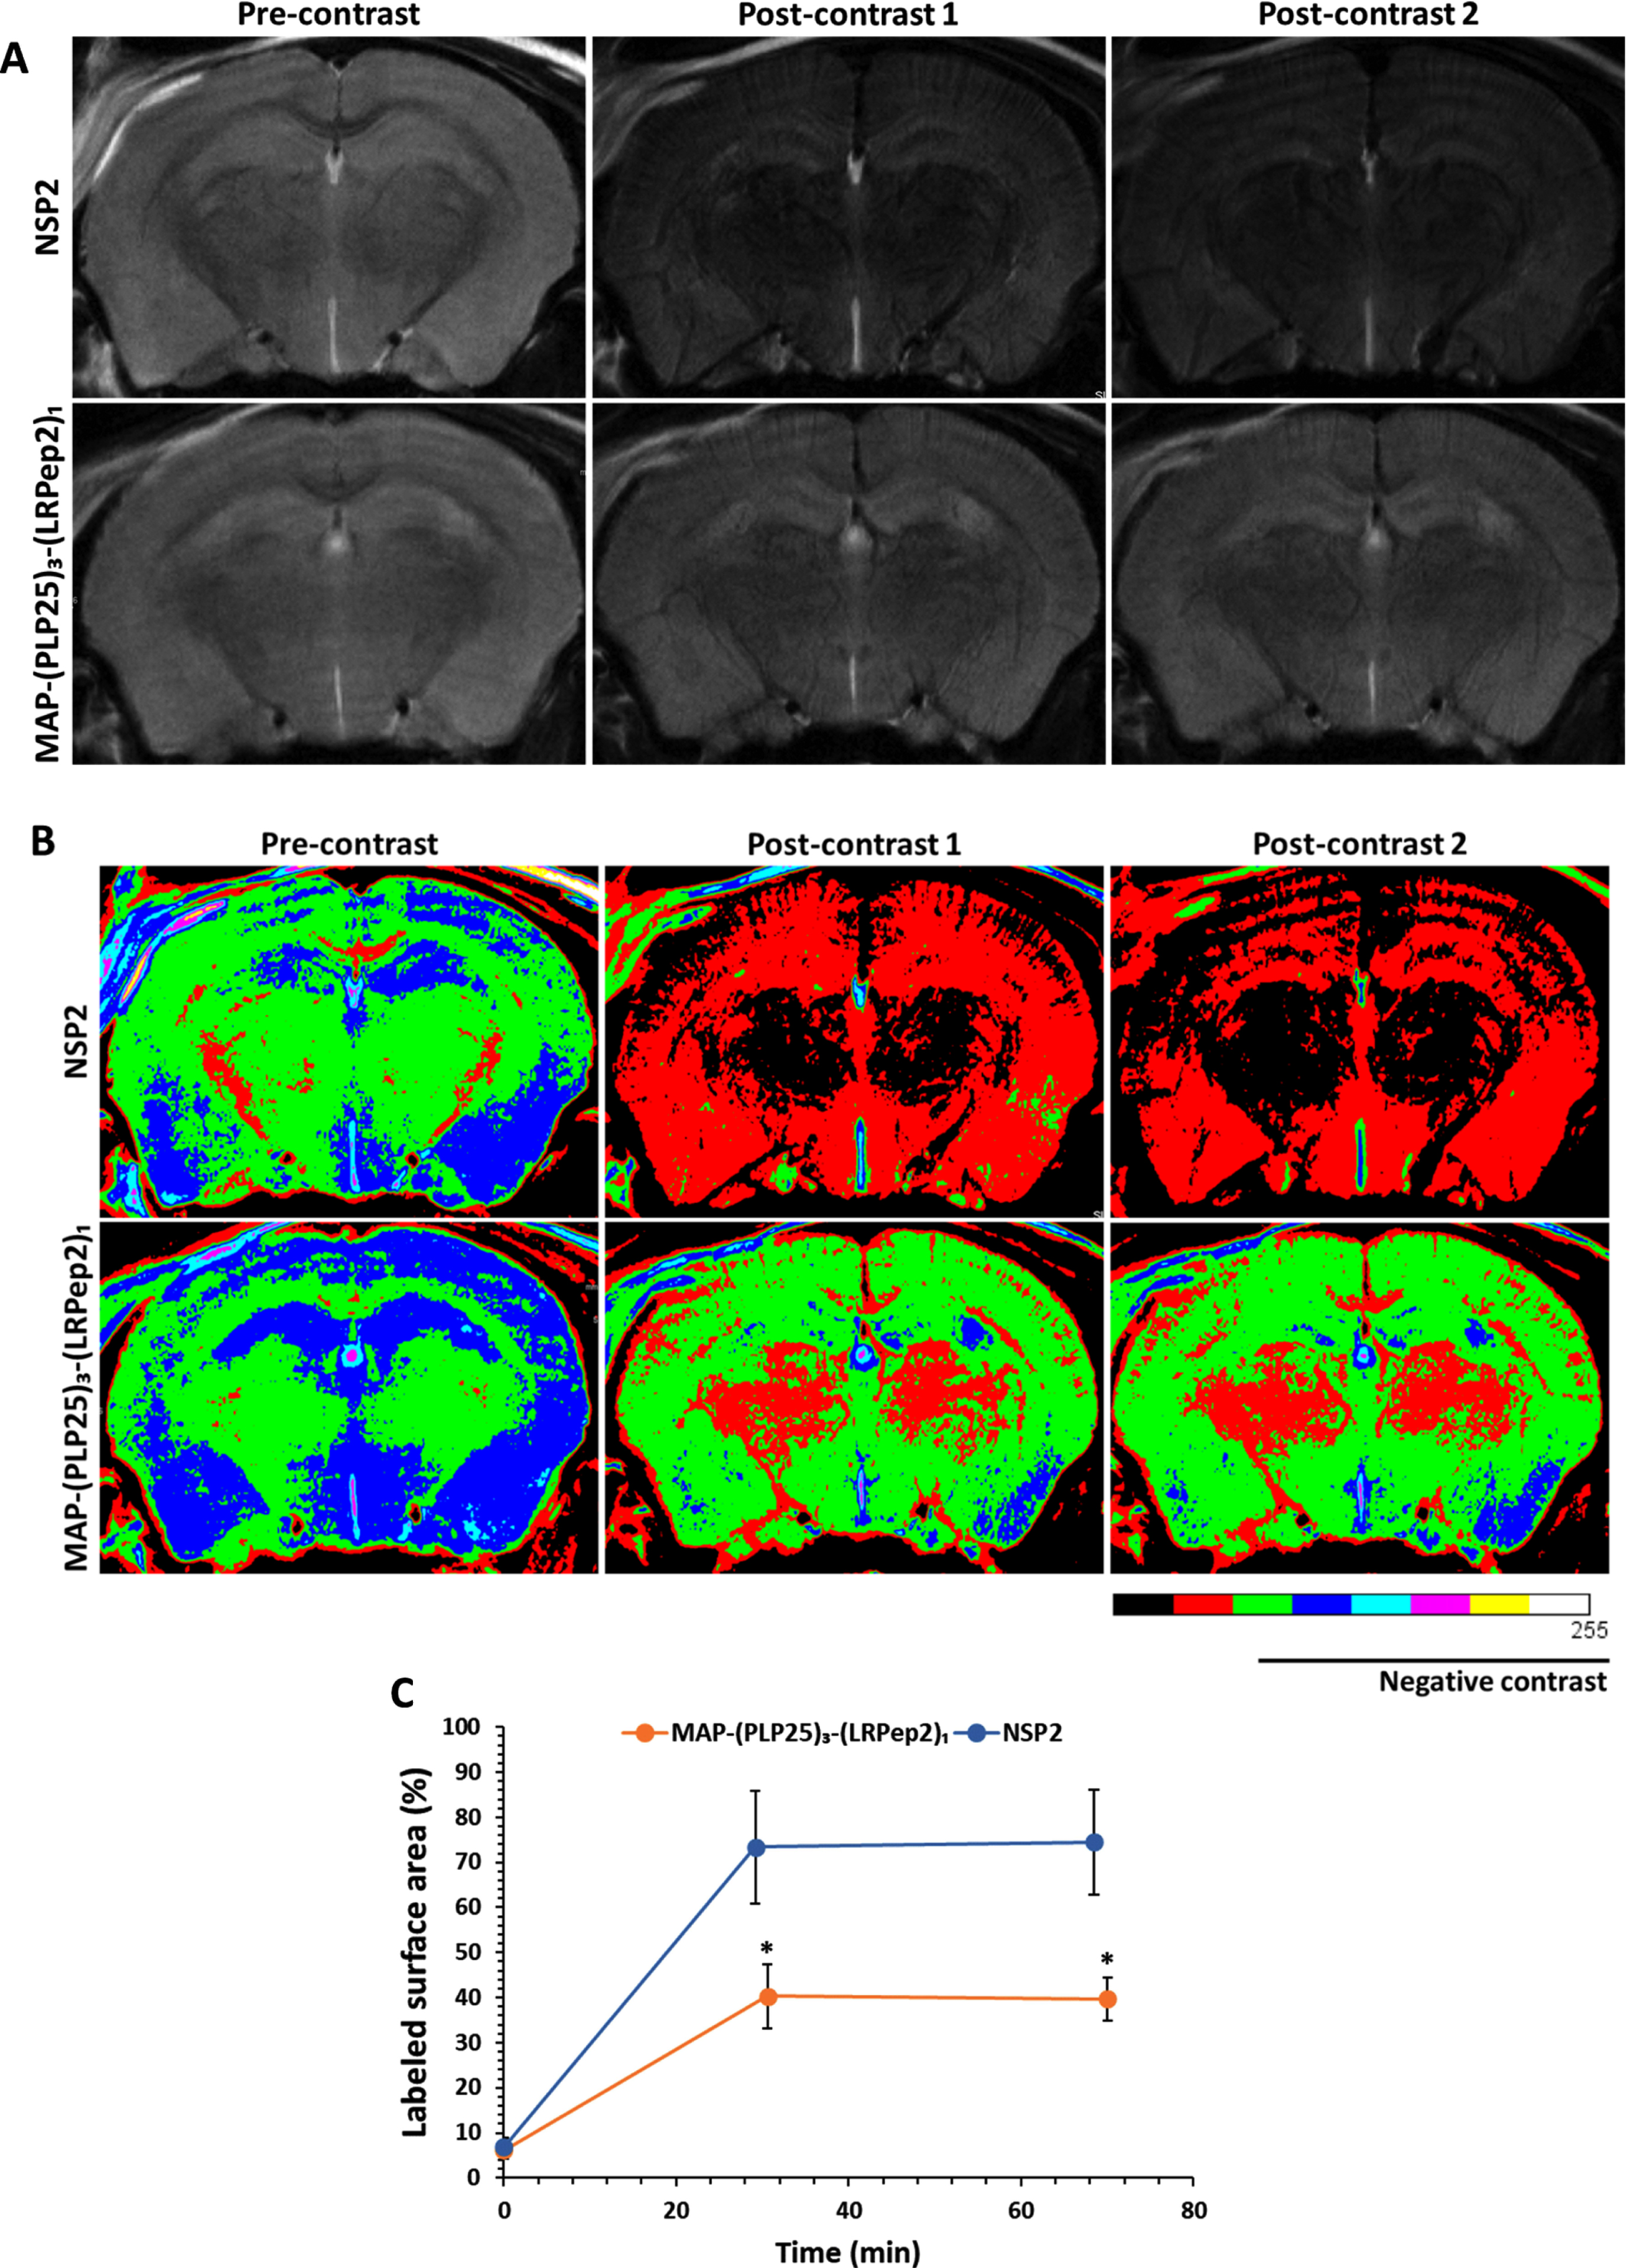
The analysis of the marked surface, i.e., with black pixels reflecting the presence of USPIO-PHO and therefore Aβ (Fig. 8 C), confirms the significant (p < 0.05) negative contrast for NSP2-treated mice, as opposed to MAP-(PLP25)3-(LRPep2)1-treated mice at the two post-contrast times investigated. These results thus suggest a greater presence of Aβ in the brains of mice treated with NSP2.
Subsequently, the AP were detected by IHC in the brains of mice after their sacrifice. All APP/PS1 mice have AP, highlighted by red arrows in Fig. 9A, while the two groups of healthy mice (NMRI and C57BL/6JxC3H/HeJ) have none. Visually, it is remarkable that untreated APP/PS1 mice, older than the two treated groups, have a much higher number of AP in relationship with the pathology progression. Interestingly, mice treated with MAP-(PLP25)3-(LRPep2)1 appear to have less AP than mice treated with NSP2. In addition, these AP are smaller and less dense. Finally, the cortex is more severely affected by the presence of plaques, in accordance with the cerebral distribution of Aβ during the pathology progression.
Fig. 9
A) AP detected by IHC on healthy NMRI and C57BL/6J x C3H/HeJ as well as APP/PS1 brain slices, treated with MAP-(PLP25)3-(LRPep2)1 or NSP2, or non-treated (APP/PS1 10 months). AP are highlighted by the DAB and appear in brown, as pointed by red arrows. B) Manual counting of AP on APP/PS1 brain slices, on the entire slice or specifically in the hippocampus, for non-treated (5- or 10-month-old) and MAP-(PLP25)3-(LRPep2)1 or NSP2 treated (7-month-old) APP/PS1 mice. Statistics are regrouped in the Supplementary Tables 3 and 4.
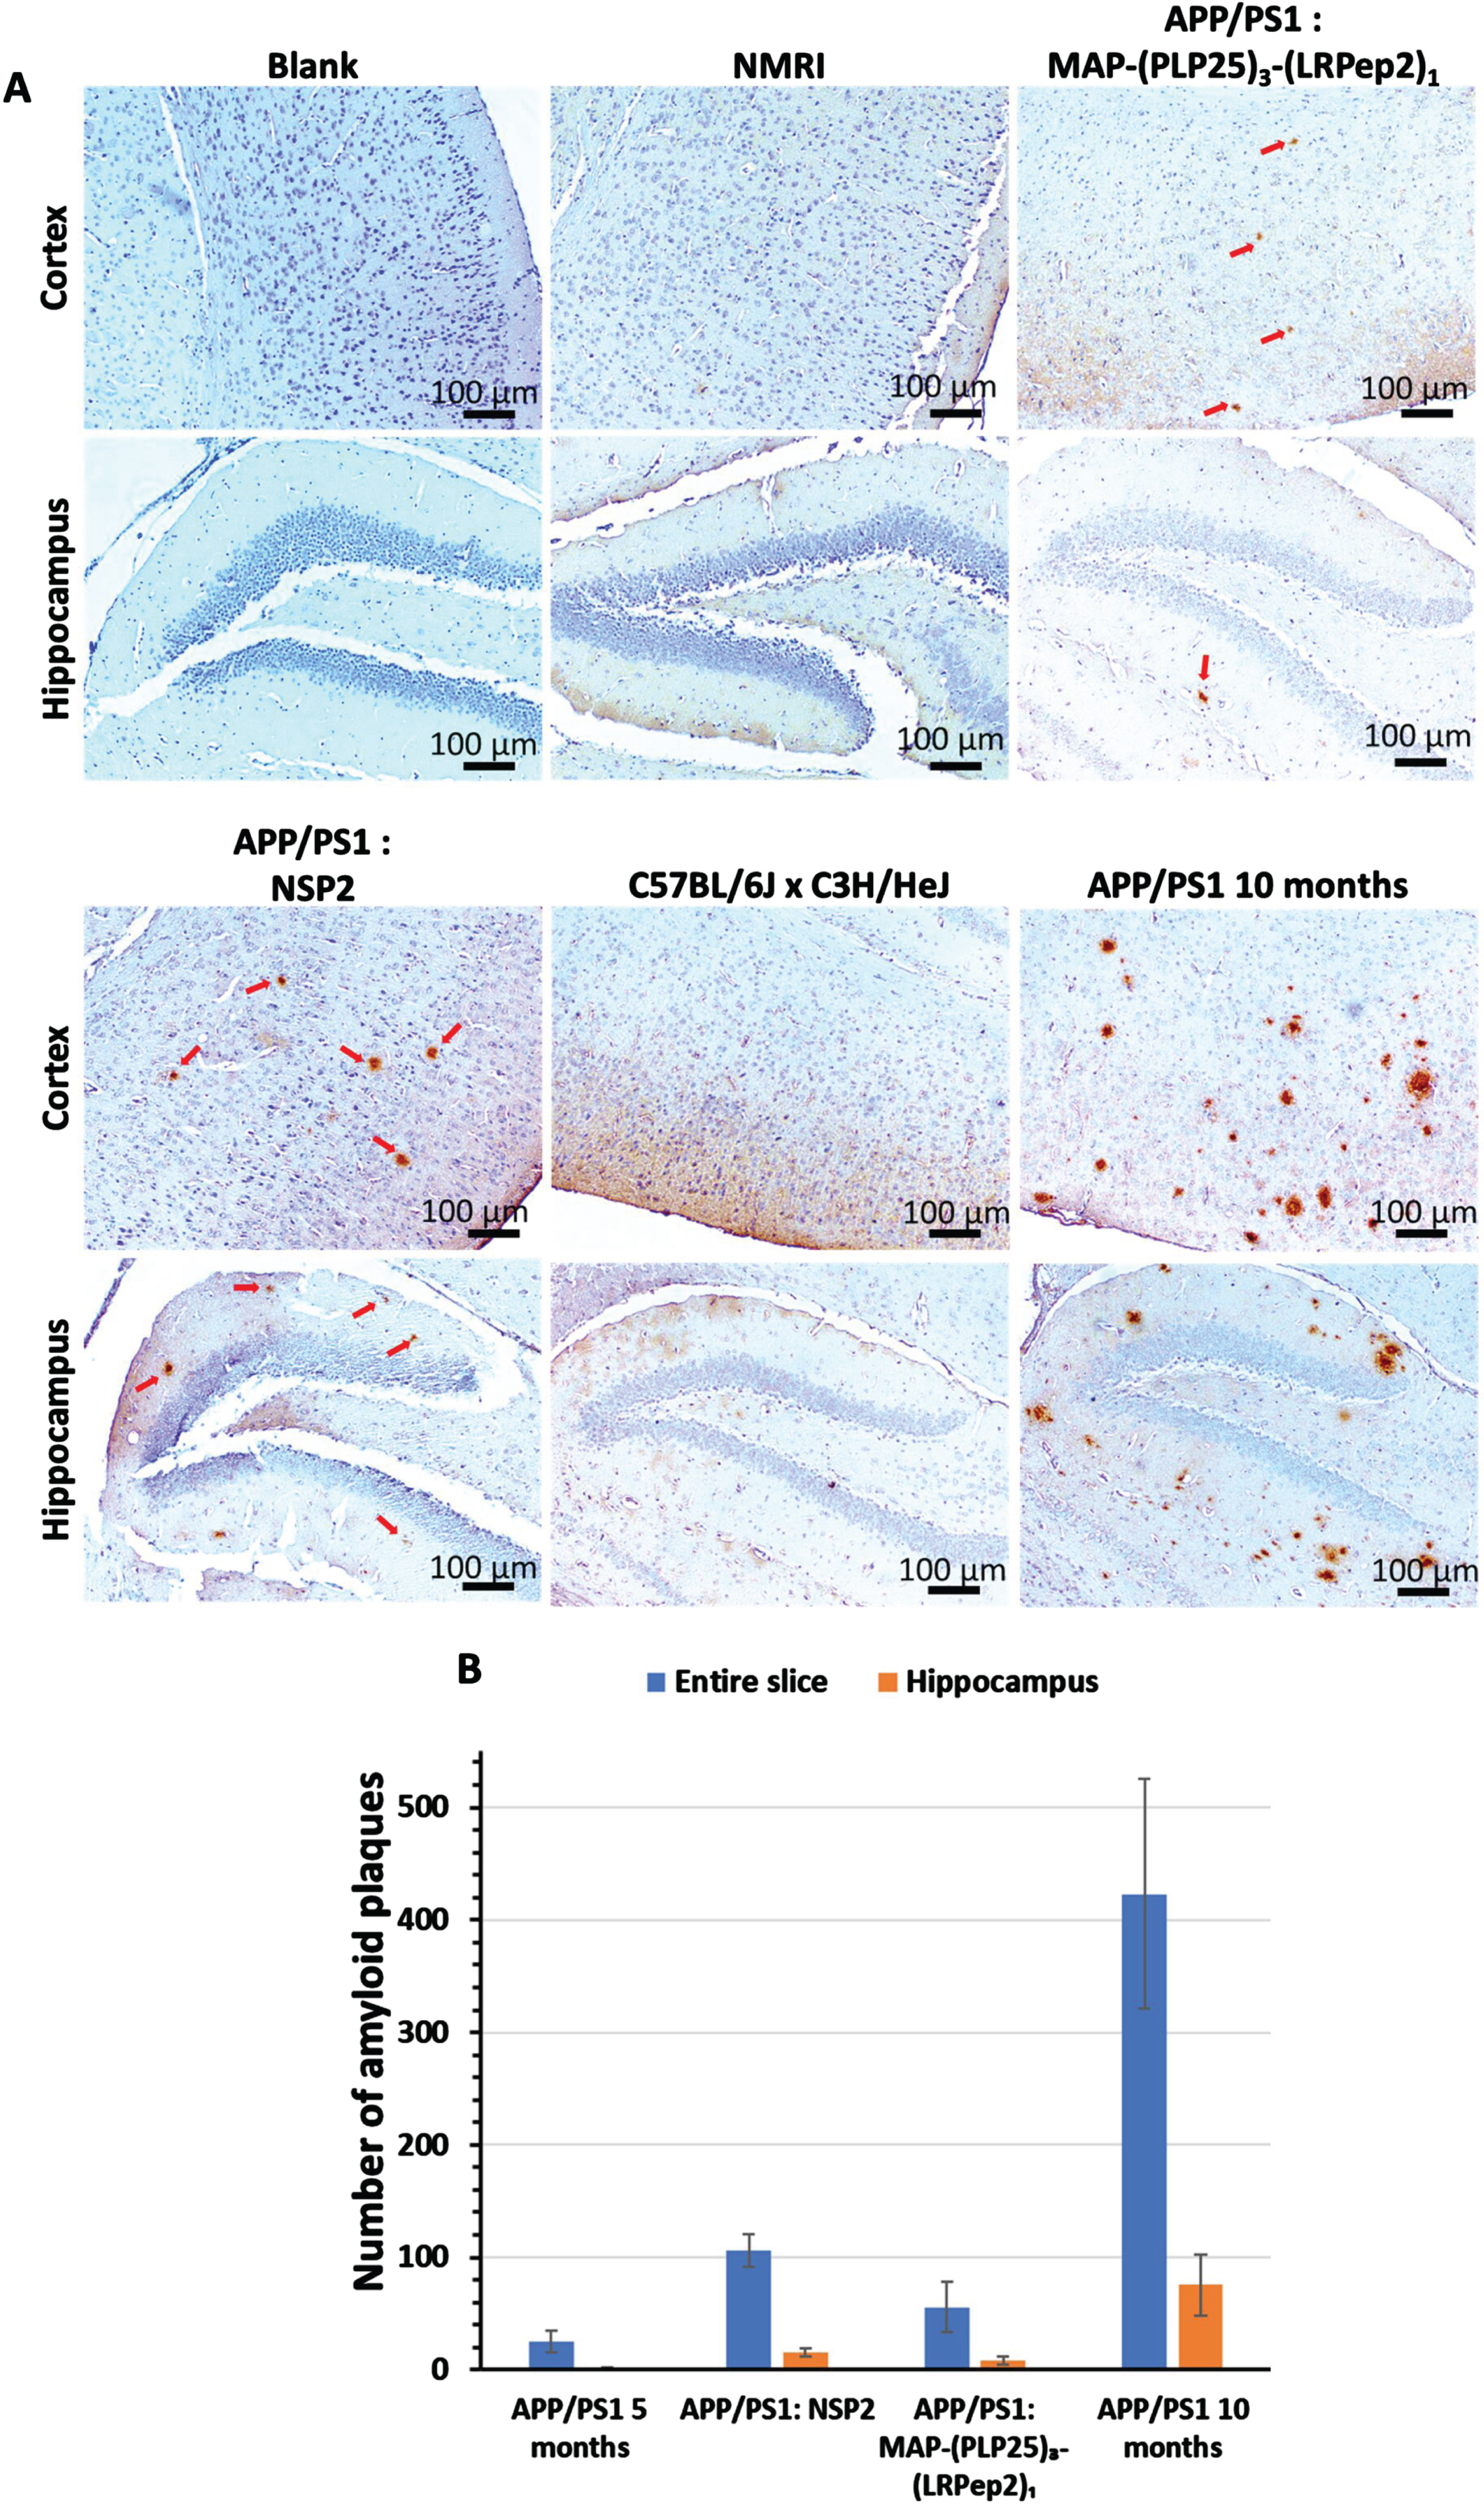
These observations are confirmed by the manual counting of AP (Fig. 9B). Three mice that died before the start of the treatment period, called APP/PS1 5 months, were also evaluated and correspond to a “pre-treatment” state, allowing to observe the evolution over time and/or treatment. This count reveals a very high total AP number in 10-month-old APP/PS1 mice (423±102), which is 16 times greater than 5-month-old mice (24±9, p < 0.001), reflecting exponential progression. Moreover, in the hippocampus, the number of AP is also much higher (75±26), with younger mice having almost none (1.25±1,p < 0.05).
Regarding the treatment of APP/PS1 mice with MAP-(PLP25)3-(LRPep2)1 and NSP2, the count reveals that MAP-(PLP25)3-(LRPep2)1 slows the development of AP (whole section: 55±22; hippocampus: 8±3), these mice presenting almost half of AP number observed in mice treated with NSP2 (whole section: 106±14, p < 0.001; hippocampus: 15±3, p < 0.05). Compared with mice before starting treatment, those treated with MAP-(PLP25)3-(LRpep2)1 have twice as many plaques (p < 0.05), while those treated with NSP2, of the same age, have 4 times more plaques (p < 0.001) (for statistics, please see Supplementary Tables 3 and 4). These results thus corroborate the MRI results and suggest that the MAP-(PLP25)3-(LRPep2)1 complex, under our conditions, slows down, but does not block the development of AP.
Detection by IHC of AD-relevant biomarkers
The treatment of APP/PS1 mice with MAP-(PLP25)3-(LRPep2)1 seems to bring them a benefit, as shown by their cognitive results and the slowing of the AP development. Aiming to confirm the therapeutic potential of our complex, we sought to evaluate the evolution of some biomarkers relevant for this project.
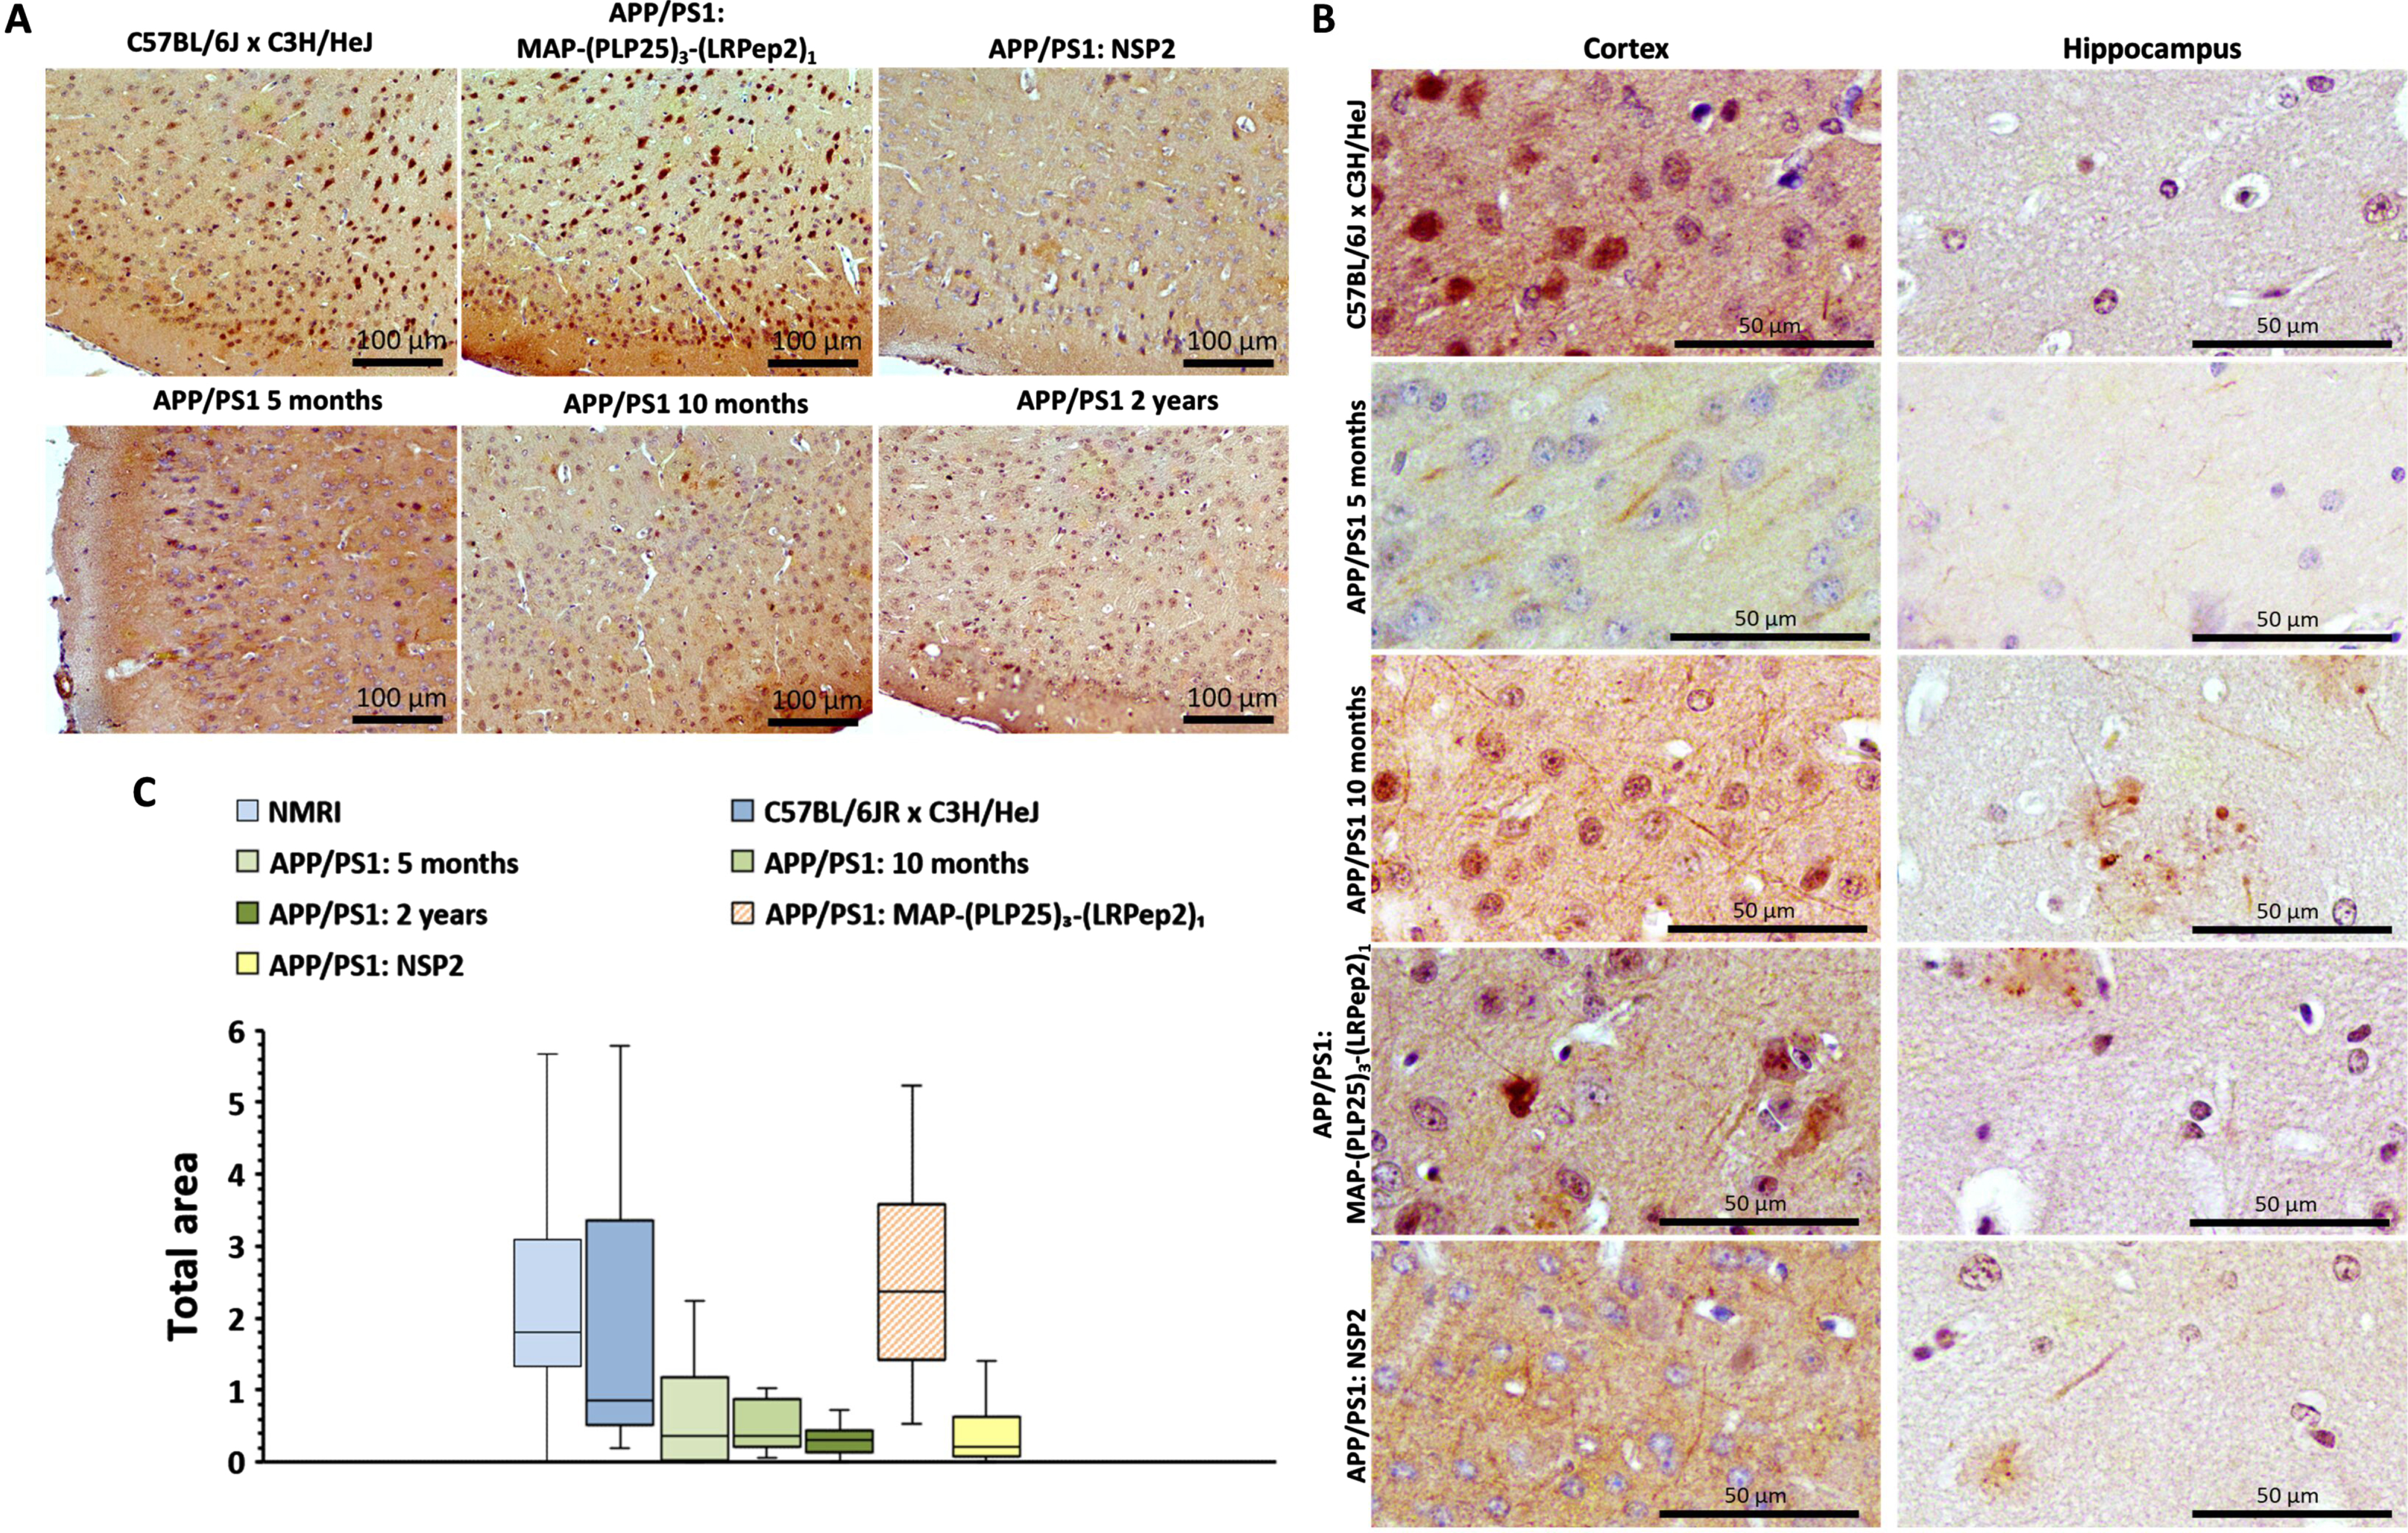
Detection of cPLA2-IVA. Considering that cPLA2-IVA is overexpressed and/or overactivated in the AD brains as well as its relationship with Aβ release [10, 37, 60], we sought to know if its inhibition by MAP-(PLP25)3-(LRPep2)1 and the resulting decrease in Aβ can block the triggered vicious circle and influence the expression of cPLA2-IVA. One can notice in Fig. 10A that cell staining in the cortex and hippocampus is relatively low in healthy NMRI and C57BL/6JxC3H/HeJ mice, while untreated APP/PS1 mice show denser labeling compared to 5-month-old mice. Mice treated with MAP-(PLP25)3-(LRPep2)1 present similar labeling to healthy mice, while mice treated with NPS2 have dense labeling like untreated APP/PS1 mice.
Fig. 10
A) cPLA2-IVA detected by IHC on healthy NMRI and C57BL/6J x C3H/HeJ as well as APP/PS1 brain slices, treated with MAP-(PLP25)3-(LRPep2)1 or NSP2, or non-treated (APP/PS1 5 and 10 months). cPLA2-IVA is highlighted by the DAB and appears in brown. B, C) Total area labeled by the cPLA2-IVA in the cell bodies in the cortex (B) and the hippocampus (C). Statistics are regrouped in the Supplementary Tables 5 and 6.
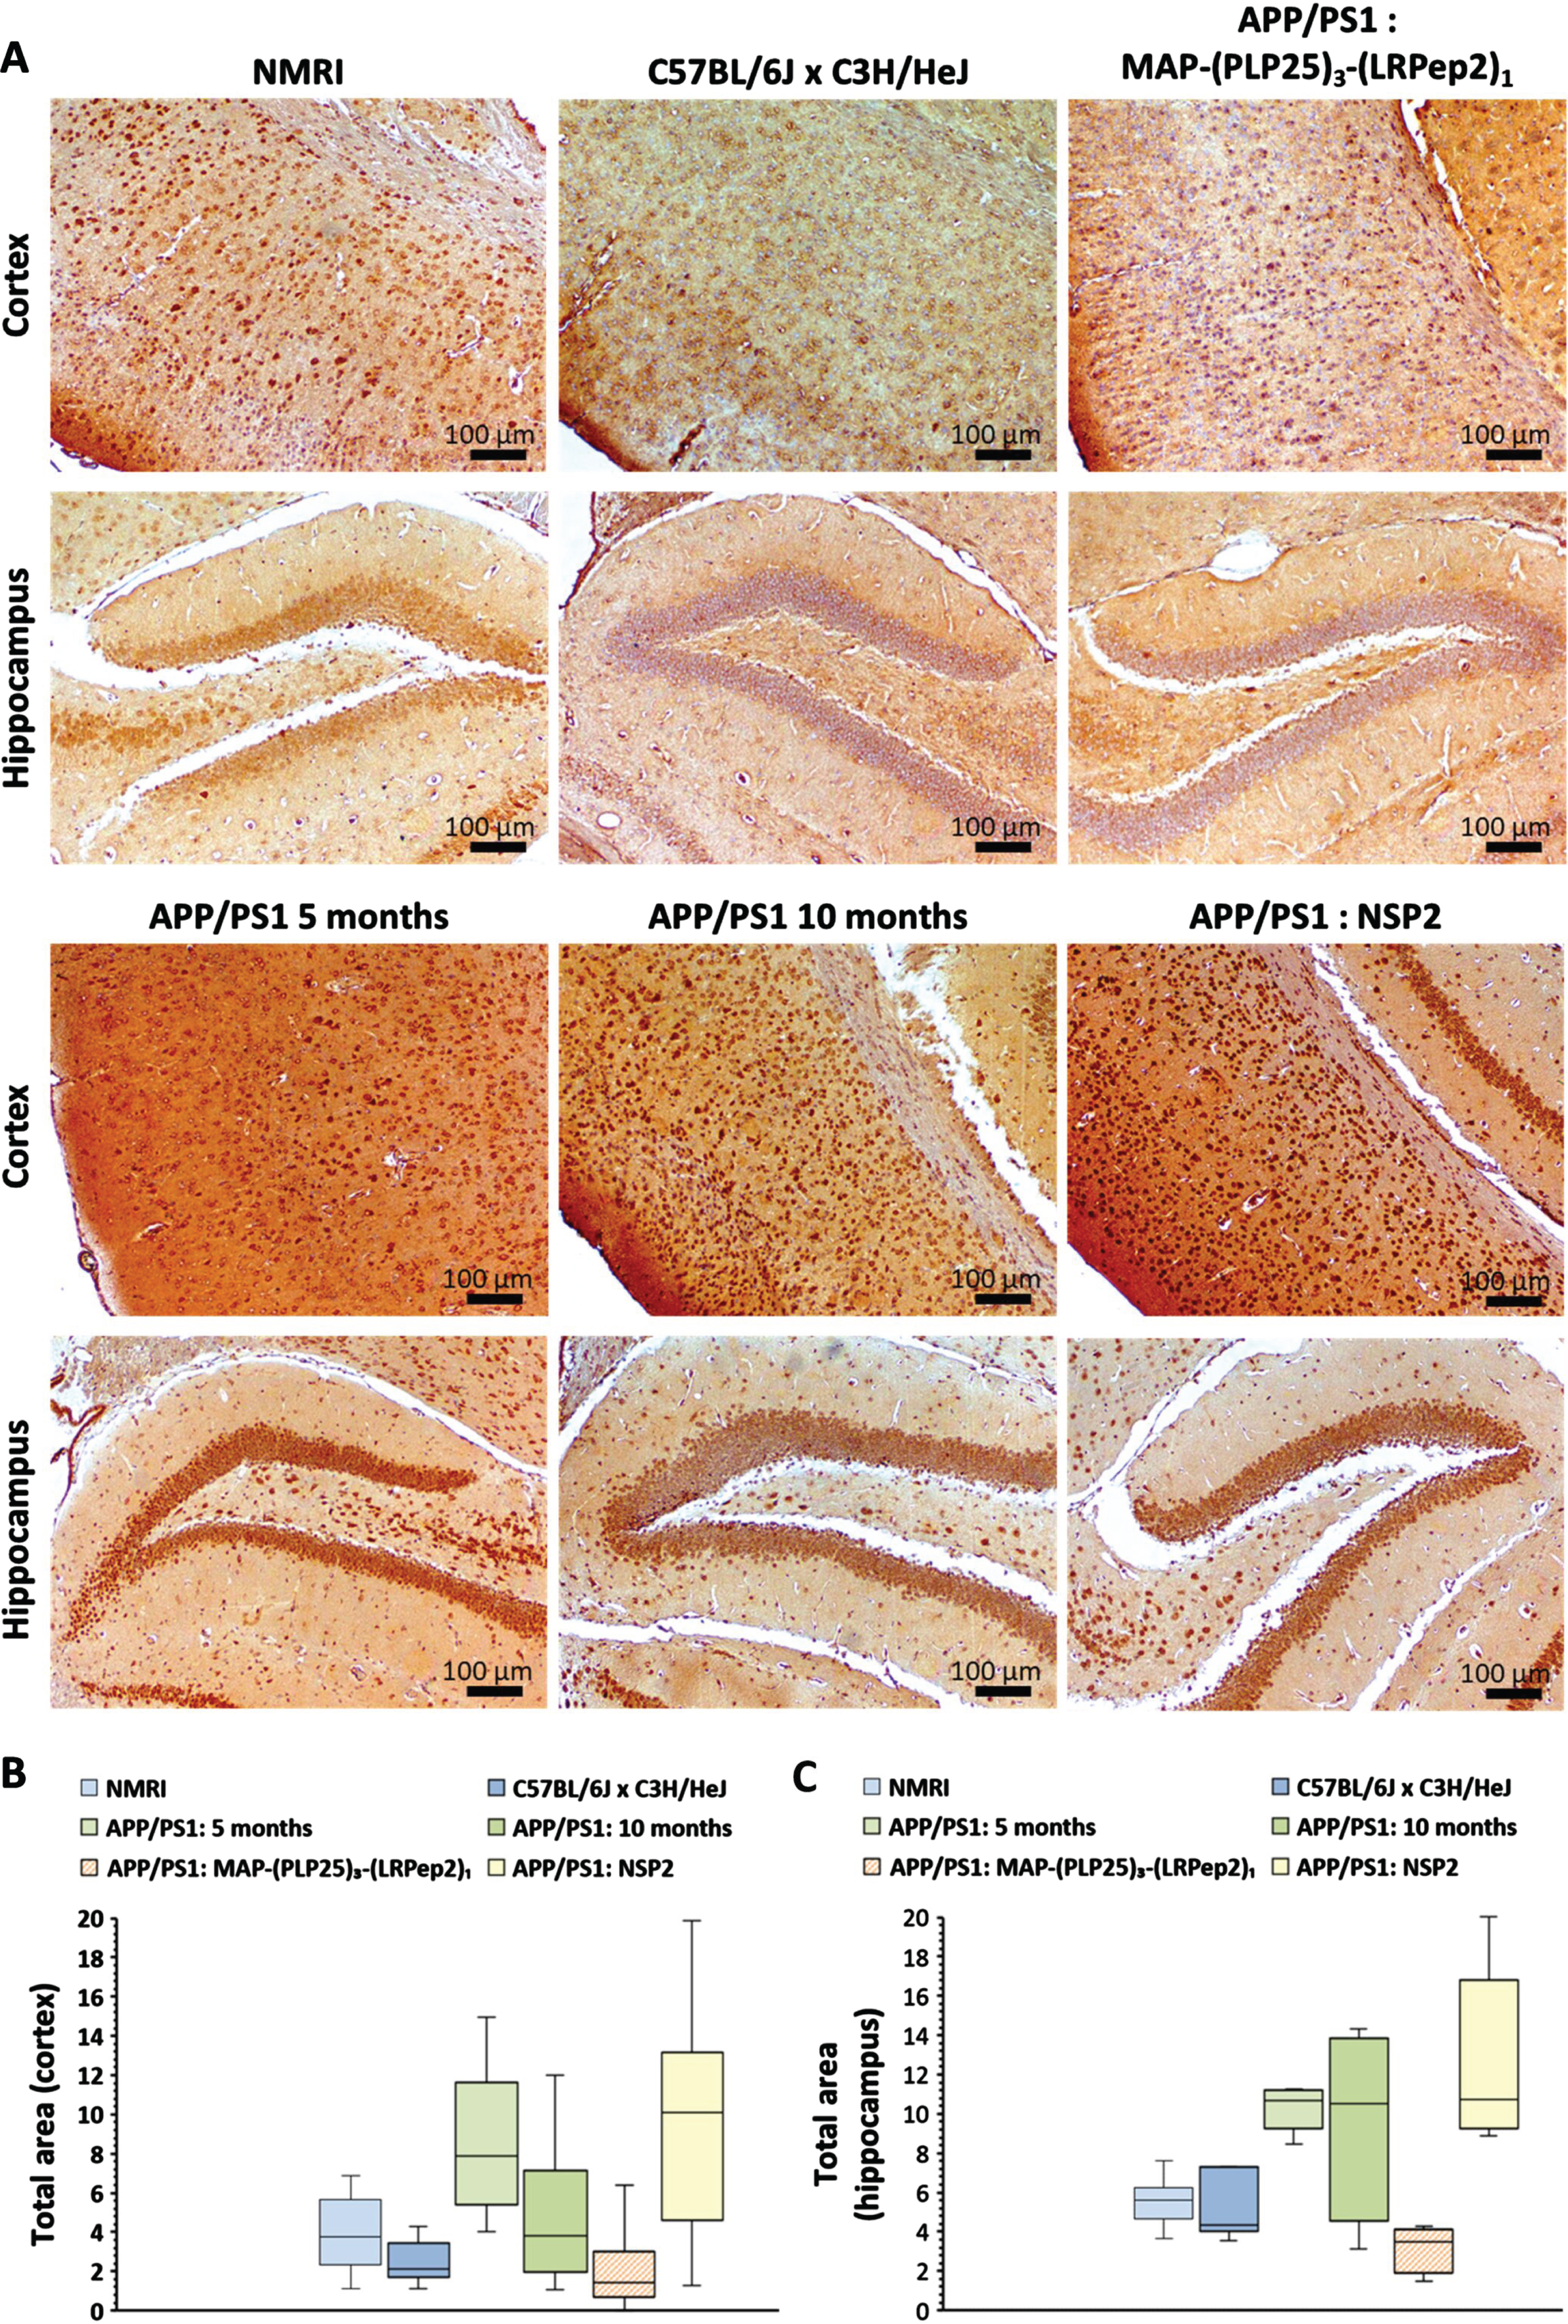
The ImageJ quantification of this staining reveals both logical and surprising results (Fig. 10B, C). In healthy mice, the staining of cPLA2-IVA is significantly lower (p < 0.05) in the cortex of C57BL/6JxC3H/HeJ mice (for statistics, please see Supplementary Tables 5 and 6). This result highlights the importance of the choice of control. For untreated APP/PS1 mice, the evolution of cPLA2-IVA expression seems to differ depending on age and studied area. At 5 months, the expression of cPLA2-IVA is significantly greater than in C57BL/6JxC3H/HeJ mice in the two studied areas (cortex: p < 0.001, hippocampus: p < 0.05), while at 10 months, this difference is no longer significant due to the great variability observed in these mice. Nevertheless, APP/PS1 mice treated with NSP2 (7-month-old at the time of their sacrifice) show an equivalent expression of cPLA2-IVA to 5-month-old mice.
Interestingly, the treatment of APP/PS1 mice with MAP-(PLP25)3-(LRPep2)1 significantly reduced the labeling, and therefore the expression of cPLA2-IVA, in the two areas studied compared to mice aged 5 months (cortex: p < 0.001, hippocampus: p < 0.05) and mice treated with NPS2 (p < 0.001). The difference is also significant compared to 10-month-old mice (p < 0.05). A significantly lower expression level is observed in the cortex of APP/PS1 mice treated with MAP-(PLP25)3-(LRPep2)1 compared to healthy C57BL/6JxC3H/HeJ mice (p < 0.05) (Fig. 10B). In the hippocampus, the same trend is noticeable (Fig. 10 C).
Detection of NMDAR. A complex regulation of glutamatergic receptors occurs during AD, including a decrease in synaptic NMDAR. The endocytosis of these receptors is attributed to the Aβ action [61] generating an imbalance between synaptic and extra-synaptic receptors, and promoting deleterious pathways leading to neuronal death [62, 63]. In addition, cPLA2-IVA is activated directly by the Ca2+ inflow via NMDAR [7] and, under excitotoxic conditions, the excessive activation of cPLA2-IVA contributes to neuronal death [24]. In this context, we sought to investigate the effect of MAP-(PLP25)3-(LRPep2)1 on NMDAR expression subsequent to a decreased production of Aβ.
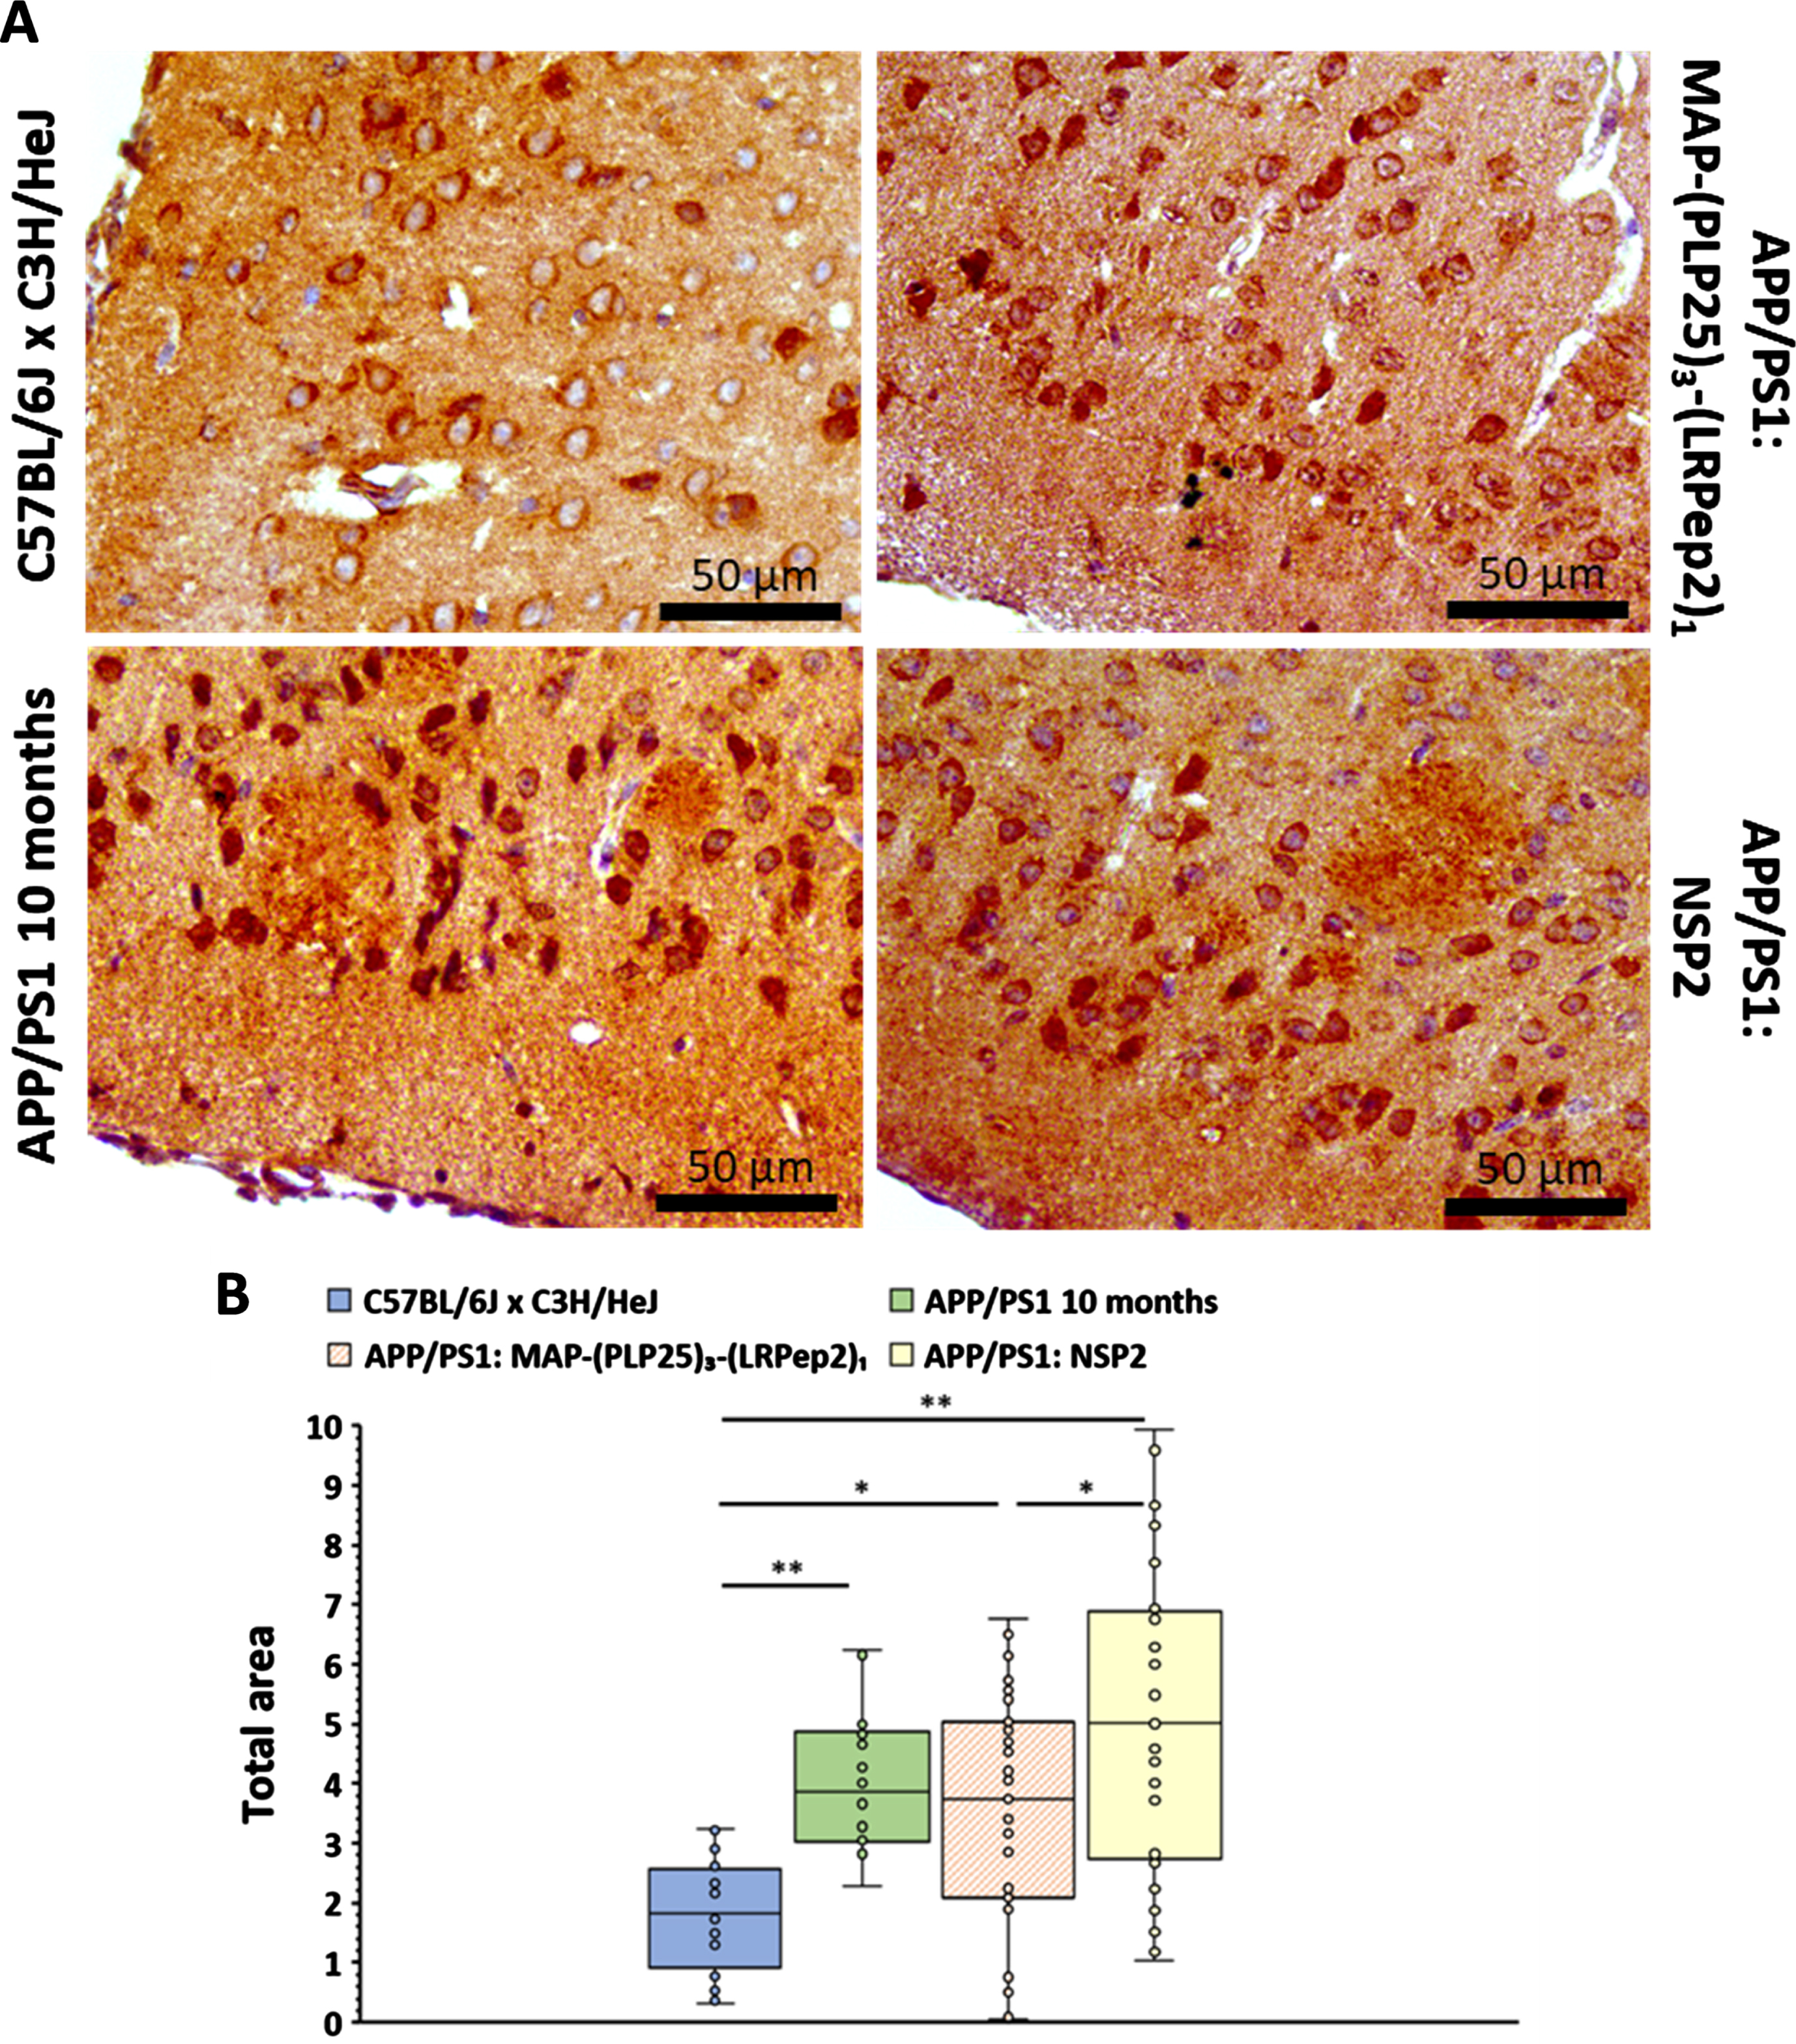
Healthy NMRI and C57BL/6JxC3H/HeJ mice have clearly visible NMDAR labeling in the cortex, while untreated APP/PS1 mice (5 months and 10 months) show much lower labeling (Fig. 11A). Treatment with NSP2 does not appear to have a positive effect on NMDAR expression, while MAP-(PLP25)3-(LRPep2)1 allows this expression to be maintained. In hippocampus, few differences are observable, excepting the mice aged 5 months which present a very low staining.
Fig. 11
A) NMDAR detected by IHC on healthy NMRI and C57BL/6J x C3H/HeJ as well as APP/PS1 brain slices, treated with MAP-(PLP25)3-(LRPep2)1 or NSP2, or non-treated (APP/PS1 5 and 10 months). NMDAR is highlighted by the DAB and appears in brown. B, C) Total area labeled by the NMDAR in the cell bodies in the cortex (B) and the hippocampus (C). Statistics are regrouped in the Supplementary Tables 7 and 8.
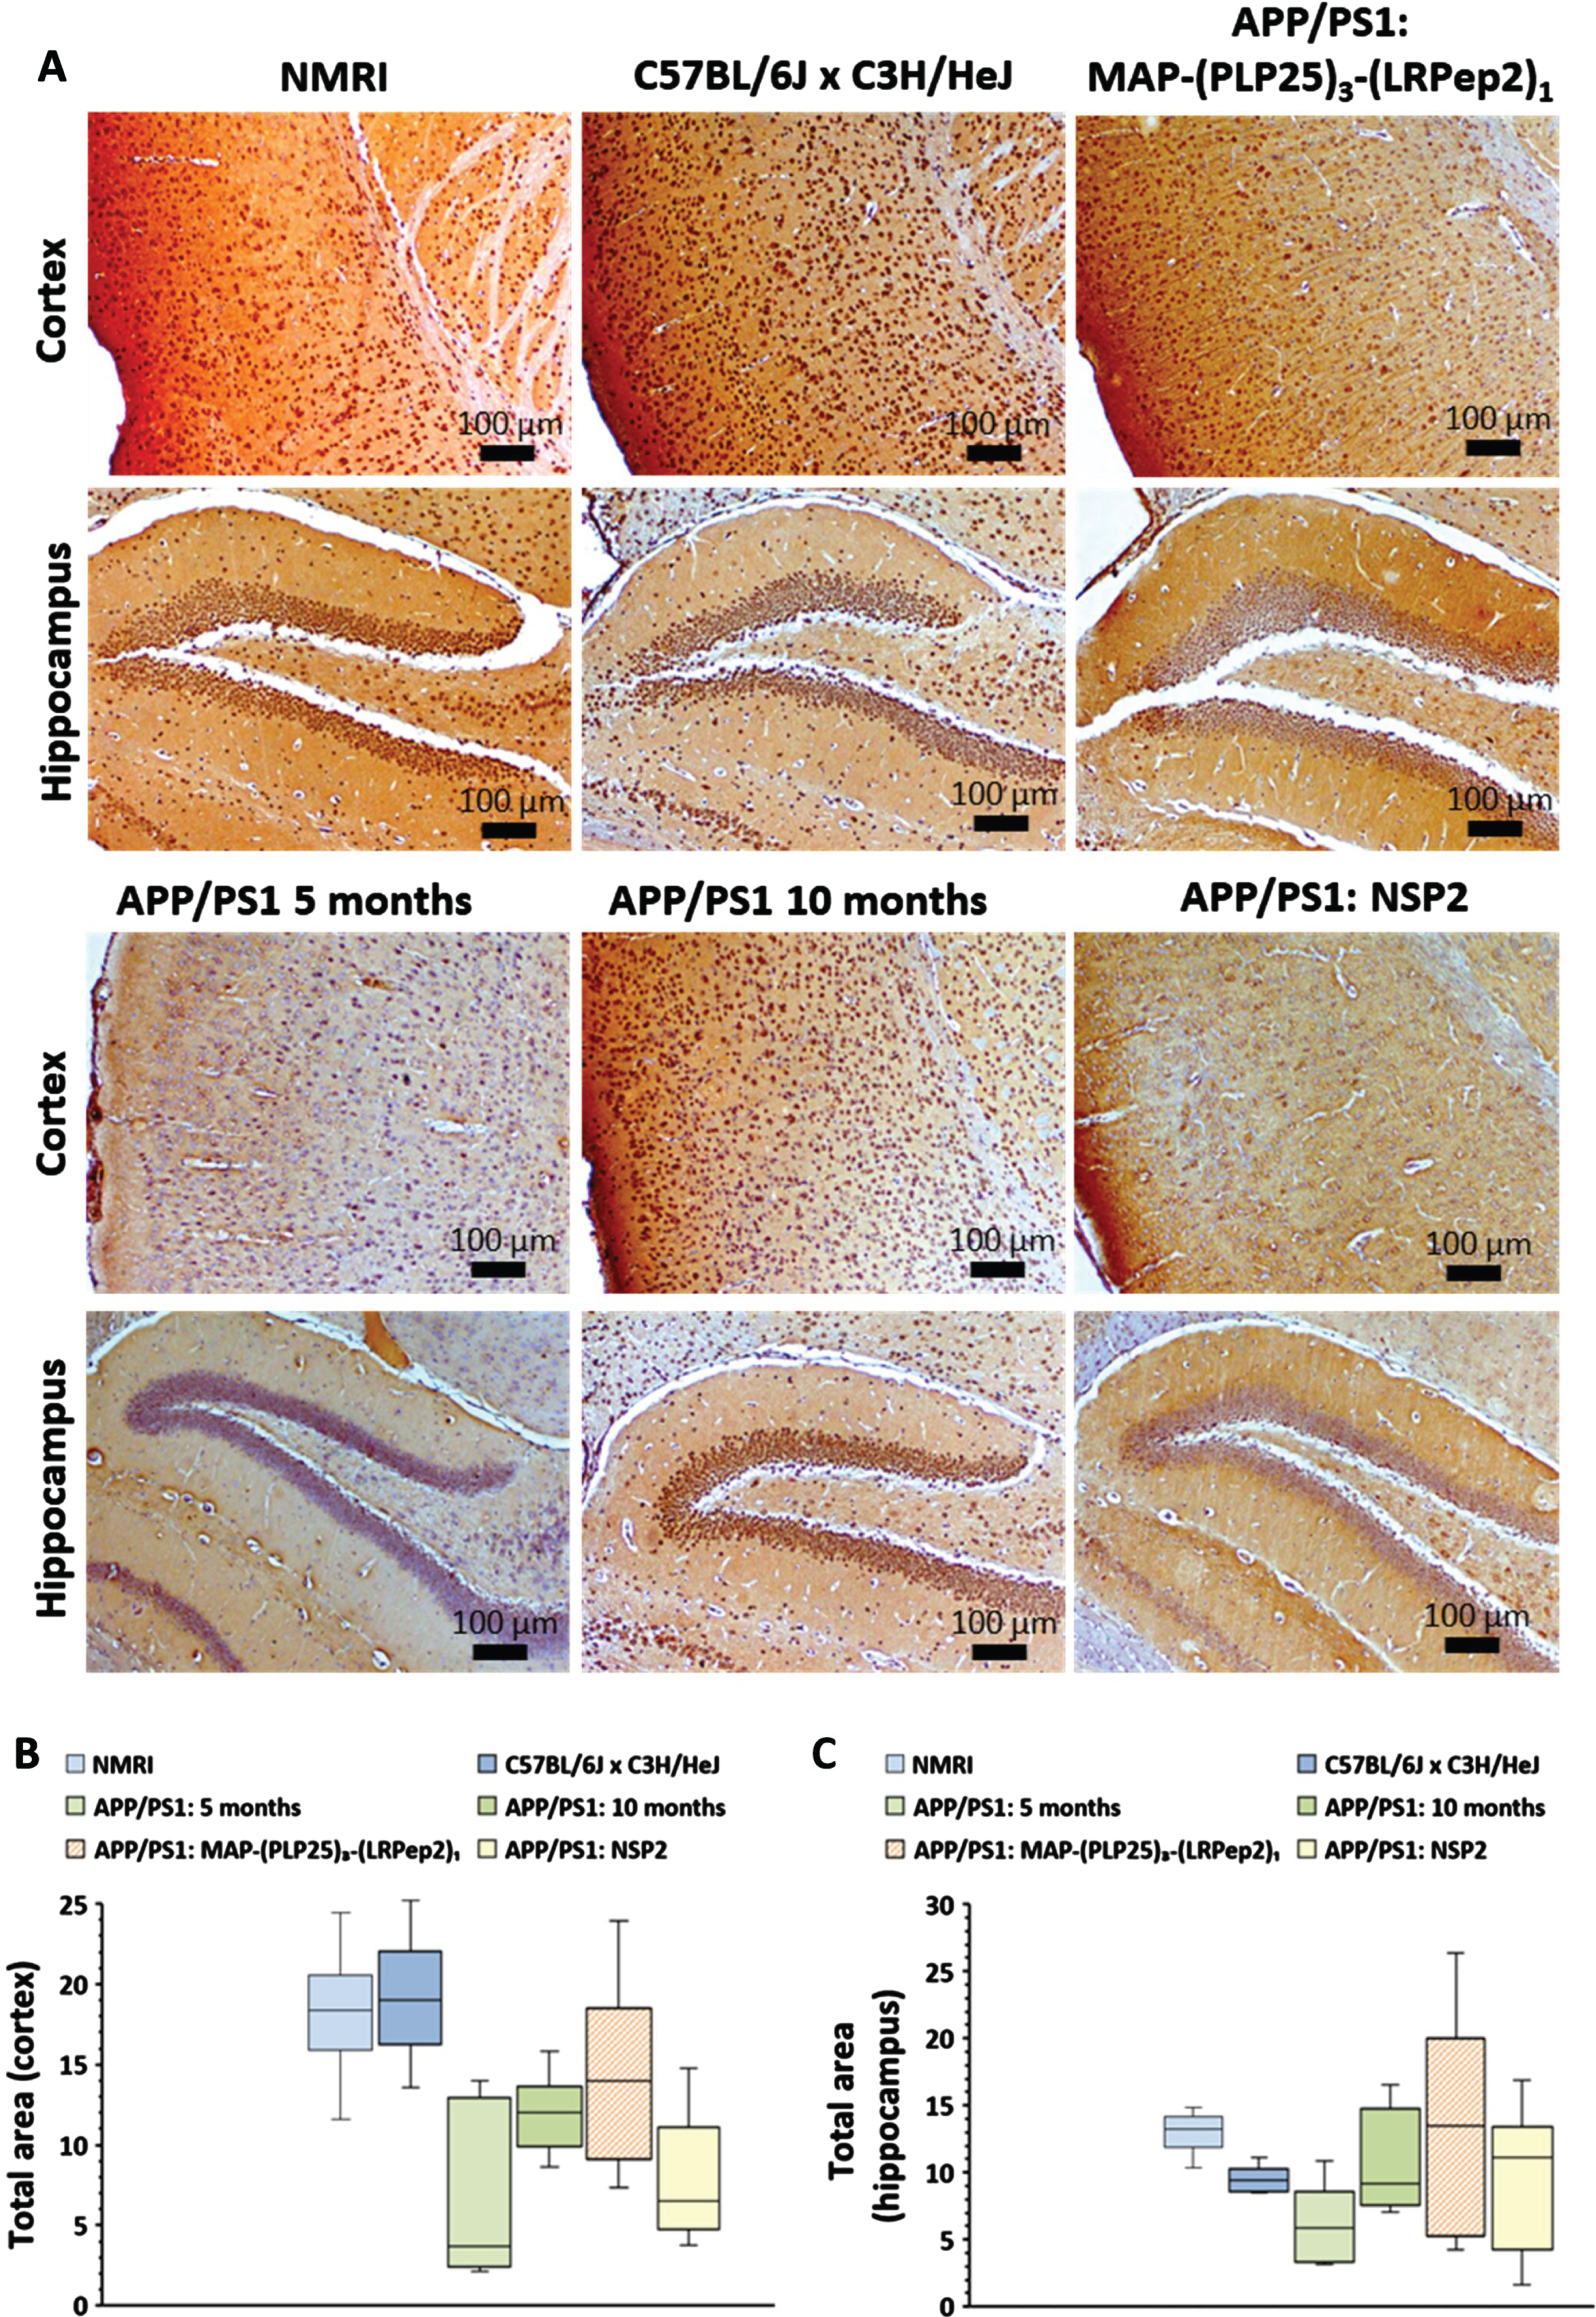
ImageJ analysis of the NMDAR labeling confirms these observations. In hippocampus (Fig. 11 C), no statistical differences are observed except between the two groups of healthy mice, as well as between NMRI mice and 5-month-old APP/PS1 mice (for statistics, please see Supplementary Tables 7 and 8). In cortex (Fig. 11B), healthy mice have significant labeling of NMDAR, and significantly different from untreated mice, whether 5- or 10-month-old (NMRI: p < 0.001, C57BL/6JxC3H/HeJ: p < 0.05). Furthermore, no statistically significant difference is observed between the two groups of untreated APP/PS1 mice, suggesting that there is no worsening of the phenomenon over this period. However, as already observed for cPLA2-IVA, 10-month-old APP/PS1 mice appear to be “less impacted” than 5-month-old mice. These similar observations between cPLA2-IVA and NMDAR suggest that this is no coincidence and is likely a self-regulatory mechanism.
Interestingly, treatment with MAP-(PLP25)3-(LRPep2)1 shows a statistically significant increased labeling compared to 5-month-old APP/PS1 mice (p < 0.05), while NSP2 does not produce a significant effect. Additionally, the difference between MAP-(PLP25)3-(LRPep2)1-treated APP/PS1 mice and healthy C57BL/6JxC3H/HeJ mice is not significant, while mice treated with NSP2 have statistically lower labeling (p < 0.001), reflecting the therapeutic potential of MAP-(PLP25)3-(LRPep2)1.
Detection of phosphorylated tau protein (p-Ser199). Tau protein hyperphosphorylation and neurofibrillary tangle formation represent the other pathological feature of AD, and Aβ and cPLA2-IVA play a role in this phenomenon mainly via the GSK-3β activation [20, 22, 64].
It is generally accepted that transgenic mice developed for amyloid pathology do not develop neurofibrillary degeneration. Nevertheless, recent preliminary results suggest tauopathy could be observed in these mouse models [65], and given the key role of cPLA2-IVA and the beneficial effect of its inhibition in our APP/PS1 mice, we sought to investigate if an effect could be observed on tau protein phosphorylation. For this purpose, phosphorylation of the Ser199 residue (p-Ser199-Tau) was studied. Ser199 can be phosphorylated by GSK-3β and cdk5, two kinases activated by inflammatory products from AA metabolism, and it is reported that phosphorylation by GSK-3β is facilitated by primary phosphorylation by cdk5, highlighting the link between these two kinases and cPLA2-IVA [66].
p-Ser199-Tau seems to be found mainly in the cell bodies of the cortex in healthy mice, while this labeling “disappears” in APP/PS1 mice, in relationship with their age (Fig. 12A). Interestingly, mice treated with MAP-(PLP25)3-(LRpep2)1 show similar labeling to healthy mice, while mice treated with NSP2 approach untreated APP/PS1 mice.
Fig. 12
A) P-Tau (Ser199) detected by IHC in the cortex of healthy C57BL/6J x C3H/HeJ and APP/PS1 brain slices, treated with MAP-(PLP25)3-(LRPep2)1 or NSP2, or non-treated (APP/PS1 5 months, 10 months and 2 years). B) P-Tau (Ser199) in the cell processes on healthy C57BL/6J x C3H/HeJ and APP/PS1 brain slices, treated with MAP-(PLP25)3-(LRPep2)1 or NSP2, or non-treated (APP/PS1 5 and 10 months). P-Tau is highlighted by the DAB and appears in brown. C) Total area labeled by the P-Tau in the cell bodies in the cortex. Statistics are regrouped in the Supplementary Table 9.
At the same time, a decreased cell body staining is observed in untreated APP/PS1 mice concomitantly with a “filamentous” labeling (Fig. 12B), which may reveal the presence of p-Ser199-Tau protein in cell projections, such as the axon. In the hippocampus, these “filaments” are more easily observable in APP/PS1 mice not treated or treated with NSP2. Nevertheless, the resolution of these images does not allow us to conclude that APP/PS1 mice develop tauopathy but they bring interesting perspectives to explore in the future.
Cell body staining was analyzed by ImageJ (Fig. 12 C), showing an important labeling in healthy C57BL/6JxC3H/HeJ mice and APP/PS1 mice treated with MAP-(PLP25)3-(LRPep2)1, the latter being even statistically more pronounced than in healthy mice (p < 0.05, please see Supplementary Table 9). Untreated APP/PS1 mice have a statistically smaller stained surface area than healthy mice (APP/PS1 5 and 10 months: p < 0.05, APP/PS1 2 years: p < 0.001) and APP/PS1 mice treated with MAP-(PLP25)3-(LRPep2)1 (p < 0.001), but identical to APP/PS1 mice treated with NSP2 (p < 0.001 vs. C57BL/6JxC3H/HeJ and APP/PS1 MAP-(PLP25)3-(LRPep2)1).
Detection of AβPP. AβPP is a transmembrane protein that, once cleaved by β-secretase and γ-secretase, generates Aβ. APP/PS1 mice are genetically modified to overexpress chimeric (murine/human) APP carrying the Swedish mutation as well as a mutated human presenilin 1, both mutations allowing a greater Aβ secretion [67].
Considering that cPLA2-IVA is involved in the AβPP overexpression and in the expression and/or activation of β- and γ-secretases [14–16], we investigated the effect of MAP-(PLP25)3-(LRPep2)1 on AβPP expression.
AβPP labeling appears to be located primarily on cell membrane in brain sections of healthy C57BL/6JxC3H/HeJ mice, while dense intracellular labeling is observable for untreated APP/PS1 mice aged 10 months (Fig. 13A). This changed location is related to the cleavage site of AβPP. Indeed, in healthy mice, the cleavage of AβPP by α-secretase occurs mainly at the plasma membrane, while the activity of β-secretase is optimal at acidic pH, which corresponds to endosomes and the cisternae of the Golgi apparatus [68, 69]. Interestingly, brain sections of APP/PS1 mice treated with NSP2 show a similar staining to that of APP/PS1 mice, while mice treated with MAP-(PLP25)3-(LRPep2)1 show somewhat less dense intracellular labeling.
Fig. 13
A) AβPP detected by IHC in the cortex of healthy C57BL/6J x C3H/HeJ and APP/PS1 brain slices, treated with MAP-(PLP25)3-(LRPep2)1 or NSP2, or non-treated (APP/PS1 10 months). AβPP is highlighted by the DAB and appears in brown. B) Total area labeled by the AβPP in the cell bodies in the cortex. * p < 0.05, ** p < 0.001 (Mann-Whitney).
The stained sections were analyzed by measuring the labeled area at the cell body level on untreated APP/PS1 mouse sections, whose threshold was transferred to the other groups of mice (Fig. 13B). This analysis initially confirms that APP/PS1 mice have much greater intracellular labeling than healthy C57BL/6JxC3H/HeJ mice (p < 0.001). However, no statistically significant differences were observed between the untreated APP/PS1 mice and the two groups of treated mice. This suggests that, under our conditions (age of mice and duration of treatment), inhibition of cPLA2-IVA does not induce a significant decrease in AβPP expression, and therefore that the lower number of AP in mice treated with MAP-(PLP25)3-(LRPep2)1 probably results from inhibition of secretase activity. Nevertheless, if we look at all the data constituting the graph (Fig. 13B), APP/PS1 mice treated with MAP-(PLP25)3-(LRPep2)1 have 43% values in the domain of healthy mice, while APP/PS1 mice not treated and treated with NSP2 have only 33% and 31% respectively. This suggests that MAP-(PLP25)3-(LRPep2)1 may modulate AβPP expression via inhibition of cPLA2-IVA.
Conclusions and prospects
AD is an incurable neurodegenerative pathology whose prevalence is estimated to triple by 2050, generating a very significant cost for the society. Although the research is very active in this field and the explored therapeutic avenues are diverse and complex, the current treatment of AD patients is exclusively symptomatic.
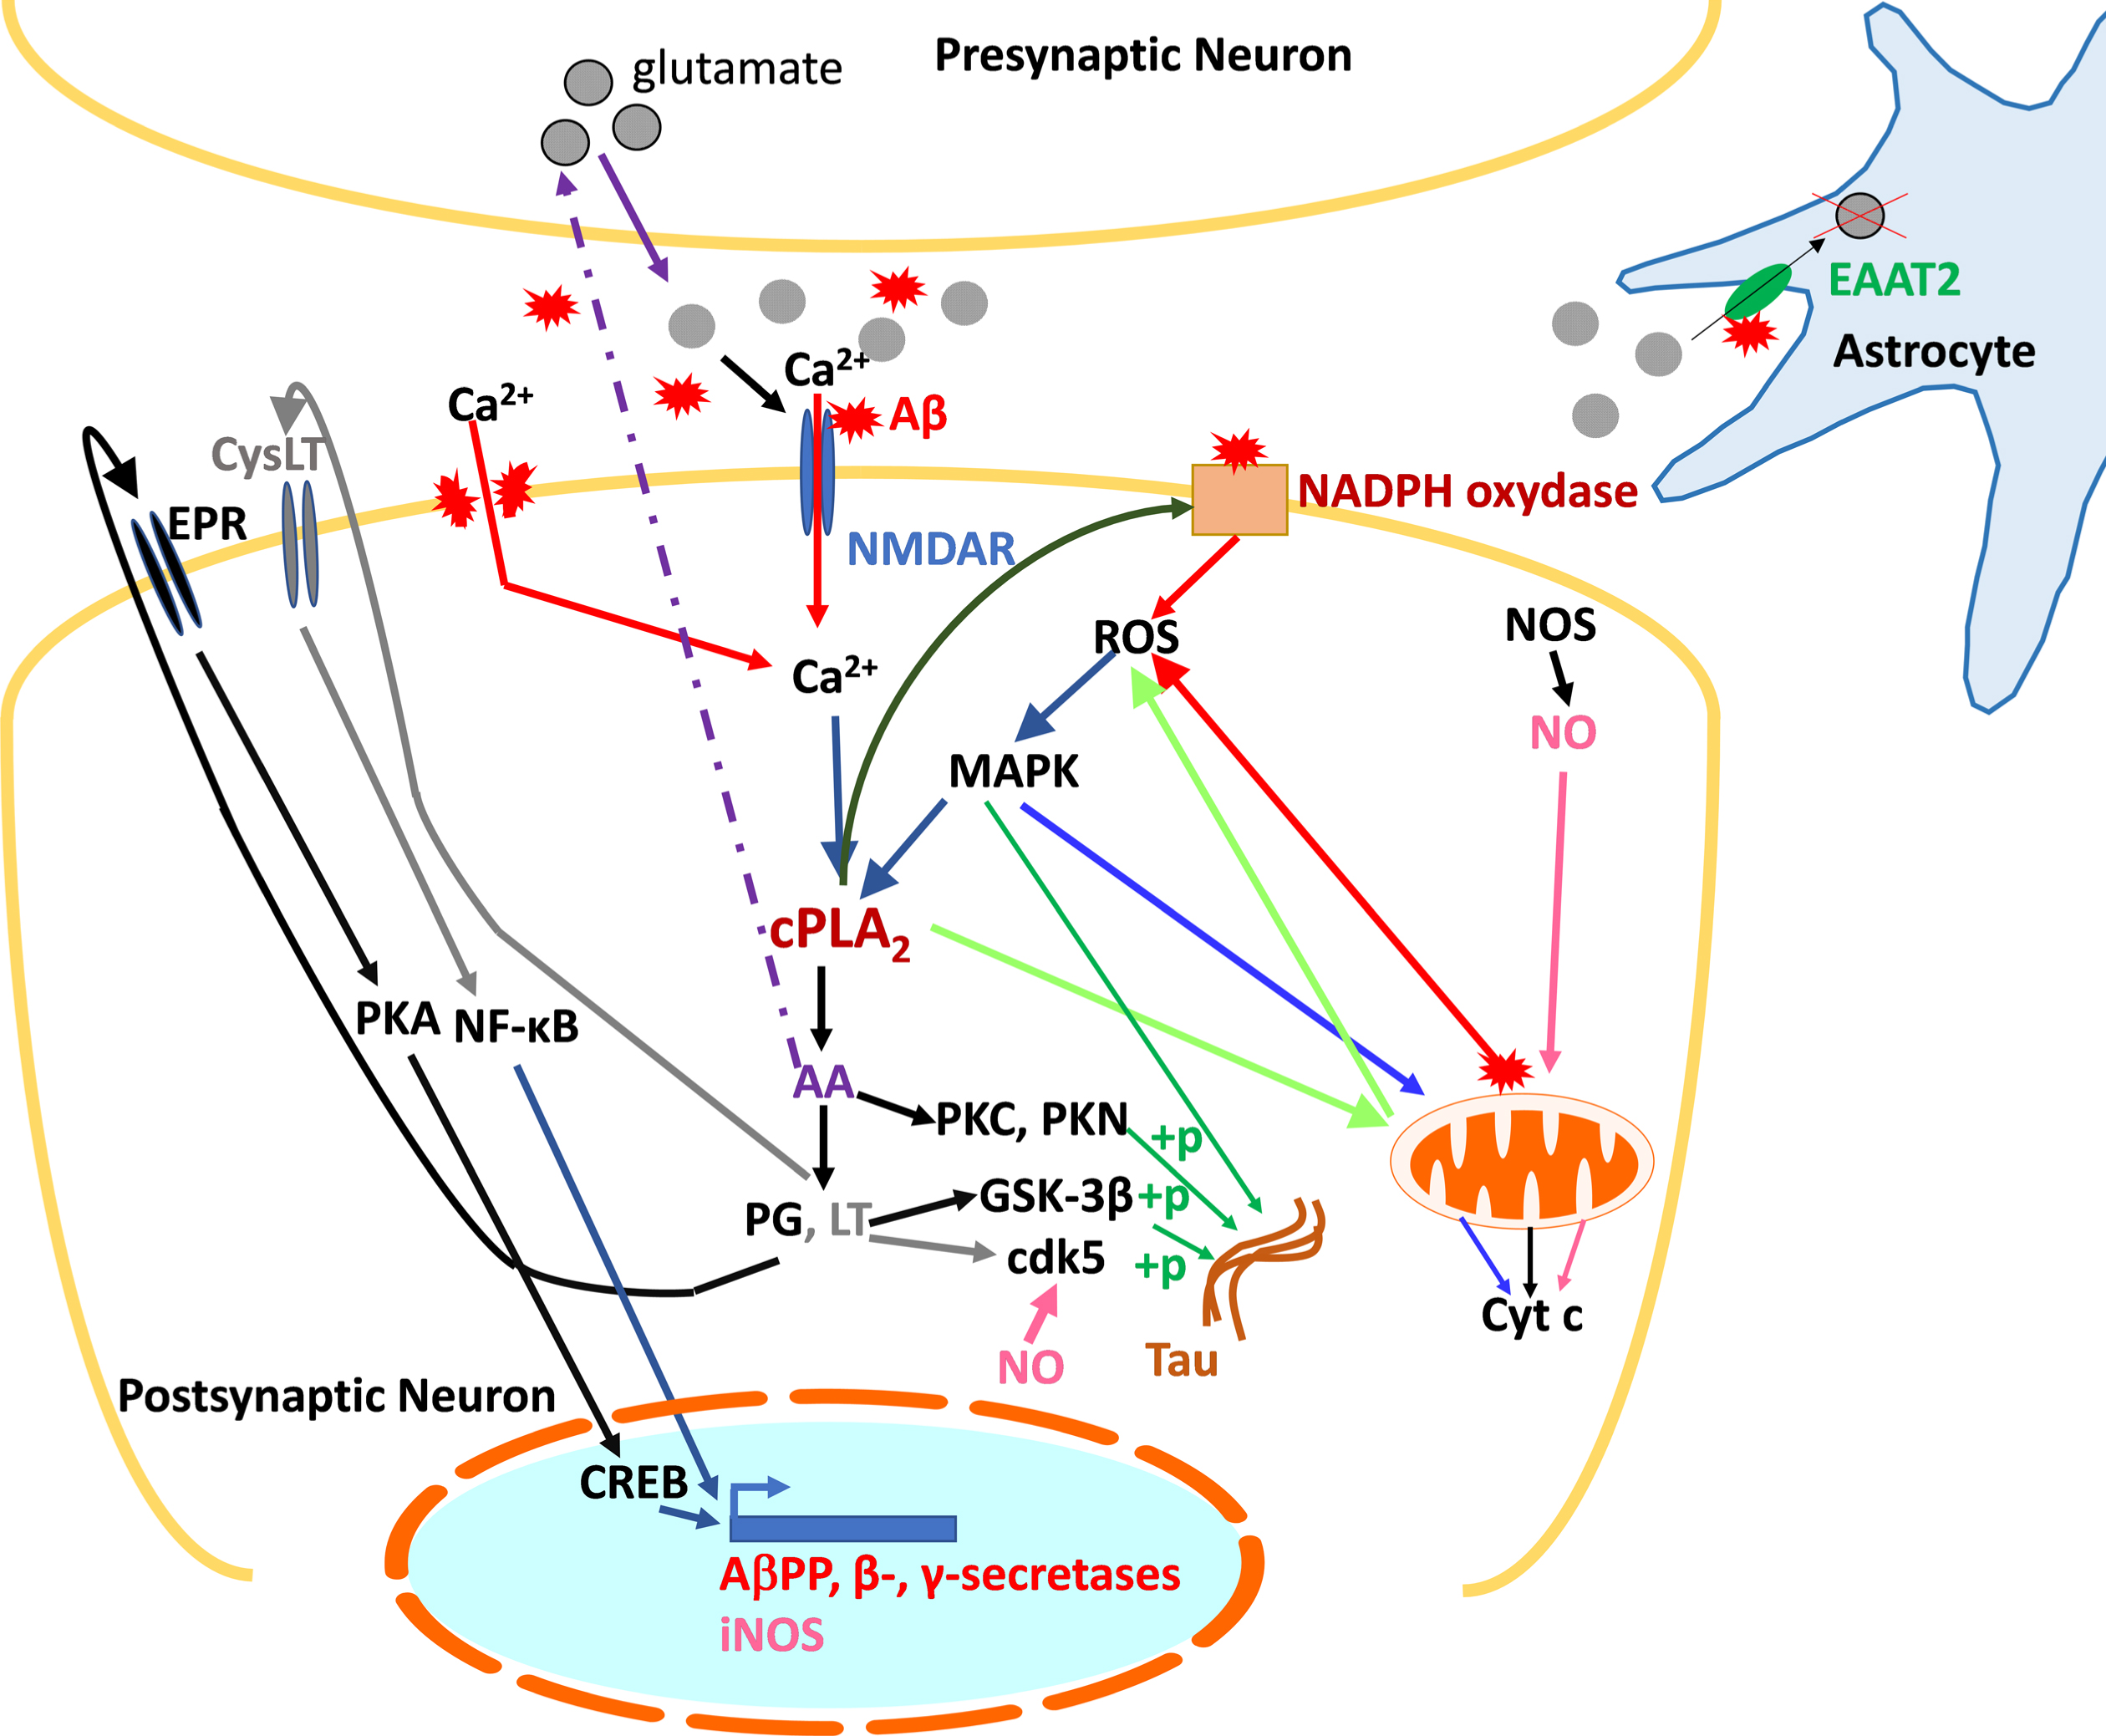
Faced with this challenge, it is necessary to identify other potential therapeutic targets. One of them is cPLA2-IVA, an isoform of PLA2 whose involvement in the AD pathophysiology is undeniable. Indeed, cPLA2-IVA is overexpressed and/or overactivated in the brain of AD patients, which causes many alterations at the cellular level, including neuroinflammation and oxidative stress, and finally apoptosis. In addition, Aβ promotes the activation of cPLA2-IVA, which, conversely, contributes to the Aβ accumulation. It also plays a role in the tau protein hyperphosphorylation, contributing to cytoskeleton disorganization and loss of synaptic function. cPLA2-IVA is thus at the center of the deleterious pathways leading to memory deficits and neuronal death observed in AD, and inhibition of this enzyme offers a promising therapeutic strategy. The data in the specialized scientific literature corroborated by our own studies allowed us to generate a schematic representation of cPLA2-IVA contribution to AD pathophysiology, aimed to facilitate the comprehension of these complex processes and thus the role of PLP25 within this signaling pathways (Fig. 14).
Fig. 14
Summary diagram of the role of cPLA2-IVA in the pathological mechanisms of AD at the neuronal level. cPLA2-IVA activated in response to excitotoxicity and the presence of Aβ contribute to the generation of inflammatory mediators involved in the expression of AβPP and secretases, thus participating in amyloid pathology, and in the phosphorylation of tau. The generated Aβ is then responsible for activating cPLA2-IVA. Concomitantly, through its action on membrane phospholipids, cPLA2-IVA contributes to the generation of ROS, harmful to the neuron, which in turn exacerbate its activation via the activation of MAPK. cPLA2-IVA is thus at the center of a vicious circle contributing to neuronal death.+p, phosphorylation; AA, arachidonic acid; Aβ, amyloid peptide; AβPP, amyloid-β protein precursor; Ca2+, calcium; cdk5, Cyclin Dependent Kinase 5; cPLA2, cytosolic phospholipase A2; CREB, cAMP Response Element-binding protein; CysLT, leukotriene receptor (LT); Cyt c, cytochrome c; EAAT2, Excitatory amino acid transporter 2; EPR, prostaglandin receptor (PG); GSK-3β, Glycogen synthase kinase 3 beta; LT, leukotrienes; MAPK, mitogen-activated protein kinases; NF-κB, Nuclear Factor-kappa B; NMDAR, NMDA receptor; NOS, nitric oxide synthase (i: inducible); PG, prostaglandins; PKA/PKC/PKN, protein kinases A, C, and N; ROS, reactive oxygen species.
Our work was thus focused on the search for peptides able to inhibit cPLA2-IVA, specifically by binding the C2 domain of this enzyme, responsible for its translocation to cell membranes. The phage display panning allowed to select three peptides capable to bind efficiently C2-cPLA2-IVA and inhibit its interaction with PC.
The in silico analysis of the binding of these three peptides (PLP1, PLP2, and PLP25) suggests that the PLP2 and PLP25 peptides bind at the Ca2+ binding site, with the PLP25 conformation more likely to prevent its binding, Ca2+ being responsible for initiating the cPLA2-IVA translocation to the membranes where the enzyme exerts its activity. This region is also important for the enzyme’s anchoring to membranes, PLP25 being optimally placed at the level of the 3rd β-sheet of C2-cPLA2-IVA, which would suggest its potential to hinder the electrostatic interaction of the latter with the polar heads of membrane phospholipids. The PLP1 peptide seems to bind mainly the β-sheets of C2-cPLA2-IVA, this region of the C2 domain being involved in the enzyme’s stabilization at the membrane level. This in silico analysis and the detailed examination of the sequences suggest that the PLP25 peptide is the most promising for inhibiting cPLA2-IVA. These optimal binding properties of PLP25 towards cPLA2-IVA were confirmed by IHC, which led to its selection for supplementalevaluation.
cPLA2-IVA is an enzyme responsible of AA cleavage at the membrane phospholipid level. To evaluate the inhibitory potential of our PLP25 peptide, the amount of AA released in vitro by the cells was determined by ELISA. In neurons, the activation of cPLA2-IVA is associated with that of NMDAR [7] which, in the presence of an excitotoxic concentration of glutamate in AD, opens and causes a massive Ca2 + inflow. Activation of cPLA2-IVA is also caused by oxidative stress, where ROS are involved in the activation of kinases phosphorylating cPLA2-IVA [52]. The activation of cPLA2-IVA by glutamate or H2O2 resulted in a significantly increased AA release by 1321N1 and NT2/D1n cells. The inhibitory potential of PLP25 was then studied, in its monovalent, polyvalent homomeric state or combined with the vector peptide LRPep2, designed to cross the BBB. Our results have shown that PLP25 has an inhibitory effect on cPLA2-IVA activity and that the combination St-(PLP25)3-(LRPep2)1 retains the inhibitory effect of PLP25.
The characterization and validation of PLP25 was continued by IF with the goal to study the behavior of cPLA2-IVA under excitotoxic conditions and to understand the inhibition mechanism exerted by St-(PLP25)3-(LRPep2)1. The activated cPLA2-IVA migrates to cell projections and to intracellular organelles, whereas peptide complex can block these phenomena.
The in vivo studies of PLP25 evaluation were carried out on double transgenic APP/PS1 mice. This mouse model of AD is commonly used to study amyloid pathology in vivo, but does not bring together all the characteristics of AD. Thus, there are transgenic triple mice, intended to develop both amyloid pathology and tauopathy. Nevertheless, we have chosen to use APP/PS1 mice because the link between cPLA2-IVA and Aβ is well documented and to avoid a more complex interpretation of the obtained results.
These mice were treated with MAP-(PLP25)3-(LRPep2)1, a dendrimer covalently coupled with peptides PLP25 (the therapeutic peptide) and LRPep2 (the vector peptide), and the effect of this complex was compared to that of NSP2. Our previous studies performed with the vector peptide LRPep2 coupled to USPIO (USPIO-LRPep2) have shown that 3.7% of the injected dose per gram of wet tissue crossed over the BBB to attain the brain tissue 55 min post-injection [45]. Based on this scientific evidence, we have theoretically calculated that a concentration of about 0.74 μM (0.74 •10–6 M) of MAP-(PLP25)3-(LRPep2)1 (i.e., about 2 μmol (2 •10–6 mol)/g of brain tissue) would attain the brain of mice injected with 2 μmol/kg. b.w., considering that its blood concentration at T0 post-injection should be of about 20 μM (20 •10–6 M). This amount of MAP-(PLP25)3-(LRPep2)1 is in the range of its IC50 (5.08 μM; 5.08 •10–6 M), determined in the present work on NT2/D1n cells, and of non-toxic concentrations (0.2–200 μM; 0.2 •10–6 – 200 •10–6 M) assessed in the present work on HepaRG hepatic cell line and confirmed on blood plasma collected from mice at the end of in vivo experiments. Surprisingly, MAP-(PLP25)3-(LRPep2)1 presented a favorable effect on blood plasma glucose, which was decreased compared to the mice treated with NSP2 and APP/PS1 mice aged 10 months. As shown by literature, glucose homeostasis is impaired in AD, including in APP/PS1 mice [70], and MAP-(PLP25)3-(LRPep2)1 could putatively contribute to the cognitive improvement by restoring this physiological parameter. According to literature, AA released by cPLA2-IVA deregulates insulin secretion by β-cells through a metabolicdisfunction [71].
A follow-up of the cognitive functions of mice throughout the treatment period with MAP-(PLP25)3-(LRPep2)1 revealed that our therapeutic complex allows an apparent maintenance of these functions, these mice making fewer errors than the NSP2-treated mice and spending most of the test time in the quadrant of interest. At the pathophysiological level, the treatment of APP/PS1 mice with MAP-(PLP25)3-(LRPep2)1 significantly reduced the accumulation of Aβ, shown by MRI and IHC, but also modulated several biomarkers important in the AD pathophysiology. Thus, the levels of cPLA2-IVA expression, increased in sick animals, and NMDAR, decreased in this pathology, tend to be restored to healthy levels. The link between Aβ, cPLA2-IVA and NMDAR is particularly important in AD, and it appears that our therapeutic strategy can block the vicious cycle that exists between them. Thus, the inhibition of cPLA2-IVA, whose involvement in the Aβ production is clear [14–16], reduces this production, probably resulting in a decrease in overall excitotoxicity, but also contributing to a decrease in Aβ-induced synaptic NMDARendocytosis [61].
In view of the various analyzed elements, it seems important to us to refocus attention on a crucial point. The therapeutic targeting of Aβ offers inconclusive results so far [72–74], and the use of immunotherapies against Aβ does not necessarily cause an improvement in cognitive functions despite the decrease in cerebral amyloid deposits [75, 76]. It is therefore useful to highlight that the targeting of cPLA2-IVA allows to obtain cognitive improvements in parallel with the modulation of different investigated biomarkers, as has already been shown with mice KO for cPLA2-IVA [27].
Finally, the preliminary results regarding the effect of our treatment on the tau protein and AβPP open very interesting perspectives to explore and develop. cPLA2-IVA is involved in the phosphorylation of tau protein [18, 20, 21], and, under our experimental conditions, inhibition of cPLA2-IVA appears to play a role in this phosphorylation state and/or localization of the tau protein at the cellular level. In parallel, as mentioned earlier, cPLA2-IVA plays a role in the production of Aβ by modulating AβPP expression and secretase activity, and our IHC results tend to suggest that inhibition of cPLA2-IVA under our experimental conditions could provide a beneficial effect at this level.
A more detailed analysis of the effect of our PLP25 therapeutic peptide will be carried out in order to properly confirm its mechanism of action in vivo. Indeed, in this work we focused to the proof of concept by showing in vitro the reduction of AA production and in vivo the improvement of spatial memory and the effect on some key markers’ levels such as AP and the cPLA2-IVA expression itself. It is necessary now to consolidate our results by increasing the number of animals per group, verify the proportion of peptide crossing the BBB and present in the brain after i.v. injection, measure the AA and compare levels with and without PLP25 injection to control mice, test shorter/longer time treatments as well as delayed start treatment.
We will also verify the distribution of the peptide in the mouse body and ensure the non-toxicity in vivo of our complex. Indeed, we have used in our studies the LRPep2 peptide, a facilitating peptide for BBB crossing and brain penetration, showing a quick entry and relatively long residence in brain [45], but we did not yet study the biodistribution of our MAP-(PLP25)3-(LRPep2)1 complex after i.v. injection. We rationally suppose that MAP-(PLP25)3-(LRPep2)1 gets into the brain thanks to the better spatial memory results and the lower AP observed after its administration, but an extensive pharmacokinetic study will be done to properly illustrate the presence of our therapeutic complex in brains and verify its potential accumulation in other organs (e.g., liver, kidneys). The pharmacokinetics studies need the coupling of a chemical moiety (i.e., paramagnetic or superparamagnetic moiety, fluorescent molecule, radioelement) to MAP-(PLP25)3-(LRPep2)1 complex allowing its detection in organs either in vivo by imaging (i.e., MRI, optical or nuclear imaging) or ex vivo by spectroscopy (i.e., NMR, inductively coupled atomic absorption). Alternatively, the MAP-(PLP25)3-(LRPep2)1 complex could be detected in mouse brain by modern mass spectrometry methods, such as Multiple Reaction Monitoring (MRM) [77] and Matrix-Assisted Laser Desorption/Ionization (MALDI) imaging [78].
ACKNOWLEDGMENTS
Ms. Françoise Coulon from the Department of Histology of UMONS is gratefully acknowledged for her help with histology techniques. Marie Delcroix, Fatima Daldal, Marine Lecomte, Jean Atakana, and Sofiane Bendiab, students in our lab at different stages of this study, are warmly thanked for theirhelp.
FUNDING
This work was supported by the ARC (Actions de Recherche Concertée) of the French Community of Belgium, the FRMH (Fond pour la Recherche Médicale en Hainaut) and the Rotary Club.
CONFLICT OF INTEREST
The authors have no conflict of interest to report.
DATA AVAILABILITY
All data are available upon request to the corresponding author.
SUPPLEMENTARY MATERIAL
[1] The supplementary material is available in the electronic version of this article: https://dx.doi.org/10.3233/ADR-230075.
REFERENCES
[1] | Breijyeh Z , Karaman R ((2020) ) Comprehensive review on Alzheimer’s disease: Causes and treatment. Mol Basel Switz 25: , 5789. |
[2] | Salomone S , Caraci F , Leggio GM , Fedotova J , Drago F ((2012) ) New pharmacological strategies for treatment of Alzheimer’s disease: Focus on disease modifying drugs. Br J Clin Pharmacol 73: , 504–517. |
[3] | Graham WV , Bonito-Oliva A , Sakmar TP ((2017) ) Update on Alzheimer’s disease therapy and prevention strategies. Annu Rev Med 68: , 413–430. |
[4] | Godyń J , Jończyk J , Panek D , Malawska B ((2016) ) Therapeutic strategies for Alzheimer’s disease in clinical trials. Pharmacol Rep PR 68: , 127–138. |
[5] | Kudo I , Murakami M ((2002) ) Phospholipase A2 enzymes. Prostaglandins Other Lipid Mediat 68-69: , 3–58. |
[6] | Angelova PR , Müller WS ((2009) ) Arachidonic acid potently inhibits both postsynaptic-type Kv4.2 and presynaptic-type Kv1.4 IA potassium channels. Eur J Neurosci 29: , 1943–1950. |
[7] | Taylor AL , Bonventre JV , Uliasz TF , Hewett JA , Hewett SJ ((2008) ) Cytosolic phospholipase A2 alpha inhibition prevents neuronal NMDA receptor-stimulated arachidonic acid mobilization and prostaglandin production but not subsequent cell death. J Neurochem 106: , 1828–1840. |
[8] | Zhu P , Genc A , Zhang X , Zhang J , Bazan NG , Chen C ((2005) ) Heterogeneous expression and regulation of hippocampal prostaglandin E2 receptors. J Neurosci Res 81: , 817–826. |
[9] | Ross BM , Moszczynska A , Erlich J , Kish SJ ((1998) ) Phospholipid-metabolizing enzymes in Alzheimer’s disease: Increased lysophospholipid acyltransferase activity and decreased phospholipase A2 activity. J Neurochem 70: , 786–793. |
[10] | Schaeffer EL , da Silva ER , Novaes B de A , Skaf HD , Gattaz WF ((2010) ) Differential roles of phospholipases A2 in neuronal death and neurogenesis: Implications for Alzheimer disease. Prog Neuropsychopharmacol Biol Psychiatry 34: , 1381–1389. |
[11] | Shmelzer Z , Karter M , Eisenstein M , Leto TL , Hadad N , Ben-Menahem D , Gitler D , Banani S , Wolach B , Rotem M , Levy R ((2008) ) Cytosolic phospholipase A2alpha is targeted to the p47phox-PX domain of the assembled NADPH oxidase via a novel binding site in its C2 domain. J Biol Chem 283: , 31898–31908. |
[12] | Zhu D , Lai Y , Shelat PB , Hu C , Sun GY , Lee JC-M ((2006) ) Phospholipases A2 mediate amyloid-beta peptide-induced mitochondrial dysfunction. J Neurosci 26: , 11111–11119. |
[13] | Szaingurten-Solodkin I , Hadad N , Levy R ((2009) ) Regulatory role of cytosolic phospholipase A2alpha in NADPH oxidase activity and in inducible nitric oxide synthase induction by aggregated Abeta1-42 in microglia. Glia 57: , 1727–1740. |
[14] | Hoshino T , Namba T , Takehara M , Nakaya T , Sugimoto Y , Araki W , Narumiya S , Suzuki T , Mizushima T ((2009) ) Prostaglandin E2 stimulates the production of amyloid-beta peptides through internalization of the EP4 receptor. J Biol Chem 284: , 18493–18502. |
[15] | Sagy-Bross C , Kasianov K , Solomonov Y , Braiman A , Friedman A , Hadad N , Levy R ((2015) ) The role of cytosolic phospholipase A2 α in amyloid precursor protein induction by amyloid beta1-42: Implication for neurodegeneration. J Neurochem 132: , 559–571. |
[16] | Liang X , Wang Q , Hand T , Wu L , Breyer RM , Montine TJ , Andreasson K ((2005) ) Deletion of the prostaglandin E2 EP2 receptor reduces oxidative damage and amyloid burden in a model of Alzheimer’s disease. J Neurosci 25: , 10180–10187. |
[17] | Tang S-S , Wang X-Y , Hong H , Long Y , Li Y-Q , Xiang G-Q , Jiang L-Y , Zhang H-T , Liu L-P , Miao M-X , Hu M , Zhang T-T , Hu W , Ji H , Ye F-Y ((2013) ) Leukotriene D4 induces cognitive impairment through enhancement of CysLT1 R-mediated amyloid-β generation in mice. Neuropharmacology 65: , 182–192. |
[18] | Taniguchi T , Kawamata T , Mukai H , Hasegawa H , Isagawa T , Yasuda M , Hashimoto T , Terashima A , Nakai M , Mori H , Ono Y , Tanaka C ((2001) ) Phosphorylation of tau is regulated by PKN. J Biol Chem 276: , 10025–10031. |
[19] | Arnaud LT , Myeku N , Figueiredo-Pereira ME ((2009) ) Proteasome-caspase-cathepsin sequence leading to tau pathology induced by prostaglandin J2 in neuronal cells. J Neurochem 110: , 328–342. |
[20] | Cao L-L , Guan P-P , Liang Y-Y , Huang X-S , Wang P ((2019) ) Cyclooxygenase-2 is essential for mediating the effects of calcium ions on stimulating phosphorylation of tau at the sites of Ser 396 and Ser 404. J Alzheimers Dis 68: , 1095–1111. |
[21] | Yokoyama U , Iwatsubo K , Umemura M , Fujita T , Ishikawa Y ((2013) ) The prostanoid EP4 receptor and its signaling pathway. Pharmacol Rev 65: , 1010–1052. |
[22] | Joshi YB , Giannopoulos PF , Chu J , Sperow M , Kirby LG , Abood ME , Praticò D ((2014) ) Absence of ALOX5 gene prevents stress-induced memory deficits, synaptic dysfunction and tauopathy in a mouse model of Alzheimer’s disease. Hum Mol Genet 23: , 6894–6902. |
[23] | Giannopoulos PF , Joshi YB , Chu J , Praticò D ((2013) ) The 12-15-lipoxygenase is a modulator of Alzheimer’s-related tau pathology in vivo. Aging Cell 12: , 1082–1090. |
[24] | Sagy-Bross C , Hadad N , Levy R ((2013) ) Cytosolic phospholipase A2α upregulation mediates apoptotic neuronal death induced by aggregated amyloid-β peptide1-42. Neurochem Int 63: , 541–550. |
[25] | Kishida KT , Pao M , Holland SM , Klann E ((2005) ) NADPH oxidase is required for NMDA receptor-dependent activation of ERK in hippocampal area CA1. J Neurochem 94: , 299–306. |
[26] | Sun GY , He Y , Chuang DY , Lee JC , Gu Z , Simonyi A , Sun AY ((2012) ) Integrating cytosolic phospholipase A2 with oxidative/nitrosative signaling pathways in neurons: A novel therapeutic strategy for AD. Mol Neurobiol 46: , 85–95. |
[27] | Desbène C , Malaplate-Armand C , Youssef I , Garcia P , Stenger C , Sauvée M , Fischer N , Rimet D , Koziel V , Escanyé M-C , Oster T , Kriem B , Yen FT , Pillot T , Olivier JL ((2012) ) Critical role of cPLA2 in Aβ oligomer-induced neurodegeneration and memory deficit. Neurobiol Aging 33: , 1123.e17–29. |
[28] | Kriem B , Sponne I , Fifre A , Malaplate-Armand C , Lozac’h-Pillot K , Koziel V , Yen-Potin FT , Bihain B , Oster T , Olivier J-L , Pillot T ((2005) ) Cytosolic phospholipase A2 mediates neuronal apoptosis induced by soluble oligomers of the amyloid-beta peptide. FASEB J 19: , 85–87. |
[29] | Williams RSB , Bate C ((2016) ) An in vitro model for synaptic loss in neurodegenerative diseases suggests a neuroprotective role for valproic acid via inhibition of cPLA2 dependent signalling. Neuropharmacology 101: , 566–575. |
[30] | Kihara Y , Yanagida K , Masago K , Kita Y , Hishikawa D , Shindou H , Ishii S , Shimizu T ((2008) ) Platelet-activating factor production in the spinal cord of experimental allergic encephalomyelitis mice via the group IVA cytosolic phospholipase A2-lyso-PAFAT axis. J Immunol 181: , 5008–5014. |
[31] | Hegen M , Sun L , Uozumi N , Kume K , Goad ME , Nickerson-Nutter CL , Shimizu T , Clark JD ((2003) ) Cytosolic phospholipase A2alpha-deficient mice are resistant to collagen-induced arthritis. J Exp Med 197: , 1297–1302. |
[32] | Nagase T , Uozumi N , Ishii S , Kita Y , Yamamoto H , Ohga E , Ouchi Y , Shimizu T ((2002) ) A pivotal role of cytosolic phospholipase A(2) in bleomycin-induced pulmonary fibrosis. Nat Med 8: , 480–484. |
[33] | Uozumi N , Kume K , Nagase T , Nakatani N , Ishii S , Tashiro F , Komagata Y , Maki K , Ikuta K , Ouchi Y , Miyazaki J , Shimizu T ((1997) ) Role of cytosolic phospholipase A2 in allergic response and parturition. Nature 390: , 618–622. |
[34] | Hong KH , Bonventre JC , O’Leary E , Bonventre JV , Lander ES ((2001) ) Deletion of cytosolic phospholipase A(2) suppresses Apc(Min)-induced tumorigenesis. Proc Natl Acad Sci U S A 98: , 3935–3939. |
[35] | Patel MI , Singh J , Niknami M , Kurek C , Yao M , Lu S , Maclean F , King NJC , Gelb MH , Scott KF , Russell PJ , Boulas J , Dong Q ((2008) ) Cytosolic phospholipase A2-alpha: A potential therapeutic target for prostate cancer. Clin Cancer Res 14: , 8070–8079. |
[36] | Meyer AM , Dwyer-Nield LD , Hurteau GJ , Keith RL , O’Leary E , You M , Bonventre JV , Nemenoff RA , Malkinson AM ((2004) ) Decreased lung tumorigenesis in mice genetically deficient in cytosolic phospholipase A2. Carcinogenesis 25: , 1517–1524. |
[37] | Sanchez-Mejia RO , Newman JW , Toh S , Yu G-Q , Zhou Y , Halabisky B , Cissé M , Scearce-Levie K , Cheng IH , Gan L , Palop JJ , Bonventre JV , Mucke L ((2008) ) Phospholipase A2 reduction ameliorates cognitive deficits in a mouse model of Alzheimer’s disease. Nat Neurosci 11: , 1311–1318. |
[38] | Kalyvas A , David S ((2004) ) Cytosolic phospholipase A2 plays a key role in the pathogenesis of multiple sclerosis-like disease. Neuron 41: , 323–335. |
[39] | Chuang DY , Simonyi A , Kotzbauer PT , Gu Z , Sun GY ((2015) ) Cytosolic phospholipase A2 plays a crucial role in ROS/NO signaling during microglial activation through the lipoxygenase pathway. J Neuroinflammation 12: , 199. |
[40] | McKew JC , Lovering F , Clark JD , Bemis J , Xiang Y , Shen M , Zhang W , Alvarez JC , Joseph-McCarthy D ((2003) ) Structure-activity relationships of indole cytosolic phospholipase A(2)alpha inhibitors: Substrate mimetics. Bioorg Med Chem Lett 13: , 4501–4504. |
[41] | Zhao Z , Liu N , Huang J , Lu P-H , Xu X-M ((2011) ) Inhibition of cPLA2 activation by Ginkgo biloba extract protects spinal cord neurons from glutamate excitotoxicity and oxidative stress-induced cell death. J Neurochem 116: , 1057–1065. |
[42] | Weerasinghe GR , Rapoport SI , Bosetti F ((2004) ) The effect of chronic lithium on arachidonic acid release and metabolism in rat brain does not involve secretory phospholipase A2 or lipoxygenase/cytochrome P450 pathways. Brain Res Bull 63: , 485–489. |
[43] | Solomonov Y , Hadad N , Levy R ((2016) ) Reduction of cytosolic phospholipase A2α upregulation delays the onset of symptoms in SOD1G93A mouse model of amyotrophic lateral sclerosis. J Neuroinflammation 13: , 134. |
[44] | Liu H , Zuo F , Wu H ((2017) ) Blockage of cytosolic phospholipase A2 alpha by monoclonal antibody attenuates focal ischemic brain damage in mice. Biosci Trends 11: , 439–449. |
[45] | André S , Larbanoix L , Verteneuil S , Stanicki D , Nonclercq D , Vander Elst L , Laurent S , Muller RN , Burtea C ((2020) ) Development of an LDL receptor-targeted peptide susceptible to facilitate the brain access of diagnostic or therapeutic agents. Biology 9: , 161. |
[46] | Pitts MW ((2018) ) Barnes maze procedure for spatial learning and memory in mice. Bio-Protoc 8: , e2744. |
[47] | André S , Ansciaux E , Saidi E , Larbanoix L , Stanicki D , Nonclercq D , Vander Elst L , Laurent S , Muller RN , Burtea C ((2017) ) Validation by magnetic resonance imaging of the diagnostic potential of a heptapeptide-functionalized imaging probe targeted to amyloid-β and able to cross the blood-brain barrier. J Alzheimers Dis 60: , 1547–1565. |
[48] | Ansciaux E , Burtea C , Laurent S , Crombez D , Nonclercq D , Vander Elst L , Muller RN ((2015) ) In vitro and in vivo characterization of several functionalized ultrasmall particles of iron oxide, vectorized against amyloid plaques and potentially able to cross the blood-brain barrier: Toward earlier diagnosis of Alzheimer’s disease by molecular imaging. Contrast Media Mol Imaging 10: , 211–224. |
[49] | Larbanoix L , Burtea C , Laurent S , Van Leuven F , Toubeau G , Vander Elst L , Muller RN ((2010) ) Potential amyloid plaque-specific peptides for the diagnosis of Alzheimer’s disease. Neurobiol Aging 31: , 1679–1689. |
[50] | Perisic O , Fong S , Lynch DE , Bycroft M , Williams RL ((1998) ) Crystal structure of a calcium-phospholipid binding domain from cytosolic phospholipase A2. J Biol Chem 273: , 1596–1604. |
[51] | Zhou P , Jin B , Li H , Huang S-Y ((2018) ) HPEPDOCK: A web server for blind peptide-protein docking based on a hierarchical algorithm. Nucleic Acids Res 46: , W443–W450. |
[52] | Brookes PS , Yoon Y , Robotham JL , Anders MW , Sheu S-S ((2004) ) Calcium, ATP, and ROS: A mitochondrial love-hate triangle. Am J Physiol Cell Physiol 287: , C817–833. |
[53] | Peper A ((2009) ) Aspects of the relationship between drug dose and drug effect. Dose-Response Publ Int Hormesis Soc 7: , 172–192. |
[54] | Gray BP , Li S , Brown KC ((2013) ) From phage display to nanoparticle delivery: Functionalizing liposomes with multivalent peptides improves targeting to a cancer biomarker. Bioconjug Chem 24: , 85–96. |
[55] | Gotthardt M , Trommsdorff M , Nevitt MF , Shelton J , Richardson JA , Stockinger W , Nimpf J , Herz J ((2000) ) Interactions of the low density lipoprotein receptor gene family with cytosolic adaptor and scaffold proteins suggest diverse biological functions in cellular communication and signal transduction. J Biol Chem 275: , 25616–25624. |
[56] | Lane-Donovan C , Philips GT , Herz J ((2014) ) More than cholesterol transporters: Lipoprotein receptors in CNS function and neurodegeneration. Neuron 83: , 771–787. |
[57] | Li Y , Cam J , Bu G ((2001) ) Low-density lipoprotein receptor family: Endocytosis and signal transduction. Mol Neurobiol 23: , 53–67. |
[58] | Gawel K , Gibula E , Marszalek-Grabska M , Filarowska J , Kotlinska JH ((2019) ) Assessment of spatial learning and memory in the Barnes maze task in rodents-methodological consideration. Naunyn Schmiedebergs Arch Pharmacol 392: , 1–18. |
[59] | Qu B , Gong Y , Gill JM , Kenney K , Diaz-Arrastia R ((2017) ) Heterozygous knockout of cytosolic phospholipase A2α attenuates Alzheimer’s disease pathology in APP/PS1 transgenic mice. Brain Res 1670: , 248–252. |
[60] | Yarla NS , Bishayee A , Vadlakonda L , Chintala R , Duddukuri GR , Reddanna P , Dowluru KSVGK ((2016) ) Phospholipase A2 isoforms as novel targets for prevention and treatment of inflammatory and oncologic diseases. Curr Drug Targets 17: , 1940–1962. |
[61] | Snyder EM , Nong Y , Almeida CG , Paul S , Moran T , Choi EY , Nairn AC , Salter MW , Lombroso PJ , Gouras GK , Greengard P ((2005) ) Regulation of NMDA receptor trafficking by amyloid-β . Nat Neurosci 8: , 1051–1058. |
[62] | Hardingham GE , Bading H ((2010) ) Synaptic versus extrasynaptic NMDA receptor signalling: Implications for neurodegenerative disorders. Nat Rev Neurosci 11: , 682–696. |
[63] | Wang Z-C , Zhao J , Li S ((2013) ) Dysregulation of synaptic and extrasynaptic N-methyl-D-aspartate receptors induced by amyloid-β . Neurosci Bull 29: , 752–760. |
[64] | Terwel D , Muyllaert D , Dewachter I , Borghgraef P , Croes S , Devijver H , Van Leuven F ((2008) ) Amyloid activates GSK-3beta to aggravate neuronal tauopathy in bigenic mice. Am J Pathol 172: , 786–798. |
[65] | Metaxas A , Thygesen C , Kempf SJ , Anzalone M , Vaitheeswaran R , Petersen S , Landau AM , Audrain H , Teeling JL , Darvesh S , Brooks DJ , Larsen MR , Finsen B ((2018) ) Tauopathy in the APPswe/PS1ΔE9 mouse model of familial Alzheimer’s disease. bioRxiv 405647. |
[66] | Kimura T , Ishiguro K , Hisanaga S-I ((2014) ) Physiological and pathological phosphorylation of tau by Cdk5. Front Mol Neurosci 7: , 65. |
[67] | Jankowsky JL , Fadale DJ , Anderson J , Xu GM , Gonzales V , Jenkins NA , Copeland NG , Lee MK , Younkin LH , Wagner SL , Younkin SG , Borchelt DR ((2004) ) Mutant presenilins specifically elevate the levels of the 42 residue beta-amyloid peptide in vivo: Evidence for augmentation of a 42-specific gamma secretase. Hum Mol Genet 13: , 159–170. |
[68] | Tan JZA , Gleeson PA ((2019) ) The role of membrane trafficking in the processing of amyloid precursor protein and production of amyloid peptides in Alzheimer’s disease. Biochim Biophys Acta Biomembr 1861: , 697–712. |
[69] | Das U , Scott DA , Ganguly A , Koo EH , Tang Y , Roy S ((2013) ) Activity-induced convergence of APP and BACE-1 in acidic microdomains via an endocytosis-dependent pathway. Neuron 79: , 447–460. |
[70] | Macklin L , Griffith CM , Cai Y , Rose GM , Yan XX , Patrylo PR ((2017) ) Glucose tolerance and insulin sensitivity are impaired in APP/PS1 transgenic mice prior to amyloid plaque pathogenesis and cognitive decline. Exp Gerontol 88: , 9–18. |
[71] | Jones PM , Burns CJ , Belin VD , Roderigo-Milne HM , Persaud SJ ((2004) ) The role of cytosolic phospholipase A(2) in insulin secretion. Diabetes 53: Suppl 1, S172–178. |
[72] | Strömberg K , Eketjäll S , Georgievska B , Tunblad K , Eliason K , Olsson F , Radesäter A-C , Klintenberg R , Arvidsson PI , von Berg S , Fälting J , Cowburn RF , Dabrowski M ((2015) ) Combining an amyloid-beta (Aβ) cleaving enzyme inhibitor with a γ-secretase modulator results in an additive reduction of Aβ production. FEBS J 282: , 65–73. |
[73] | Fenili D , Brown M , Rappaport R , McLaurin J ((2007) ) Properties of scyllo-inositol as a therapeutic treatment of AD-like pathology. J Mol Med Berl Ger 85: , 603–611. |
[74] | Gervais F , Paquette J , Morissette C , Krzywkowski P , Yu M , Azzi M , Lacombe D , Kong X , Aman A , Laurin J , Szarek WA , Tremblay P ((2007) ) Targeting soluble Abeta peptide with Tramiprosate for the treatment of brain amyloidosis. Neurobiol Aging 28: , 537–547. |
[75] | Sevigny J , Chiao P , Bussière T , Weinreb PH , Williams L , Maier M , Dunstan R , Salloway S , Chen T , Ling Y , O’Gorman J , Qian F , Arastu M , Li M , Chollate S , Brennan MS , Quintero-Monzon O , Scannevin RH , Arnold HM , Engber T , Rhodes K , Ferrero J , Hang Y , Mikulskis A , Grimm J , Hock C , Nitsch RM , Sandrock A ((2016) ) The antibody aducanumab reduces Aβ plaques in Alzheimer’s disease. Nature 537: , 50–56. |
[76] | Delrieu J , Ousset PJ , Caillaud C , Vellas B ((2012) ) “Clinical trials in Alzheimer’s disease”: Immunotherapy approaches. J Neurochem 120 Suppl 1: , 186–193. |
[77] | Ghantasala S , Pai MGJ , Biswas D , Gahoi N , Mukherjee S , Kp M , Nissa MU , Srivastava A , Epari S , Shetty P , Moiyadi A , Srivastava S ((2021) ) . Multiple reaction monitoring-based targeted assays for the validation of protein biomarkers in brain tumors. Front Oncol 11: , 548243. |
[78] | Fournier I , Mériaux C , Wisztorski M , Rakwal R , Salzet M ((2011) ) MALDI imaging mass spectrometry for investigating the brain. In Spectrometry, Ivanov AR, Lazarev AV, eds. Springer, Dordrecht, pp. 765–783. |


