
Dietary Diversity and Mild Cognitive Impairment in Middle-Aged and Older Chinese People: A Cross-Sectional Study
Abstract
Background:
The evidence concerning dietary diversity and cognitive function remains insufficient.
Objective:
To investigate the association of dietary diversity score (DDS) with mild cognitive impairment (MCI) and cognitive performance in different domains.
Methods:
Data from The Lifestyle and Healthy Aging of Chinese Square Dancer Study was used in this study. DDS was constructed based on the intake frequencies of 9 food groups assessed by a validated food frequency questionnaire. MCI was diagnosed by Petersen’s criteria. A neuropsychological test battery was used to assess the performance on cognitive domains, and test scores were standardized to Z scores. Multiple linear regression models and logistic regression models were used to estimate the β and odds ratios and their 95% CIs, respectively.
Results:
Among 1,982 participants, the mean (SD) age was 63.37 (5.00) years, 1,778 (89.71%) were women, and 279 (14.08%) had MCI. Compared to the DDS quartile (0, 6], the multivariable-adjusted odds ratios (95% CI) were 0.74 (0.48, 1.15) for DDS quartile (6, 7], 0.65 (0.43, 0.97) for DDS quartile (7, 8], and 0.55 (0.37, 0.84) for DDS quartile (8, 9]. Furthermore, higher DDS was positively associated with better performance of cognitive domains, including global cognitive function (β= 0.20, 95% CI: 0.12, 0.30), episodic memory (β= 0.21, 95% CI: 0.07, 0.35), attention (β= 0.15, 95% CI: 0.03, 0.26), language fluency (β= 0.24, 95% CI: 0.10, 0.38), and executive function (β= – 0.24, 95% CI: – 0.38, – 0.10).
Conclusions:
This study indicated that higher DDS was associated with better cognitive function among middle-aged and older Chinese people.
INTRODUCTION
Over the past half-century, population aging has become an unstoppable trend due to increasing life expectancy. Cognitive disorder, including mild cognitive impairment (MCI), Alzheimer’s disease, and other dementias [1], has grown to be one of the major clinical and public health concerns. MCI, considered to be a stage between dementia and typical age-related cognitive decline, has a high risk of progression to dementia [2]. In the absence of effective treatments for dementia, exploring the possible modifiable protection of MCI in middle-aged and older people will be beneficial to the social burden of MCI [3].
Previous studies have shown that a high-quality diet is one of the critical protective factors for cognitive function such as the Mediterranean Diet [4], Dietary Approach to Stop Hypertension (DASH) [5], and Mediterranean-DASH diet Intervention for Neurodegenerative Delay [6]. However, it is important to note that Western dietary patterns may not be directly applicable to Chinese populations due to cultural and regional differences in food preferences and availability. Dietary guidelines in many countries suggest that dietary diversity is one of the characteristics of a healthy diet [7, 8]. As a robust indicator of dietary diversity, the dietary diversity score (DDS) serves as an effective tool to assess the variety and range of food categories consumed within a predetermined time frame [9]. DDS is more accessible and simpler for middle-aged and older people since only have to consider the frequency of food intake [10, 11]. As the widely-used tool to evaluate diet quality, it has been validated among different populations and confirmed to be associated with several age-related diseases, such as diabetes [12, 13], anxiety [14], disability [15], and all-cause mortality [16, 17]. To our knowledge, there have been limited studies conducted thus far to investigate the relationship between DDS and MCI. In addition, the cognitive function encompasses various domains, including episodic memory, attention, language fluency, and executive function. The association between DDS and various cognitive domains remains unclear.
In this study, we used data from The Lifestyle and Healthy Aging of Chinese Square Dancer Study (Healthy Dance Study) to investigate the correlation between DDS and MCI among middle-aged and older individuals in China. Additionally, we aimed to identify specific food groups that could be targeted to promote better maintenance of cognitive function.
MATERIALS AND METHODS
Study participants
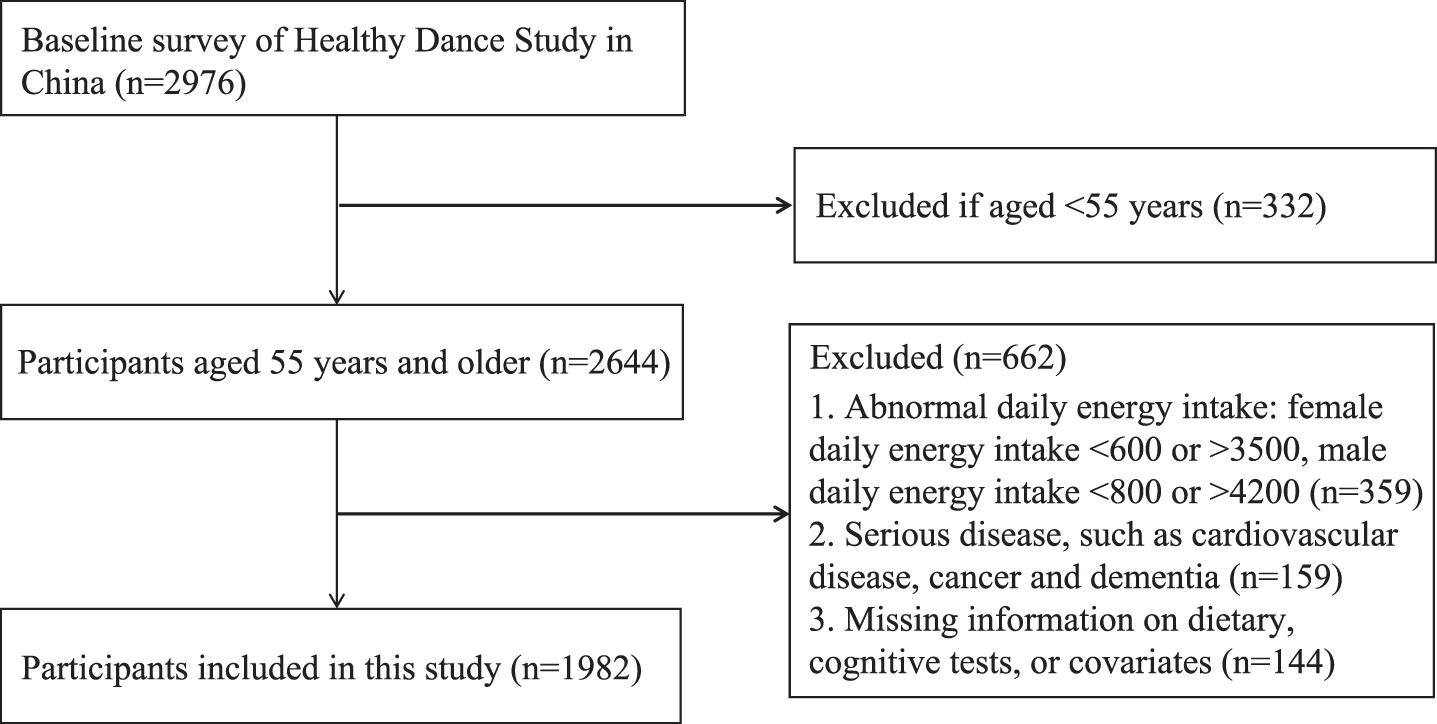
In this cross-sectional study, we analyzed the baseline data from the Healthy Dance Study. The study was conducted among middle-aged and older individuals residing in seven prefecture-level cities in China, including Wuhan, Yichang, Xiangyang, Shanghai, Xiamen, Beijing, and Chengdu. In this study, eligible participants aged 45 regularly took part in square dance without severe physical diseases and lived in the area for more than 6 months before the survey. The following exclusion criteria were applied: 1) Individuals with hearing or language disorders and those who were unable to communicate effectively; 2) Participants who had taken part in any clinical trials or intervention programs within the past 3 months or had plans to do so in the future. This study utilized data collected from the baseline survey conducted between August 2020 and December 2021. Figure 1 depicts the flow chart illustrating the exclusion of participants due to missing or implausible data, resulting in a final analysis sample size of 1982 participants. Ethical approval for the study was obtained from the Ethics Committee of Wuhan University of Science and Technology (202049, 201942), and informed consent was obtained from all participants involved in the study.
Assessment of DDS
At the baseline of the Healthy Dance Study, all participants completed a simplified food frequency questionnaire (FFQ) during face-to-face interviews. The FFQ consisted of 64 food items, which were classified into 15 distinct food categories. Participants were asked to report the frequencies of food group intake over the previous 12 months, considering pre-defined portion sizes. These food categories included rice and noodles, beans, vegetables, fruits, soy foods, meats (red meat [pork/beef]), poultry, fish, nuts, and beverages. Response options for frequency of consumption ranged from “none or almost none” to “three times a day or more."
Fig. 1
The flow chart of the inclusion and exclusion of study participants.
In our study, DDS was modified by Conklin et al. [9]. The DDS was assessed based on nine major food groups: vegetables, fruits, beans, nuts, mushrooms, meat, eggs, fish, and dairy products. Detailed information regarding food subgroups can be found in Supplementary Table 1. Given that cereals and oils are fundamental components of the Chinese daily diet, they were intentionally excluded from the assessment of DDS [18]. The calculation of DDS involved counting the number of food items consumed at least once a week from these nine major food groups. Participants received a score of 0 if they reported intakes as “none or almost none,” “once a month,” or “twice or three times a month” based on the reported frequency in the FFQ. A score of 1 was assigned to all other responses. It is important to note that each food group was counted only once, regardless of the number of food items consumed within that group [19]. The overall score of DDS can range from 0 to 9, with higher scores indicating greater dietary diversity.
Assessment of cognitive function
The Cognitive Status-modified version of the Uniformed Neuropsychological Test Battery (NTB) encompassed a set of standardized assessments, including the Auditory Verbal Learning Test (AVLT), Digit Symbol Substitution Test (DSST), Verbal Fluency Test (VFT), and Trail-Making Test-Part B (TMT-B). These tests were employed to evaluate cognitive function and determine an individual’s cognitive status.
The AVLT examined the ability of episodic memory [20]. 12 two-character words from three semantic groups make up the word list. Participants were instructed to recall the words above soon after hearing them, with a three-time repetition requirement. After around 5 min, the short-delayed recall is checked, and after 20 min, the long-delayed recall and category-cued recall are examined. Finally, the 12 distracter words (semantically related) and 12 target words are used in a recognition test [21]. Words accurately remembered in the learning, delayed recall, and recognition phases were added to determine the score.
The DSST is derived from a subtest of the Wechsler Adult Intelligence Scale and is designed to assess working memory, sustained attention, and processing speed [22]. In the DSST, participants are presented with a list of digits followed by nine digit-symbol pairs. Their task is to match as many symbols as possible to their corresponding digits within a 90-second time frame. The total number of accurate matches achieved by the participant serves as their DSST score, reflecting their performance on the test.
In the VFT [23], participants were given 60 s to verbally list as many animal names as they could. The number of correct responses provided within the given time frame was recorded as their final score. For this study, the word category was limited to animals, as it is a commonly used category that effectively distinguishes between individuals with and without mild Alzheimer’s disease.
As a component of the Trail-Making Test (TMT), the TMT-B was employed to assess executive function [24]. In this task, participants were presented with an arrangement of 25 circles, with 13 circles numbered from 1 to 13 and the remaining 12 letters from A to L. The objective was to connect the circles by drawing a line from one circle to the next, alternating between numbers and letters in ascending order (e.g., 1, A, 2, B, and so on). It was important to ensure that the lines did not intersect or cross each other. Any sequencing errors needed to be corrected immediately. The score for this test is determined by the total time taken (in seconds) to complete the task, from start to finish.
To account for the varying maximum scores across the multiple cognitive examinations, all assessment results were standardized using Z scores. The total cognitive function represented by the NTB was calculated using the following formula: Z-NTB = (Z-AVLT + Z-DSST + Z-VFT – Z-TMT-B) /4. MCI was determined based on Petersen’s diagnostic criteria [25]: 1) self-reported memory decline; 2) neuropsychological test results indicating a lower score of less than 1.5 standard deviations below normative means in four cognitive tests (AVLT, DSST, VFT, and TMT-B); 3) normal intact daily function; 4) Clinical Dementia Rating (CDR) score between 0 and 0.5.
Assessment of covariates
We chose the following variables in confounding adjustments: socioeconomic information, including age, sex, marital status (married or not), educational level (less than middle school, middle and high school, college or higher), and annual household income per capita (<20,000 CNY, 20,000– 40,000 CNY,>40,000 CNY); lifestyle behavioral characteristics including, smoking status (current smoker or no), drinking status (current drinker or no). Physical activity level was measured by the Physical Activity Scale for the Elderly [26]. Daily energy intake was calculated according to the FFQ and the China Food Composition. Clinical assessments included body mass index (BMI, kg/m2), hypertension, and diabetes. Hypertension was defined by self-reported and/or the objective measurement of systolic blood pressure (SBP)≥140 mmHg and/or diastolic blood pressure (DBP)≥90 mmHg. SBP and DBP were the means of blood pressure measured three times by an electronic manometer (U16 Version, Omron Company, China). Diabetes was defined as fasting blood glucose (FBG≥7.0 mmol/L and/or random blood glucose (RBG)≥11.1 mmol/L and/or documented glucose-lowering medication or self-reported diabetes.
Statistical analysis
For categorical variables, participants’ characteristics were shown as a number (%), and for continuous variables, as a mean (with standard deviation, SD). Categorical variables were compared using chi-square tests and one-way ANOVA for continuous variables. Multinomial logistic regression models were conducted to investigate the association between MCI and DDS, categorized as scores: (0, 6], (6, 7], (7, 8], and (8, 9]. Linear regression models were carried out to investigate associations between DDS and cognitive domains (AVLT, DSST, VFT, and TMT-B). Two models were constructed: Crude model was adjusted for age and sex; Fully-adjusted model was further adjusted for BMI, daily energy intake, education level, marital status, annual household income per capita, smoking status, drinking status, physical activities, hypertension, and diabetes. To ensure that the DDS is not influenced by any single food group, a sensitivity analysis was performed. This involved systematically excluding one food group and examining the association between the total score of the remaining food groups and MCI. We also conducted subgroup analyses that were stratified according to sex (male or female), age (55– 65 or≥65 years), BMI (<24 or≥24), hypertension (yes or no), and diabetes (yes or no). All statistical analyses were performed with SAS, version 9.2 (SAS Institute Inc., Cary, NC, US). Two-sided p < 0.05 was considered statistically significant.
RESULTS
Demographic characterization
Table 1 shows the characteristics of 1982 participants categorized according to DDS, among whom the mean age was (63.37±5.00) years, 89.71% were female, and 279 (14.08%) participants had a diagnosis of MCI. Participants with higher scores were more likely to be younger and have a lower prevalence of MCI. They also have higher scores in total cognitive function and its domains, including episodic memory, attention, language fluency, and executive function. Additionally, individuals with higher scores tended to have higher educational levels, higher annual household income per capita, lower BMI, non-smoking status, and retired status (all p < 0.05).
Association between DDS and MCI
As shown in Table 2, compared to the DDS quartile (0, 6], the multivariable-adjusted odds ratios (95% CI) were 0.74 (0.48, 1.15) for DDS quartile (6, 7], 0.65 (0.43, 0.97) for DDS quartile (7, 8], and 0.55 (0.37, 0.84) for DDS quartile (8, 9]. Furthermore, there was a significant inverse association between consuming the frequency of 3 food groups and the odds of MCI, including mushrooms (OR = 0.67, 95% CI: 0.49,0.93), nuts (OR = 0.72, 95% CI: 0.54,0.97), meat (OR = 0.44, 95% CI: 0.23,0.86) (Supplementary Table 2).
Association between DDS and global cognitive function and cognitive domains
As shown in Table 3, there was a positive association observed between higher DDS and improved performance across various cognitive domains. Including global cognitive function (β= 0.20, 95% CI: 0.12, 0.30), episodic memory (β= 0.21, 95% CI: 0.07, 0.35), attention (β= 0.15, 95% CI: 0.03, 0.26), language fluency (β= 0.24, 95% CI: 0.10, 0.38), and executive function (β= – 0.24, 95% CI: – 0.38, – 0.10).
Subgroup and sensitivity analyses
In the subgroup analyses, we found no statistical interaction between DDS and age, sex, hypertension, and diabetes among participants with the odds of MCI (Supplementary Table 3). Additionally, higher DDS was associated with better cognitive function on Z score in individuals aged 65 and above, although the associations between DDS and MCI did not reach statistically significant levels (Supplementary Tables 4 and 5). After excluding any one of the food groups, the results were robust (Supplementary Table 2).
Table 1
Characteristics of study participants by DDS categoriesa
| Characteristics | Total | DDS categories | p | |||
| (0,6] | (6,7] | (7,8] | (8,9] | |||
| No of subjects, n (%) | 1,982 | 251 (12.66) | 325 (16.40) | 617 (31.13) | 789 (39.81) | |
| MCI, n (%) | 279 (14.08) | 53 (21.12) | 53 (16.31) | 84 (13.61) | 89 (11.28) | <0.001 |
| Global cognitive function, score | – 0.05 (0.68) | – 0.26 (0.72) | – 0.15 (0.69) | – 0.04 (0.67) | 0.05 (0.66) | <0.001 |
| Episodic memory, score | – 0.02 (0.98) | – 0.22 (1.04) | – 0.09 (0.98) | – 0.07 (0.97) | 0.10 (0.96) | <0.001 |
| Attention, score | – 0.09 (0.92) | – 0.30 (0.93) | – 0.21 (0.9) | – 0.09 (0.91) | 0.03 (0.91) | <0.001 |
| Language fluency, score | – 0.04 (0.96) | – 0.27 (0.91) | – 0.15 (0.95) | – 0.03 (0.97) | 0.04 (0.97) | <0.001 |
| Executive function, score | – 0.04 (1.01) | 0.27 (1.20) | 0.14 (1.12) | – 0.01 (0.97) | – 0.05 (0.92) | <0.001 |
| Daily energy intake, mean (SD) | 2,151.78 (649.99) | 1,893.58 (653.25) | 1,976.66 (634.38) | 2,133.99 (634.6) | 2,319.9 7 (619.68) | <0.001 |
| Age (y), mean (SD) | 63.37 (5.00) | 63.15 (5.08) | 63.33 (5.23) | 63.5 (4.98) | 63.35 (4.89) | 0.8175 |
| Female | 1,778 (89.71) | 211 (84.06) | 289 (88.92) | 542 (87.84) | 736 (93.28) | <0.001 |
| Marital status, n (%) | ||||||
| Married | 1,724 (86.98) | 207 (82.47) | 274 (84.31) | 539 (87.36) | 704 (89.23) | 0.017 |
| Single/widowed/divorced | 258 (13.02) | 44 (17.53) | 51 (15.69) | 78 (12.64) | 85 (10.77) | |
| Education level, n (%) | ||||||
| Less than middle school | 191 (9.64) | 38 (15.14) | 49 (15.08) | 51 (8.27) | 53 (6.72) | <0.001 |
| Middle and high school | 1,568 (79.11) | 198 (78.88) | 258 (79.38) | 498 (80.71) | 614 (77.82) | |
| College or higher | 22 3(11.25) | 15 (5.98) | 18 (5.54) | 68 (11.02) | 122 (15.46) | |
| Annual household income per capita, n (%) | ||||||
| <20,000 CNY | 43 9(22.15) | 73 (29.08) | 73 (22.46) | 143 (23.18) | 150 (19.01) | <0.001 |
| 20,000– 40,000 CNY | 853 (43.04) | 118 (47.01) | 147 (45.23) | 258 (41.82) | 330 (41.83) | |
| >40,000 CNY | 690 (34.81) | 60 (23.9) | 105 (32.31) | 216 (35.01) | 309 (39.16) | |
| BMI, kg/m2, n (%) | ||||||
| ≤24 | 1,018 (51.36) | 112 (44.62) | 152 (46.77) | 329 (53.32) | 425 (53.87) | 0.017 |
| >24 | 964 (48.64) | 139 (55.38) | 173 (53.23) | 288 (46.68) | 364 (46.13) | <0.001 |
| Smoking (current), n (%) | 117 (5.90) | 31 (12.35) | 21 (6.46) | 35 (5.67) | 30 (3.8) | |
| Drinking (current), n (%) | 285 (14.38) | 39 (15.54) | 37 (11.38) | 91 (14.75) | 118 (14.96) | 0.623 |
| Retired, n (%) | 1,703 (85.92) | 202 (80.48) | 269 (82.77) | 541 (87.68) | 691 (87.58) | 0.007 |
| Meeting physical activity recommendation, n (%) | 1,660 (83.75) | 210 (83.67) | 271 (83.38) | 510 (82.66) | 669 (84.79) | 0.753 |
| Hypertension, n (%) | 1,033 (52.12) | 130 (51.79) | 181 (55.69) | 324 (52.51) | 398 (50.44) | 0.458 |
| Diabetes, n (%) | 180 (9.08) | 24 (9.56) | 34 (10.46) | 55 (8.91) | 67 (8.49) | 0.760 |
aContinuous variables were expressed as weighted means and standard errors and categorical variables were expressed as numbers and weighted percentages. DDS, dietary diversity score; SD, standard deviation; MCI, mild cognitive impairment; BMI, body mass index.
Table 2
Logistic regression analysis of DDS and MCIa
| DDS categories | p for trend | ||||
| (0,6] | (6,7] | (7,8] | (8,9] | ||
| Case (n) | 53 (251) | 53 (325) | 84 (617) | 89 (789) | |
| Crude Modelb | 1 (reference) | 0.72 (0.47,1.10) | 0.55 (0.38,0.81) | 0.46 (0.31,0.67) | <0.001 |
| Fully-adjusted Modelc | 1 (reference) | 0.74 (0.48,1.15) | 0.65 (0.43,0.97) | 0.55 (0.37,0.84) | 0.005 |
aData are multivariate OR (95% confidence interval); DDS, dietary diversity score; MCI, mild cognitive impairment. bCrude Model: adjusted for age, and sex. cFully-adjusted Model: adjusted for Crude Model + BMI, daily energy intake, education level, marital status, annual household income per capita, smoking status, drinking status, physical activities, hypertension, and diabetes.
Table 3
Multiple linear regression analysis of DDS categories and cognitive domains scorea
| Cognitive domains | DDS categories | p for trend | |||
| (0,6] | (6,7] | (7,8] | (8,9] | ||
| Global cognitive function Z-scores | <0.001 | ||||
| Crude Modelb | 0 (reference) | 0.12 (0.02,0.23) | 0.23 (0.14,0.33) | 0.32 (0.23,0.41) | |
| Fully-adjusted Modelc | 0 (reference) | 0.11 (0.01,0.21) | 0.15 (0.06,0.24) | 0.20 (0.12,0.30) | |
| Episodic memory Z-scores | 0.004 | ||||
| Crude Modelb | 0 (reference) | 0.13 (– 0.03,0.29) | 0.16 (0.02,0.30) | 0.32 (0.18,0.45) | |
| Fully-adjusted Modelc | 0 (reference) | 0.12 (– 0.04,0.27) | 0.09 (– 0.05,0.22) | 0.21 (0.07,0.35) | |
| Attention Z-scores | 0.011 | ||||
| Crude Modelb | 0 (reference) | 0.09 (– 0.06,0.23) | 0.22 (0.10,0.35) | 0.32 (0.19,0.44) | |
| Fully-adjusted Modelc | 0 (reference) | 0.07 (– 0.06,0.20) | 0.10 (– 0.02,0.22) | 0.15 (0.03,0.26) | |
| Language fluency Z-scores | <0.001 | ||||
| Crude Modelb | 0 (reference) | 0.13 (– 0.03,0.29) | 0.25 (0.10,0.39) | 0.32 (0.19,0.46) | |
| Fully-adjusted Modelc | 0 (reference) | 0.12 (– 0.04,0.28) | 0.18 (0.04,0.32) | 0.24 (0.10,0.38) | |
| Executive function Z-scores | <0.001 | ||||
| Crude Modelb | 0 (reference) | – 0.14 (– 0.30,0.02) | – 0.29 (– 0.44,– 0.15) | – 0.33 (– 0.47,– 0.19) | |
| Fully-adjusted Modelc | 0 (reference) | – 0.13 (– 0.29,0.03) | – 0.22 (– 0.37,– 0.08) | – 0.24 (– 0.38,– 0.10) | |
aData are multivariate β (95% confidence interval); DDS, dietary diversity score. bCrude Model: adjusted for age, and sex. cFully-adjusted Model: adjusted for Crude Model + BMI, daily energy intake, education level, marital status, annual household income per capita, smoking status, drinking status, physical activities, hypertension, and diabetes.
DISCUSSION
In this cross-sectional study conducted among middle-aged and older individuals in China, the present research aimed to investigate the associations between DDS and the odds of MCI. The findings revealed an inverse relationship between higher DDS and lower odds of MCI. Additionally, higher DDS was associated with better performance across various cognitive domains, including AVLT, VFT, DDST, and TMT-B.
Our findings are consistent with the previous study. A longitudinal study involving 9,726 older adults demonstrated that higher DDS was associated with a reduced risk of cognitive impairment [27]. Similarly, a nationwide cohort study of 6,237 oldest-old individuals revealed that maintaining a high DDS was beneficial for cognitive function, even in advanced age [28]. Furthermore, In addition, our study examined various cognitive domains, including episodic memory, attention, language fluency, and executive function. It is worth noting that only a limited number of studies have investigated the relationship between DDS and multiple cognitive domains. One cohort study specifically focused on the impact of DDS on cognitive domains among the oldest-old Chinese population, as assessed by the Mini-Mental State Examination [28]. In contrast, our current study expanded upon this research by utilizing a comprehensive neuropsychological test battery, which included assessments such as AVLT, DDST, VFT, and TMT-B. In summary, our study contributes to the existing epidemiological data by demonstrating that higher DDS is associated with better performance in cognitive domains and lower odds of MCI. This expands our understanding of the relationship between DDS and cognitive function.
Our study revealed a significant association between higher-frequency consumption of mushrooms, nuts, and meat with better cognitive function. These findings are consistent with previous research highlighting the potential neuroprotective properties of mushrooms [29]. Cohort studies have also demonstrated a lower risk of incident dementia among individuals who frequently consume mushrooms [30]. Nuts, a key component of the Mediterranean diet, contain polyunsaturated fatty acids, high-quality protein, tocopherols, and antioxidant phenolic compounds. Increased nut consumption has been shown to benefit vascular function and is consistently associated with a reduced risk of cardiovascular disease. Moreover, it may have positive effects on overall brain health and cognition [31]. A cohort study conducted in Singapore found that higher nut intake during middle age was associated with a lower risk of cognitive impairment in later life [32]. Inadequate protein intake is prevalent among the elderly in China [33], and meat serves as a rich source of high-quality protein. Consuming meat may potentially reduce the incidence of MCI in middle-aged and older individuals. Similar findings regarding the association between meat consumption and cognitive function were observed in the aforementioned longitudinal investigation [27].
The biological mechanisms underlying the inverse associations between DDS and the risk of MCI are not fully understood. However, several plausible mechanisms have been proposed. One potential mechanism is the influence of dietary diversity on the composition of the gut microbiota. Studies have shown that higher DDS is associated with a more diverse intestinal microbiota [34]. The gut microbiota has been implicated in various aspects of brain function through the Brain-Gut-Microbiome Axis, suggesting that dietary diversity may impact brain health through this pathway [35]. Another possible explanation is that low dietary diversity may be associated with increased oxidative stress. Middle-aged and older individuals may experience a decline in their capacity to sustain normal brain function due to lower antioxidant defenses [36]. Furthermore, higher DDS is often associated with a greater intake of macro- and micronutrients, such as protein and vitamin C [37], which are known to have protective effects on health. Adequate intake of these nutrients may contribute to better brain function and reduce the risk of MCI.
This research has several strengths that should be acknowledged. Firstly, it is the first study to investigate the relationship between DDS and MCI, providing novel insights into this area of research. Additionally, a comprehensive battery of cognitive tests was employed, allowing for the evaluation of cognitive function across multiple domains, and providing a more comprehensive assessment. However, there are also limitations in this study that should be taken into consideration. Firstly, the cross-sectional design of the study limits our ability to establish a causal relationship between DDS and MCI. Longitudinal studies would be valuable in determining the temporal nature of this association. Secondly, the use of FFQ to collect dietary data may introduce recall bias or measurement error. Moreover, the presence of cognitive decline or impairment could potentially influence the accuracy of self-reported dietary information, which may affect the relationship between DDS and MCI. Lastly, despite efforts to control for potential confounders, residual confounding from unmeasured factors cannot be completely ruled out.
In conclusion, our study findings support the notion that higher DDS is associated with better cognitive function in middle-aged and older Chinese people. Eating a more varied diet might have favorable effects to prevent the development of MCI.
ACKNOWLEDGMENTS
We would like to thank all middle-aged and older people for participating in the study.
FUNDING
This work was supported by the Square Dance Cohort Fund of CNS Academy of Nutrition and Health (Beijing Zhongyinghui Nutrition and Health Research Institute). The funder of the study had no role in the study design, data interpretation, writing of the report, or decision of publication.
CONFLICT OF INTEREST
The authors have no conflicts of interest to declare.
DATA AVAILABILITY
The data supporting the findings of this study are available on request from the corresponding author.
SUPPLEMENTARY MATERIAL
[1] The supplementary material is available in the electronic version of this article: https://dx.doi.org/10.3233/ADR-230060.
REFERENCES
[1] | Chan KY , Wang W , Wu JJ , Liu L , Theodoratou E , Car J , Middleton L , Russ TC , Deary IJ , Campbell H , Wang W , Rudan I ((2013) ) Epidemiology of Alzheimer’s disease and other forms of dementia in China, 1990-2010: A systematic review and analysis. Lancet 381: , 2016–2023. |
[2] | Petersen RC , Caracciolo B , Brayne C , Gauthier S , Jelic V , Fratiglioni L ((2014) ) Mild cognitive impairment: A concept in evolution. J Intern Med 275: , 214–228. |
[3] | Shah H , Albanese E , Duggan C , Rudan I , Langa KM , Carrillo MC , Chan KY , Joanette Y , Prince M , Rossor M , Saxena S , Snyder HM , Sperling R , Varghese M , Wang H , Wortmann M , Dua T ((2016) ) Research priorities to reduce the global burden of dementia by 2025. Lancet Neurol 15: , 1285–1294. |
[4] | Moustafa B , Trifan G , Isasi CR , Lipton RB , Sotres-Alvarez D , Cai J , Tarraf W , Stickel A , Mattei J , Talavera GA , Daviglus ML , Gonzalez HM , Testai FD ((2022) ) Association of Mediterranean diet with cognitive decline among diverse Hispanic or Latino adults from the Hispanic Community Health Study/Study of Latinos. JAMA Netw Open 5: , e2221982. |
[5] | Tangney CC , Li H , Wang Y , Barnes L , Schneider JA , Bennett DA , Morris MC ((2014) ) Relation of DASH- and Mediterranean-like dietary patterns to cognitive decline in older persons. Neurology 83: , 1410–1416. |
[6] | Hosking DE , Eramudugolla R , Cherbuin N , Anstey KJ ((2019) ) MIND not Mediterranean diet related to 12-year incidence of cognitive impairment in an Australian longitudinal cohort study. Alzheimers Dement 15: , 581–589. |
[7] | DeSalvo KB , Olson R , Casavale KO ((2016) ) Dietary guidelines for Americans. JAMA 315: , 457–458. |
[8] | World Health Organization ((1998) ) Preparation and use of food-based dietary guidelines. https://www.who.int/publications/i/item/9241208805. |
[9] | Conklin AI , Monsivais P , Khaw KT , Wareham NJ , Forouhi NG ((2016) ) Dietary diversity, diet cost, and incidence of type 2 diabetes in the United Kingdom: A prospective cohort study. PLoS Med 13: , e1002085. |
[10] | Milte CM , McNaughton SA ((2016) ) Dietary patterns and successful ageing: A systematic review. Eur J Nutr 55: , 423–450. |
[11] | Ruel MT ((2003) ) Operationalizing dietary diversity: A review of measurement issues and research priorities. J Nutr 133: , 3911s–3926s. |
[12] | Danquah I , Galbete C , Meeks K , Nicolaou M , Klipstein-Grobusch K , Addo J , Aikins AD , Amoah SK , Agyei-Baffour P , Boateng D , Bedu-Addo G , Spranger J , Smeeth L , Owusu-Dabo E , Agyemang C , Mockenhaupt FP , Beune E , Schulze MB ((2018) ) Food variety, dietary diversity, and type 2 diabetes in a multi-center cross-sectional study among Ghanaian migrants in Europe and their compatriots in Ghana: The RODAM study. Eur J Nutr 57: , 2723–2733. |
[13] | Liu M , Liu C , Zhang Z , Zhou C , Li Q , He P , Zhang Y , Li H , Qin X ((2021) ) Quantity and variety of food groups consumption and the risk of diabetes in adults: A prospective cohort study. Clin Nutr 40: , 5710–5717. |
[14] | Poorrezaeian M , Siassi F , Qorbani M , Karimi J , Koohdani F , Asayesh H , Sotoudeh G ((2015) ) Association of dietary diversity score with anxiety in women. Psychiatry Res 230: , 622–627. |
[15] | Zhang J , Zhao A , Wu W , Ren Z , Yang C , Wang P , Zhang Y ((2020) ) Beneficial effect of dietary diversity on the risk of disability in activities of daily living in adults: A prospective cohort study. Nutrients 12: , 3263. |
[16] | Liu D , Zhang XR , Li ZH , Zhang YJ , Lv YB , Wang ZH , Shen D , Chen PL , Zhong WF , Huang QM , Wang JH , Zhang WT , Shi XM , Mao C ((2021) ) Association of dietary diversity changes and mortality among older people: A prospective cohort study. Clin Nutr 40: , 2620–2629. |
[17] | Otsuka R , Tange C , Nishita Y , Kato Y , Tomida M , Imai T , Ando F , Shimokata H ((2020) ) Dietary diversity and all-cause and cause-specific mortality in Japanese community-dwelling older adults. Nutrients 12: , 1052. |
[18] | Yin Z , Fei Z , Qiu C , Brasher MS , Kraus VB , Zhao W , Shi X , Zeng Y ((2017) ) Dietary diversity and cognitive function among elderly people: A population-based study. J Nutr Health Aging 21: , 1089–1094. |
[19] | Clausen T , Charlton KE , Gobotswang KS , Holmboe-Ottesen G ((2005) ) Predictors of food variety and dietary diversity among older persons in Botswana. Nutrition 21: , 86–95. |
[20] | Zhao Q , Lv Y , Zhou Y , Hong Z , Guo Q ((2012) ) Short-term delayed recall of auditory verbal learning test is equivalent to long-term delayed recall for identifying amnestic mild cognitive impairment. PLoS One 7: , e51157. |
[21] | Zhao QH , Lv YR , Zhou Y , Hong Z , Guo QH ((2012) ) Short-term delayed recall of auditory verbal learning test is equivalent to long-term delayed recall for identifying amnestic mild cognitive impairment. PLoS One 7: , e51157. |
[22] | Jaeger J ((2018) ) Digit symbol substitution test: The case for sensitivity over specificity in neuropsychological testing. J Clin Psychopharmacol 38: , 513–519. |
[23] | Law LL , Barnett F , Yau MK , Gray MA ((2013) ) Development and initial testing of functional task exercise on older adults with cognitive impairment at risk of Alzheimer’s disease–FcTSim programme–a feasibility study. Occup Ther Int 20: , 185–197. |
[24] | Lu L , Bigler ED ((2000) ) Performance on original and a Chinese version of Trail Making Test Part B: A normative bilingual sample. Appl Neuropsychol 7: , 243–246. |
[25] | Petersen RC ((2004) ) Mild cognitive impairment as a diagnostic entity. J Intern Med 256: , 183–194. |
[26] | Washburn RA , Smith KW , Jette AM , Janney CA ((1993) ) The Physical Activity Scale for the Elderly (PASE): Development and evaluation. J Clin Epidemiol 46: , 153–162. |
[27] | Zheng J , Zhou R , Li F , Chen L , Wu K , Huang J , Liu H , Huang Z , Xu L , Yuan Z , Mao C , Wu X ((2021) ) Association between dietary diversity and cognitive impairment among the oldest-old: Findings from a nationwide cohort study. Clin Nutr 40: , 1452–1462. |
[28] | Song Y , Zeng L , Gao J , Chen L , Sun C , Yan M , Li M , Jiang H ((2022) ) Adherence to high dietary diversity and incident cognitive impairment for the oldest-old: A community-based, nationwide cohort study. Nutrients 14: , 4530. |
[29] | Feng L , Cheah IK-M , Ng MM-X , Li J , Chan SM , Lim SL , Mahendran R , Kua E-H , Halliwell B , Yu J-T ((2019) ) The association between mushroom consumption and mild cognitive impairment: A community-based cross-sectional study in Singapore. J Alzheimers Dis 68: , 197–203. |
[30] | Zhang S , Tomata Y , Sugiyama K , Sugawara Y , Tsuji I ((2017) ) Mushroom consumption and incident dementia in elderly Japanese: The Ohsaki Cohort 2006 Study. J Am Geriatr Soc 65: , 1462–1469. |
[31] | Theodore LE , Kellow NJ , McNeil EA , Close EO , Coad EG , Cardoso BR ((2021) ) Nut consumption for cognitive performance: A systematic review. Adv Nutr 12: , 777–792. |
[32] | Jiang YW , Sheng LT , Feng L , Pan A , Koh WP ((2021) ) Consumption of dietary nuts in midlife and risk of cognitive impairment in late-life: The Singapore Chinese Health Study. Age Ageing 50: , 1215–1221. |
[33] | Xu X , Byles JE , Shi Z , Hall JJ ((2015) ) Evaluation of older Chinese people’s macronutrient intake status: Results from the China Health and Nutrition Survey. Br J Nutr 113: , 159–171. |
[34] | Claesson MJ , Jeffery IB , Conde S , Power SE , O’Connor EM , Cusack S , Harris HM , Coakley M , Lakshminarayanan B , O’Sullivan O , Fitzgerald GF , Deane J , O’Connor M , Harnedy N , O’Connor K , O’Mahony D , van Sinderen D , Wallace M , Brennan L , Stanton C , Marchesi JR , Fitzgerald AP , Shanahan F , Hill C , Ross RP , O’Toole PW ((2012) ) Gut microbiota composition correlates with diet and health in the elderly. Nature 488: , 178–184. |
[35] | Sun M , Ma K , Wen J , Wang G , Zhang C , Li Q , Bao X , Wang H ((2020) ) A review of the brain-gut-microbiome axis and the potential role of microbiota in Alzheimer’s disease. J Alzheimers Dis 73: , 849–865. |
[36] | Narmaki E , Siassi F , Fariba K , Qorbani M , Shiraseb F , Ataie-Jafari A , Sotoudeh G ((2015) ) Dietary diversity as a proxy measure of blood antioxidant status in women. Nutrition 31: , 722–726. |
[37] | Zhang J , Zhao A , Wu W , Yang C , Ren Z , Wang M , Wang P , Zhang Y ((2020) ) Dietary diversity is associated with memory status in Chinese adults: A prospective study. Front Aging Neurosci 12: , 580760. |


