
Comparing Symmetric Dimethylarginine and Amyloid-β42 as Predictors of Alzheimer’s Disease Development
Abstract
Background:
Physicians may soon be able to diagnose Alzheimer’s disease (AD) in its early stages using fluid biomarkers like amyloid. However, it is acknowledged that additional biomarkers need to be characterized which would facilitate earlier monitoring of AD pathogenesis.
Objective:
To determine if a potential novel inflammation biomarker for AD, symmetric dimethylarginine, has utility as a baseline serum biomarker for discriminating prodromal AD from cognitively unimpaired controls in comparison to cerebrospinal fluid amyloid-β42 (Aβ42).
Methods:
Data including demographics, magnetic resonance imaging and fluorodeoxyglucose-positron emission tomography scans, Mini-Mental State Examination and Functional Activities Questionnaire scores, and biomarker concentrations were obtained from the Alzheimer’s Disease Neuroimaging Initiative for a total of 146 prodromal AD participants and 108 cognitively unimpaired controls.
Results:
Aβ42 (p = 0.65) and symmetric dimethylarginine (p = 0.45) were unable to predict age-matched cognitively unimpaired controls and prodromal AD participants. Aβ42 was negatively associated with regional brain atrophy and hypometabolism as well as cognitive and functional decline in cognitively unimpaired control participants (p < 0.05) that generally decreased in time. There were no significant associations between Aβ42 and symmetric dimethylarginine with imaging or neurocognitive biomarkers in prodromal AD patients.
Conclusions:
Correlations were smaller between Aβ42 and neuropathological biomarkers over time and were absent in prodromal AD participants, suggesting a plateau effect dependent on age and disease stage. Evidence supporting symmetric dimethylarginine as a novel biomarker for AD as a single measurement was not found.
INTRODUCTION
Alzheimer’s disease (AD) dementia is an incurable neurodegenerative disease of the brain most often characterized by relentless memory loss, cognitive decline, and hypometabolism and neurodegeneration. A current challenge faced by health care providers is the early diagnosis of AD, particularly when individuals are in the mild cognitive impairment (MCI) stage or even earlier during the asymptomatic phase of the disease [1]. To that end, substantial efforts are centered on developing and identifying fluid biomarkers that are indicative of future cognitive decline. Given its importance in AD dementia and in particular, in the context of anti-amyloid therapies, several studies have centered on determining the utility of fluid biomarkers of amyloid, including biomarkers for amyloid-β42 (Aβ42), with the closely related Aβ40 first being sequenced in AD dementia and Down’s syndrome participants approximately twenty years ago and was later discovered to be the primary component in AD plaques [2].
In recent years, cerebrospinal fluid (CSF) Aβ42 or Aβ42/40 have emerged as promising biomarkers for detection of AD dementia pathology for enrichment of clinical trials and potentially for clinical practice given that Aβ42 is a surrogate marker for Aβ aggregation into senile plaques and that these CSF biomarkers have a relatively close association with amyloid pathology as measured with amyloid positron emission tomography (PET) [3, 4]. While some studies suggest that the Aβ42/40 index does not improve diagnostic accuracy compared to Aβ42 alone [5, 6], the ratio accounts for both production of amyloid as well as deposition, and the ratio is more closely associated with amyloid PET assessments [7]. Identifying the best biomarkers for clinical trial selection is critical, as improved treatments for AD dementia are expected in the coming years. The recently approved drug Aducanumab was found to reduce amyloid plaques in two international phase III randomized controlled trials known as ENGAGE and EMERGE, although ENGAGE found no cognitive improvement and the clinical improvement found in EMERGE was only modest at best [8]. While the United State Food and Drug Administration’s (FDA) Peripheral and Central Nervous System Drugs Advisory Committee voted there was insufficient evidence of efficacy, the FDA accelerated its approval even as roughly 35% of participants suffered amyloid-related imaging abnormalities which include edema and brain hemorrhages [8]. More promise has been observed with recent monoclonal antibody treatments. Lecanemab, for example, has been shown to reduce markers of amyloid in early AD with patients having less cognitive and functional decline, though this treatment also suffered a high prevalence of adverse effects [9]. The FDA has at this time fully approved Lecanemab for the mild dementia stage of AD [10].
In addition to amyloid pathology, developments continue for additional biomarkers that relate to other aspects of AD pathophysiology and that could be used to improve early detection of AD dementia, as well as serve as outcomes in future clinical trials. Innate immune activation from genome-wide association studies have found associations between immune receptor genes and AD pathogenesis [11, 12]. Aging is also associated with decline in adaptive immunity and anti-inflammatory marker production, hence a potential reason why older age is a risk factor for AD [13]. Bacterial and viral infections, especially among periodontal infections and H. pylori, have been associated with AD due to the release of neuroinflammatory interleukins and inflammasomes [14], with Aβ42 even having antimicrobial properties against periodontal bacteria [15]. Glial activation and associated neuroinflammation has long been recognized to play a role in AD. The activation of microglia and other immune cells has been implicated in the exacerbation of both amyloid and tau pathologies, while at the same time, a more systematic proinflammatory mechanism has been proposed as the common thread across risk factors of AD like diabetes mellitus, cardiovascular disease and atherosclerosis, among others [16]. In chronic kidney disease for example, worsening stages of the disease were associated with higher AD and vascular dementia risk [17]. Reasons proposed for an association between chronic kidney disease and AD include the kidneys being unable to excrete uremic toxins, which are inflammatory, as well as the kidney’s involvement with blood pressure, erythropoietin and vitamin D production, two factors that are both neuroprotective and anti-inflammatory [18].
Given these observations, it is important to test novel biomarkers that act as predictors of non-amyloid processes linked to the natural history of AD; this would include, among others, neuroinflammation and neurodegeneration. One of such potentially useful biomarkers is symmetric dimethylarginine (SDMA), an enantiomer of asymmetric dimethylarginine (ADMA) which has been heavily studied in AD in addition to chronic kidney disease and cardiovascular disease. SDMA is a biomarker for and a proinflammatory agent in chronic kidney disease but has also been correlated with neuropathological progression and cognitive decline in prodromal AD dementia participants [19–21]. It is significantly altered in participants with early and progressive stages of AD dementia when compared to controls [21, 22], and was also correlated with neurofilament light chain, a marker for neurodegeneration, in both Aβ– and Aβ+ groups [23]. SDMA was also increased in AD frontal cortex tissue samples [24]. As McEvoy et al. stated, SDMA may be associated with memory impairment through inflammation and an inflammatory state [25]. SDMA has also been linked to the proinflammatory state that takes place after an acute stroke [26]. It is our intention therefore to compare this novel blood constituent and its relationship to prodromal AD dementia against CSF Aβ42. Aβ42 is one of the core biochemical markers for the amyloidogenic process in AD as supported by the 2018 National Institute of Aging and Alzheimer’s Association Research Framework [27]. Additionally, notwithstanding the probable limitations of CSF Aβ42 as a lone measure in preclinical stages of AD dementia and MCI, we found it a suitable initial candidate to compare SDMA to, as it would allow us to revisit any lingering questions around the use of Aβ42 use in the earliest stages of the disease. We hypothesized that SDMA would be more effective than Aβ42 at discriminating between cognitively unimpaired controls and prodromal AD dementia and that either biomarker would be associated with brain hypometabolism and atrophy as well as cognition and function.
MATERIALS AND METHODS
Data source
Data for this study was obtained from the Alzheimer’s Disease Neuroimaging Initiative (ADNI). ADNI is an ongoing, longitudinal study launched in 2003 as a public–private partnership, led by principal investigator Michael W. Weiner, MD. The primary goal of ADNI has been to test the extent to which serial magnetic resonance imaging (MRI), PET, other biological markers, and clinical and neuropsychological assessments provide utility for measuring the progression of MCI and early AD dementia, and to validate brain imaging, blood tests, and other diagnostics, as well as share data with the scientific community. For up-to-date information, see https://adni.loni.usc.edu/. Details on study design, participant recruitment, study approval, and informed consent procedures have been published previously [28]. The study was approved by the institutional review boards of all of the participating institutions/study sites. Informed written consent was obtained from all participants at each site. Metabolomics data for ADNI samples were generated by the Alzheimer Disease Metabolomics Consortium (ADMC) and deposited to the Laboratory of Neuroimaging (LONI). The mission of the ADMC is to create a comprehensive metabolomics database for AD. ADNI data used in the preparation of this article were also obtained from the ADNI-1 database (https://adni.loni.usc.edu) and included baseline blood serum metabolite concentrations (with concurrent structural MRI data) on 767 participants and concurrent CSF AD biomarker data on 403 participants. All ADNI studies are conducted according to the Good Clinical Practice guidelines, the Declaration of Helsinki, and U.S. 21 CFR Part 50 (Protection of Human Subjects), and Part 56 (Institutional Review Boards). Written informed consent was obtained from all participants before protocol-specific procedures were performed. ADNI was enriched with participants with MCI, who represent “prodromal AD”. In this study, participants with MCI at baseline who subsequently converted back to normal cognition were excluded.
Participant cohort and assessments
The primary objective of this retrospective study is to determine if early baseline serum SDMA and CSF Aβ42 levels could be used as reliable predictors for future AD dementia development. The reason for not conducting serum to serum comparisons is that the sample size of participants in ADNI that have both serum constituents is low and would have drastically reduced the power of our analysis. Additionally, CSF Aβ42 remains highlighted as one of the most signature diagnostic markers according to the National Institute of Aging - Alzheimer’s Association [27]. To obtain this data, research staff collected baseline subject level demographic information including age, sex, apolipoprotein E (APOE) genotype, and participant education level. Baseline biomarker levels of SDMA were analyzed using a Biocrates AbsoluteIDQ p180 kit and Aβ42 was measured using the 2D-UPLC tandem mass spectrometry method described in the literature [29]. Baseline cognitive assessments including Functional Activities Questionnaire (FAQ) scores and Mini-Mental State Exam (MMSE) scores were taken by each participant at baseline and again at 24 months. Post-hoc analysis included scores at 48 and 72 months. FAQ is a measure of instrumental activities of daily living and has a score range from 0 to 30, with 0 being no impairment and 30 being severely impaired [30]. MMSE is a 30-point questionnaire used in research and clinical practice to measure cognitive impairment, with lower results indicating more pronounced cognitive impairment [31]. Image modalities included were MRI and fluorodeoxyglucose (FDG)-PET taken at baseline and 24 months with the aim of exploring potential associations between these measures and SDMA and Aβ42 levels. Post-hoc analysis included imaging at 48 and 72 months. MRI region of interests (ROI) included the left and right mesio-temporal lobes and left and right hippocampus as these sites demonstrate the earliest structural changes in AD [32, 33]. FDG ROIs included the bilateral posterior cingulum and left and right temporal lobes based on reports that these areas demonstrate decreased metabolism in early AD dementia at ages 50–80 years [34, 35]. At the time of baseline data collection, none of the participants in the included cohort had AD dementia, though some would later develop AD dementia. Out of over 750 participants from the ADNI-1 database, there were 359 prodromal AD participants with both baseline SDMA and Aβ42. 213 participants would be excluded because they did not complete either an MMSE, FAQ, MRI, or FDG-PET by 24 months. Therefore, there were a total of 108 participants without AD dementia and 146 participants with prodromal AD dementia who met our demographic, biomarker, and imaging criteria and were included.
Statistical analysis
Descriptive statistics were used to report baseline subject characteristics, and chi-square or student t-tests were used to report differences between cognitively unimpaired control and prodromal participants. Univariable and multivariable logistic regression analyses were used to examine the ability of baseline Aβ42 and SDMA to predict prodromal AD dementia or cognitively unimpaired control. Multivariable analysis was applied to account for effect modification. Harrell’s rule of thumb was applied to determine the maximum number of determinants in the final multivariable model (one determinant per 10 participants in the smallest cohort). Predictors that showed collinearity were not included in the regression model. All variables with p < 0.3 in the univariate models were included in the multivariable models using a backward elimination procedure using stepAIC() function in R (version 4.02.2). Interactions with either Aβ42 or SDMA were included in the multivariable models as well. In total, there were three multivariate logistic regression models: one that included Aβ42, one that included SDMA, and one that included Aβ42×SDMA. A post-hoc analysis incorporated longitudinal data collected over a span of 72 months following the baseline assessment. Specifically, there was a notable 72% attrition in neuropsychological assessments by the 48-month mark, with a subsequent reduction to 22% at the 72-month point. Similarly, FDG-PET scans were unavailable at the 48-month juncture, and only 11% of participants underwent FDG-PET imaging by the 72-month mark. Moreover, the study encountered a 46% attrition rate in MRI scans at 48 months, which increased substantially to 98% by the 72-month time point. Using this data, a mixed-effect logistic regression model with multiple imputations was performed using variables from the previous multivariable logistic regression models. Data analysis was performed using R (version 4.02.2).
To study adjusted associations in neurocognitive function within prodromal AD dementia and cognitively unimpaired control cohorts, partial correlations were conducted while adjusting for age and education. Because MMSE and FAQ are ordinal, these partial correlations are graphed as partial residual plots in order to showcase linearity. Separate partial correlations between prodromal AD dementia and cognitively unimpaired control cohorts were also created to examine the association of Aβ42 and SDMA to MRI brain regional volume and brain regional metabolic activity using FDG-PET while adjusting for age and education. Because brain volume, whether by MRI or by FDG-PET, are continuous, these partial correlations are graphed as scatterplots. Data analysis was done usingSPSS 26.
For partial correlations, tests which showed statistical significance with Bonferroni correction for multiple comparisons of FDG, MRI, and cognition (3 FDG regions×2 visits, 4 MRI regions×2 visits, 2 cognitive scores×2 visits) were defined as p < 0.0083, p < 0.00625, and p < 0.0125 respectively. Otherwise, statistical significance was given as p < 0.05 such as for the multivariable logistic regression and mixed-effect models.
RESULTS
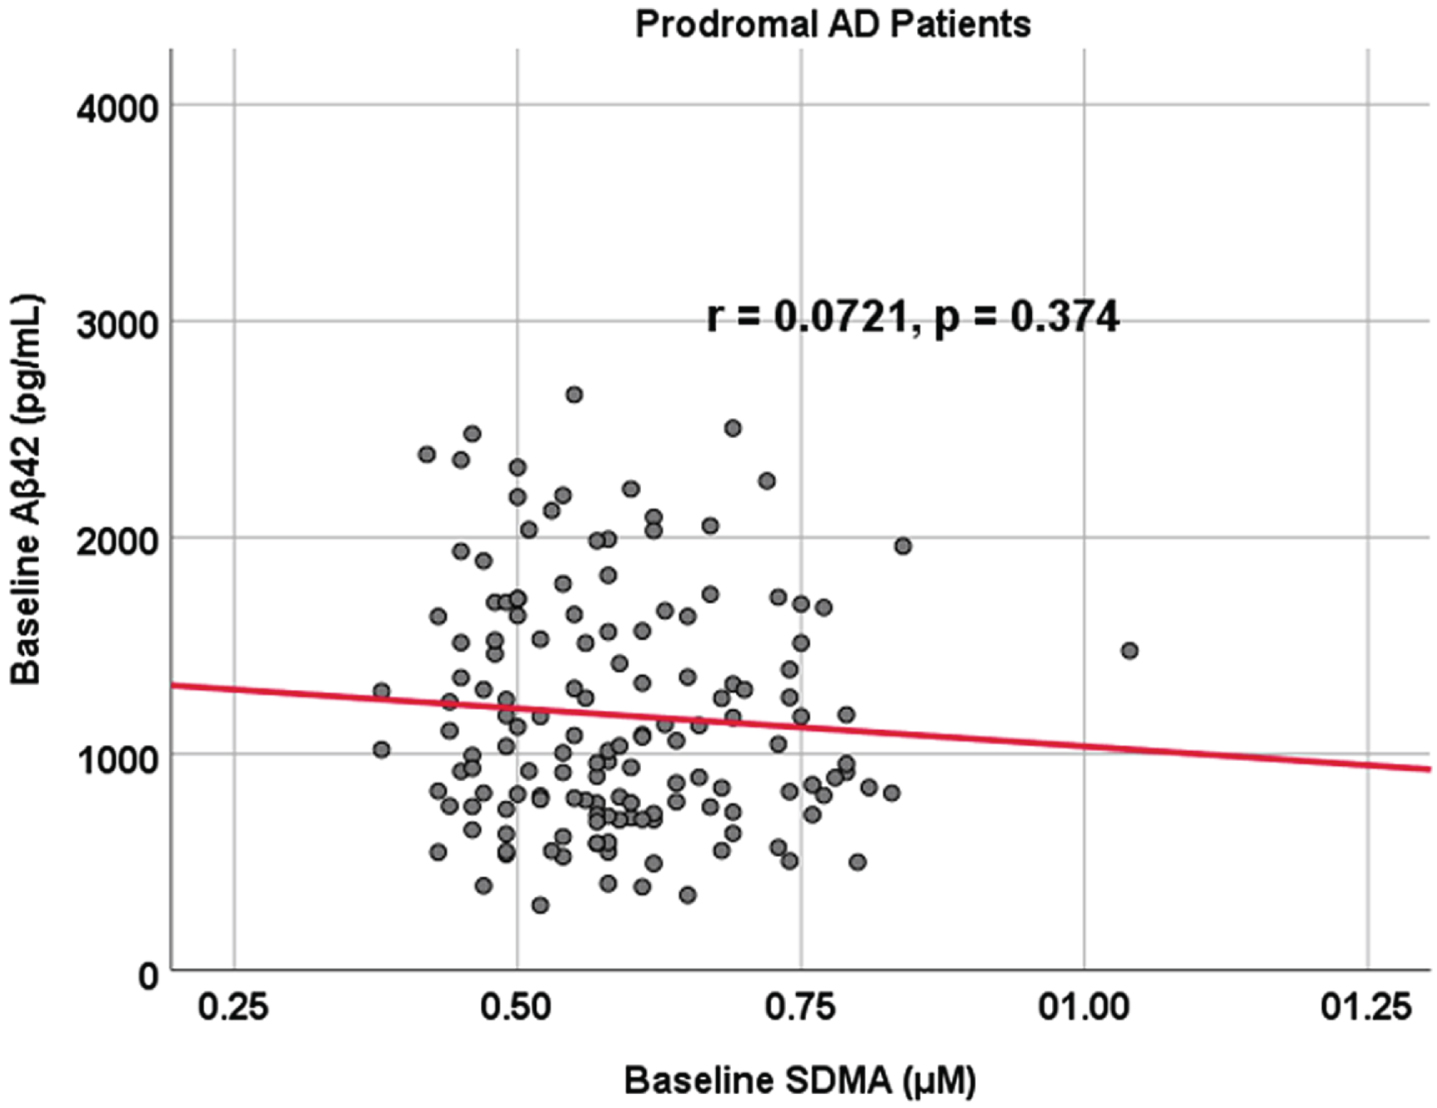
Subject characteristics are outlined in Table 1. Of the following demographic predictors—age, sex, subject education level, and APOE status—the only statistical difference between prodromal and cognitively unimpaired control participants was age as prodromal AD dementia participants were younger (median age 71 versus 73 years old, p < 0.001). Additionally, both biomarkers of interest, SDMA (p = 0.156) and Aβ42 (p = 0.242), did not show a significant difference between cognitively unimpaired control and prodromal AD dementia participants (SDMA: mean/sd: 0.613 [0.146] μM and 0.589 [0.112] μM; Aβ42: 1,279 [633] pg/mL and 1,180 [545] pg/mL). Finally, there was no correlation between Aβ42 and SDMA within both prodromal AD dementia (r = 0.0721, p = 0.374) and cognitively unimpaired control (r = 0.110, p = 0.257) cohorts (Figs. 1 and 2). To summarize our comparison analyses (Table 1), there were no significant differences in functional and cognitive scores (FAQ and MMSE respectively) between cognitively unimpaired control and prodromal AD dementia participants at either baseline or 24 months. Additionally, there were no significant differences between the two groups regarding metabolic activity within the posterior cingulate or the temporal lobes, as well as no significant structural brain volume differences in the temporal lobe and the hippocampus when controlling for age (data not shown).
Table 1
Group characteristics
| Characteristics | Cognitively unimpaired control (n = 108) No. (%) | Prodromal (n = 146) No. % | p |
| Age (y) ** Q1, Median, Q3 (range) | **69, 73, 79 (56–91) | **64, 71, 76 (55–91) | <0.001 |
| Subject Education (y) Q1, Median, Q3 (range) | 16, 16, 19 (12–20) | 14, 16, 18 (12–20) | 0.107 |
| Male Sex | 61 (56.4) | 79 (54.1) | 0.804 |
| APOE Q1, Median, Q3 (range) | **3/3, 3/3, 3/4 (3/2–4/4) | **3/3, 3/3, 3/4 (3/2–4/4) | 0.790 |
| 2/3 | 15 (13.9) | 18 (12.3) | |
| 3/3 | 60 (55.6) | 76 (52.0) | |
| 3/4 | 27 (25.0) | 46 (31.5) | |
| 4/4 | 8 (7.4) | 10 (6.84) | |
| SDMA Baseline Level (μM) | 0.613 (0.146) | 0.589 (0.112) | 0.1556 |
| Aβ42 Baseline Level (pg/mL) | 1,279 (633) | 1,180 (545) | 0.2423 |
| FAQ Baseline | 1.96(5.10) | 1.78(2.88) | 0.7188 |
| FAQ 24 Months | 3.42(7.79) | 2.47(3.71) | 0.4917350 |
| MMSE Baseline | 28.07(2.76) | 28.33(1.66) | 0.722915 |
| MMSE 24 Months | 27.27(4.43) | 27.75(3.04) | 0.5426080 |
APOE, apolipoprotein genotype; SDMA, symmetric dimethylarginine; FAQ, Functional Activities Questionnaire; MMSE, Mini-Mental State Examination. The table shows the subject characteristics of the two cohorts, cognitively unimpaired control and prodromal. Based on the p-values, age (p < 0.001) is the only known confounding variable in our analysis.
Fig. 1
Associations between baseline Aβ42 and SDMA in cognitively unimpaired control participants. Scatterplots above are uncorrected for age, sex, education, and APOE (r = 0.110, p = 0.257).
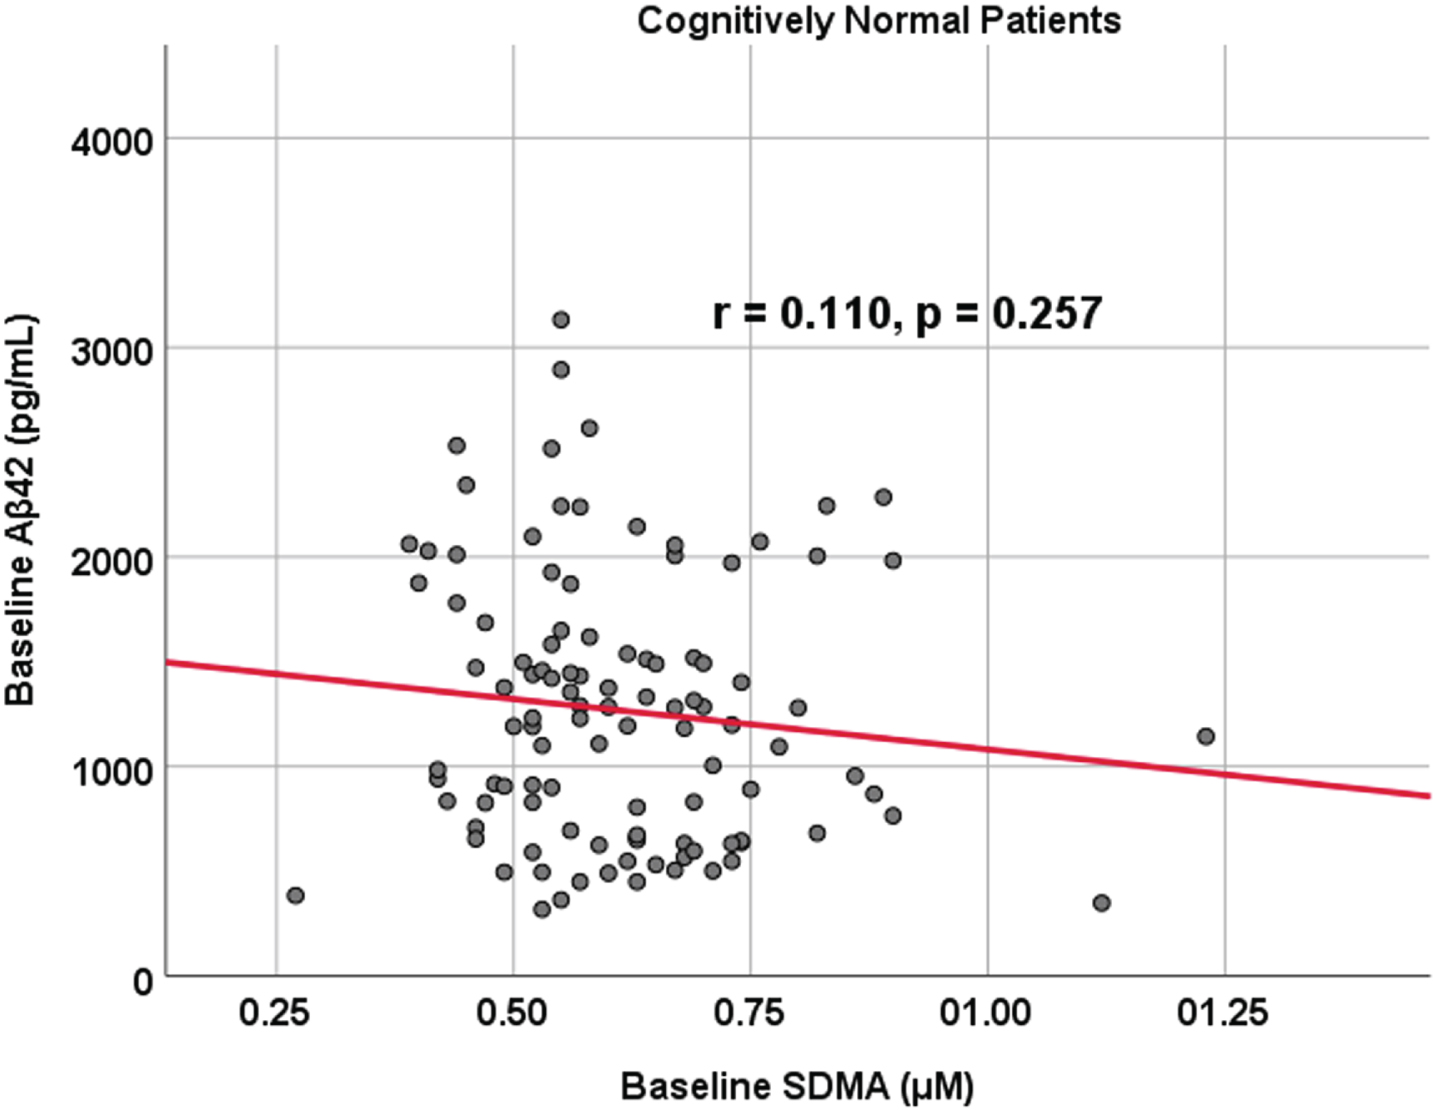
Fig. 2
Associations between baseline Aβ42 and SDMA in prodromal AD dementia participants. Scatterplots above are uncorrected for age, sex, education, and APOE (r = 0.0721, p = 0.374).
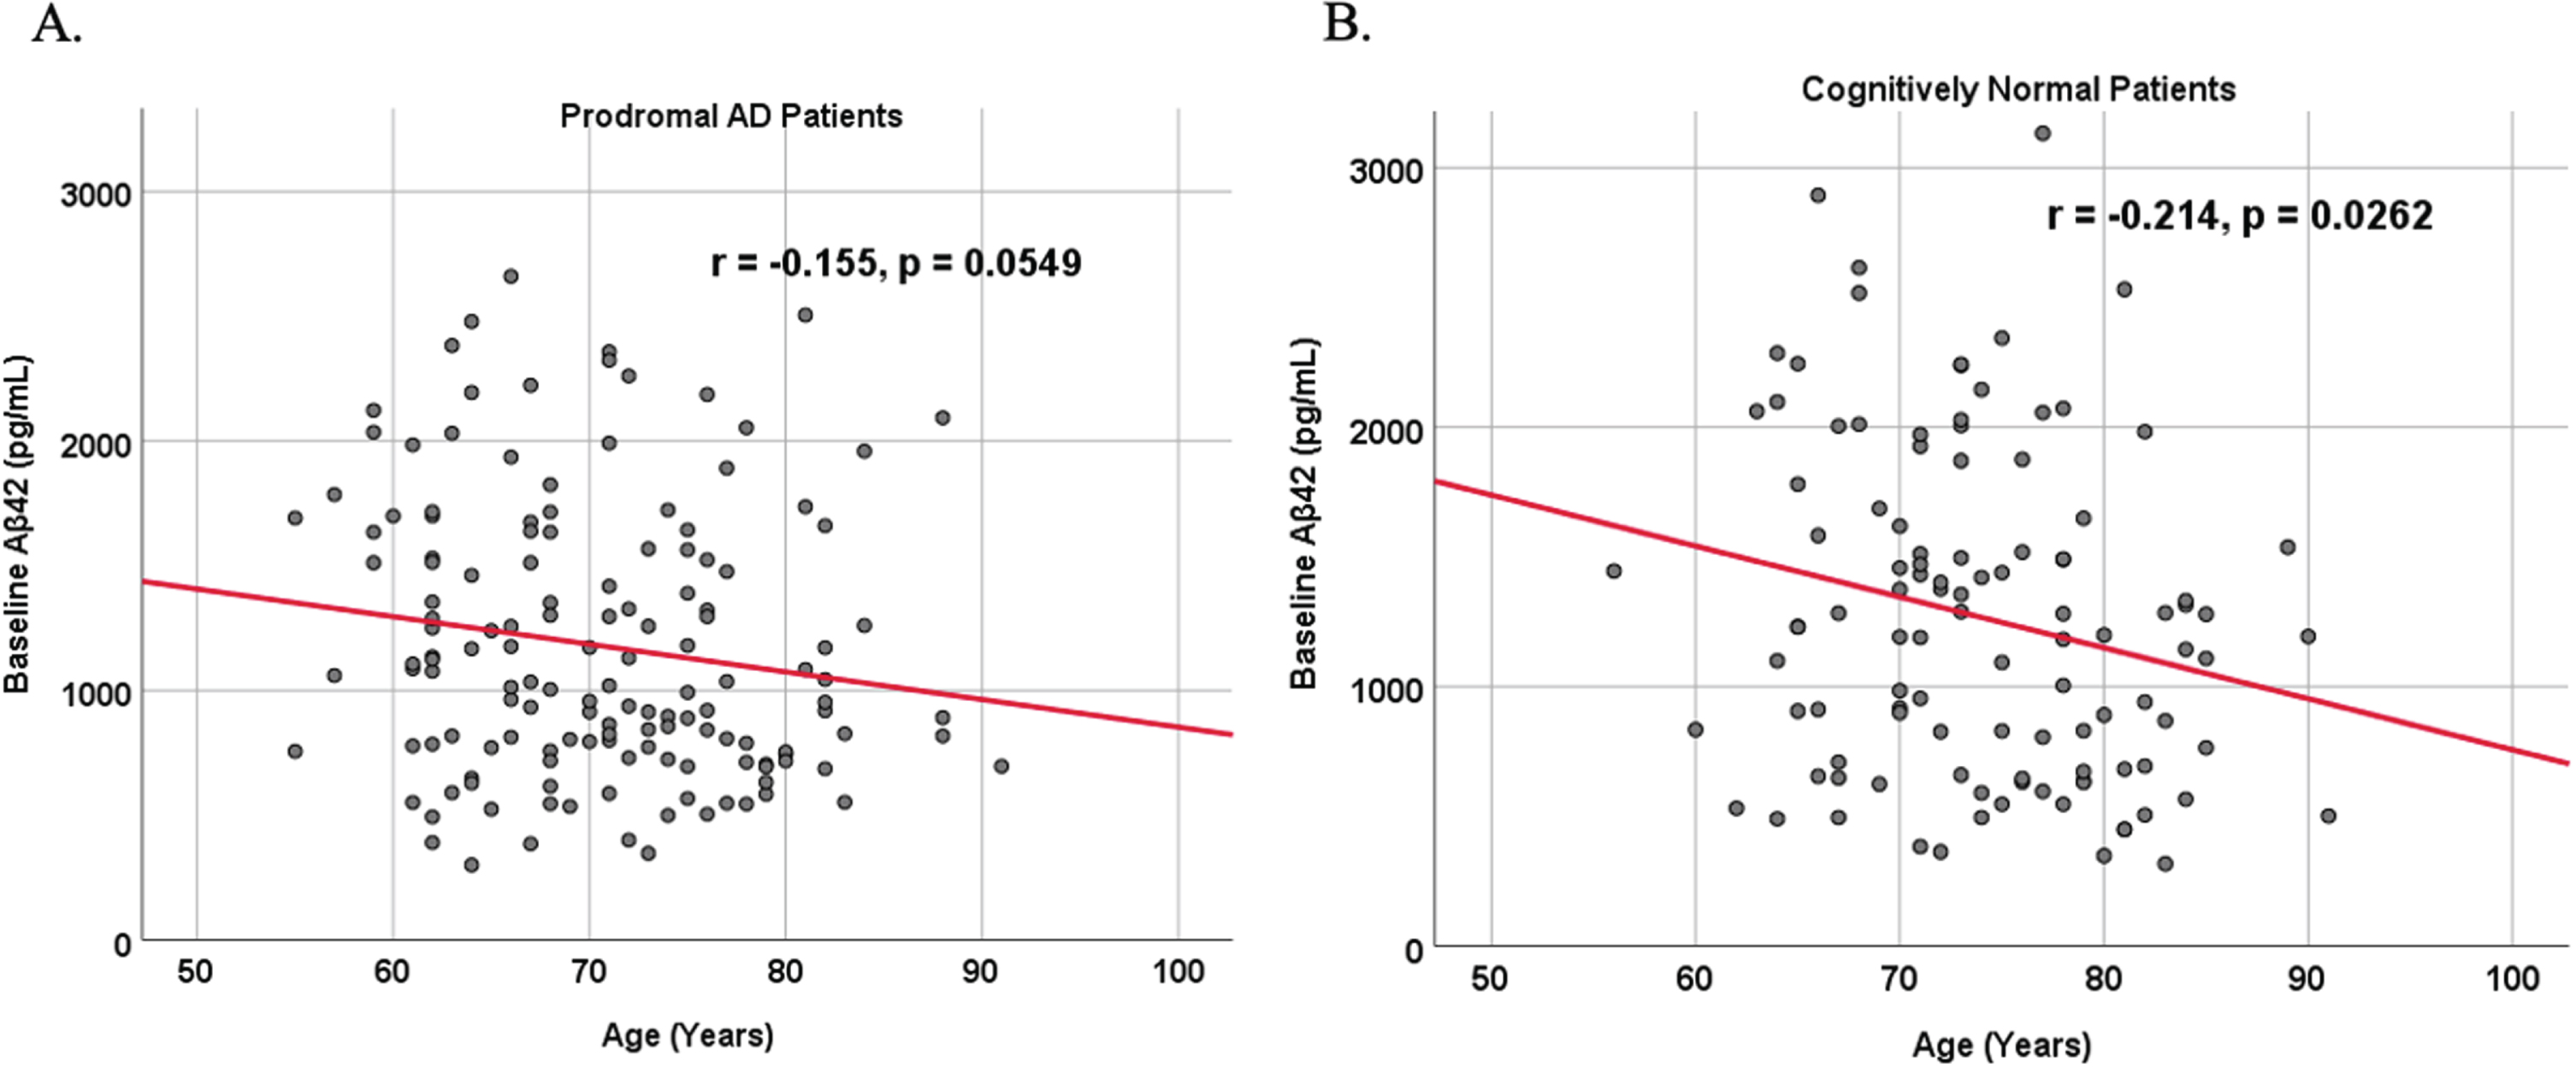
Because AD dementia is an age-dependent disease, we analyzed the relationship between age and biomarker levels in cognitively unimpaired control and prodromal AD dementia subject cohorts (Figs. 3 and 4). We observed a positive correlation between age and SDMA levels in both cognitively unimpaired control (r = 0.400, p < 0.00001) and prodromal AD dementia participants (r = 0.387, p < 0.00001), and a negative correlation between age and Aβ42 levels in both cognitively unimpaired control (r = –0.155, p = 0.0549) and prodromal AD dementia participants (r = –0.214, p = 0.0262).
Fig. 3
Associations between baseline SDMA and age in cognitively unimpaired control and prodromal participants. Scatterplots above are uncorrected for sex, education, and APOE. A) SDMA versus Age in prodromal AD dementia participants (r = 0.387, p < 0.00001). B) SDMA versus Age in cognitively unimpaired control participants (r = 0.400, p < 0.00001).
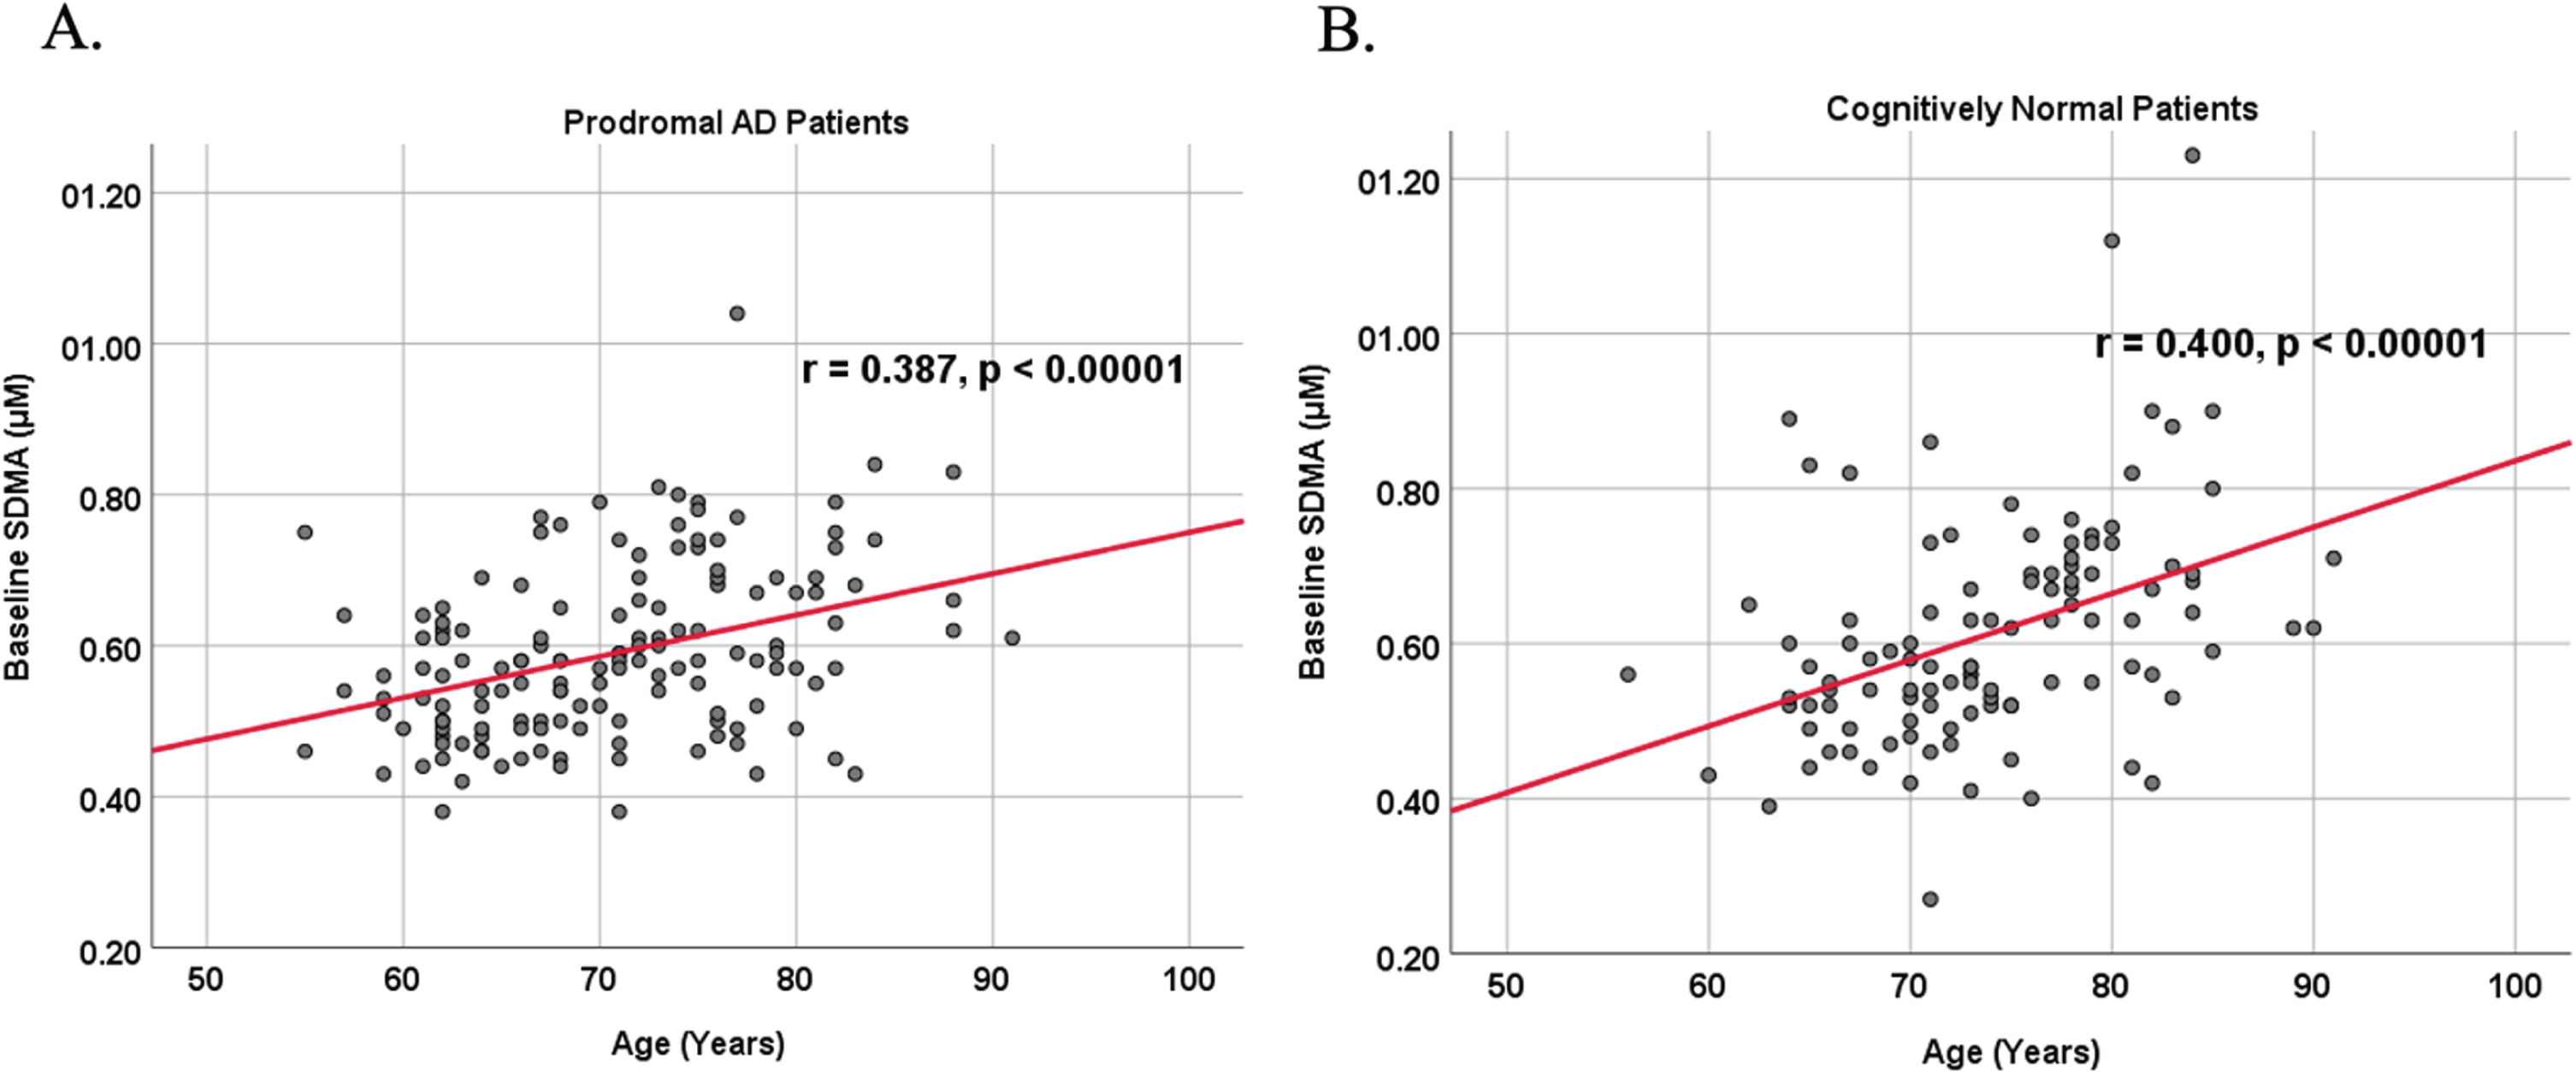
Fig. 4
Associations between baseline Aβ42 and age in cognitively unimpaired control and prodromal participants. Scatterplots above are uncorrected for sex, education, and APOE. A) Aβ42 versus Age in prodromal AD dementia participants (r = –0.155, p = 0.0549). B) Aβ42 versus Age in cognitively unimpaired control participants (r = –0.214, p = 0.0262).
To understand if SDMA or Aβ42 as well as its interactions are associated with prodromal subject status, three multivariable logistic analyses were conducted adjusting for age: one looking at SDMA levels, another at Aβ42 levels, and one at both together (Tables 3–5). Of note is that univariable analysis found baseline FAQ score to be able to significantly predict prodromal AD dementia participants and healthy controls (p = 0.0264; OR = 1.1201, 95% CI = 1.0212–1.2506). Ultimately, both univariable and multivariable models for SDMA (p = 0.45) and Aβ42 (p = 0.6518) each showed no statistical difference in being able to predict prodromal AD dementia participants and normal controls (Tables 3 and 4). Although our multivariable model that included SDMA and Aβ42 together was significant (p = 0.00296), they were not associated with predicting prodromal subject status (p = 0.14490), although baseline FAQ (p = 0.02158) and age (p = 0.03481) were. Post-hoc mixed-effects model in Table 6 was also significant (p = 0.00157) and revealed no significant predictive property of prodromal subject status with the addition of more longitudinal data from either baseline SDMA (p = 0.26353) or Aβ42 (p = 0.15073), but age (p = 0.0000084) and education (p = 0.00309) were predictive.
Table 2
Univariable logistic regression
| Variable | β Estimate | Standard Error | OR (95% CI) | p |
| FAQ BL | 0.11343 | 0.05109 | 1.1201(1.0212,1.2506) | 0.0264 |
| Age | –0.037 | 0.01931 | 0.9637(0.9273, 1.0005) | 0.0553 |
| Right Mesio-Temporal 24M% Decline | –4.9433 | 2.6003 | 0.0071(0.0001,1.0319) | 0.0573 |
| Left Mesio-Temporal 24M% Decline | –3.9927 | 2.2064 | 0.0184(0.0002,1.2984) | 0.070357 |
| Left Mesio-Temporal BL | 0.0001469 | 0.00009555 | 1.0001(0.9999, 1.0003) | 0.124 |
| Aβ42 BL | –0.0003298 | 0.0002238 | 0.997(0.9992,1.0001) | 0.14066 |
| Left Temporal 24M% Decline | –2.2242 | 1.8093 | 0.1082(0.0028,3.5480) | 0.218936 |
| FAQ 24M% Decline | 0.001976 | 0.001686 | 1.0020(0.9986,1.0055) | 0.241 |
| Education | –0.05709 | 0.05117 | 0.9445(0.8534,1.0435) | 0.265 |
| Posterior Cingulum BL | 0.8017 | 0.7668 | 2.2293(0.4978,10.1865) | 0.296 |
| MMSE 24M% Decline | –0.01321 | 0.01361 | 0.9869(0.9595,1.0135) | 0.331794 |
| Right Mesio-Temporal BL | 0.00007593 | 0.00008631 | 1.0001(0.9999, 1.0002) | 0.379 |
| Right Hippocampus 24M% Decline | 1.3737 | 1.5686 | 3.9500(0.1957,115.2847) | 0.38117 |
| Right Hippocampus BL | 0.0001673 | 0.0002238 | 1.0002(0.9997,1.0006) | 0.455 |
| MMSE BL | –0.03882 | 0.06323 | 0.9893(0.8807,1.1079) | 0.539 |
| APOE | 0.1013 | 0.1783 | 1.1066(0.7813,1.5761) | 0.57 |
| Left Hippocampus 24M% Decline | –0.3558 | 1.27 | 0.7006(0.0433,8.2812) | 0.77935 |
| Right Temporal 24M% Decline | –0.4655 | 1.9347 | 0.6278(0.0133,27.9509) | 0.809871 |
| Left Hippocampus BL | 0.00005174 | 0.0002256 | 1.0001(0.9996,1.0005) | 0.819 |
| Right Temporal BL | –0.2322 | 1.0784 | 0.7928(0.0936,6.5742) | 0.83 |
| Sex | –0.0495 | 0.2649 | 0.9517(0.5661,1.6015) | 0.852 |
| SDMA BL | –0.2359 | 1.1123 | 0.7899(0.0891,7.1498) | 0.832 |
| Posterior Cingulum 24M% Decline | 0.1851 | 1.17731 | 1.2033(0.0349,38.9213) | 0.91686 |
| Left Temporal BL | –0.09299 | 0.96987 | 0.9112(0.1338,6.1061) | 0.924 |
FAQ, Functional Activities Questionnaire; BL, Baseline Level; 24M, 24 months; MMSE, Mini-Mental State Examination; APOE, apolipoprotein genotype; SDMA, symmetric dimethylarginine.
Table 3
Multivariable logistic regression including SDMA
| Variable | β Estimate | Standard Error | p |
| Intercept | 2.42 | 3.23 | 0.45 |
| SDMA BL | 3.19 | 2.82 | 0.25685 |
| MRI Left Mesio-Temporal 24M% Decline | –17.33 | 6.69 | 0.00963 |
| MRI Left Mesio-Temporal BL | 0.000421 | 0.0002035 | 0.0386 |
| FDG Left Temporal 24M% Decline | –5.57 | 3.73 | 0.13564 |
| FAQ 24M% Decline | –0.001961 | 0.002396 | 0.41306 |
| FDG Posterior Cingulum BL | –1.38 | 1.66 | 0.40481 |
| Age | –0.0618 | 0.04197 | 0.14093 |
SDMA, symmetric dimethylarginine; BL, Baseline Level; 24M, 24 months.
Table 4
Multivariable logistic regression including Aβ42
| Variable | β Estimate | Standard Error | p |
| Intercept | 1.66 | 3.67 | 0.6518 |
| Aβ42 BL | –0.0007975 | 0.0005634 | 0.1569 |
| MRI Right Mesio-Temporal 24M% Decline | –8.56 | 5.7 | 0.1329 |
| MRI Left Mesio-Temporal 24M% Decline | –16.43 | 6.83 | 0.0161 |
| MRI Left Mesio-Temporal BL | 0.0003284 | 0.0001981 | 0.0973 |
| FDG Left Temporal 24M% Decline | –4.1 | 3.85 | 0.287 |
| FAQ 24M% Decline | –0.001319 | 0.002387 | 0.5807 |
| Age | –0.0282 | 0.03821 | 0.4604 |
BL, Baseline Level; 24M, 24 months.
Table 5
Multivariable logistic regression including SDMA×Aβ42
| Variable | β Estimate | Standard Error | p |
| Intercept | 5.5052849 | 1.8527855 | 0.00296 |
| SDMA BL×Aβ42 BL | –0.0005728 | 0.0003929 | 0.14490 |
| MRI Right Mesio-Temporal 24M% Decline | –4.3946445 | 2.9739123 | 0.13948 |
| MRI Left Mesio-Temporal 24M% Decline | –3.8302686 | 2.6132666 | 0.14273 |
| Education | –0.0908523 | 0.0539301 | 0.09206 |
| FAQ BL | 0.1222798 | 0.0532205 | 0.02158 |
| Age | –0.0433383 | 0.0205335 | 0.03481 |
FAQ, Functional Activities Questionnaire; BL, Baseline Level; 24M, 24 months.
Table 6
Post-hoc Mixed-effect logistic regression with multiple imputations
| Variable | β Estimate | Standard Error | p |
| Intercept | 2.70716 | 0.85642 | 0.00157 |
| Time | 0.3101 | 0.48986 | 0.52671 |
| SDMA BL | 0.68454 | 0.61223 | 0.26353 |
| Aβ42 BL | –0.97543 | 0.67882 | 0.15073 |
| FAQ | 0.02464 | 0.52501 | 0.96256 |
| FDG Left Temporal | 0.05765 | 0.5224 | 0.91213 |
| MRI Left Mesio-Temporal | 1.35702 | 0.74324 | 0.06788 |
| MRI Right Mesio-Temporal | –0.17772 | 0.75693 | 0.81437 |
| Education | –2.04067 | 0.68972 | 0.00309 |
| FDG Posterior Cingulum | 0.33892 | 0.60528 | 0.57552 |
| Age | –3.25965 | 0.73173 | 0.0000084 |
SDMA, symmetric dimethylarginine; BL, Baseline Level; FAQ, Functional Activities Questionnaire.
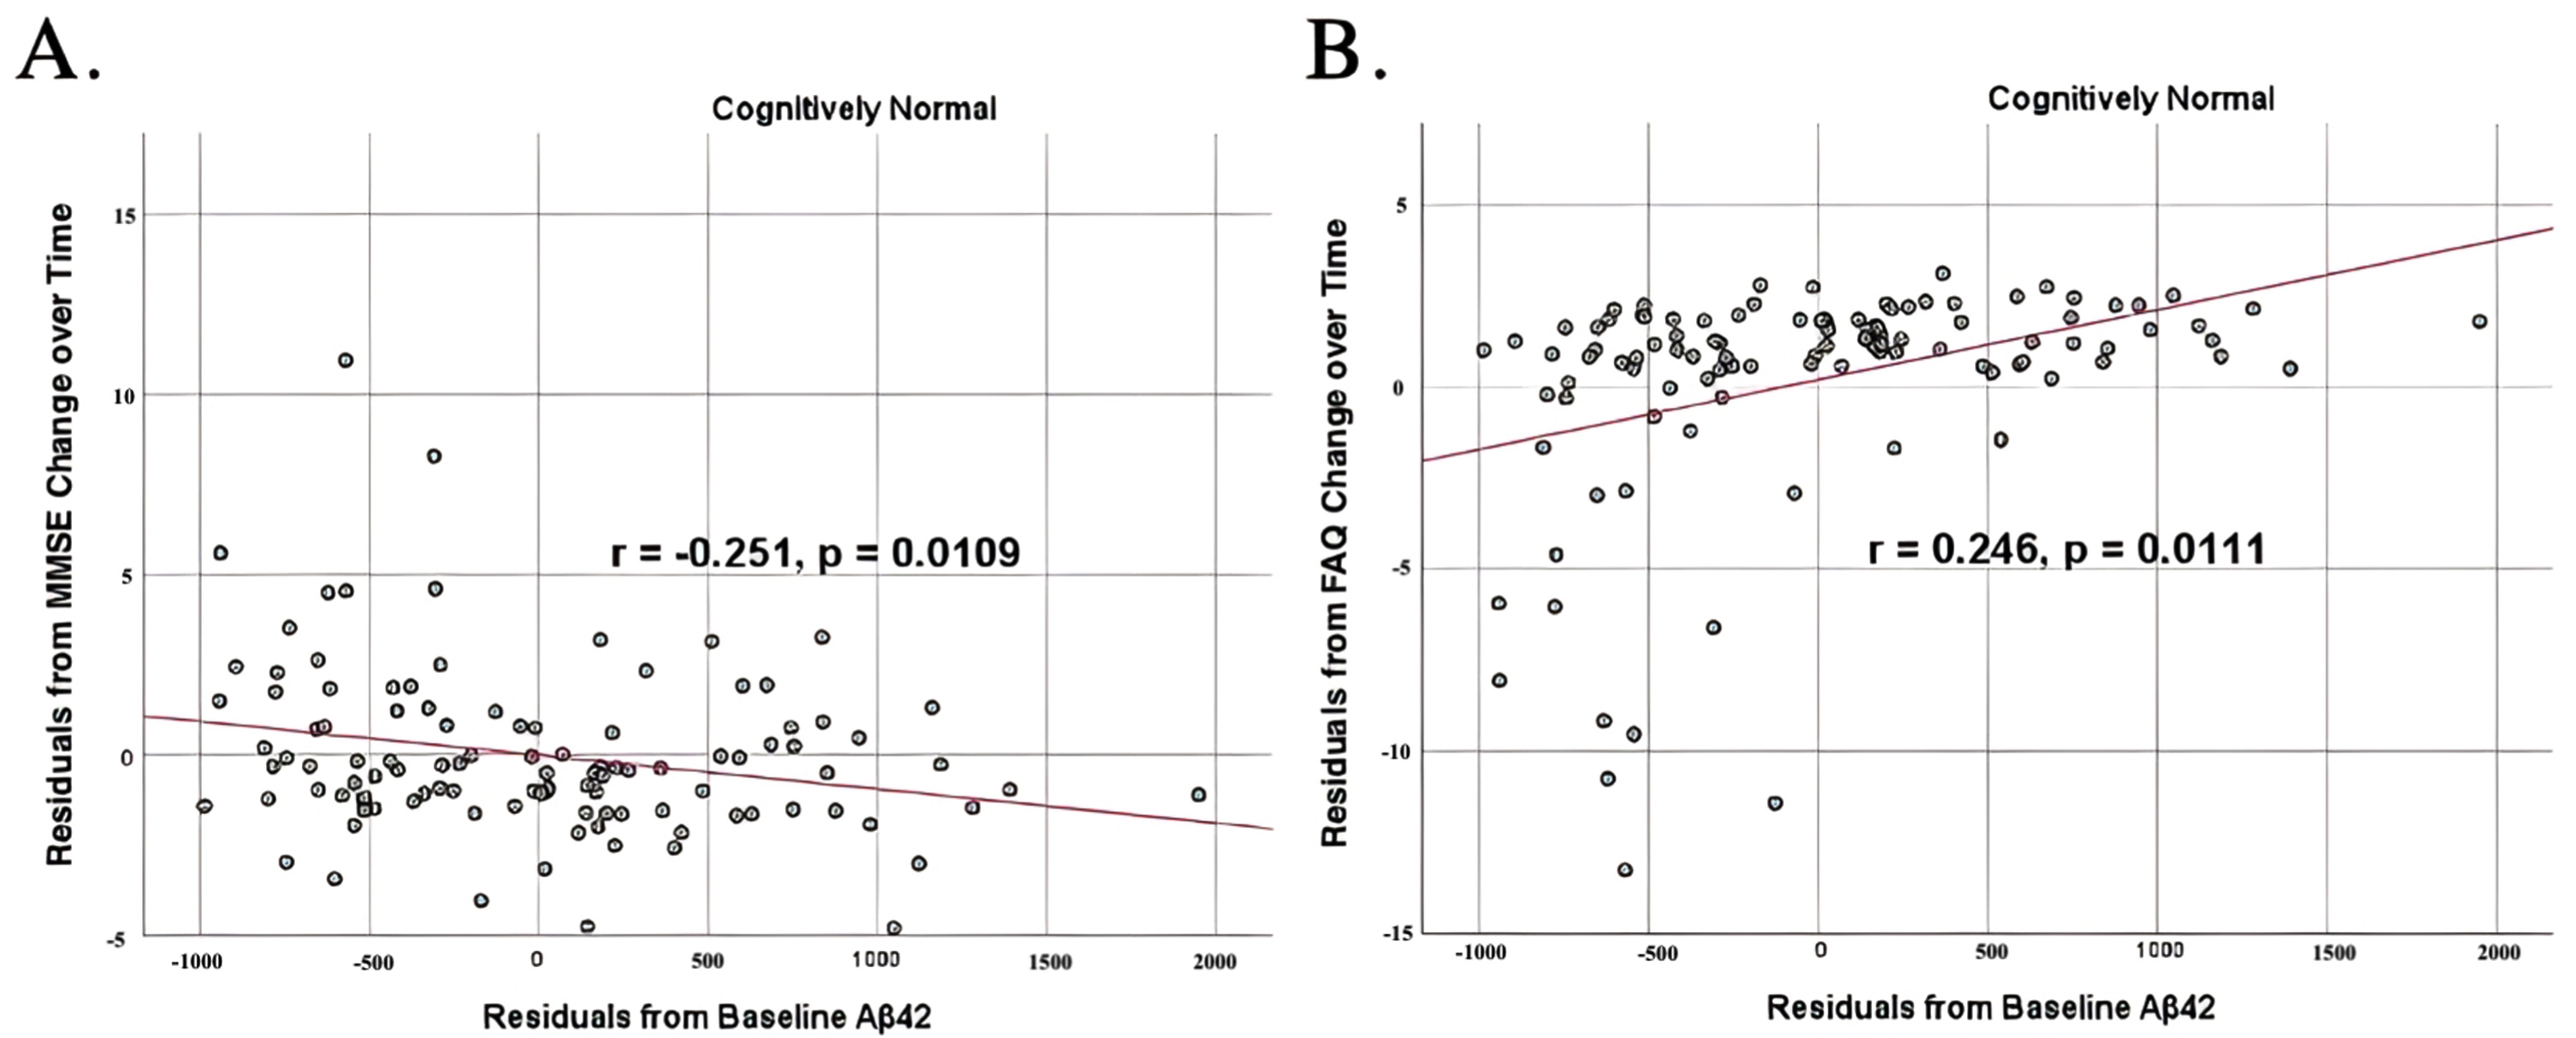
To analyze for relationships between biomarker levels and cognitive function, scatterplots and associations were computed (Figs. 5–7). Note that a lower MMSE score indicates cognitive impairment, whereas a higher FAQ score may indicate cognitive impairment. A positive relationship was found in cognitively unimpaired participants between baseline Aβ42 and baseline MMSE (r = 0.386, p = 4.4×10⁻⁵) and a negative relationship between baseline Aβ42 and baseline FAQ (r = –0.272, p = 0.0005). A positive relationship, albeit smaller, was found between baseline Aβ42 and MMSE at 24 months (r = 0.277, p = 0.004). Finally, a negative relationship was found between baseline Aβ42 and MMSE decline over 24 months (r = –0.251, p = 0.0109), suggesting that lower baseline Aβ42 was associated with worsening MMSE over 24 months. A positive relationship was found between baseline Aβ42 and FAQ decline (r = 0.246, p = 0.0111), suggesting that lower Aβ42 was associated with worsening FAQ scores over 24 months. No significant correlation was found between Aβ42 and cognitive scores in prodromal AD dementia participants. Additionally, no significant correlation was found between SDMA and neurocognitive scores for either cognitively unimpaired participants or prodromal AD dementiaparticipants.
Fig. 5
Partial correlations between baseline Aβ42 concentration and baseline neurocognitive function in normal controls, corrected for age and education. Scatterplots above are corrected for age and education. A) Aβ42 versus MMSE (r = 0.386, p = 4.4×10⁻⁵). B) Aβ42 versus FAQ (r = –0.272, p = 0.0005).
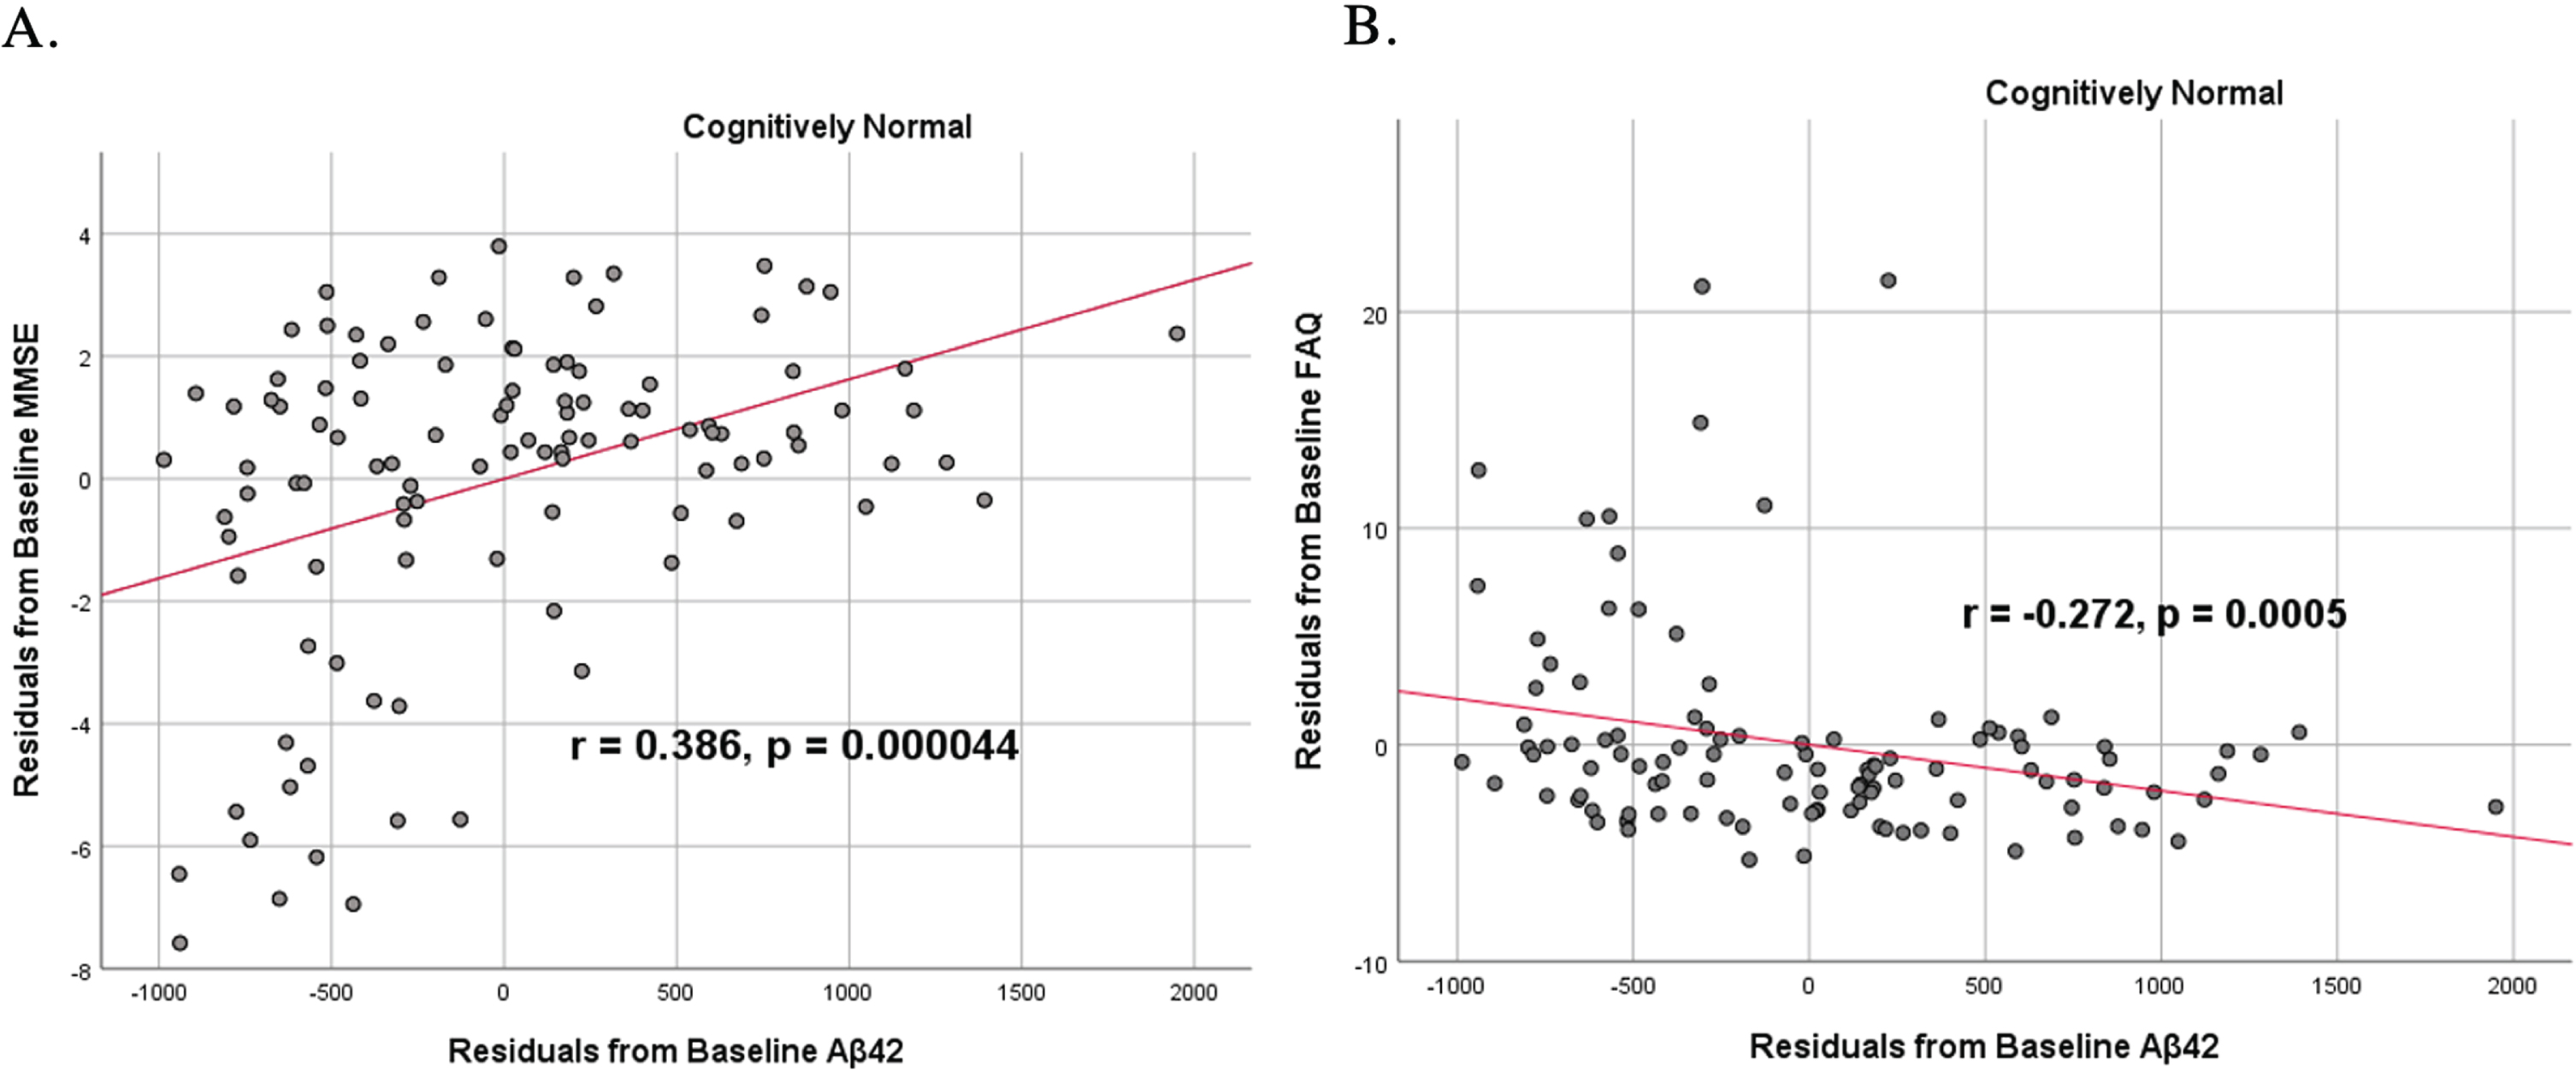
Fig. 6
Partial correlations between baseline Aβ42 concentration and 24 months neurocognitive function in normal controls, corrected for age and education. Scatterplots above are corrected for age and education. Aβ42 versus MMSE (r = 0.277, p = 0.004).
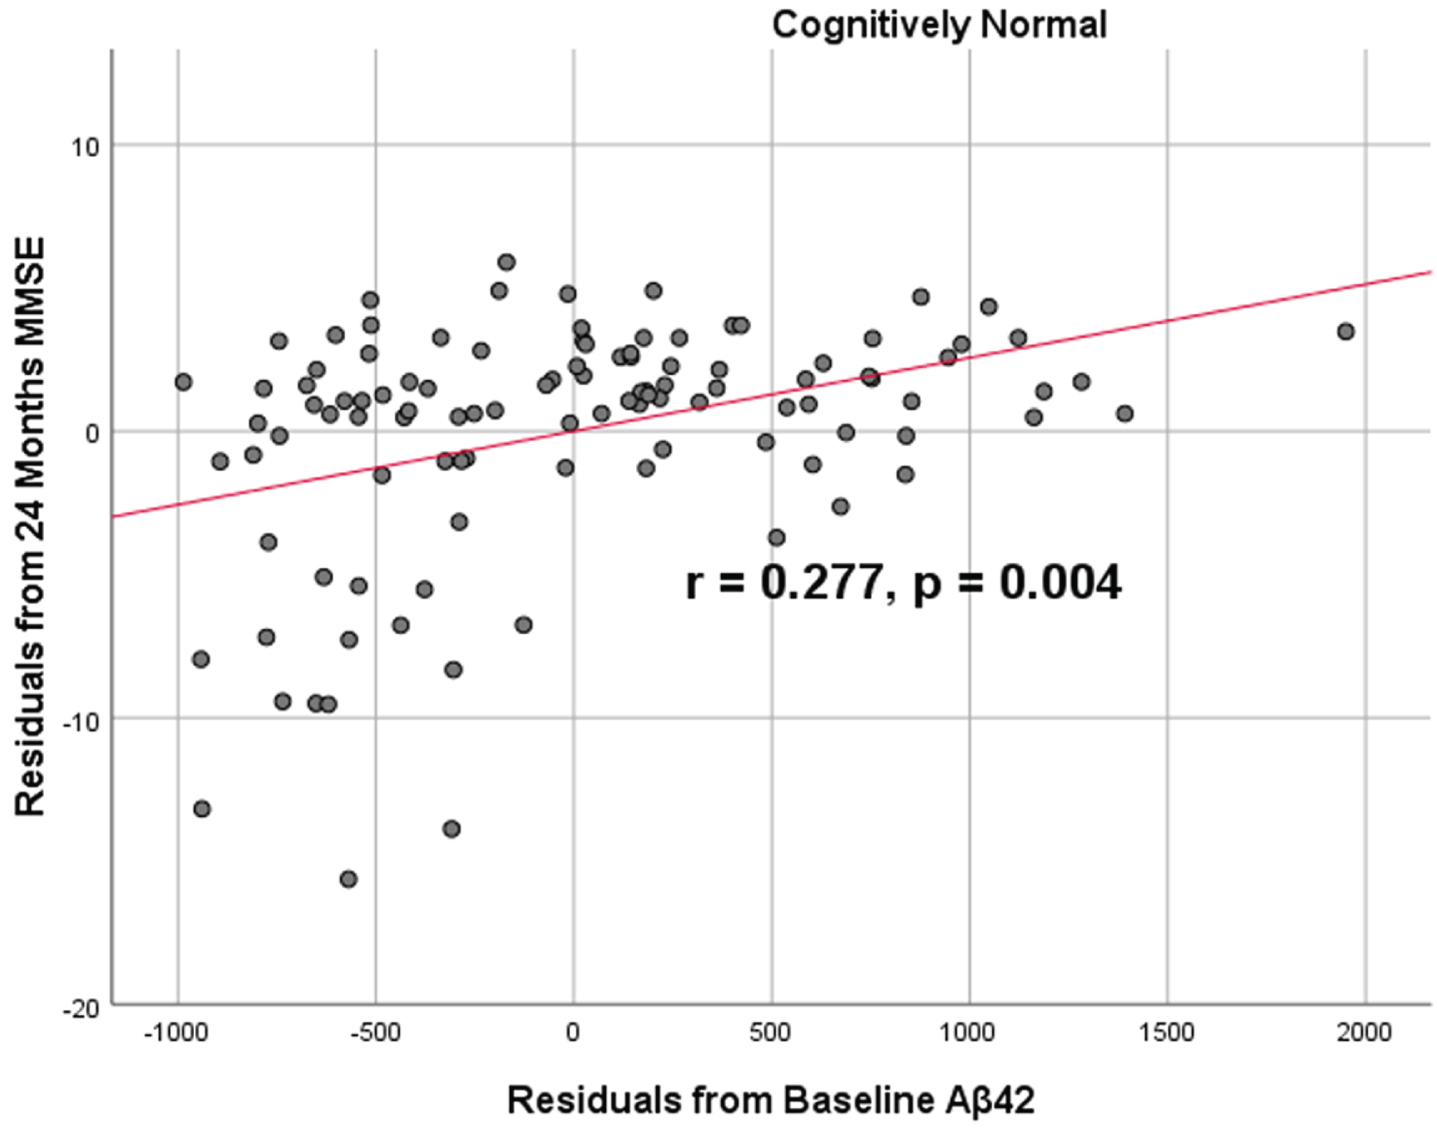
Fig. 7
Partial correlations between baseline Aβ42 concentration and neurocognitive function decline in normal controls, corrected for age and education. Scatterplots above are corrected for age and education. A) Aβ42 versus MMSE (r = –0.251, p = 0.0109). B) Aβ42 versus FAQ (r = 0.246, p = 0.0111).
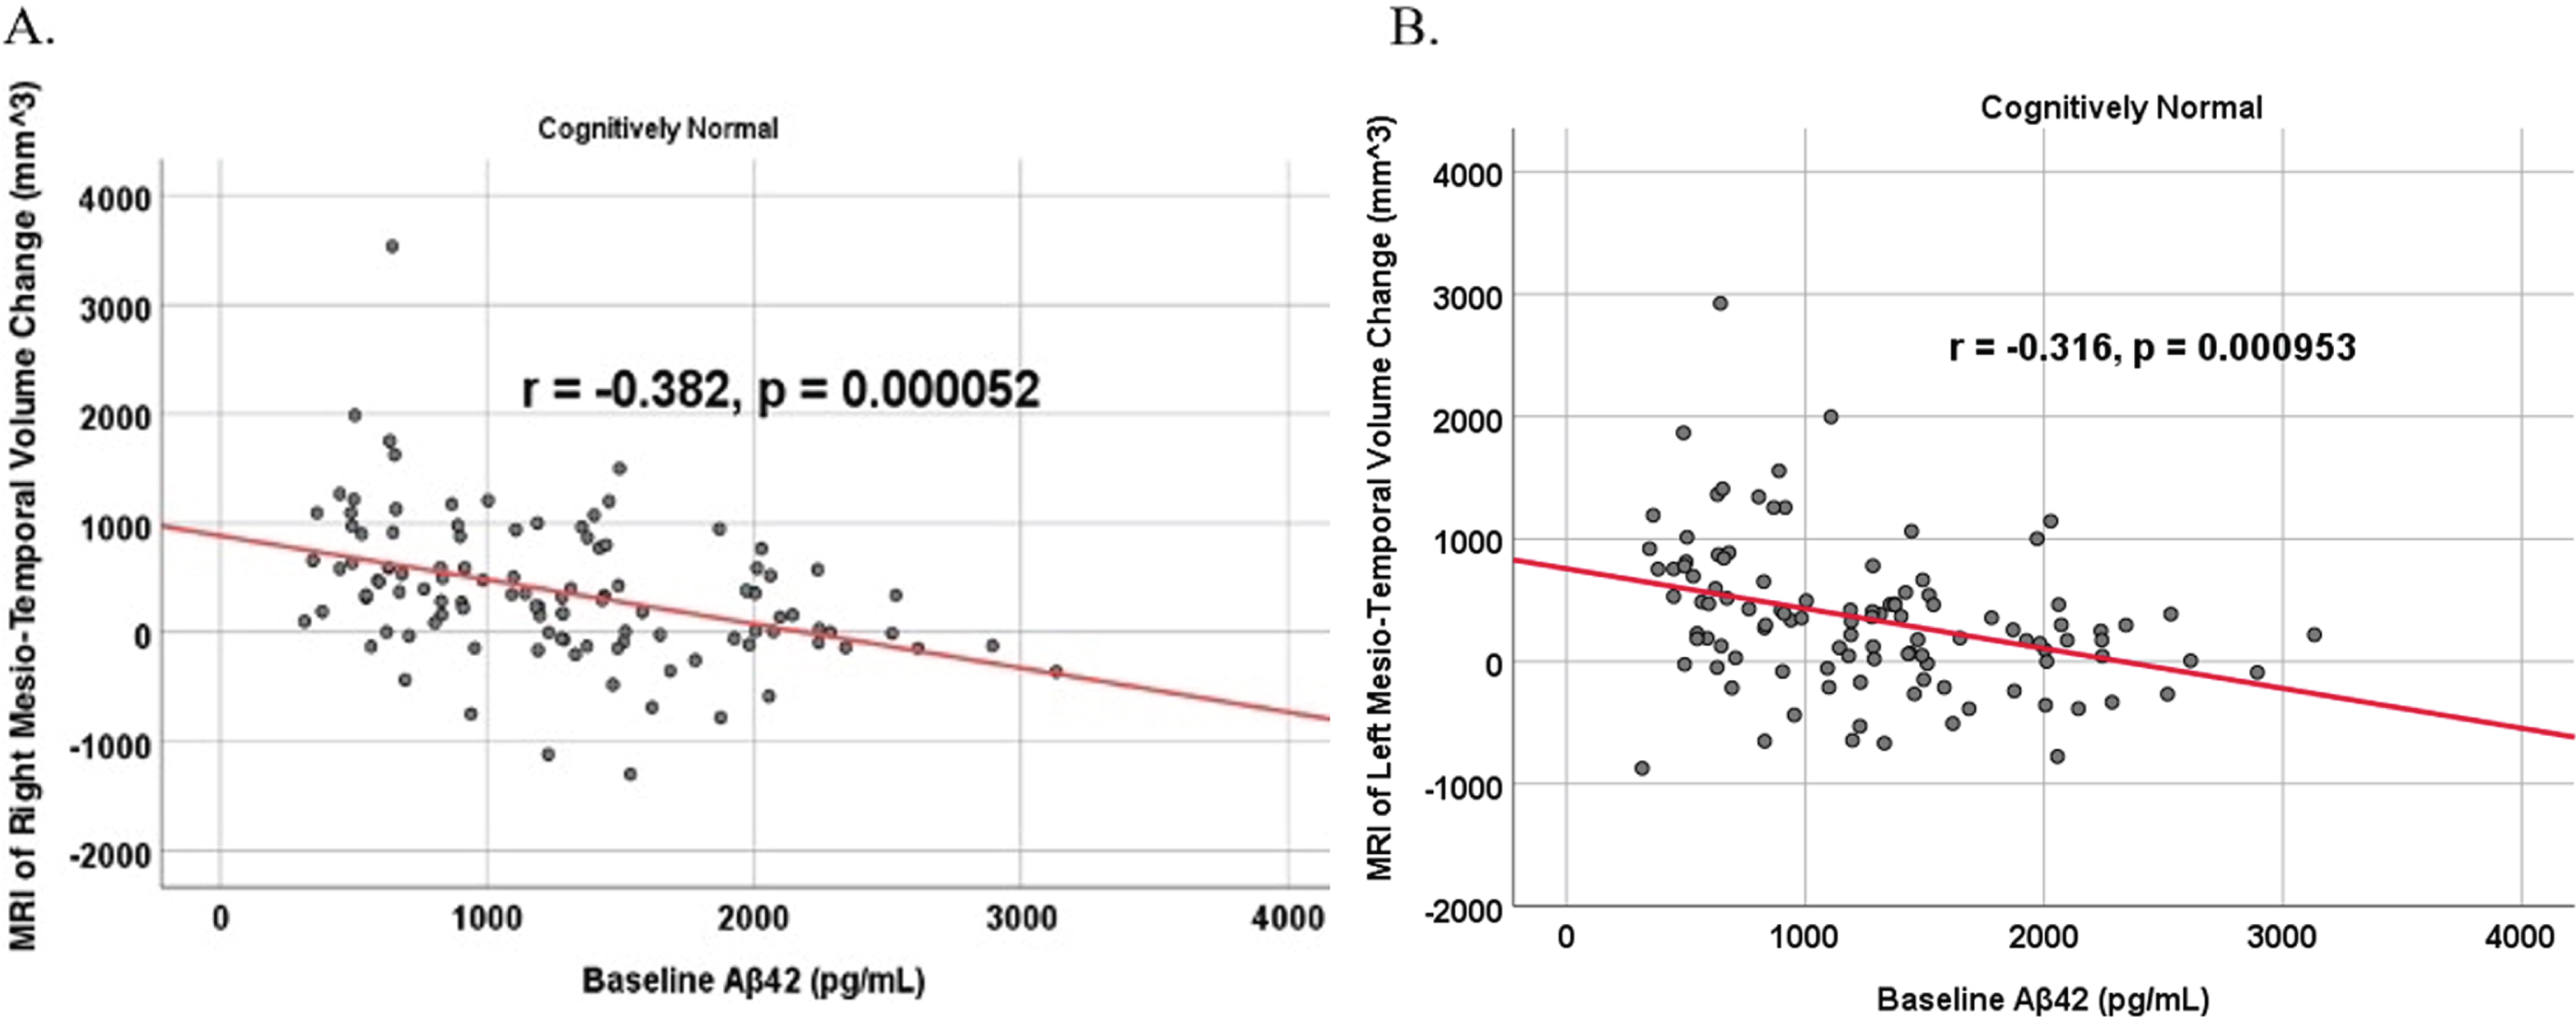
To analyze for relationships between biomarker levels and regional neuroimaging assessments, scatterplots and associations were computed (Figs. 8–12). See Supplementary Figures for scatterplots and associations across all participants. Positive relationships were found in cognitively unimpaired participants between baseline Aβ42 and posterior cingulum metabolism (r = 0.270, p = 0.005), left temporal metabolism (r = 0.477, p = 2.324×10⁻⁷), and right temporal metabolism (r = 0.358, p = 0.000161) at baseline. In cognitively unimpaired participants, there were also positive associations between baseline Aβ42 and baseline right (r = 0.301, p = 0.00173) and left (r = 0.328, p = 0.000587) hippocampal volume. At 24 months, the association slightly decreased between baseline Aβ42 and left temporal metabolism (r = 0.446, p = 2.0×10⁻⁶), though the metabolic association increased for the right temporal lobe (r = 0.380, p = 0.000059). The association between baseline Aβ42 and right hippocampal volume at 24 months also slightly decreased (r = 0.286, p = 0.003) and for the right increased (r = 0.347, p = 0.000263). Finally, negative associations were found regarding baseline Aβ42 and right mesio-temporal volume change (r = –0.382, p = 0.000052) and left mesio-temporal volume change (r = –0.316, p = 0.000953) and are weakly negative. No significant correlation was found between Aβ42 and brain regions in prodromal AD dementia participants. Additionally, no significant correlation was found between SDMA and regional neuroimaging measures for either cognitively unimpaired participants or prodromal AD dementia participants.
Fig. 8
Partial correlations between baseline Aβ42 and baseline FDG brain volume regions in cognitively unimpaired control participants, corrected for age and education. Scatterplots above are corrected for age and education. A) Aβ42 versus Posterior Cingulum (r = 0.270, p = 0.005). B) Aβ42 versus Left Temporal (r = 0.477, p = 2.324×10⁻⁷). C) Aβ42 versus Right Temporal (r = 0.358, p = 0.000161).
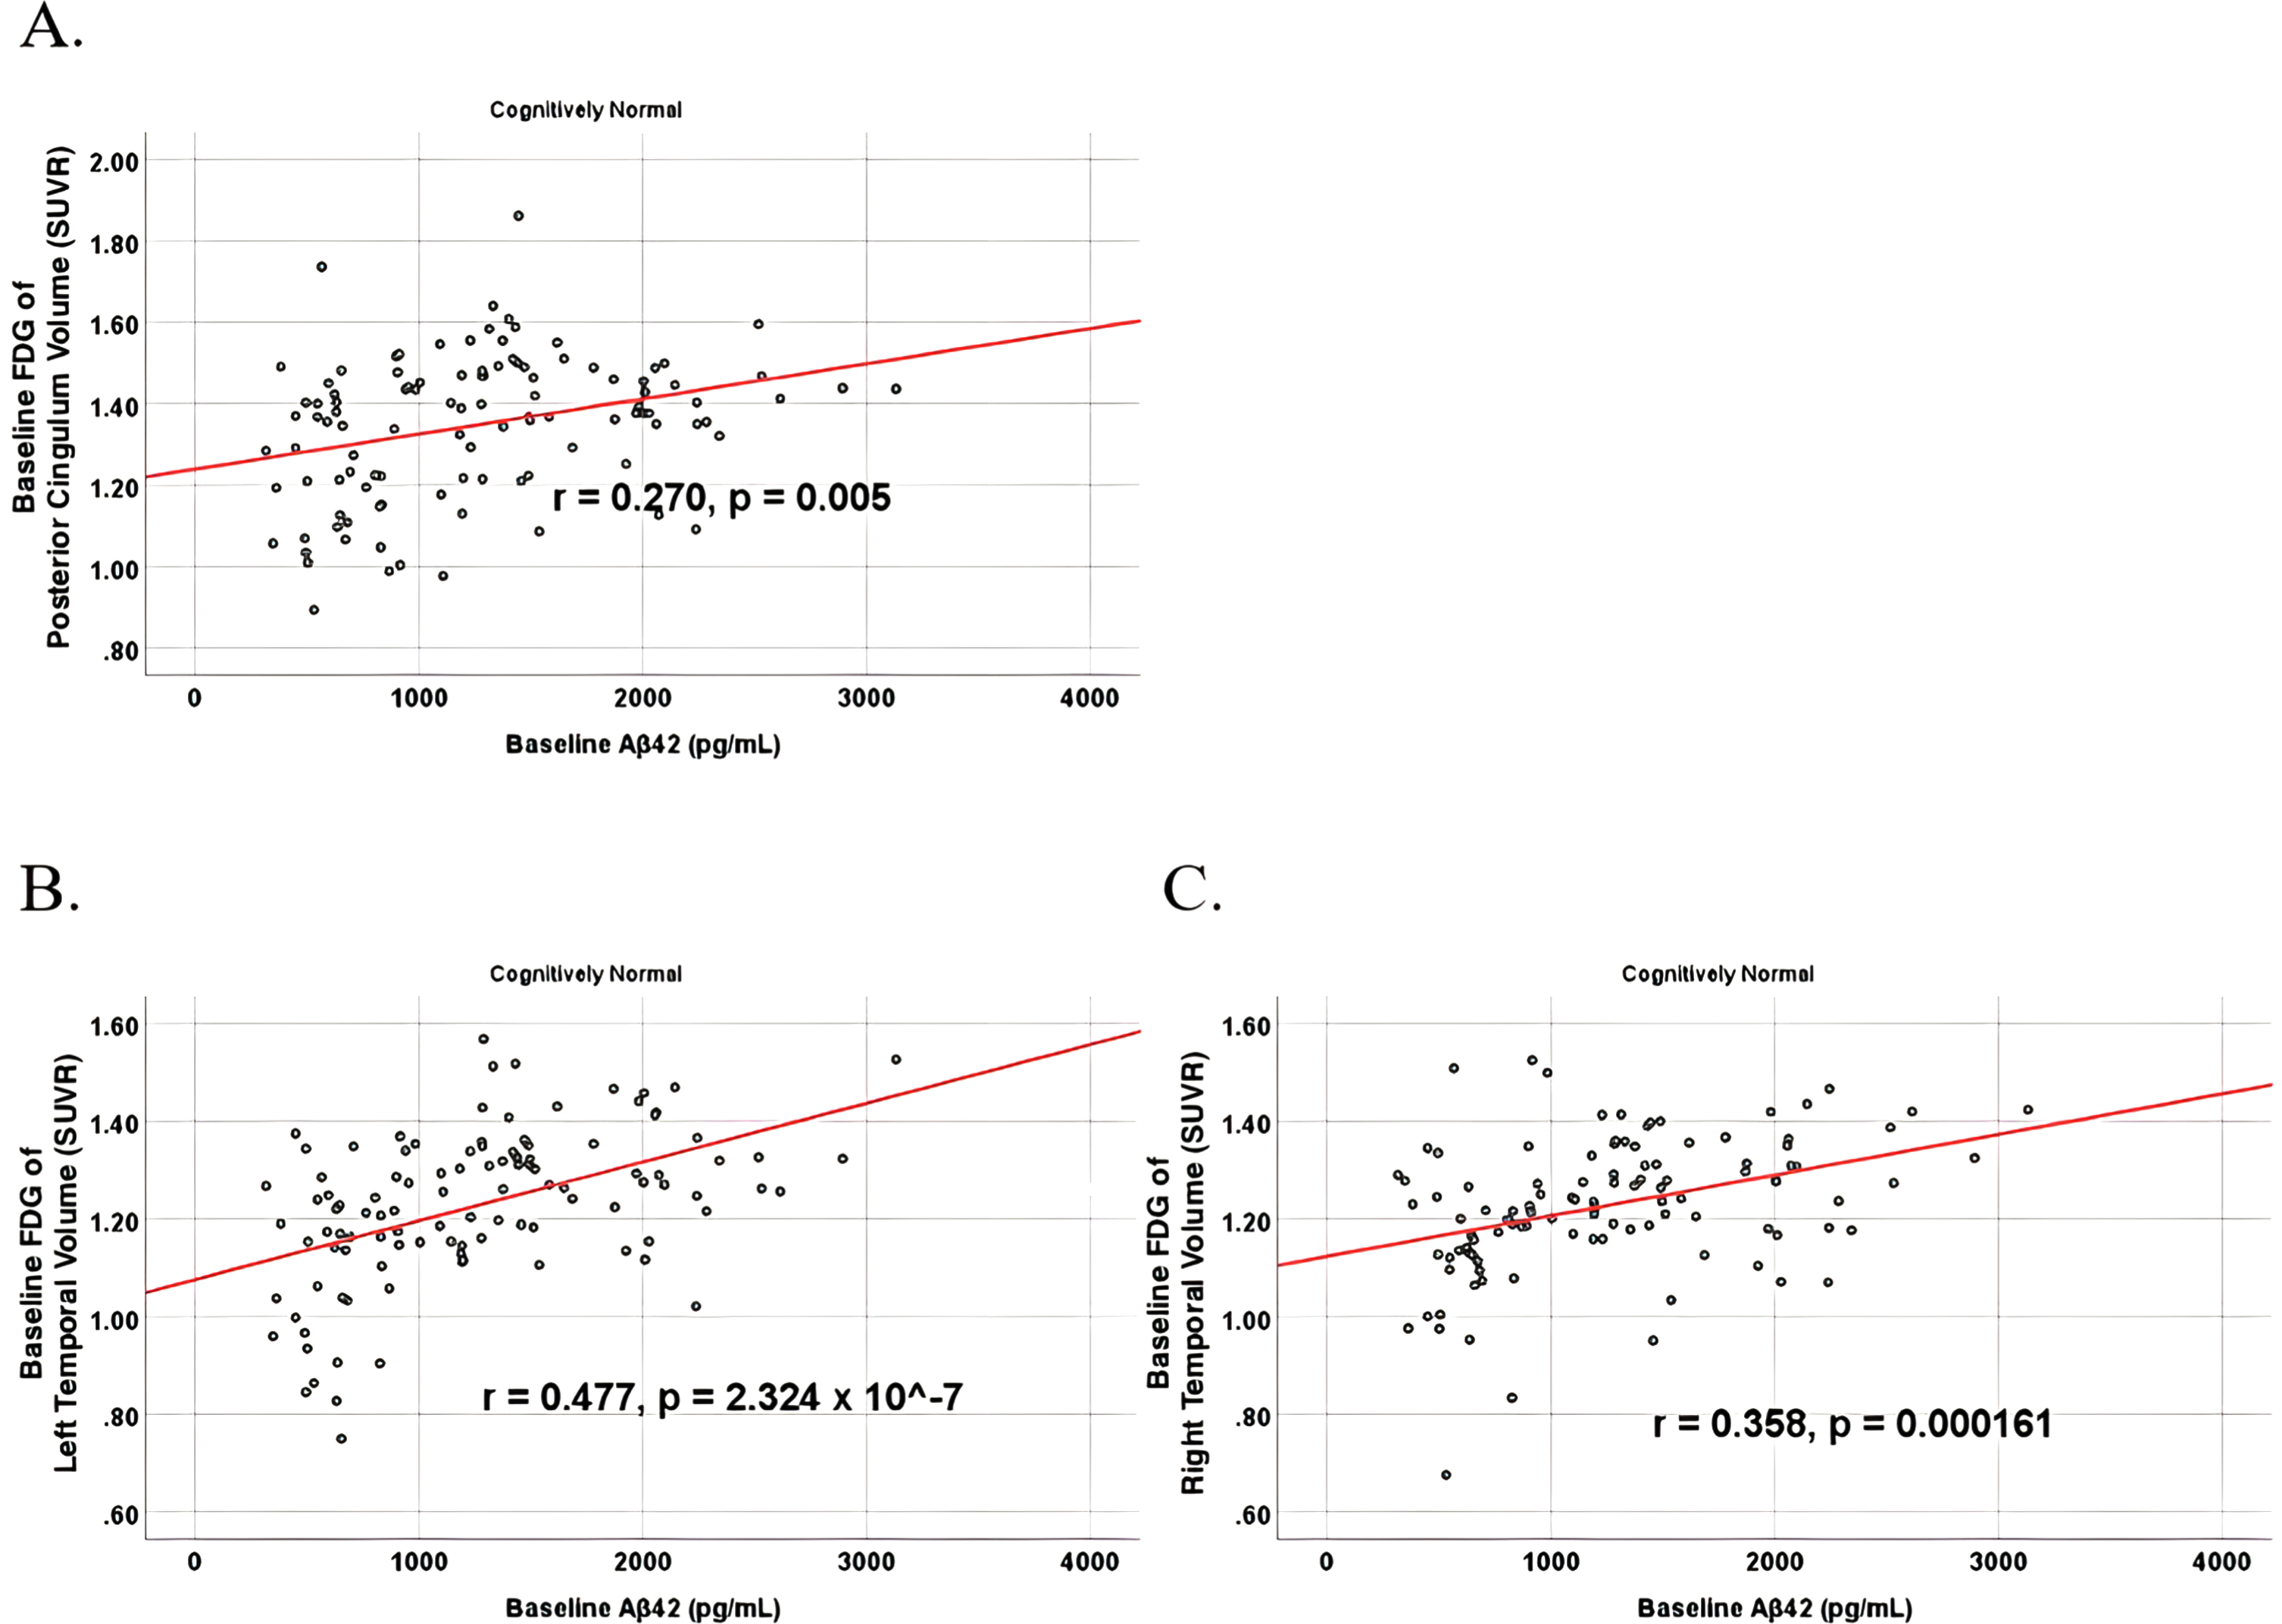
Fig. 9
Partial correlations between baseline Aβ42 and baseline MRI brain volume regions in cognitively unimpaired control participants, corrected for age and education. Scatterplots above are corrected for age and education. A) Aβ42 versus Right Hippocampus (r = 0.301, p = 0.00173). B) Aβ42 versus Left Hippocampus (r = 0.328, p = 0.000587).
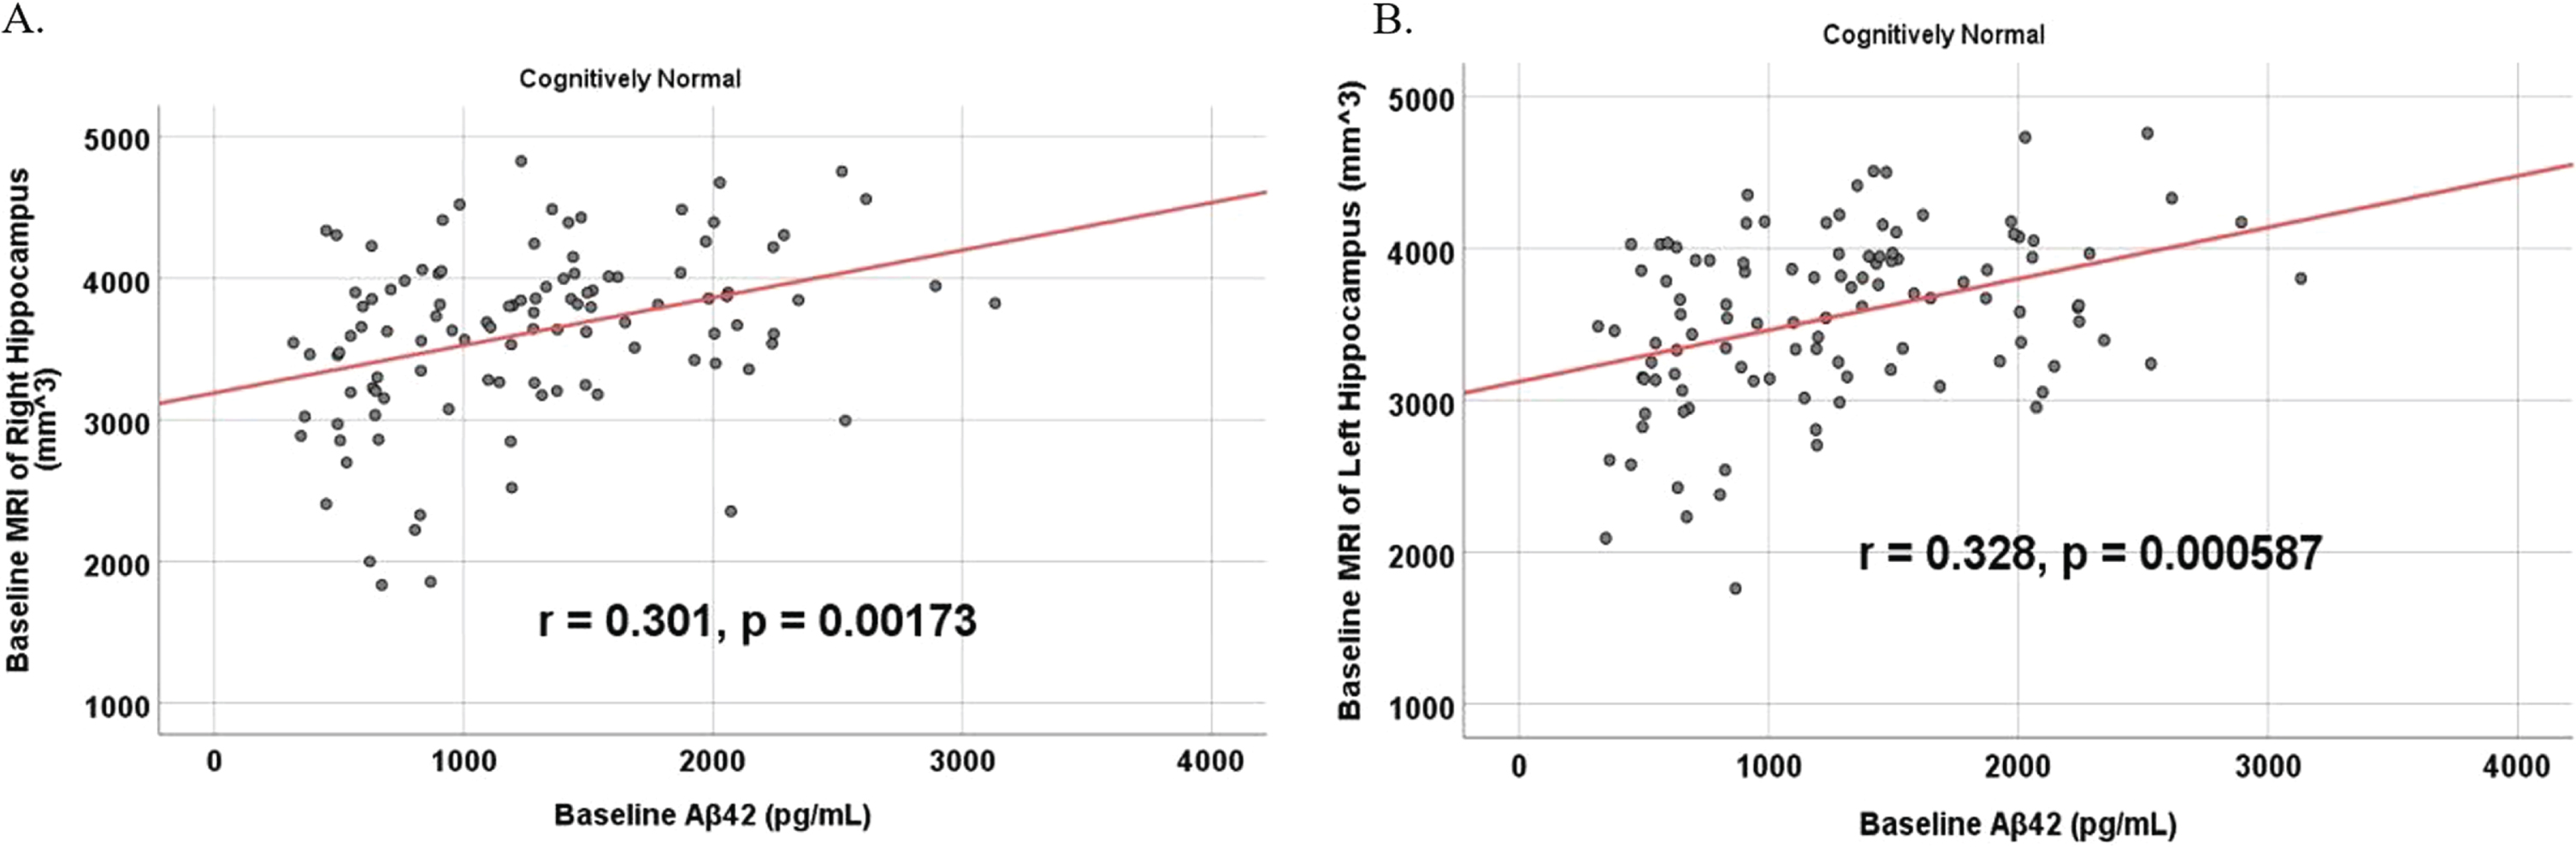
Fig. 10
Partial correlations between baseline Aβ42 and 24 Month FDG brain volume regions in cognitively unimpaired control participants, corrected for age and education. Scatterplots above are corrected for age and education. A) Aβ42 versus Left Temporal (r = 0.446, p = 2.0×10⁻⁶). B) Aβ42 versus Right Temporal (r = 0.380, p = 0.000059).
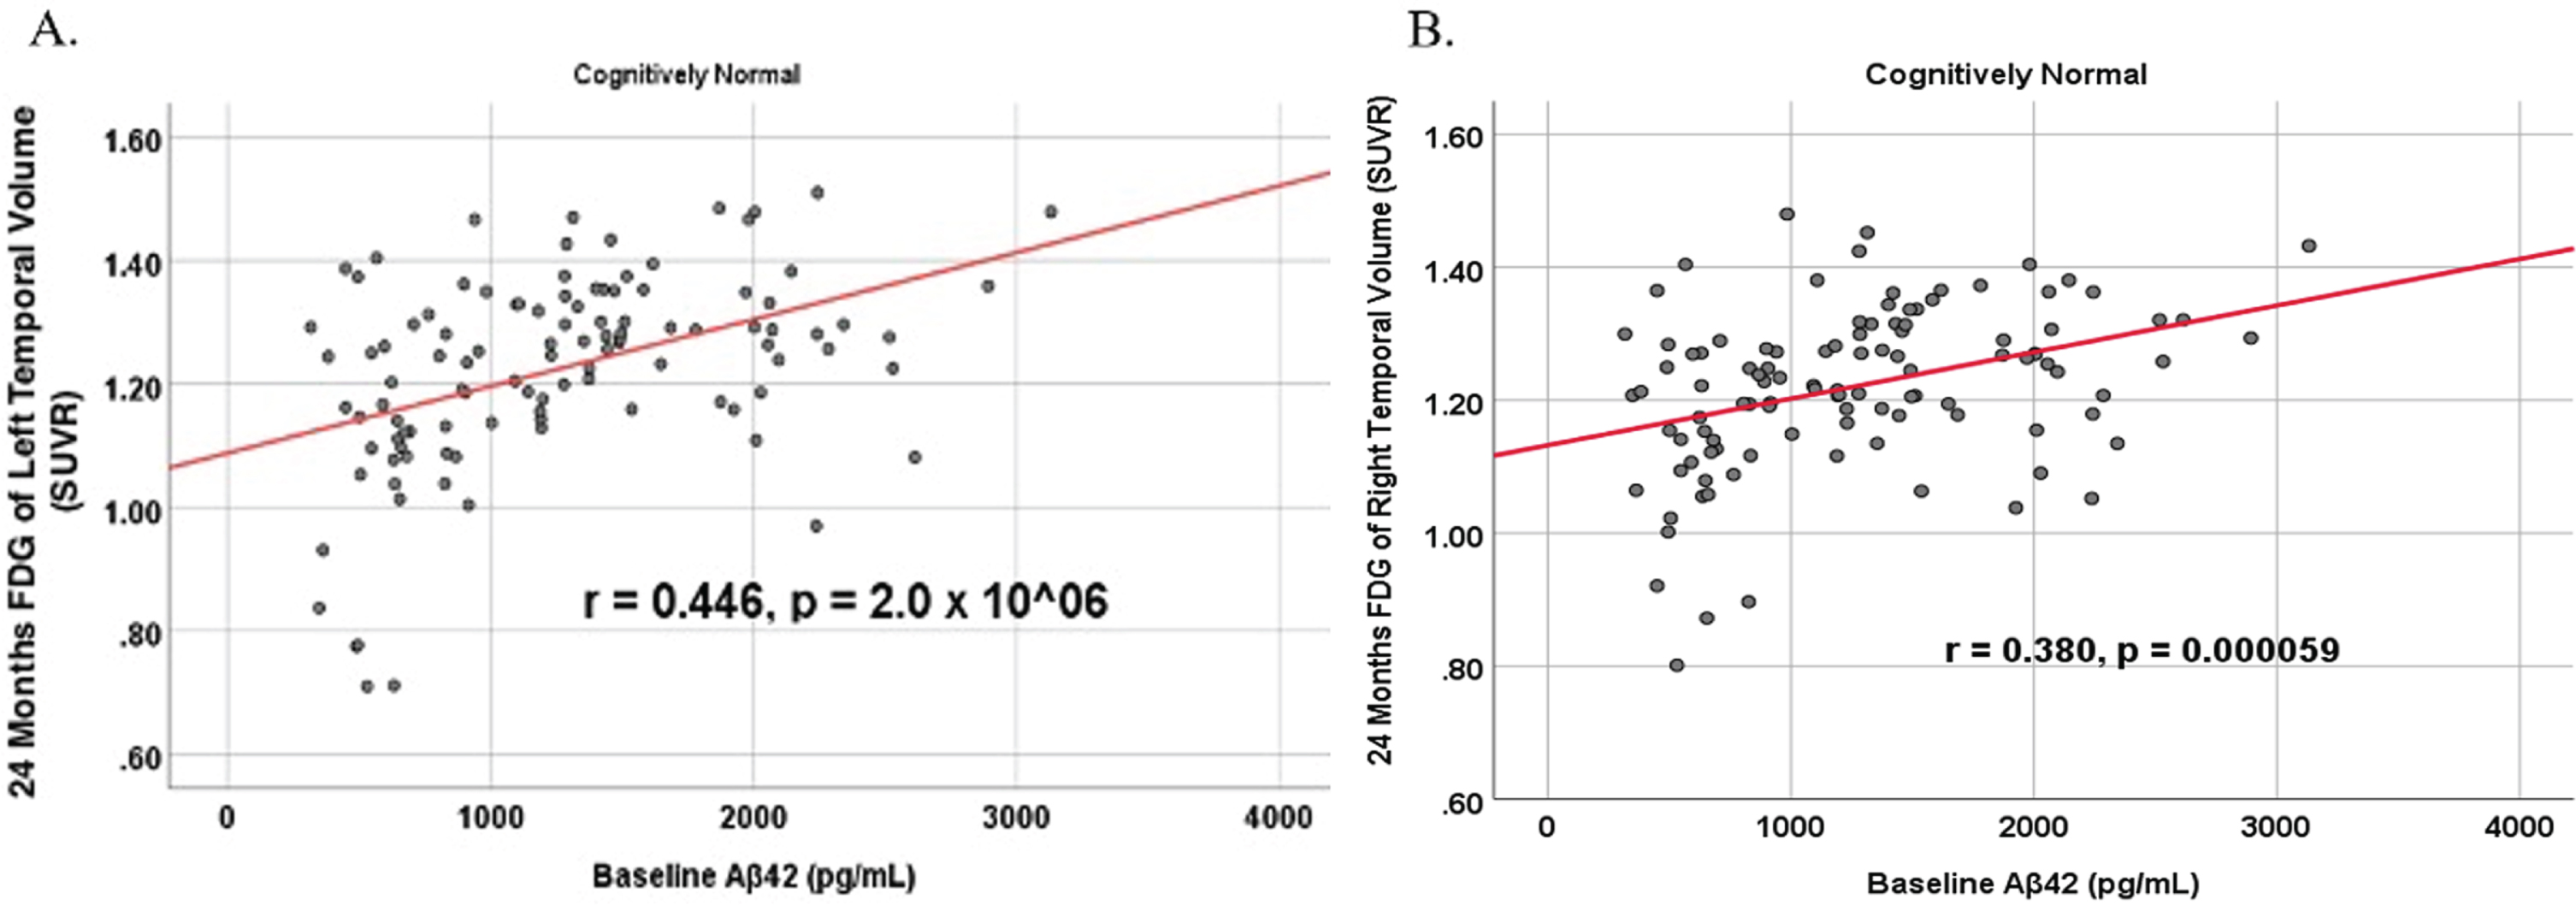
Fig. 11
Partial correlations between baseline Aβ42 and 24 Month MRI brain volume regions in cognitively unimpaired control participants, corrected for age and education. Scatterplots above are corrected for age and education. A) Aβ42 versus Right Hippocampus (r = 0.286, p = 0.003). B) Aβ42 versus Left Hippocampus (r = 0.347, p = 0.000263).
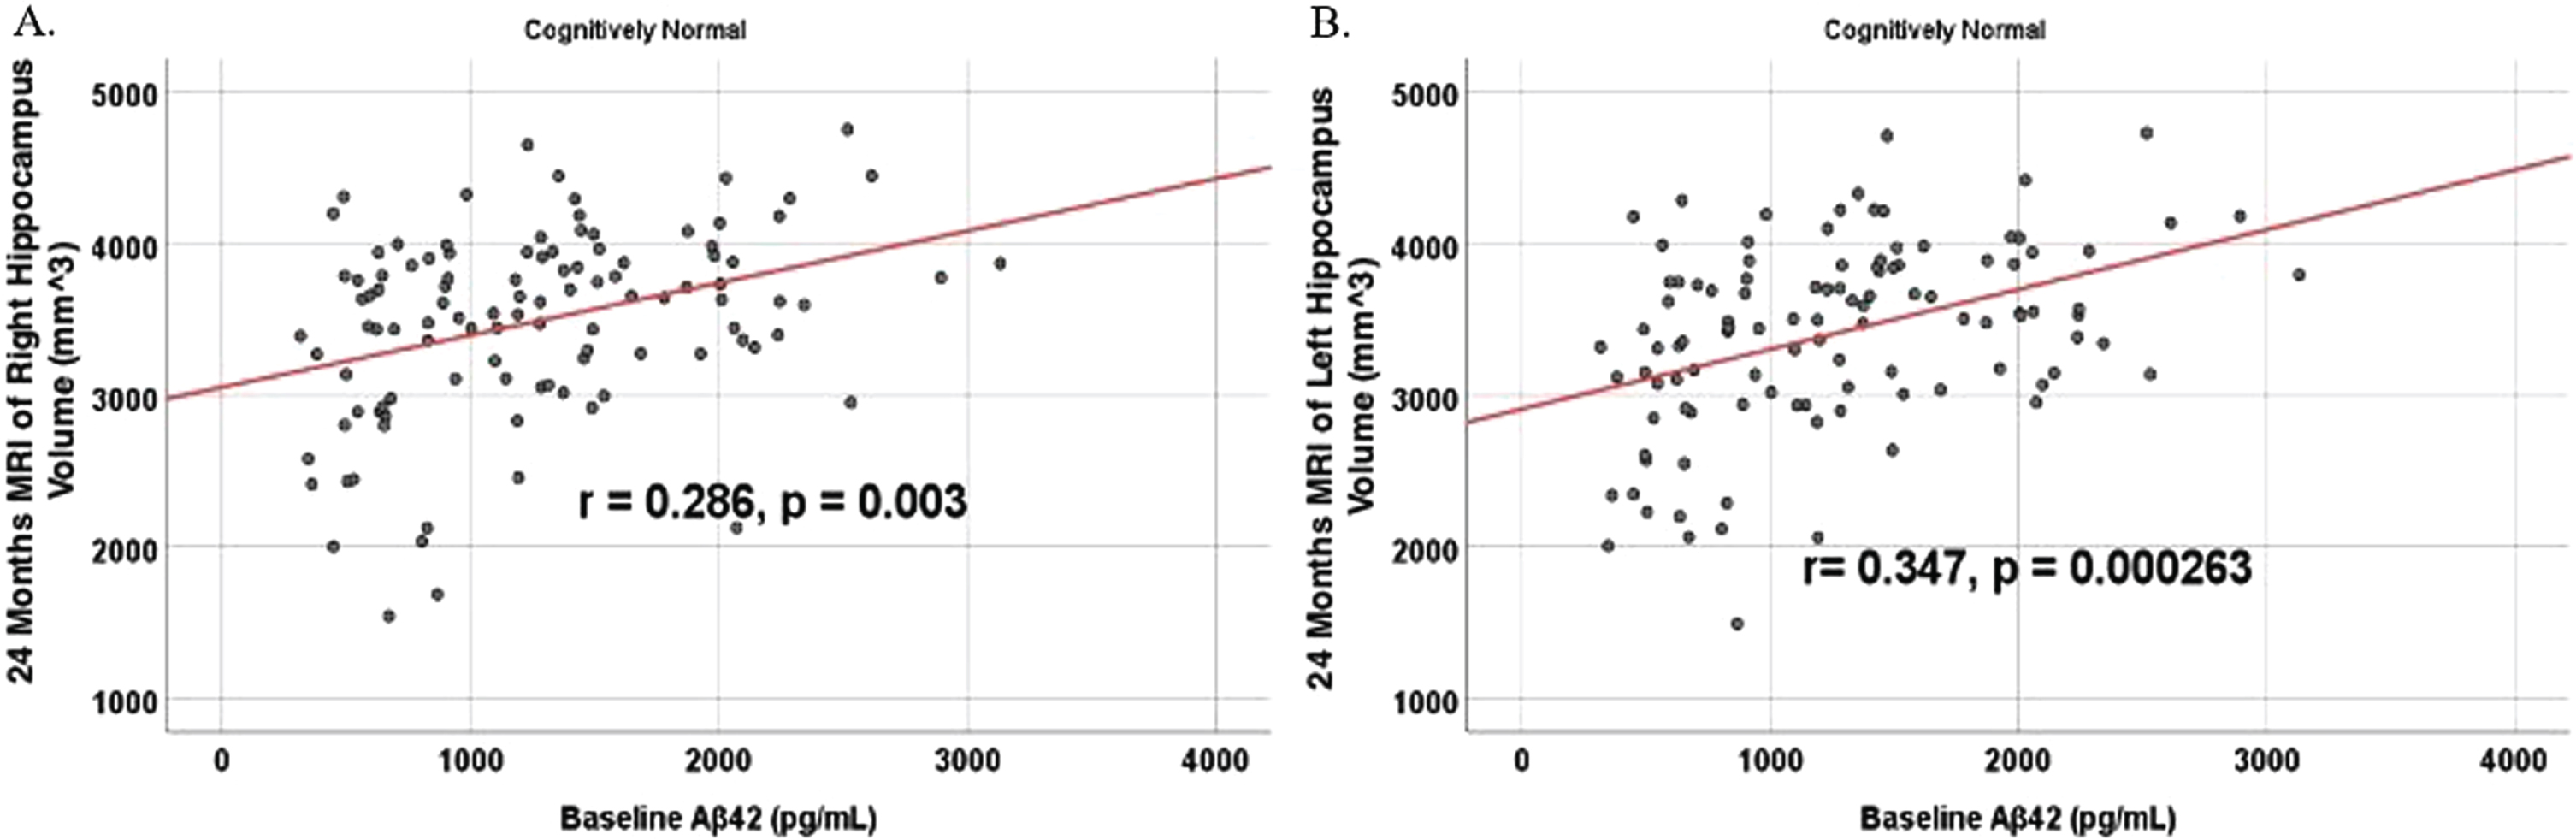
Fig. 12
Partial correlations between baseline Aβ42 and MRI brain regional volume change in cognitively unimpaired control participants, corrected for age and education. Scatterplots above are corrected for age and education. A) Aβ42 versus Right Mesio-Temporal (r = –0.382, p = 0.000052). B) Aβ42 versus Left Mesio-Temporal (r = –0.316, p = 0.000953).
DISCUSSION
The main goal of this study was to evaluate a novel blood constituent, SDMA, against Aβ42 as a biomarker for AD dementia while reevaluating past inconsistent results of Aβ42 as a potential predictor of AD dementia progression, in addition to understanding the relationship between SDMA and Aβ42 with brain hypometabolism and atrophy as well as cognition and function. SDMA is an enantiomer of ADMA which is an inhibitor of nitric oxide synthase and a mediator of vascular endothelial function [36]. As a vascular risk factor, ADMA has been thought to contribute to the development of AD dementia; one study found ADMA plasma concentration level significantly increased and nitric oxide decreased in AD dementia patients [37]. Serum ADMA was increased in chronic kidney disease in parallel with increase of fecal tryptamine [38], which was shown to induce neurodegeneration in cells and animals [39, 40]. Additionally, in a prospective cohort study, serum ADMA concentration predicted worsening cognition in patients and was suggested to be a potential early detection marker for dementia and AD [41].
Based on our data analysis, we do not have sufficient evidence to conclude that either SDMA or Aβ42 as measured with 2D-UPLC tandem mass spectrometry is a reliable predictor of future cognitive status. For SDMA, our study is the first to our knowledge to look at SDMA as a single biomarker measurement for predicting diagnosis of prodromal AD dementia. Previous studies with SDMA included it with other renal biomarkers and have shown promising results discriminating between MCI and AD dementia participants [21, 42], but our study differs in its conclusion. Of note, one of the studies had a much smaller sample size and compared normal controls to MCI and AD dementia patients at the time of their illness; but did not examine baseline SDMA or Aβ42 to predict a future diagnosis [42]. Additionally, the other study found SDMA to be positively associated with AD dementia cognitive status and global AD brain pathology burden; however, SDMA was not analyzed via serum like this investigation but by concentrations in the brain from autopsy donors, and the study also had a smaller sample size [21]. The patients in that study were also significantly older at an average of 90 years compared to both groups in this study. To investigate the prognostic value of SDMA and Aβ42 further, we looked at the relationship between these biomarker levels and cognitive decline and neuroimaging outcome variable within prodromal AD dementia and cognitively unimpaired control subject cohorts. A previous study found higher SDMA, in contrast to our results, was associated with objective and subjective cognitive impairment [25]. However, the SDMA concentrations they found to be associated were much higher than the average SDMA concentration of either this investigation’s control group and prodromal AD dementia group. Nevertheless, we found no correlation between SDMA and MRI, FDG-PET, and neurocognitive scores in either the prodromal AD dementia group or the cognitively unimpaired controls.
While all the results were negative for SDMA, some results did point to an association between lower CSF levels of Aβ42 and cognitive and functional decline. For Aβ42, our results are in support of a review conducted of 26 previous studies that also found insufficient evidence in using plasma and CSF Aβ42 in the diagnosis or even risk assessment of AD dementia as a single measurement [43]. This review and other recent studies are in support of measuring Aβ42 and Aβ40 together for better prediction of amyloid pathology in prodromal AD dementia [7, 44]. In contrast, our results did find levels of CSF Aβ42, and not SDMA, positively correlate with temporal and hippocampal brain volume, brain metabolic activity, and neurocognitive scores in cognitively unimpaired controls but not in prodromal AD dementia participants, which is in line with previous research [45, 46]. In the prodromal AD dementia participants, the absence of a correlation between Aβ42 and the anatomical and functional changes that often typify AD may suggest that these pathologies are independent of one another, or alternatively, that CSF Aβ42 levels might behave differently across the lifespan [47]. For example, a study found higher and lower CSF Aβ42 in patients <75 years was indicative of future MCI/AD dementia, but over the age of 75 years, Aβ42 could not predict MCI/AD dementia [48]. In our investigation, correlations were smaller between Aβ42 and MMSE at 24 months and absent in prodromal AD dementia participants, suggesting a possible plateau effect, perhaps stemming from a more advanced age and/or disease-stage. The association of Aβ42 with markers of neurodegeneration (i.e., MRI and FGD-PET) might also be the result of a plateau effect that is dependent not only upon age but also the disease stage. Although not exactly the same, a similar effect has been reported in the literature in which Aβ42 plateaus as a patient progresses into MCI and then decrease in concentration as they advance into AD dementia [49]. In normal controls, however, there are varying reports on the behavior of Aβ42 with age, with some reports that Aβ42 increases with age consistently and another that it decreases in early life, increases in midlife, and then becomes unassociated with age at later years [50]. For both the normal controls and prodromal AD dementia patient groups, Aβ42 was inversely associated with age.
While Aβ42 may be a poor biomarker as a standalone measure, performance is improved when combined with Aβ40 as a ratio, as Aβ42/Aβ40 has proven to be a more precise and reproducible marker for amyloid-positivity [51]. For example, replacing Aβ42 for Aβ42/40 improved the concordance with amyloid PET by 15% in patients with MCI [52]. Apart from amyloid-positivity, studies have also found better diagnostic performance of AD dementia utilizing Aβ42/40 compared to Aβ42 alone [53, 54]. Altogether, based on prior reports pointing to the usefulness of Aβ42 as a standalone measure and its even more promising role as part of the Aβ42/40 index, our results suggest consideration of this ratio in future studies, as well as alternative explanations of our otherwise negative findings [3, 4]. For this reason, we explore the role of a multiplicity of potentially limiting and confounding factors.
Sample size
Another potential limitation to our study is the sample size. Although several studies of anti-amyloid therapies comprise smaller sample sizes [55], it is worth mentioning that positive findings have been published in studies with sample sizes larger than ours in regards to Aβ42 [53, 56–59]. However, this study is currently believed to be the largest in regards to assessing SDMA as a predictor of AD dementia, though there are very few select investigations of its utility in dementia. Future investigations of larger sample sizes are therefore encouraged in order to support the generalization of these results for both SDMA and Aβ42.
Comorbidities
Hepatic, renal, and neurodegenerative diseases can influence biomarker measurements in the older adult population. Biomarkers, such as phosphorylated tau (p-tau), neurofilament light chain, and total tau, can elevate by 2 to 4 folds in individuals with cirrhosis and show correlations with creatinine levels [60]. The liver makes albumin and filters proteins from blood, so cirrhosis may alter biomarker binding, especially sticky Aβ, and reduce protein elimination, whereas glomerular diseases of the kidneys may result in proteinuria that alters the level of blood protein [61]. Severe liver and kidney diseases, and peripheral neuropathy, such as diabetic neuropathy, can increase the concentration of neurodegenerative biomarkers [62, 63]. Our study has been able to rule out renal and hepatic diseases, with mean lab values within normal limits and no significant differences between the normal control and prodromal AD dementia cohorts. In the normal control cohort, the mean liver enzyme values are ALT 23.33, AST 26.18, and alkaline phosphatase 73.38. Renally, the mean creatinine is 0.88 and urea nitrogen is 19.82. In the prodromal AD dementia cohort, the mean liver enzyme values are ALT 22.63, AST 24.97, and alkaline phosphatase 68.97. Renally, the mean creatinine is 0.85 and urea nitrogen is 18.56. The prevalence of diabetes in the United States in 2019 is 11.3% of the population (37.3 million individuals), and among seniors, 29.2% of those aged 65 and older have diabetes (15.9 million individuals) [64]. One study has demonstrated that in patients with AD dementia, the prevalence of diabetes is higher (35% compared to 18% in control participants) and glucose tolerance is more impaired (46% compared to 24% in control participants) [65]. Although studies often exclude comorbid conditions, investigation of these factors can be valuable in understanding the clinical interpretation of biomarkers.
Race and ethnicity
Our study uses ADNI data, which includes around 10% of African American and Hispanic participants, specifically our data includes 91.67% White participants in the cognitively unimpaired cohort, and 91.78% White participants in the prodromal AD dementia cohort which is a limitation of the data set. Although one ADNI study that controlled covariates did not find differences between racial groups, ADNI itself is not population-based and unable to represent the general population [66]. Future studies should examine a larger and more diverse cohort of participants in a longitudinal study. It is important to ensure that studies are representative of the population in terms of racial and ethnic diversity, as well as social factors that are associated with dementia and pathology outcomes.
Age
Another explanation for why neither biomarker showed a significant difference between cognitively unimpaired control and prodromal AD dementia is the confounding variable age. Age has been documented to be the main predictor of CSF and plasma Aβ42 before, with mixed results in other studies for SDMA [67–69]. Although we adjusted for this variable in our multivariable analysis, we believe further prospective investigations are needed into these biomarkers that control for age using restriction or matching as part of the initial study design. An important limitation in our analysis is that we only collected baseline Aβ42 and SDMA levels. We found that these early baseline values were not significantly capable of predicting AD dementia from cognitively unimpaired controls, though we did not perform longitudinal analyses of constituent changes in relation to changes in brain volume, metabolic activity, and cognitive decline. Additionally, our study’s time frame of 24 months may be too narrow of a window for indicators to develop. Individuals with MCI have a 10 to 15% incidence of developing dementia each year [64]. One-third of individuals with MCI develop dementia due to AD within five years [65]. A timeframe of 24 months may not have been robust enough to see significant distinctions in imaging and biomarkers between cognitively unimpaired controls and prodromal AD dementia participants.
Further studies should be conducted that collect Aβ42 and SDMA levels over time to determine if there is a critical window during which these biomarkers have predictive capability of AD pathogenesis and progression. This approach has been fruitful in the past, with at least one prospective cohort study showing that repeated testing of serum Aβ42 may be useful in the detection of participants at risk for cognitive decline [70].
Socioeconomic
Social determinants of health (SDOH) are factors that can alter an individual’s health and wellbeing, including chronic disease management and comorbidities related to dementia. Important SDOH factors should be examined are financial and housing stability, social support, discrimination, food deserts, education, access to care, and quality of care. Our study was limited by our methods and did not examine most of these relevant SDOH factors. We did not find any studies that examined the relationship between SDOH factors and fluid AD dementia biomarkers. One study noted that neurodegenerative diseases may correlate with homelessness in individuals with challenging socioeconomic and unsupportive environments [71]. ADNI is a multi-site study and enrolls mostly college-educated participants with over 16 years of education. Previous studies have shown an association between higher education and reduced cognitive decline [72]. High education levels can inflate MMSE scores, possibly due to structural and cognitive process differences in individuals with more education. Additionally, ADNI limits study locations by including less diverse zip codes, especially areas with greater disparities and disease burdens. Further, individuals with little or no practical access to care and lack of trust in healthcare providers might go to less preventative and follow-up visits. Many chronic health conditions, including dementia and other comorbidities, may not be diagnosed and treated early on, thereby worsening disease outcomes. Future studies should examine the impact of SDOH factors on AD dementia biomarkers through prospective studies and interviews.
Conclusion
Our results are in support of other investigations concluding that there is insufficient evidence in utilizing baseline CSF Aβ42 in the diagnosis and risk assessment of AD dementia as a single measurement. Nevertheless, our results by no means preclude its use as part of a Aβ42/40 ratio, a use strongly supported by the current literature [3, 4, 51]. We were also unable to find conclusive evidence to support the usage of SDMA as a novel biomarker capable of predicting AD pathogenesis. However, our results suggest that Aβ42 may be associated with neurodegeneration in the earliest phases of the disease when a ceiling or plateau effect of the biomarker appears less likely. Future larger studies should be conducted that collect Aβ42 and/or Aβ42/40 as well as SDMA concentration levels over time to determine if there is a critical window during which these biomarkers may have predictive capability of AD pathogenesis and progression.
ACKNOWLEDGMENTS
The authors would like thank all subject participants who voluntarily contribute themselves to the advancement of medical science.
Data collection and sharing for this project was funded by the Alzheimer’s Disease Neuroimaging Initiative (ADNI) (National Institutes of Health Grant U01 AG024904) and DOD ADNI (Department of Defense award number W81XWH-12-2-0012). ADNI is funded by the National Institute on Aging, the National Institute of Biomedical Imaging and Bioengineering, and through generous contributions from the following: AbbVie, Alzheimer’s Association; Alzheimer’s Drug Discovery Foundation; Araclon Biotech; BioClinica, Inc.; Biogen; Bristol-Myers Squibb Company; CereSpir, Inc.; Cogstate; Eisai Inc.; Elan Pharmaceuticals, Inc.; Eli Lilly and Company; EuroImmun; F. Hoffmann-La Roche Ltd and its affiliated company Genentech, Inc.; Fujirebio; GE Healthcare; IXICO Ltd.; Janssen Alzheimer Immunotherapy Research & Development, LLC.; Johnson & Johnson Pharmaceutical Research & Development LLC.; Lumosity; Lundbeck; Merck & Co., Inc.; Meso Scale Diagnostics, LLC.; NeuroRx Research; Neurotrack Technologies; Novartis Pharmaceuticals Corporation; Pfizer Inc.; Piramal Imaging; Servier; Takeda Pharmaceutical Company; and Transition Therapeutics. The Canadian Institutes of Health Research is providing funds to support ADNI clinical sites in Canada. Private sector contributions are facilitated by the Foundation for the National Institutes of Health (https://www.fnih.org). The grantee organization is the Northern California Institute for Research and Education, and the study is coordinated by the Alzheimer’s Therapeutic Research Institute at the University of Southern California. ADNI data are disseminated by the Laboratory for Neuro Imaging at the University of Southern California.
Data collection and sharing for this project was funded by the Alzheimer’s Disease Metabolomics Consortium (National Institute on Aging R01AG046171, RF1AG051550 and 3U01AG024904-09S4).]
FUNDING
The authors have no funding to report.
CONFLICT OF INTEREST
The authors have no conflicts of interest to report.
DATA AVAILABILITY
The data supporting the findings of this study are available on request from the corresponding author.
SUPPLEMENTARY MATERIAL
[1] The supplementary material is available in the electronic version of this article: https://dx.doi.org/10.3233/ADR-230054.
REFERENCES
[1] | Mehta KM , Yeo GW ((2017) ) Systematic review of dementia prevalence and incidence in United States race/ethnic populations. Alzheimers Dement 13: , 72–83. |
[2] | Masters CL , Simms G , Weinman NA , Multhaup G , McDonald BL , Beyreuther K ((1985) ) Amyloid plaque core protein in Alzheimer disease and Down syndrome. Proc Natl Acad Sci U S A 82: , 4245–4249. |
[3] | Schindler SE , Bollinger JG , Ovod V , Mawuenyega KG , Li Y , Gordon BA , Holtzman DM , Morris JC , Benzinger TLS , Xiong C , Fagan AM , Bateman RJ ((2019) ) High-precision plasma β-amyloid 42/40 predicts current and future brain amyloidosis. Neurology 93: , e1647–e1659. |
[4] | Yan Y , Wang C ((2006) ) Aβ42 is more rigid than Aβ40 at the C terminus: Implications for Aβ aggregation and toxicity. J Mol Biol 364: , 853–862. |
[5] | Lewczuk P , Esselmann H , Otto M , Maler JM , Henkel AW , Henkel MK , Eikenberg O , Antz C , Krause W-R , Reulbach U , Kornhuber J , Wiltfang J ((2004) ) Neurochemical diagnosis of Alzheimer’s dementia by CSF Aβ42, Aβ42/Aβ40 ratio and total tau. Neurobiol Aging 25: , 273–281. |
[6] | Slaets S , Le Bastard N , Martin J-J , Sleegers K , Van Broeckhoven C , De Deyn PP , Engelborghs S ((2013) ) Cerebrospinal fluid Aβ1-40 improves differential dementia diagnosis in patients with intermediate P-tau181P levels. J Alzheimers Dis 36: , 759–767. |
[7] | Korecka M , Figurski MJ , Landau SM , Brylska M , Alexander J , Blennow K , Zetterberg H , Jagust WJ , Trojanowski JQ , Shaw LM ((2020) ) Analytical and clinical performance of amyloid-beta peptides measurements in CSF of ADNIGO/2 participants by an LC–MS/MS reference method. Clin Chem 66: , 587–597. |
[8] | Biogen. Combined FDA and Applicant PCNS Drugs Advisory Committee Briefing Document. https://fda.report/media/143503/PCNS-20201106-CombinedFDABiogenBackgrounder_0.pdf |
[9] | van Dyck CH , Swanson CJ , Aisen P , Bateman RJ , Chen C , Gee M , Kanekiyo M , Li D , Reyderman L , Cohen S , Froelich L , Katayama S , Sabbagh M , Vellas B , Watson D , Dhadda S , Irizarry M , Kramer LD , Iwatsubo T ((2023) ) Lecanemab in early Alzheimer’s disease. N Engl J Med 388: , 9–21. |
[10] | Mahase E ((2023) ) Alzheimer’s disease: Lecanemab gets full FDA approval and black box safety warning. BMJ 382: , p1580. |
[11] | Kamboh MI , Demirci FY , Wang X , Minster RL , Carrasquillo MM , Pankratz VS , Younkin SG , Saykin AJ , Alzheimer’s Disease Neuroimaging Initiative, Jun G , Baldwin C , Logue MW , Buros J , Farrer L , Pericak-Vance MA , Haines JL , Sweet RA , Ganguli M , Feingold E , Dekosky ST , Lopez OL , Barmada MM ((2012) ) Genome-wide association study of Alzheimer’s disease. Transl Psychiatry 2: , e117. |
[12] | Sierksma A , Lu A , Mancuso R , Fattorelli N , Thrupp N , Salta E , Zoco J , Blum D , Buée L , De Strooper B , Fiers M ((2020) ) Novel Alzheimer risk genes determine the microglia response to amyloid-β but not to TAU pathology. EMBO Mol Med 12: , e10606. |
[13] | Holmes C ((2013) ) Review: Systemic inflammation and Alzheimer’s disease. Neuropathol Appl Neurobiol 39: , 51–68. |
[14] | Xie J , Van Hoecke L , Vandenbroucke RE ((2022) ) The impact of systemic inflammation on Alzheimer’s disease pathology. Front Immunol 12: , 796867. |
[15] | Dominy SS , Lynch C , Ermini F , Benedyk M , Marczyk A , Konradi A , Nguyen M , Haditsch U , Raha D , Griffin C , Holsinger LJ , Arastu-Kapur S , Kaba S , Lee A , Ryder MI , Potempa B , Mydel P , Hellvard A , Adamowicz K , Hasturk H , Walker GD , Reynolds EC , Faull RLM , Curtis MA , Dragunow M , Potempa J ((2019) ) Porphyromonas gingivalis in Alzheimer’s disease brains: Evidence for disease causation and treatment with small-molecule inhibitors. Sci Adv 5: , eaau3333. |
[16] | Kinney JW , Bemiller SM , Murtishaw AS , Leisgang AM , Salazar AM , Lamb BT ((2018) ) Inflammation as a central mechanism in Alzheimer’s disease. Alzheimers Dement (N Y) 4: , 575–590. |
[17] | Xu H , Garcia-Ptacek S , Trevisan M , Evans M , Lindholm B , Eriksdotter M , Carrero JJ ((2021) ) Kidney function, kidney function decline, and the risk of dementia in older adults. Neurology 96: , e2956–e2965. |
[18] | Zhang C-Y , He F-F , Su H , Zhang C , Meng X-F ((2020) ) Association between chronic kidney disease and Alzheimer’s disease: An update. Metab Brain Dis 35: , 883–894. |
[19] | Goodman M , Liu S , Silverman D ((2020) ) Potential blood-based biomarkers for predicting change in cognitive, functional and neuroimaging parameters over subsequent years in prodromal Alzheimer’s subjects. J Nucl Med 61: (Supp l), 1564. |
[20] | Schepers E , Barreto DV , Liabeuf S , Glorieux G , Eloot S , Barreto FC , Massy Z , Vanholder R , European Uremic Toxin Work Group (EUTox) ((2011) ) Symmetric dimethylarginine as a proinflammatory agent in chronic kidney disease. Clin J Am Soc Nephrol 6: , 2374–2383. |
[21] | Huo Z , Yu L , Yang J , Zhu Y , Bennett DA , Zhao J ((2020) ) Brain and blood metabolome for Alzheimer’s dementia: Findings from a targeted metabolomics analysis. Neurobiol Aging 86: , 123–133. |
[22] | Yilmaz A , Ugur Z , Bisgin H , Akyol S , Bahado-Singh R , Wilson G , Imam K , Maddens ME , Graham SF ((2020) ) Targeted metabolic profiling of urine highlights a potential biomarker panel for the diagnosis of Alzheimer’s disease and mild cognitive impairment: A pilot study. Metabolites 10: , 357. |
[23] | Chatterjee P , Pedrini S , Stoops E , Goozee K , Villemagne VL , Asih PR , Verberk IMW , Dave P , Taddei K , Sohrabi HR , Zetterberg H , Blennow K , Teunissen CE , Vanderstichele HM , Martins RN ((2021) ) Plasma glial fibrillary acidic protein is elevated in cognitively normal older adults at risk of Alzheimer’s disease. Transl Psychiatry 11: , 27. |
[24] | Kalecký K , German DC , Montillo AA , Bottiglieri T ((2022) ) Targeted metabolomic analysis in Alzheimer’s disease plasma and brain tissue in non-Hispanic whites. J Alzheimers Dis 86: , 1875–1895. |
[25] | McEvoy M , Schofield P , Smith W , Agho K , Mangoni A , Soiza R , Peel R , Attia J ((2014) ) Memory impairment is associated with serum methylarginines in older adults. Curr Alzheimer Res 11: , 97–106. |
[26] | Chen S , Martens-Lobenhoffer J , Weissenborn K , Kielstein JT , Lichtinghagen R , Deb M , Li N , Tryc AB , Goldbecker A , Dong Q , Bode-Böger SM , Worthmann H ((2012) ) Association of dimethylarginines and mediators of inflammation after acute ischemic stroke. J Neuroinflammation 9: , 251. |
[27] | Jack CR , Bennett DA , Blennow K , Carrillo MC , Dunn B , Haeberlein SB , Holtzman DM , Jagust W , Jessen F , Karlawish J , Liu E , Molinuevo JL , Montine T , Phelps C , Rankin KP , Rowe CC , Scheltens P , Siemers E , Snyder HM , Sperling R ((2018) ) NIA-AA Research Framework: Toward a biological definition of Alzheimer’s disease. Alzheimers Dement 14: , 535–562. |
[28] | Mueller SG , Weiner MW , Thal LJ , Petersen RC , Jack C , Jagust W , Trojanowski JQ , Toga AW , Beckett L ((2005) ) The Alzheimer’s Disease Neuroimaging Initiative. Neuroimaging Clin N Am 15: , 869–877. |
[29] | Korecka M , Waligorska T , Figurski M , Toledo JB , Arnold SE , Grossman M , Trojanowski JQ , Shaw LM ((2014) ) Qualification of a surrogate matrix-based absolute quantification method for amyloid-β42 in human cerebrospinal fluid using 2D UPLC-tandem mass spectrometry. J Alzheimers Dis 41: , 441–451. |
[30] | Ito K , Hutmacher MM , Corrigan BW ((2012) ) Modeling of Functional Assessment Questionnaire (FAQ) as continuous bounded data from the ADNI database. J Pharmacokinet Pharmacodyn 39: , 601–618. |
[31] | Creavin ST , Wisniewski S , Noel-Storr AH , Trevelyan CM , Hampton T , Rayment D , Thom VM , Nash KJE , Elhamoui H , Milligan R , Patel AS , Tsivos DV , Wing T , Phillips E , Kellman SM , Shackleton HL , Singleton GF , Neale BE , Watton ME , Cullum S ((2016) ) Mini-Mental State Examination (MMSE) for the detection of dementia in clinically unevaluated people aged 65 and over in community and primary care populations. Cochrane Database Syst Rev 2016: , CD011145. |
[32] | Braak H , Braak E ((1991) ) Neuropathological stageing of Alzheimer-related changes. Acta Neuropathol (Berl) 82: , 239–259. |
[33] | Du AT ((2001) ) Magnetic resonance imaging of the entorhinal cortex and hippocampus in mild cognitive impairment and Alzheimer’s disease. J Neurol Neurosurg Psychiatry 71: , 441–447. |
[34] | Kantarci K , Senjem ML , Lowe VJ , Wiste HJ , Weigand SD , Kemp BJ , Frank AR , Shiung MM , Boeve BF , Knopman DS , Petersen RC , Jack CR ((2010) ) Effects of age on the glucose metabolic changes in mild cognitive impairment. Am J Neuroradiol 31: , 1247–1253. |
[35] | Minoshima S , Giordani B , Berent S , Frey KA , Foster NL , Kuhl DE ((1997) ) Metabolic reduction in the posterior cingulate cortex in very early Alzheimer’s disease. Ann Neurol 42: , 85–94. |
[36] | Vallance P , Leone A , Calver A , Collier J , Moncada S ((1992) ) Accumulation of an endogenous inhibitor of nitric oxide synthesis in chronic renal failure. Lancet 339: , 572–575. |
[37] | Selley ML ((2003) ) Increased concentrations of homocysteine and asymmetric dimethylarginine and decreased concentrations of nitric oxide in the plasma of patients with Alzheimer’s disease. Neurobiol Aging 24: , 903–907. |
[38] | Liu S , Liang S , Liu H , Chen L , Sun L , Wei M , Jiang H , Wang J ((2018) ) Metabolite profiling of feces and serum in hemodialysis patients and the effect of medicinal charcoal tablets. Kidney Blood Press Res 43: , 755–767. |
[39] | Paley EL , Denisova G , Sokolova O , Posternak N , Wang X , Brownell A-L ((2007) ) Tryptamine induces tryptophanyl-tRNA synthetase-mediated neurodegeneration with neurofibrillary tangles in human cell and mouse models. Neuromolecular Med 9: , 55–82. |
[40] | Paley EL ((2011) ) Tryptamine-induced tryptophanyl-tRNA trp deficiency in neurodifferentiation and neurodegeneration interplay: Progenitor activation with neurite growth terminated in Alzheimer’s disease neuronal vesicularization and fragmentation. J Alzheimers Dis 26: , 263–298. |
[41] | Malden DE , Mangoni AA , Woodman RJ , Thies F , McNeil C , Murray AD , Soiza RL ((2020) ) Circulating asymmetric dimethylarginine and cognitive decline: A 4-year follow-up study of the 1936 Aberdeen Birth Cohort. Int J Geriatr Psychiatry 35: , 1181–1188. |
[42] | Lin C , Huang C , Huang K , Lin K , Yen T , Kuo H ((2019) ) A metabolomic approach to identifying biomarkers in blood of Alzheimer’s disease. Ann Clin Transl Neurol 6: , 537–545. |
[43] | Mayeux R , Schupf N ((2011) ) Blood-based biomarkers for Alzheimer’s disease: Plasma Aβ40 and Aβ42, and genetic variants. Neurobiol Aging 32: , S10–S19. |
[44] | Amft M , Ortner M , Eichenlaub U , Goldhardt O , Diehl-Schmid J , Hedderich DM , Yakushev I , Grimmer T ((2022) ) The cerebrospinal fluid biomarker ratio Aβ42/40 identifies amyloid positron emission tomography positivity better than Aβ42 alone in a heterogeneous memory clinic cohort. Alzheimers Res Ther 14: , 60. |
[45] | Sturchio A , Dwivedi AK , Young CB , Malm T , Marsili L , Sharma JS , Mahajan A , Hill EJ , Andaloussi SE , Poston KL , Manfredsson FP , Schneider LS , Ezzat K , Espay AJ ((2021) ) High cerebrospinal amyloid-β 42 is associated with normal cognition in individuals with brain amyloidosis. eClinicalMedicine 38: , 100988. |
[46] | Jansen WJ , Ossenkoppele R , Knol DL , Tijms BM , Scheltens P , Verhey FRJ , Visser PJ , Aalten P , Aarsland D , Alcolea D , Alexander M , Almdahl IS , Arnold SE , Baldeiras I , Barthel H , van Berckel BNM , Bibeau K , Blennow K , Brooks DJ , van Buchem MA , Camus V , Cavedo E , Chen K , Chetelat G , Cohen AD , Drzezga A , Engelborghs S , Fagan AM , Fladby T , Fleisher AS , van der Flier WM , Ford L , Förster S , Fortea J , Foskett N , Frederiksen KS , Freund-Levi Y , Frisoni GB , Froelich L , Gabryelewicz T , Gill KD , Gkatzima O , Gómez-Tortosa E , Gordon MF , Grimmer T , Hampel H , Hausner L , Hellwig S , Herukka S-K , Hildebrandt H , Ishihara L , Ivanoiu A , Jagust WJ , Johannsen P , Kandimalla R , Kapaki E , Klimkowicz-Mrowiec A , Klunk WE , Köhler S , Koglin N , Kornhuber J , Kramberger MG , Van Laere K , Landau SM , Lee DY , de Leon M , Lisetti V , Lleó A , Madsen K , Maier W , Marcusson J , Mattsson N , de Mendonça A , Meulenbroek O , Meyer PT , Mintun MA , Mok V , Molinuevo JL , Møllergård HM , Morris JC , Mroczko B , Van der Mussele S , Na DL , Newberg A , Nordberg A , Nordlund A , Novak GP , Paraskevas GP , Parnetti L , Perera G , Peters O , Popp J , Prabhakar S , Rabinovici GD , Ramakers IHGB , Rami L , Resende de Oliveira C , Rinne JO , Rodrigue KM , Rodríguez-Rodríguez E , Roe CM , Rot U , Rowe CC , Rüther E , Sabri O , Sanchez-Juan P , Santana I , Sarazin M , Schröder J , Schütte C , Seo SW , Soetewey F , Soininen H , Spiru L , Struyfs H , Teunissen CE , Tsolaki M , Vandenberghe R , Verbeek MM , Villemagne VL , Vos SJB , van Waalwijk van Doorn LJC , Waldemar G , Wallin A , Wallin ÅK , Wiltfang J , Wolk DA , Zboch M , Zetterberg H ((2015) ) Prevalence of cerebral amyloid pathology in persons without dementia: A meta-analysis. JAMA 313: , 1924. |
[47] | Knopman DS , Jack CR , Wiste HJ , Weigand SD , Vemuri P , Lowe VJ , Kantarci K , Gunter JL , Senjem ML , Mielke MM , Roberts RO , Boeve BF , Petersen RC ((2013) ) Brain injury biomarkers are not dependent on β-amyloid in normal elderly: Neuronal injury biomarkers. Ann Neurol 73: , 472–480. |
[48] | de Leon MJ , Pirraglia E , Osorio RS , Glodzik L , Saint-Louis L , Kim H-J , Fortea J , Fossati S , Laska E , Siegel C , Butler T , Li Y , Rusinek H , Zetterberg H , Blennow K , the Alzheimer’s Disease Neuroimaging Initiative, the National Alzheimer’s Coordinating Center ((2018) ) The nonlinear relationship between cerebrospinal fluid Aβ42 and tau in preclinical Alzheimer’s disease. PLoS One 13: , e0191240. |
[49] | Chen T-B , Lee Y-J , Lin S-Y , Chen J-P , Hu C-J , Wang P-N , Cheng IH ((2019) ) Plasma Aβ42 and total tau predict cognitive decline in amnestic mild cognitive impairment. Sci Rep 9: , 13984. |
[50] | Zecca C , Tortelli R , Panza F , Arcuti S , Piccininni M , Capozzo R , Barulli MR , Barone R , Cardinali R , Abbrescia D , Seripa D , Brescia V , Logroscino G ((2018) ) Plasma β-amyloid1-42 reference values in cognitively normal subjects. J Neurol Sci 391: , 120–126. |
[51] | Hansson O , Lehmann S , Otto M , Zetterberg H , Lewczuk P ((2019) ) Advantages and disadvantages of the use of the CSF Amyloid β (Aβ) 42/40 ratio in the diagnosis of Alzheimer’s disease. Alzheimers Res Ther 11: , 34. |
[52] | Lewczuk P , Matzen A , Blennow K , Parnetti L , Molinuevo JL , Eusebi P , Kornhuber J , Morris JC , Fagan AM ((2017) ) Cerebrospinal fluid Aβ 42/40 corresponds better than Aβ 42 to amyloid PET in Alzheimer’s disease. J Alzheimers Dis 55: , 813–822. |
[53] | Janelidze S , Zetterberg H , Mattsson N , Palmqvist S , Vanderstichele H , Lindberg O , van Westen D , Stomrud E , Minthon L , Blennow K , Hansson O ((2016) ) CSF Aβ42/Aβ40 and Aβ42/Aβ38 ratios: Better diagnostic markers of Alzheimer disease. Ann Clin Transl Neurol 3: , 154–165. |
[54] | Lewczuk P , Lelental N , Spitzer P , Maler JM , Kornhuber J ((2015) ) Amyloid-β 42/40 cerebrospinal fluid concentration ratio in the diagnostics of Alzheimer’s disease: Validation of two novel assays. J Alzheimers Dis 43: , 183–191. |
[55] | Brookmeyer R , Abdalla N ((2019) ) Design and sample size considerations for Alzheimer’s disease prevention trials using multistate models. Clin Trials Lond Engl 16: , 111–119. |
[56] | Janelidze S , Stomrud E , Palmqvist S , Zetterberg H , van Westen D , Jeromin A , Song L , Hanlon D , Tan Hehir CA , Baker D , Blennow K , Hansson O ((2016) ) Plasma β-amyloid in Alzheimer’s disease and vascular disease. Sci Rep 6: , 26801. |
[57] | Mattsson N , Zetterberg H , Hansson O , Andreasen N , Parnetti L , Jonsson M , Herukka S-K , van der Flier WM , Blankenstein MA , Ewers M , Rich K , Kaiser E , Verbeek M , Tsolaki M , Mulugeta E , Rosén E , Aarsland D , Visser PJ , Schröder J , Marcusson J , de Leon M , Hampel H , Scheltens P , Pirttilä T , Wallin A , Jönhagen ME , Minthon L , Winblad B , Blennow K ((2009) ) CSF biomarkers and incipient Alzheimer disease in patients with mild cognitive impairment. JAMA 302: , 385–393. |
[58] | Cosentino SA , Stern Y , Sokolov E , Scarmeas N , Manly JJ , Tang MX , Schupf N , Mayeux RP ((2010) ) Plasma β-amyloid and cognitive decline. Arch Neurol 67: , 1485–1490. |
[59] | Rembach A , Faux NG , Watt AD , Pertile KK , Rumble RL , Trounson BO , Fowler CJ , Roberts BR , Perez KA , Li Q-X , Laws SM , Taddei K , Rainey-Smith S , Robertson JS , Vandijck M , Vanderstichele H , Barnham KJ , Ellis KA , Szoeke C , Macaulay L , Rowe CC , Villemagne VL , Ames D , Martins RN , Bush AI , Masters CL , AIBL research group ((2014) ) Changes in plasma amyloid beta in a longitudinal study of aging and Alzheimer’s disease. Alzheimers Dement 10: , 53–61. |
[60] | Berry K , Asken BM , Grab JD , Chan B , Lario Lago A , Wong R , Seetharaman S , LaHue SC , Possin KL , Rojas JC , Kramer JH , Boxer AL , Lai JC , VandeVrede L ((2022) ) Hepatic and renal function impact concentrations of plasma biomarkers of neuropathology. Alzheimers Dement (Amst) 14: , e12321. |
[61] | Bendlin BB , Zetterberg H ((2022) ) The iterative process of fluid biomarker development and validation in Alzheimer’s disease. Alzheimers Dement (Amst) 14: , e12341. |
[62] | Rose CF , Amodio P , Bajaj JS , Dhiman RK , Montagnese S , Taylor-Robinson SD , Vilstrup H , Jalan R ((2020) ) Hepatic encephalopathy: Novel insights into classification, pathophysiology and therapy. J Hepatol 73: , 1526–1547. |
[63] | Viggiano D , Wagner CA , Martino G , Nedergaard M , Zoccali C , Unwin R , Capasso G ((2020) ) Mechanisms of cognitive dysfunction in CKD. Nat Rev Nephrol 16: , 452–469. |
[64] | Petersen RC , Lopez O , Armstrong MJ , Getchius TSD , Ganguli M , Gloss D , Gronseth GS , Marson D , Pringsheim T , Day GS , Sager M , Stevens J , Rae-Grant A ((2018) ) Practice guideline update summary: Mild cognitive impairment. Neurology 90: , 126–135. |
[65] | Ward A , Tardiff S , Dye C , Arrighi HM ((2013) ) Rate of conversion from prodromal Alzheimer’s disease to Alzheimer’s dementia: A systematic review of the literature. Dement Geriatr Cogn Disord Extra 3: , 320–332. |
[66] | Windon C , Iaccarino L , Mundada N , Allen I , Boxer AL , Byrd D , Rivera-Mindt M , Rabinovici GD , ADNI ((2022) ) Comparison of plasma and CSF biomarkers across ethnoracial groups in the ADNI. Alzheimers Dement (Amst) 14: , e12315. |
[67] | Fleszar MG , Wiśniewski J , Zboch M , Diakowska D , Gamian A , Krzystek-Korpacka M ((2019) ) Targeted metabolomic analysis of nitric oxide/L-arginine pathway metabolites in dementia: Association with pathology, severity, and structural brain changes. Sci Rep 9: , 13764. |
[68] | Kielstein JT , Salpeter SR , Bode-Boeger SM , Cooke JP , Fliser D ((2006) ) Symmetric dimethylarginine (SDMA) as endogenous marker of renal function—a meta-analysis. Nephrol Dial Transplant 21: , 2446–2451. |
[69] | Zecca C , Pasculli G , Tortelli R , Dell’Abate MT , Capozzo R , Barulli MR , Barone R , Accogli M , Arima S , Pollice A , Brescia V , Logroscino G ((2021) ) The role of age on beta-amyloid1–42 plasma levels in healthy subjects. Front Aging Neurosci 13: , 698571. |
[70] | Seppala TT , Herukka S-K , Hanninen T , Tervo S , Hallikainen M , Soininen H , Pirttila T ((2010) ) Plasma Abeta42 and Abeta40 as markers of cognitive change in follow-up: A prospective, longitudinal, population-based cohort study. J Neurol Neurosurg Psychiatry 81: , 1123–1127. |
[71] | Piña-Escudero SD , López L , Sriram S , Longoria Ibarrola EM , Miller B , Lanata S ((2021) ) Neurodegenerative disease and the experience of homelessness. Front Neurol 11: , 562218. |
[72] | Taylor CA , Bouldin ED , McGuire LC ((2018) ) Subjective cognitive decline among adults aged ≥45 years — United States, 2015–2016. MMWR Morb Mortal Wkly Rep 67: , 753–757. |


