
Linking Cognitive Impairment with Amyloid-β Accumulation in Alzheimer’s Disease: Insights from Behavioral Tests and FTIR Spectroscopy
Abstract
Background:
Alzheimer’s disease (AD) is a neurodegenerative disorder that progresses over time. Fourier Transform Infrared Spectroscopy (FTIR) analysis gives identification of the main metabolic changes that happen during neurodegeneration, by monitoring biochemical and molecular structure alterations that can help in AD diagnosis or treatment approach.
Objective:
The aim of the present work is to assess AD hallmarks in molecular structure of retina and monitor accumulation of amyloid beta42(Aβ42) in brain and retina during disease progression.
Methods:
AD induced in rats by Aluminum Chloride (AlCl3). Retinal molecular structure during disease progression for 2,4,6 and 8 weeks was assessed by Fourier-transform infrared spectroscopy (FTIR) and the incidence of the disease was confirmed by a behavioural assessment; the Morris Water Maze test. Aβ42 levels in the brain and retina were also measured.
Results:
The results indicated that cognitive impairment starting from 6 weeks of AlCl3 administration. Retinal concentration of Aβ42 was significant increase (p < 0.05) from 2 weeks that precedes the observed increase of Aβ42 in the brain which appeared after 4 weeks of AlCl3 administration. Multivariate principal component analysis discovers that the variance noticed in the infrared spectra due to AD condition and it is time dependent for progression of the disease.
Conclusions:
The accumulation of Aβ42 is a sensitive early biomarker in retina for AD. FTIR analysis of the retina revealed changes in hydrogen bond formation or destruction, alterations in lipid chain length and branching accompanied by depleted lipid content and carbonization, as well as degeneration of the retinal tissue due to AD.
INTRODUCTION
With the continuous upsurge in life expectancy, the incidence of dementia has become a significant public health concern. According to recent estimates, the incidence of dementia has surged to approximately 55 million individuals globally [1]. This growing prevalence of dementia highlights an urgent need for innovative approaches towards prevention and treatment. Among the elderly population, Alzheimer’s disease (AD) is a neurodegenerative disorder that not only remains incurable, but also ranks as the leading cause of all types of dementia, with approximately 60–80% of dementia cases being classified as AD [2].
Over the past 25 years, translational studies in various fields such as human neuropathology and experimental animal, genetics, and biomarker analysis have substantiated a hypothetical model that describe the AD. This model proposes that amyloid-β (Aβ) species accumulate in the brain initially leading to plaque formation, followed by tau protein spreading which ultimately results in neuronal loss and clinical symptoms after a lag of up to three decades [3]. Theses clinical symptoms include cognitive impairment, progressive memory loss, mood swings, and deterioration in executive function [4].
Amyloid neuritic plaque, the major hallmark of AD pathology consists of misfolded Aβ proteins that aggregate and form extracellular deposits in the brain [5]. These deposits disrupt neural communication, lead to neuroinflammation and oxidative stress, and ultimately result in cognitive decline [6]. Aβ accumulation in the brain results from an imbalance between Aβ production and clearance [7]. Aβ is produced by sequential proteolysis of transmembrane amyloid-β protein precursor (AβPP) by β-secretase followed by γ-secretase. The most abundant type of Aβ in AD pathology is the Aβ42, that characterized by its higher propensity to aggregate into β sheet conformations in the form of higher-order oligomers, protofibrils, fibrils, and plaques, which are detectable in AD brain [8].
The detrimental impact of environmental heavy metals on brain development is widely recognized. Numerous research studies have established a strong correlation between these toxic agents and serious neurodegenerative conditions like AD [9, 10]. As a plentiful element on the earth surface, aluminum is the most potent neurotoxic metal among all heavy environmental pollutants. It has been extensively studied and identified as an agent that plays a crucial role in triggering and exacerbating debilitating neurological disorders like AD.
In the aluminum chloride-common animal model for studying the pathophysiology of AD and cognitive decline, numerous investigations have demonstrated that after 28 days of administration amyloid plaques deposition and cerebral amyloid angiopathy, neurofibrillary tangles, glial responses, and synaptic degeneration were noticed [11]. Also, after 42 days of AlCl3 treatment, behavioral alteration in albino Wistar rats was detected by Morris water maze (MWM) test [12].
Infrared Fourier-transform spectroscopy (FTIR) is a non-invasive method for examining the chemical constitution of living tissues. With the aid of this method, it is possible to investigate the molecular alterations connected to numerous medical disorders, such as retinal degeneration. Infrared radiation is absorbed by the sample using FTIR spectroscopy, which yields spectra that reveal details about the different kinds of chemical bonds that are present in the sample. FTIR spectroscopy has been used to examine changes in the molecular structure of the retina in animal models of retina disorder. In particular, lipid, protein, and nucleic acid levels in the retina of rats with induced retinal degeneration have been tracked using FTIR spectroscopy.
Researchers are looking for distinctive spectral patterns or markers that can distinguish people with AD from healthy people and AD diagnosis by examining the infrared spectra of biological samples. The FTIR spectra of cerebrospinal fluid from AD patients at various phases revealed that peak locations for protein, deoxyribonucleic acid (DNA), phospholipid, and lipid vibrations were different from those of control participants [13]. According to Correia et al. [14], plasma samples from people with cognitive impairment have greater concentrations of saturated lipids, carboxylic acids, reactive carbonyls, and altered wavenumbers of amide II. In the brain of a mouse model of AD, there was a noticeably low level of unsaturated lipid and alterations in the CH2 stretching vibration spectrum that suggest changes in lipid order [15]. We tested the hypothesis that FTIR data can provide significant information not only regarding the protein’s conformation, folding, stability, and interaction but also the lipid structure, lipid oxidation, lipid membrane fluidity, and changes in acyl chain order within the retina to provide a new explanation for the disease and suggest an outlook for additional research into the prevention, diagnosis, and treatment of AD.
As the eye is an expansion of the central nervous system (CNS), checking on changes within the eye’s tissues may lead to creating an arrangement of non-invasive, differential symptomatic tests for AD that can be advance connected to other diseases. Recently, there are challenges in diagnosing AD especially ophthalmic biomarkers and eye can be a mirror to numerous neural and systemic disarranges [16]. The only optically visible nerve tissue is the retina, so, the aim of the present work to evaluate the characteristic molecular structure changes of in retina due to AD induced by AlCl3 in rats using FTIR and confirming the incidence of the disease by behavior easement MWM test. Also estimated of Aβ42 in brain and retina was done.
MATERIALS AND METHODS
Chemicals
All of the chemicals utilized in our experiments were obtained from Sigma-Aldrich Company (St. Louis, MO, USA). The BCA protein quantitative kit (QuantiProTM BCA Assay Kit) were procured from Sigma-Aldrich Company and the rat Aβ42 Elisa kits were procured from Novus Biologicals (Littleton, CO, USA).
Animals and ethical considerations
A total of 50 male albino Wistar rats weighing approximately 200±50 grams were utilized for the experimental procedure. The animals were obtained from the animal house facility at the Research Institute of Ophthalmology (RIO), Giza, Egypt. The ARRIVE standards, local research committee recommendations, and Association for Research in Vision and Ophthalmology (ARVO) rules were all followed. During the experimental periods, animals were housed in standard polycarbonates cage under controlled standard environmental conditions of humidity (60±10%), room temperature (25±2°C) and natural day/night cycle (12:12 h), with free access to chewing food and water ad libitum. Before one week of the experiment’s onset, rats were acclimated to laboratory conditions.
Experimental design
After the acclimatization period, animals were randomly allocated to 5 groups with 10 rats assigned for each group. Rats in first group were orally received saline with the gavage tube and served as control, while rats in the other 4 groups were orally received AlCl3 (100 mg/kg b. wt.) with the gavage tube for 2, 4, 6, and 8 consecutive weeks, respectively [17].
Experimental procedure
Morris water maze test
Twenty-four hours after the last administration of AlCl3, rats were screened for spatial learning and memory retention using the MWM test in accordance with Sayed et al. [18]. A circular pool with height (60 cm) and diameter (150 cm), divided into 4 equal quadrants, was utilized in this present study. The pool was half filled with water and kept under constant temperature (25±2°C). A platform (9 cm diameter) was submerged inside the target quadrant of this pool, 2 cm below the water surface, and was situated at a fixed location throughout the test. The water was rendered opaque with a non-toxic, water-soluble blue pigment. During the acquisition phase, animals performed 4 daily training sessions lasting 120 s each for 4 days in a row. In each acquisition trial, animals were allowed to swim and freely explore with the aim to find the platform within the target quadrant. If the rat found the submerged platform within 120 s, it was kept there for 10 s then removed; meanwhile if an animal failed to find the submerged platform, it was gently guided and positioned on the surface of the platform for 30 s. Both the escape latency time and path length were measured by calculating the average of total time and total distance taken in all trials of each day of the acquisition phase to find the submerged platform and was assessed as the indicator for spatial learning. On day five, the rats underwent a probe test in which the platform was removed, and each rat had 60 s to explore the pool. The duration of time spent by every animal, distance covered within the target quadrant, as well as number of entries were all recorded and assessed as an indicator for memory. The procedure was video-recorded and subsequently analyzed utilizing ANY-maze software (version 7.1, Stoelting Co, IL, USA).
Preparation of tissue and sample collection
At the end of MWM test for each experimental group, rats were sacrificed by decapitation and both eyeball and brain samples were rapidly excised and rinsed with an ice-cold (4°C) saline (0.15 M NaCl) solution. Retina and hippocampus were rapidly dissected in ice-cold (4°C) phosphate-buffered saline (PBS). The wet weight of all dissected tissues; retina and hippocampus were measured and then stored at –80°C until the subsequent investigations were performed.
Quantification of Aβ42 protein
To evaluate the Aβ42 levels in retina and hippocampus tissues, the collected retinas and hemispheres from each experimental group were homogenized in RIPA lysis puffer (50 mM Tris-HCl pH 7.4, 150 mM NaCl, 0.5% sodium deoxycholate, 0.1% SDS, 0.5% Triton X-100 and 0.5% NP 40) with Cocktail protease inhibitor. Then all homogenized samples were centrifuged at 14,000× g for 30 min at 4°C. The resultant supernatant was separated and subjected to assay for the protein concentration using bicinchoninic acid (QuantiProTM BCA, Cat No: QPBCA, Sigma-Aldrich, USA) assay kit.
The status of AD biomarker Aβ42 in retina and hippocampus of normal rats and rats orally administrated with AlCl3 for 2, 4, 6, and 8 weeks, were investigated using the research rat-specific ELISA kits (Cat No: NBP2-69916, Novusbio, USA) uses the Sandwich-ELISA principle. The ordered instructions demonstrated by the manufacturer’s manual were followed for the micro-plate preparation before reading. The absorbance of the optical density was determined with Elisa reader set to 450 nm. The concentrations of Aβ42 in retina and hippocampus were expressed in pg/mg protein.
FTIR measurements
FTIR spectroscopic measurements and analysis were employed in this existent study to investigate the eventuated deterioration in the molecular structure of the retinal tissues after AlCl3 exposure for different periods (2, 4, 6, and 8 weeks) compared to normal. The lyophilized retinal tissues (2 mg) were compacted with KBr powder (98 mg) using the pressing tool supplied by the company of FTIR spectrophotometer (Thermo Fisher Scientific Inc., Madison, WI, USA). The resultant compact transparent tablets, which characterized with homogenous and uniform thickness, is utilized to investigate the characteristic IR spectrum of the examined samples with FTIR spectrometer (Nicolet iS5 FT-IR Spectrometer, Thermo Fisher Scientific Inc.). In order to improve the signal-to-noise ratio, the utilized FTIR spectrometer was that was connected with a constant supply of dry nitrogen gas. This effectively eliminated any potential influence from water vapor or ambient carbon dioxide (CO2). We obtained one hundred interferograms at 2 cm–1 spectral resolution for each sample. In order to optimize the effectiveness of Savitzky-Golay method’s Fourier transform, it was necessary to first carry out coaddition, baseline adjustment and flattening on these interferograms. By using OriginPro9 software (Origin Lab Corporation, Northampton, MA, USA), the average spectra of each experimental group that collected from the individual spectrum of each sample within the group was calculated [19].
Statistical analysis
In our experimental studies, all values of the obtained results were demonstrated as mean±SD. The statistical evaluations for the resultant data of Elisa method were assessed by One-way analysis of variance (ANOVA) with subsequent Tukey’s post-hoc analysis which performed to evaluate any significance variations between all examined groups. In the behavioral assessment, the parameters of the acquisition phase (the escape latency and the path length) were statistically analyzed with two-way ANOVA test, while the probe trial parameters (time spent in the target quadrant and distance swam in the target quadrant) were statistically analyzed with one-way ANOVA followed by Tukey’s post-hoc analysis. In contrary, the measured values of the entries number to the target quadrants were statistically analyzed using Kruskal-Wallis test and followed by Dunn’s analysis. The statistical analyses were conducted using GraphPad Prism version 8 software. For all statistical analysis, the variances were considered to be statistically significant at p-values < 0.05. Additionally, the discrimination between the FTIR spectra was evaluated through multivariate analysis and principal component analysis (PCA) using OriginPro software (2015).
RESULTS
Morris water maze test
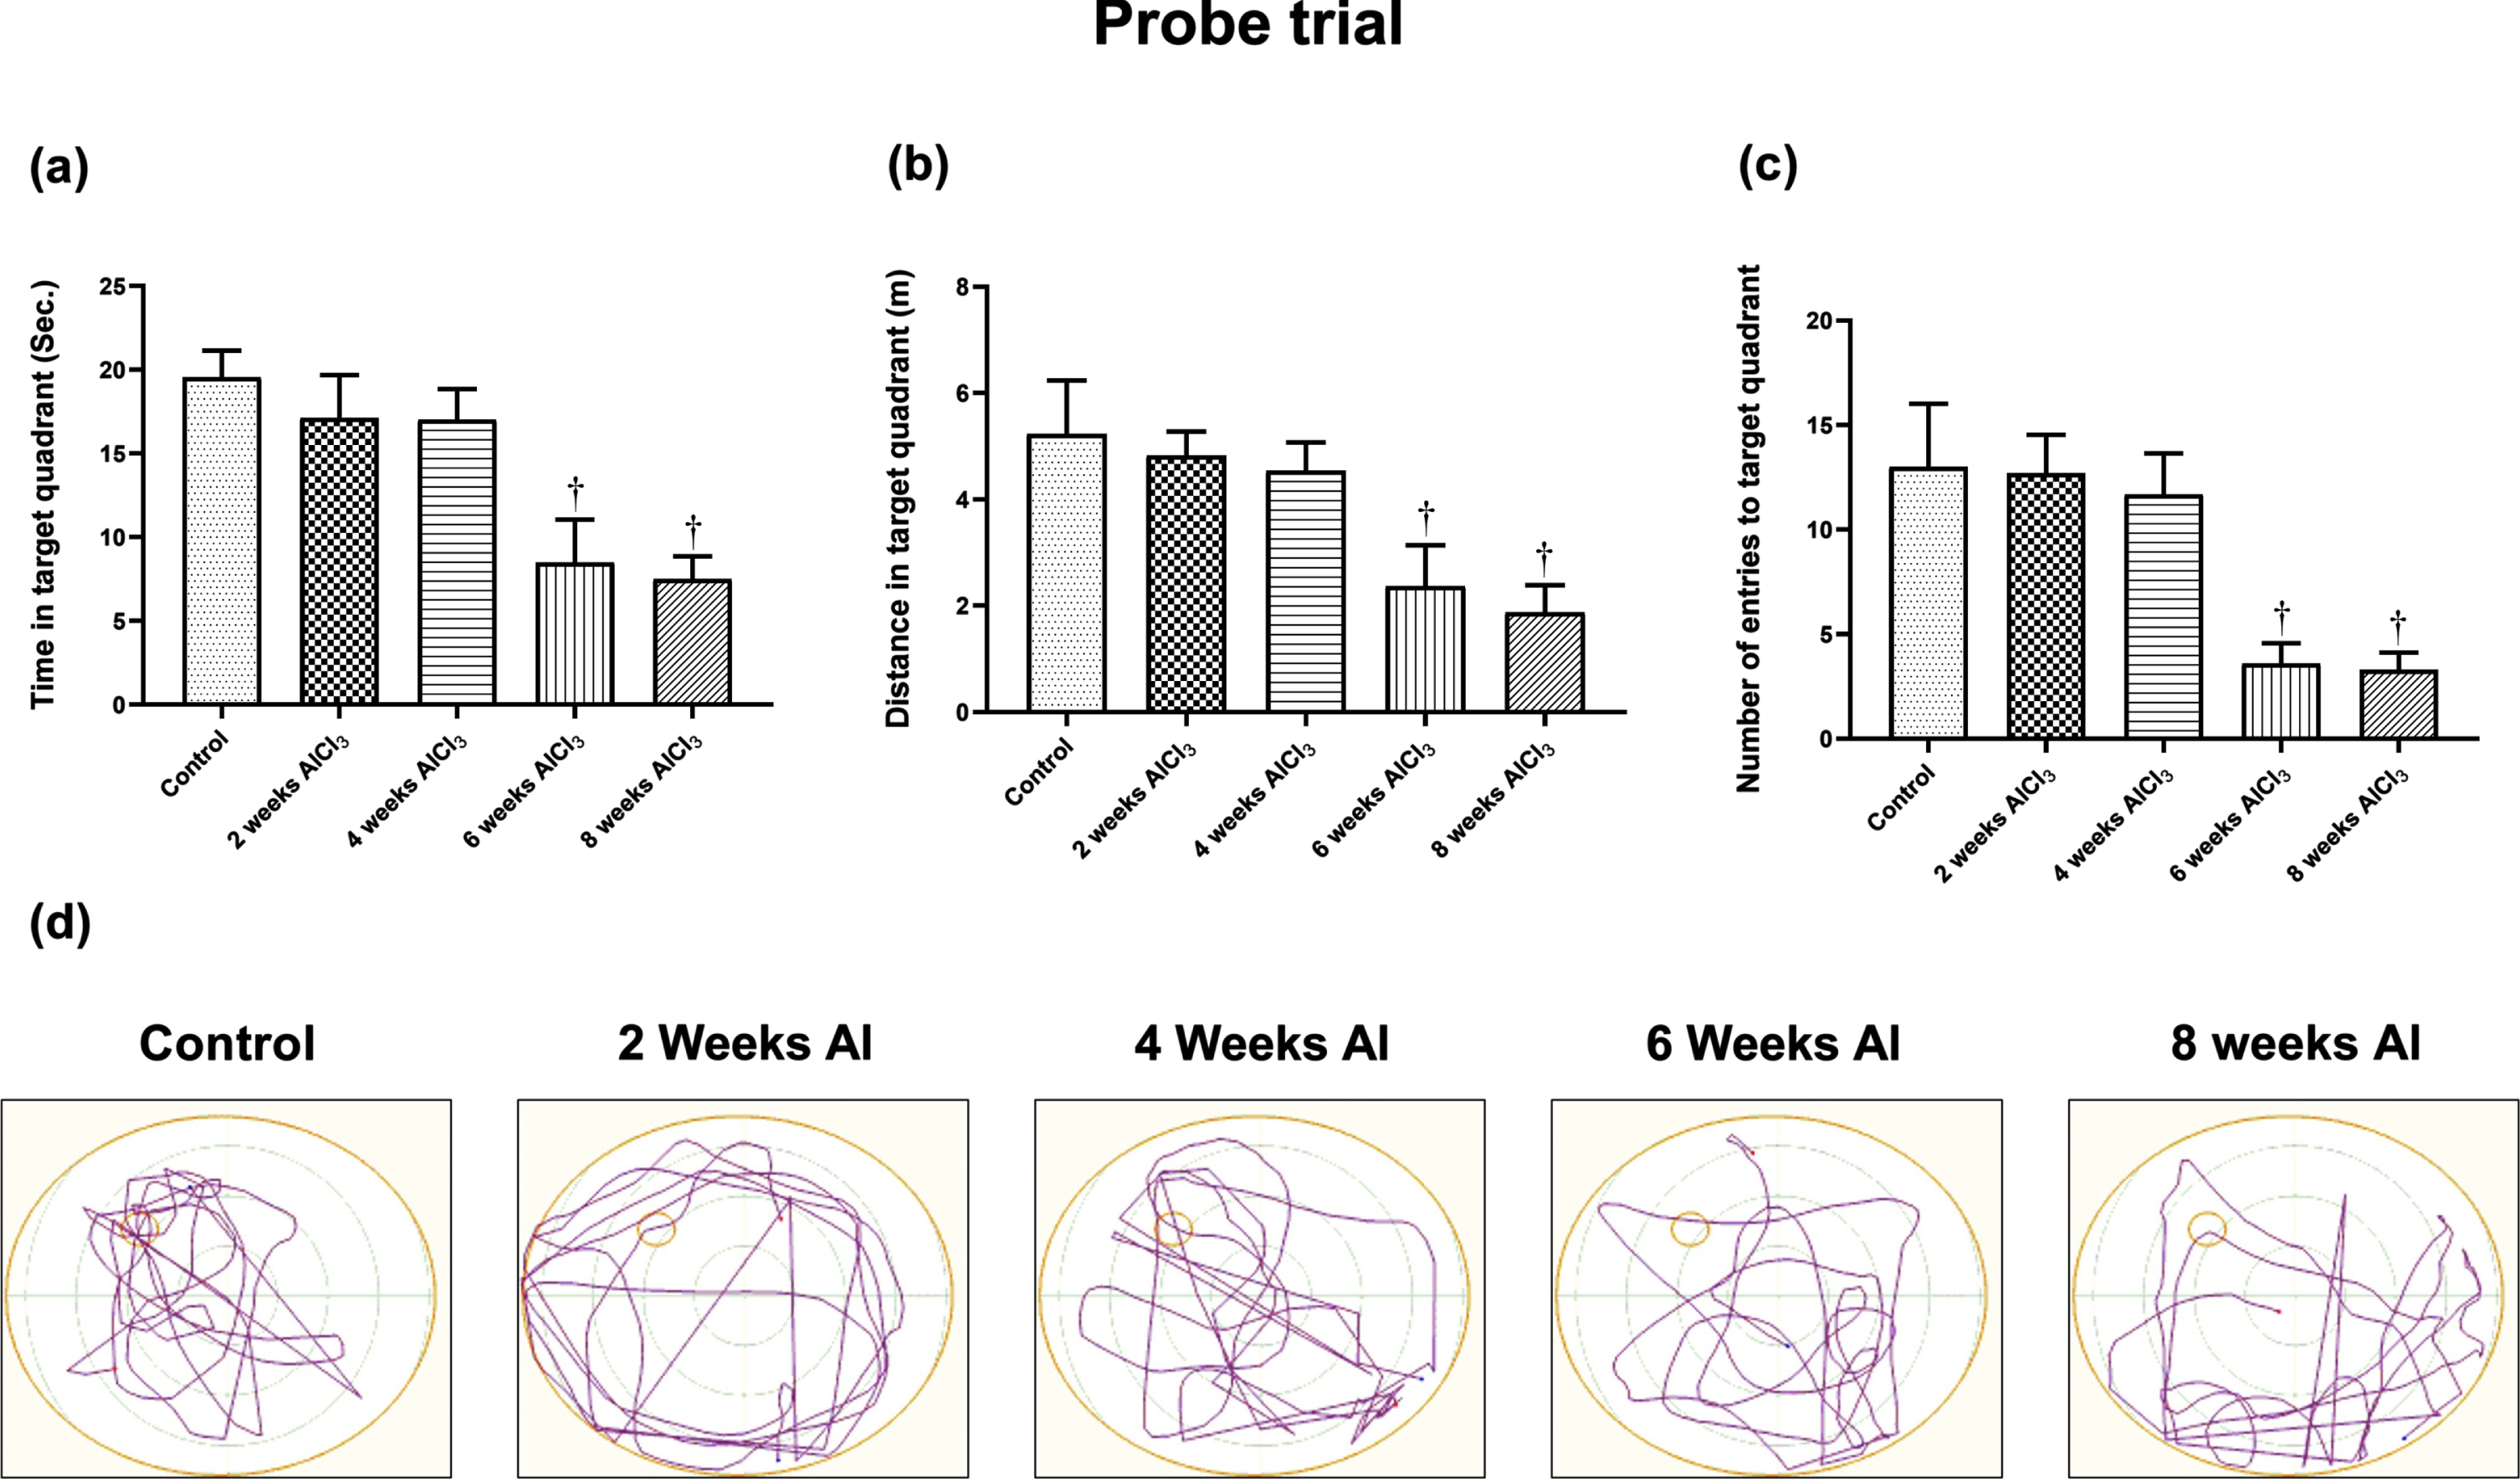
In MWM test, reduction in the mean of escape latency time and path length indicates improvement in the learning process, meanwhile more time spent in the target quadrant, and distance travelled as well as higher number of entries indicates improvement in reference memory. Animals receiving AlCl3 for 2 and 4 weeks did not show any significant difference from control group in MWM test; hence comparisons were performed relative to control group. Indeed, AlCl3-treated rats for 6 and 8 weeks showed a significant increase in escape latency time (5.6 and 6 folds) (Fig. 1a) and path length (5.8 and 7 folds) (Fig. 1b), respectively as compared with control group on the last day of training. Meanwhile, in probe test AlCl3-treated rats for 6 and 8 weeks showed marked reduction in the time spent in target quadrant (43 and 38%) (Fig. 2a) as well as decrease in the total distance swam in the target quadrant by 55% and 54% together (Fig. 2b) with marked fall in number of entries in the target quadrant by 72% and 75% (Fig. 2c), respectively as compared to control group.
Fig. 1
Effect of Aluminum on (a) mean escape latency and (b) path length in MWM test. Values are expressed as mean±S.D. †Level of significance (p < 0.05) in comparison to control group.
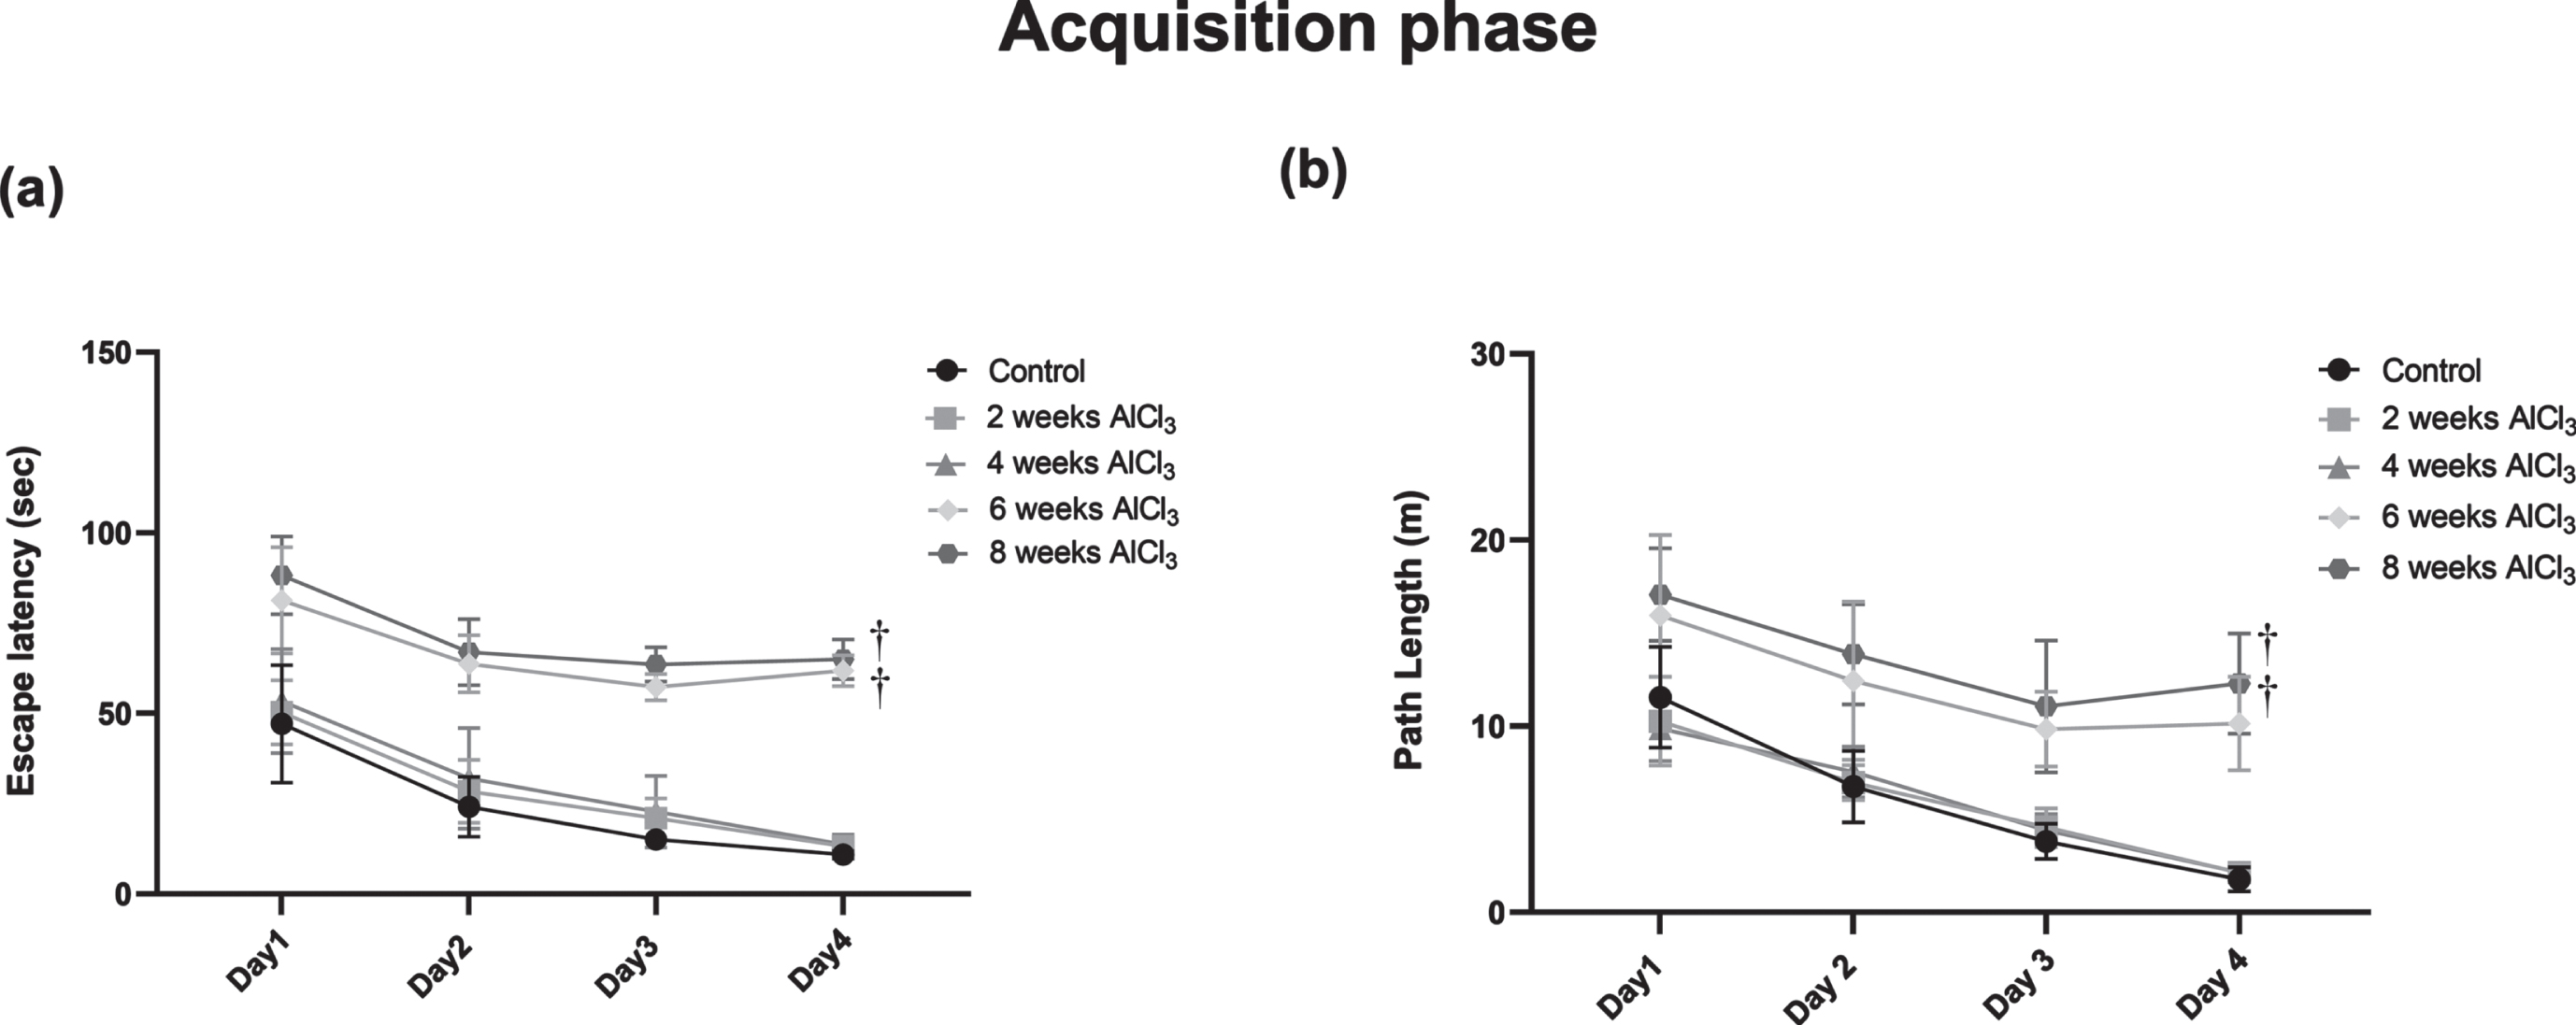
Fig. 2
Effect of aluminum on (a) time spent, (b) distance travelled, and (c) number of entries in the target quadrant as well as (d) representative swim paths in MWM test. Values are expressed as mean±S.D. †Level of significance (p < 0.05) in comparison to control group.
Aβ42 content in retina and brain
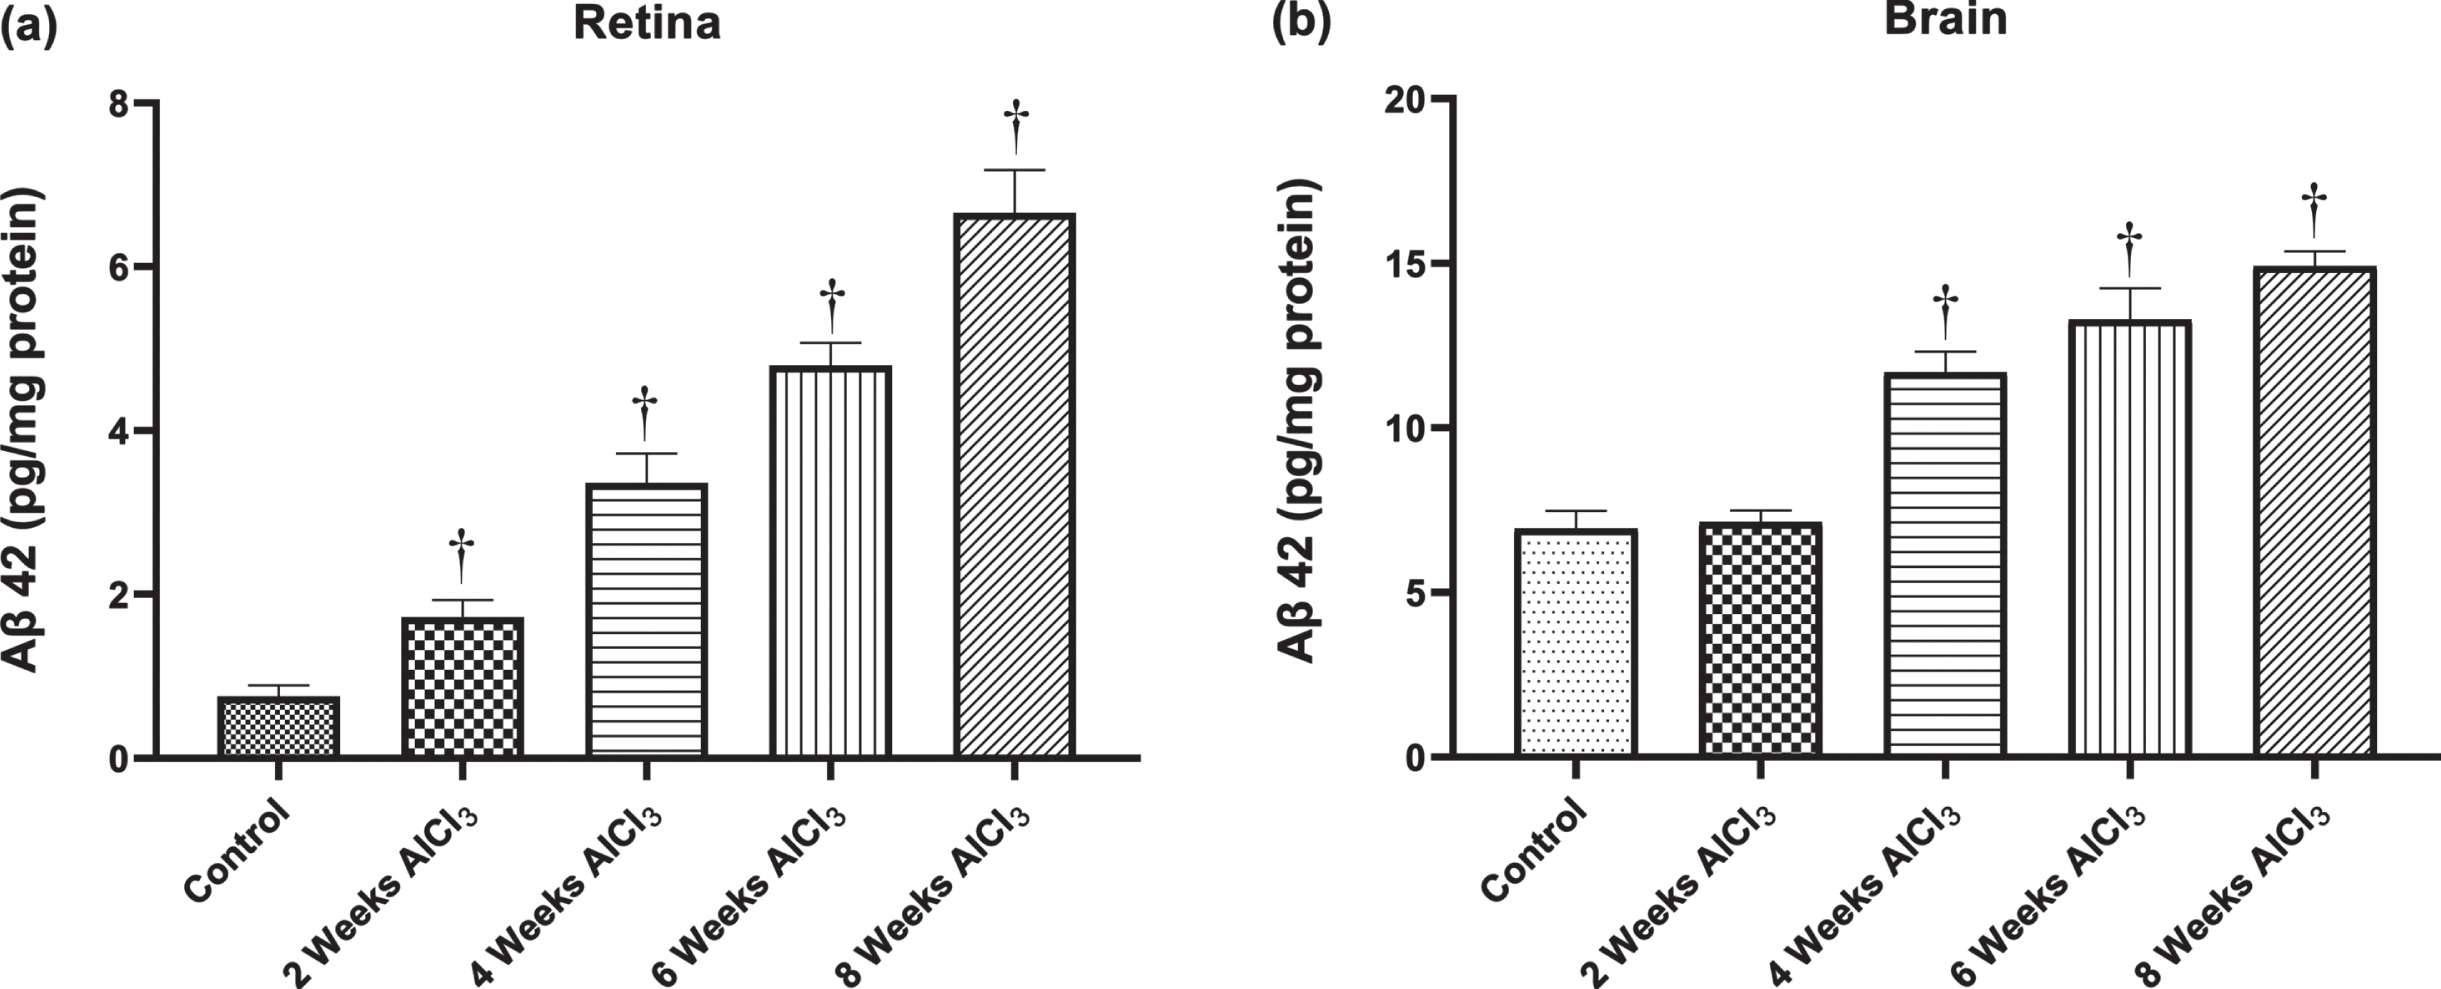
Figure 3a and 3b) illustrated the effect of AlCl3 administration on the accumulation of AD pathological hallmark (Aβ42) in the retinal and hippocampus brain tissues compared to normal tissues. Comparing to the normal retinal concentration of Aβ42 which was 0.758±0.136 pg/mg protein, all AlCl3-treated groups showed a distinguished increase in the concentration of retinal Aβ42 (Fig. 3a). The statistical analysis confirmed the elevation in the Aβ42 expression in the retinal tissues of rats exposed to AlCl3 for 2, 4, 6, and 8 weeks was significant (p < 0.05) with 2.3, 4.4, 6.3, and 8.8-fold respectively in compared with control group.
As depicted in Fig. 3b, the average brain content of Aβ42 showed a significant increase (p < 0.05) in the experimental groups that treated with AlCl3 for 4, 6, and 8 weeks in compared with control group (6.943±0.542 pg/mg protein). In contrast, no discrepancies were detected between the Aβ42 brain content of group treated to AlCl3 for 2 weeks and that of the control group.
Fig. 3
Concentration of Aβ42 in (a) retina and (b) brain. Values are expressed as mean±S.D. †Level of significance (p < 0.05) in comparison to control group.
FTIR of retina
Figure 4a-e show the all FTIR spectra of retinal tissue covering the range 4000 to 900 cm–1 for all groups received AlCl3 after 2, 4, 6, and 8 weeks compared to control. Visually, there are differences in the FTIR spectra of all groups received AlCl3 after 2, 4, 6, and 8 weeks in comparison to spectra of control in retinal tissue. An increase in the absorbance intensity after AlCl3 administration was observed. Comparisons between the means of the FTIR data to retina were performed using PCA.
Fig. 4
Over all FTIR spectra (4000-900 cm-1) of retinal tissue for all groups received AlCl3 compared to control.
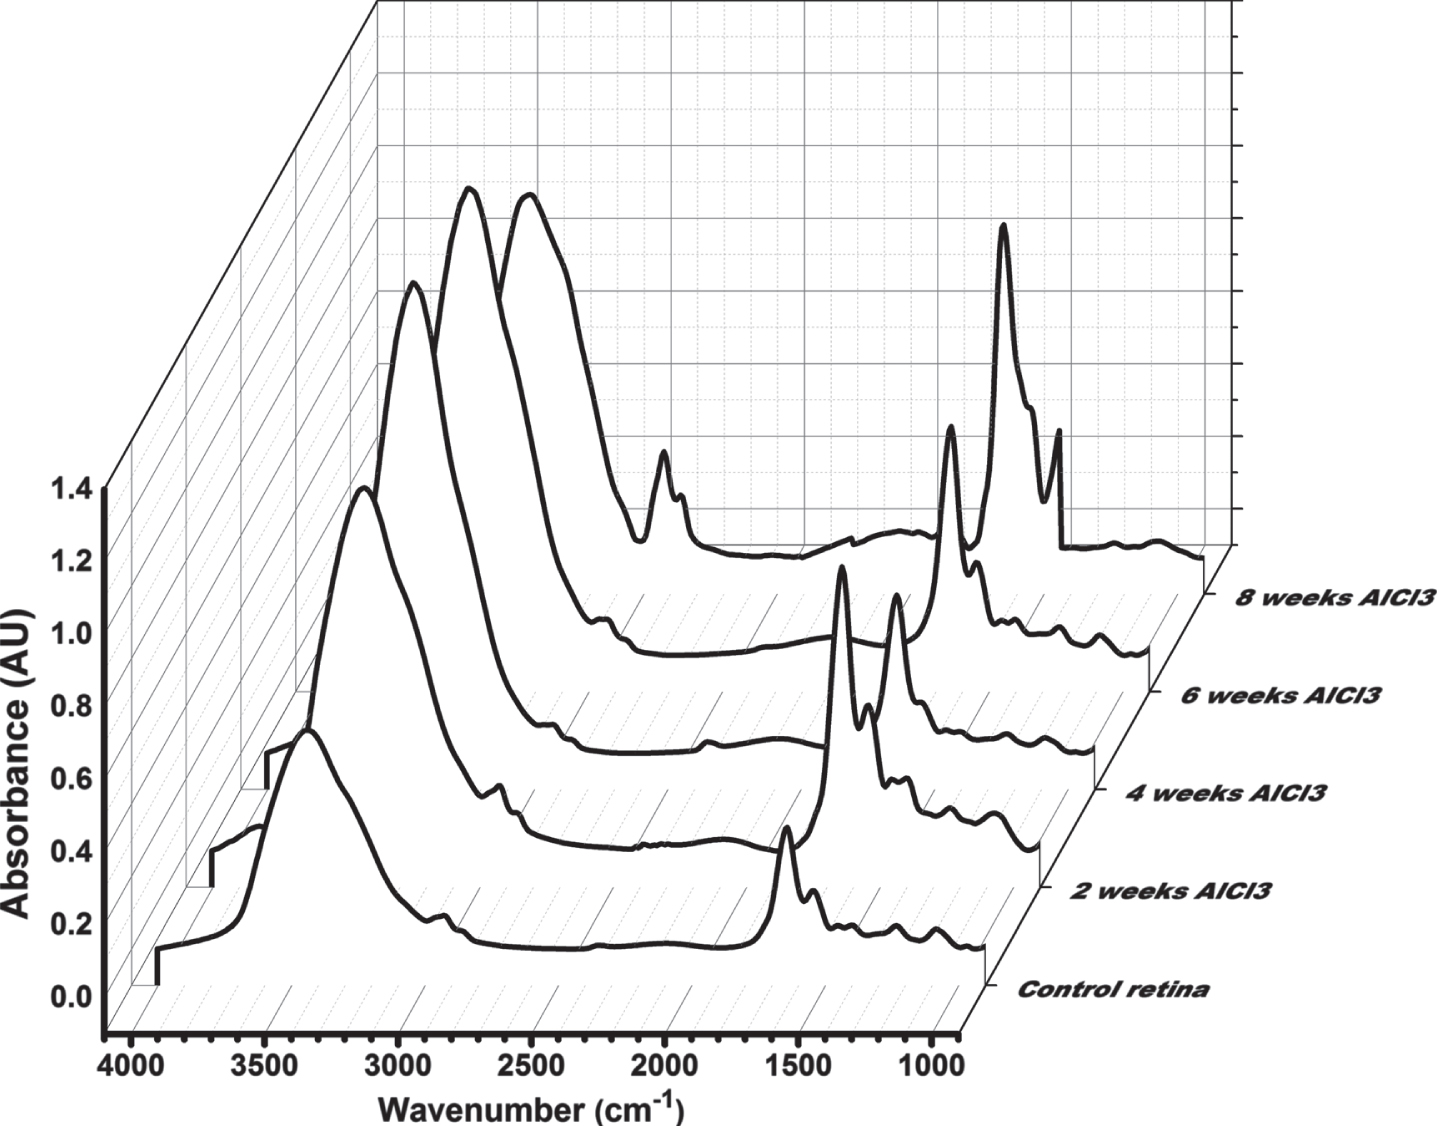
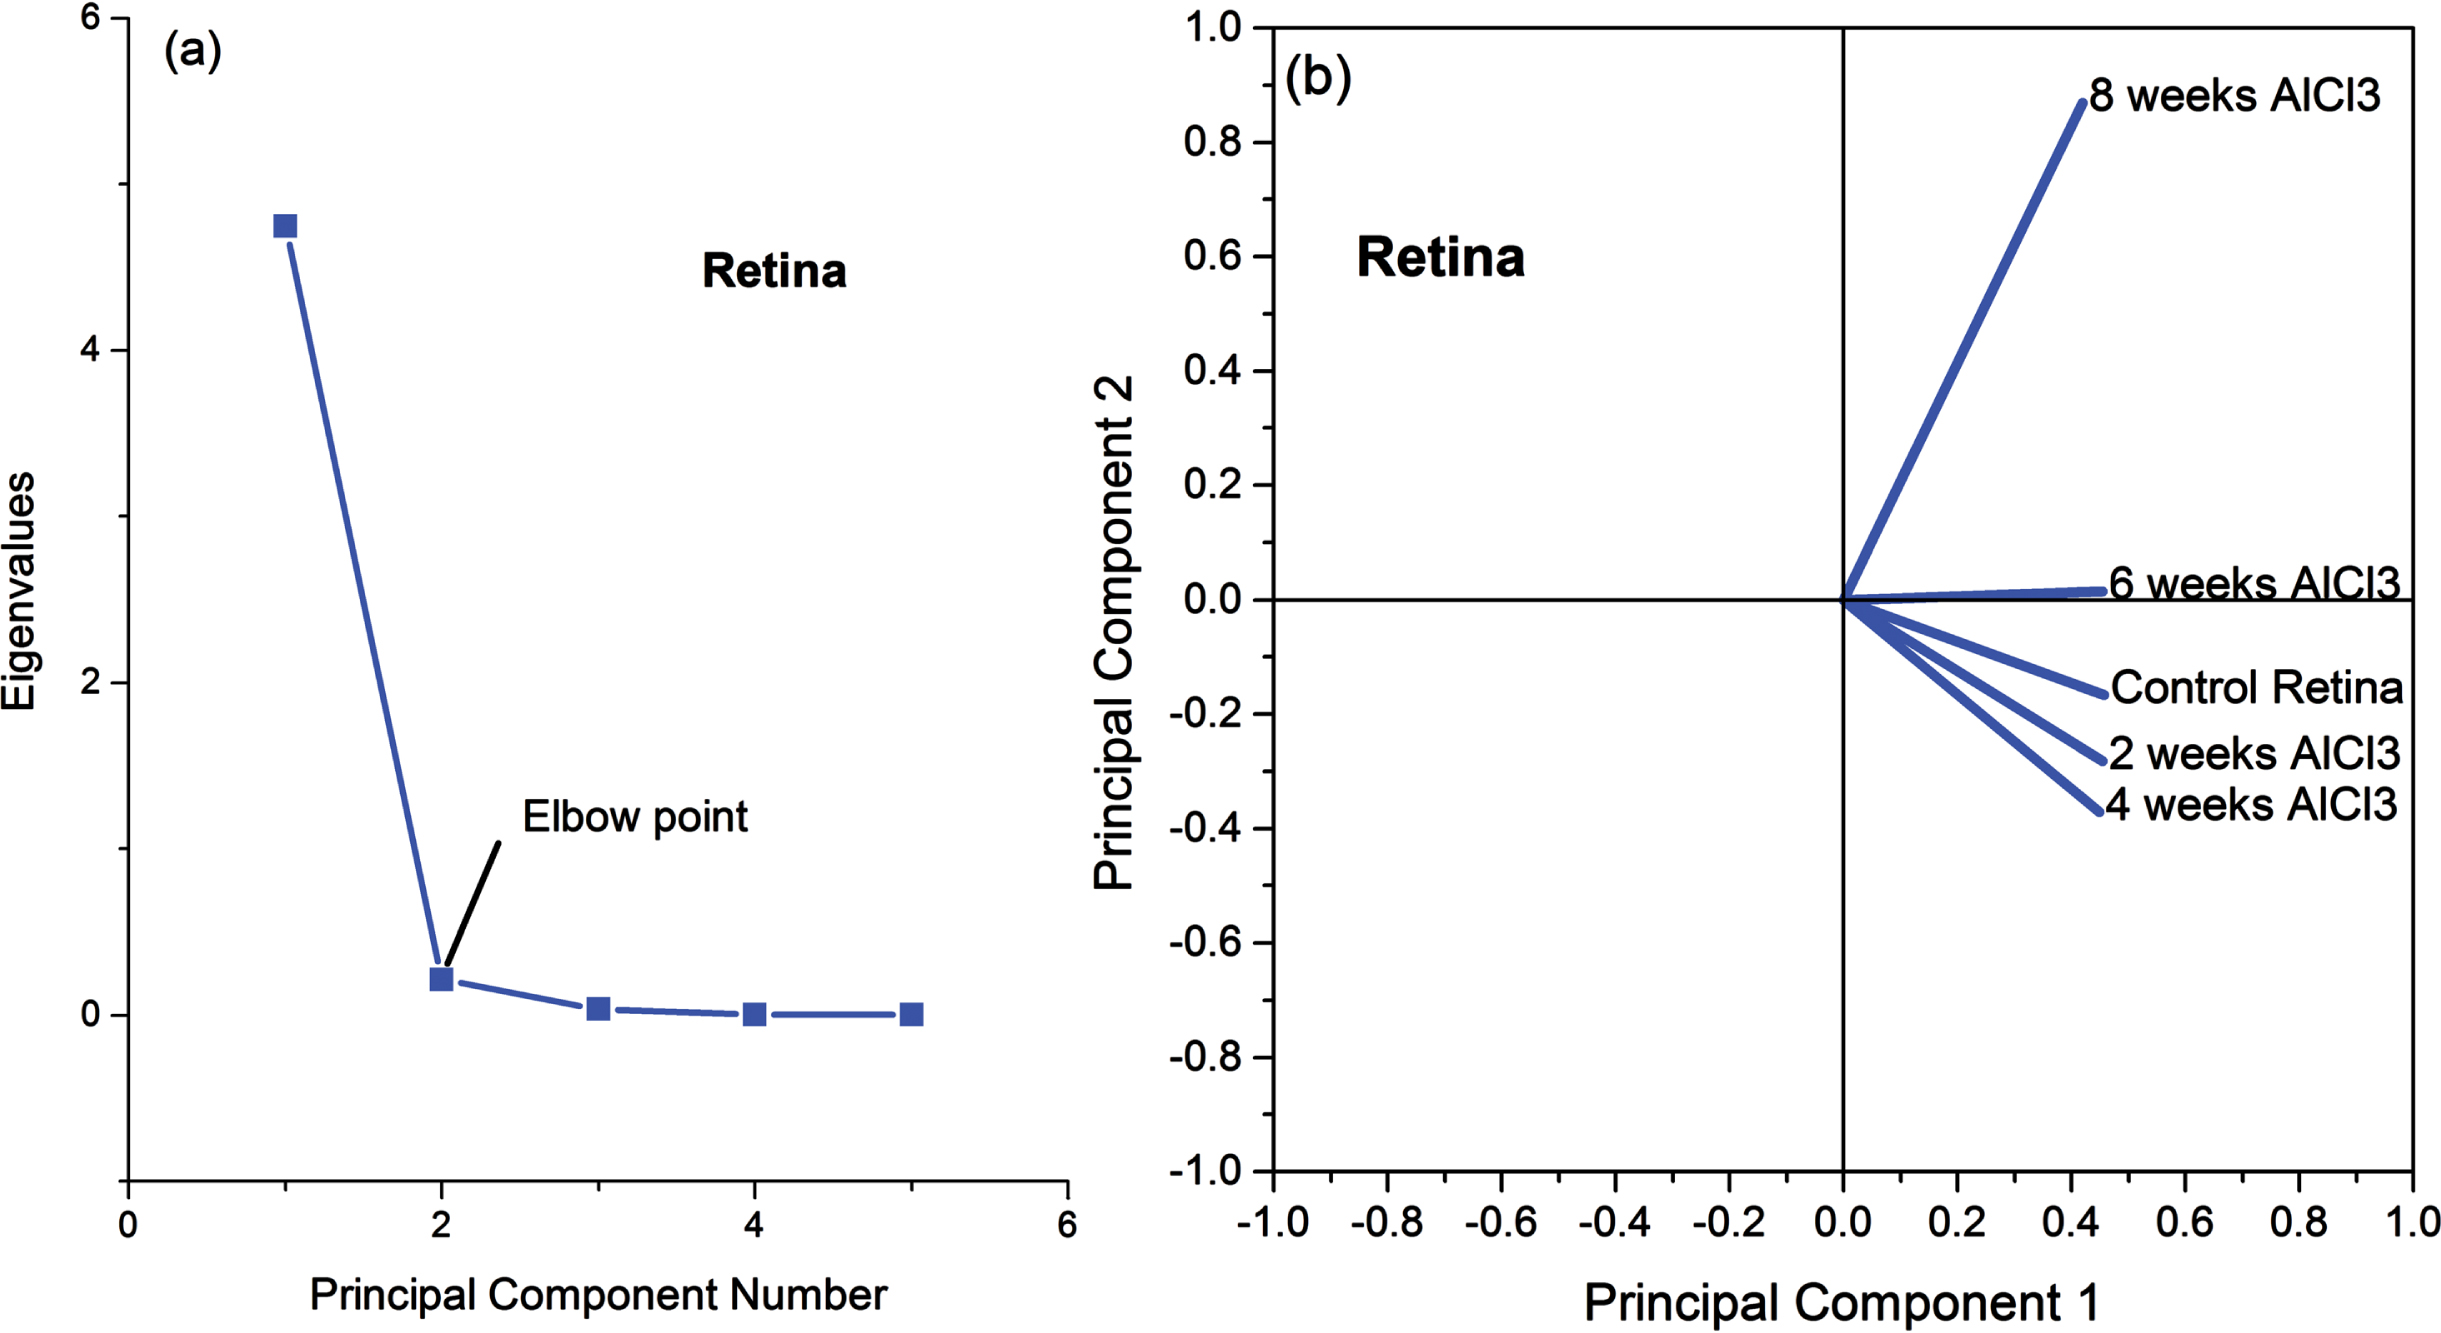
Figure 5a and 5b depict the relation between the eigenvalues and the principal components (Fig. 5a) as well as the loading plot for all FTIR raw data of retinal tissue (Fig. 5b). The covered data was 99.22%, where 94.94% due to the first principal component (PC1) and 4.27% for the second principal component (PC2). The PCA for retina revealed a complete contrast between the animals received AlCl3 for 6 and 8 weeks and normal animals in the control group, since the control group has loading on PC2 and other groups (6 and 8 weeks given AlCl3) have loading on PC1. In the same time, raw data of FTIR related to animals given AlCl3 for 2 and 4 weeks have a loading on PC2 as control but different behavior.
Fig. 5
(a) Eigenvalues in relation to the principal components of FTIR data and (b) the loading plot for retinal FTIR raw data.
The FTIR spectra exhibit a multi-faceted composition, displaying various bands that originate from an array of functional groups including lipids, proteins, and others. To make better analysis to FTIR data, the detailed spectral analysis was performed in three distinct frequency ranges; 4000–3000 cm–1 (NH-OH region), 3000–2800 cm–1 (C-H stretching region), and 1600–900 cm–1 (Fingerprint region).
NH-OH Region for retinal tissue
Figure 6a-e shows the NH-OH region spectra of retinal tissue that has the range 4000-3000 cm–1 for the control and all groups given AlCl3 after 2, 4, 6, and 8 weeks. Figure 6a illustrated the spectra deconvolution of the retinal tissues obtained from the control group that revealed the appearance of five peaks at 3614±3, 3518±4 due to (1) strOH vibration, 3393±5 due to (2) NHasym vibration, 3262±3 due to (3) OHsym, and 3191±4 due to (4) NHsym. Figure 4b-e illustrated the deconvoluted NH-OH region for all groups received AlCl3 after 2, 4, 6, and 8 weeks. All peaks’ wavenumbers and width with their assignments of NH-OH region for retinal tissue to all treated groups compared to control is given in Table 1. Changes of number of peaks observed from 5 peaks in control to 4 peaks after 2 and 6 weeks of receiving AlCl3 and to 3 peaks after 8 weeks AlCl3 group. Vibration strOH characterized by statistically significant changes (p < 0.05) in wavelength and width in all groups of AlCl3 accompanied by disappearance of one mode of vibration related to strOH for 6 and 8 weeks of AlCl3 . The statistically significant decrease (p < 0.05) in band location and width of NH asym vibration after 4 weeks AlCl3 group was observed and disappearance of that vibration in others AlCl3 groups. The vibration OHsym characterized by statistically significant changes (p < 0.05) in width of all AlCl3 groups and statistically significant increase (p < 0.05) in the band position after 8 weeks AlCl3 group. Disappearance of NHsym vibration in 2 and 8 weeks AlCl3 groups was observed.
Fig. 6
Deconvolution spectra of retinal tissue in NHOH region (4000-3000 cm-1) to all groups administrated AlCl3 compared to control. (1) strOH, (2) OHasym, (3) NHasym, (4) OHsym, and (5) NHsym.
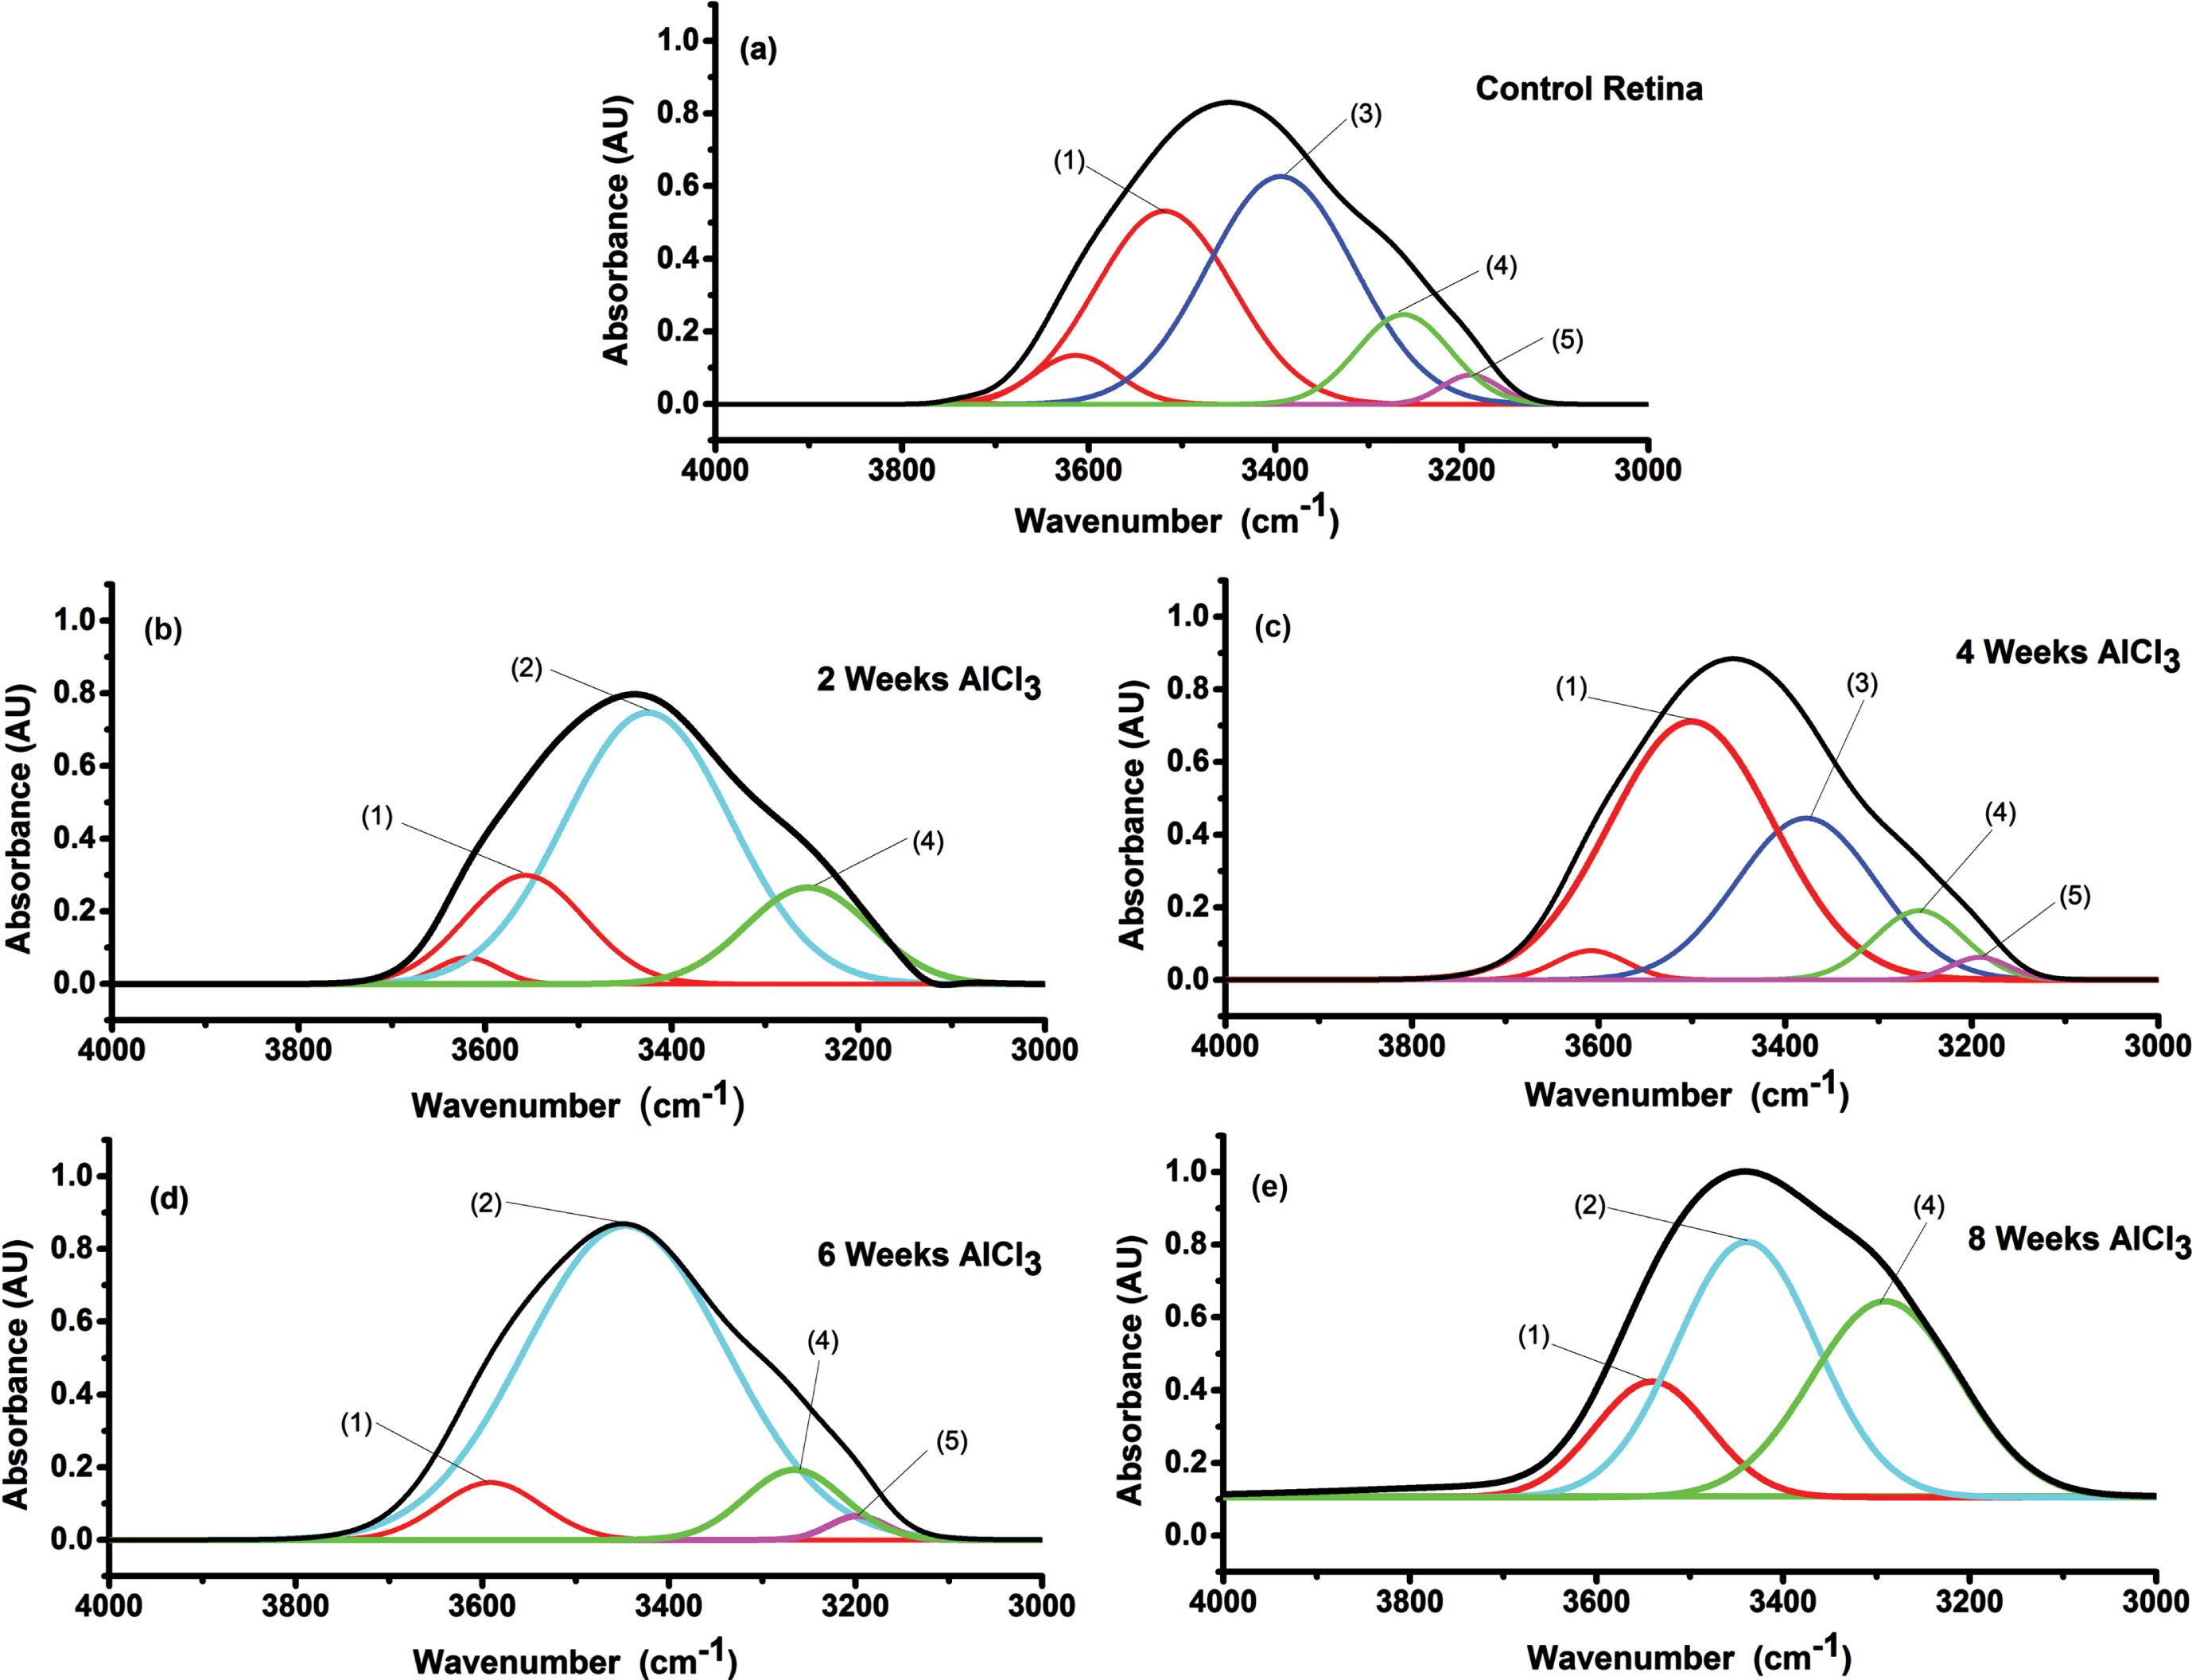
Table 1
Vibrational frequency of NH-OH (4000-3000 cm–1) and bandwidth in cm–1 deduced from FTIR spectra of retinal tissue after deconvolution to all animals administrated with aluminum chloride compared to control
| (1) str OH | (2) OH asym | (3) NH asym | (4) OH sym | (5) NH sym | ||
| Control | 3614±3 | 3518±4 | 3393±5 | 3262±3 | 3191±4 | |
| 90.6±2 | 147.2±3 | 157.2±2 | 105.2±2 | 61.9±2 | ||
| 2 weeks AlCl3 | 3619±2 | 3557±4† | 3425±3 | 3257±4 | ||
| 66.2±2† | 127.5±2† | 177.6±4 | 133.3±2† | |||
| 4 weeks AlCl3 | 3608±1† | 3500±5† | 3377±4† | 3256±3 | 3192±3 | |
| 76.6±2† | 175.8±2† | 146.1±2† | 96.8±1† | 62.8±1 | ||
| 6 weeks AlCl3 | 3591±3† | 3446±5 | 3265±2 | 3197±2 | ||
| 109.5±4† | 216.3±3 | 115.7±1† | 62.2±2 | |||
| 8 weeks AlCl3 | 3540±5† | 3438±4 | 3290±4† | |||
| 123.2±3† | 149.2±2 | 158.5±4† | ||||
†Statistically significant (n = 10, p < 0.05). First line is band wavenumber and the last line is the band width.
C-H region
The infrared absorption pattern, in the region 3000-2800 due to CH vibration, of control retina and all groups administrated AlCl3 for 2, 4, 6, and 8 weeks after deconvolution were illustrated in Fig. 7a-e. Assignments of the peaks in all groups with their width and statistical differences compared to control summarized in Table 2. As shown from Fig. 7a-e and Table 2, control pattern characterized by 4 absorption bands at 2962±1 cm–1 with bandwidth 30.8±1 cm–1, 2925±2 cm–1 with bandwidth 35.4±1 cm–1, 2875±2 cm–1 with bandwidth 33.3±1 cm–1, and 2852±2 cm–1 with bandwidth 24.1±1 cm–1. These bands can be assigned to (1) asymCH3, (2) asymCH2, (3) symCH3, and (4) symCH2 respectively [20]. Statistically significant increase (p < 0.05) in most bands’ width was observed and disappearance of mode of vibration symCH3 due to AlCl3 administration. A statistically significant increase (p < 0.05) in vibrational frequency of symCH2 in all groups received AlCl3.
Fig. 7
FTIR range (3000-2800 cm–1) of retinal tissue to all groups received AlCl3 compared to control and numbers of peaks to facilitate identification of function groups. (1) asymCH3, (2) asymCH2, (3) symCH3, and (4) symCH2.
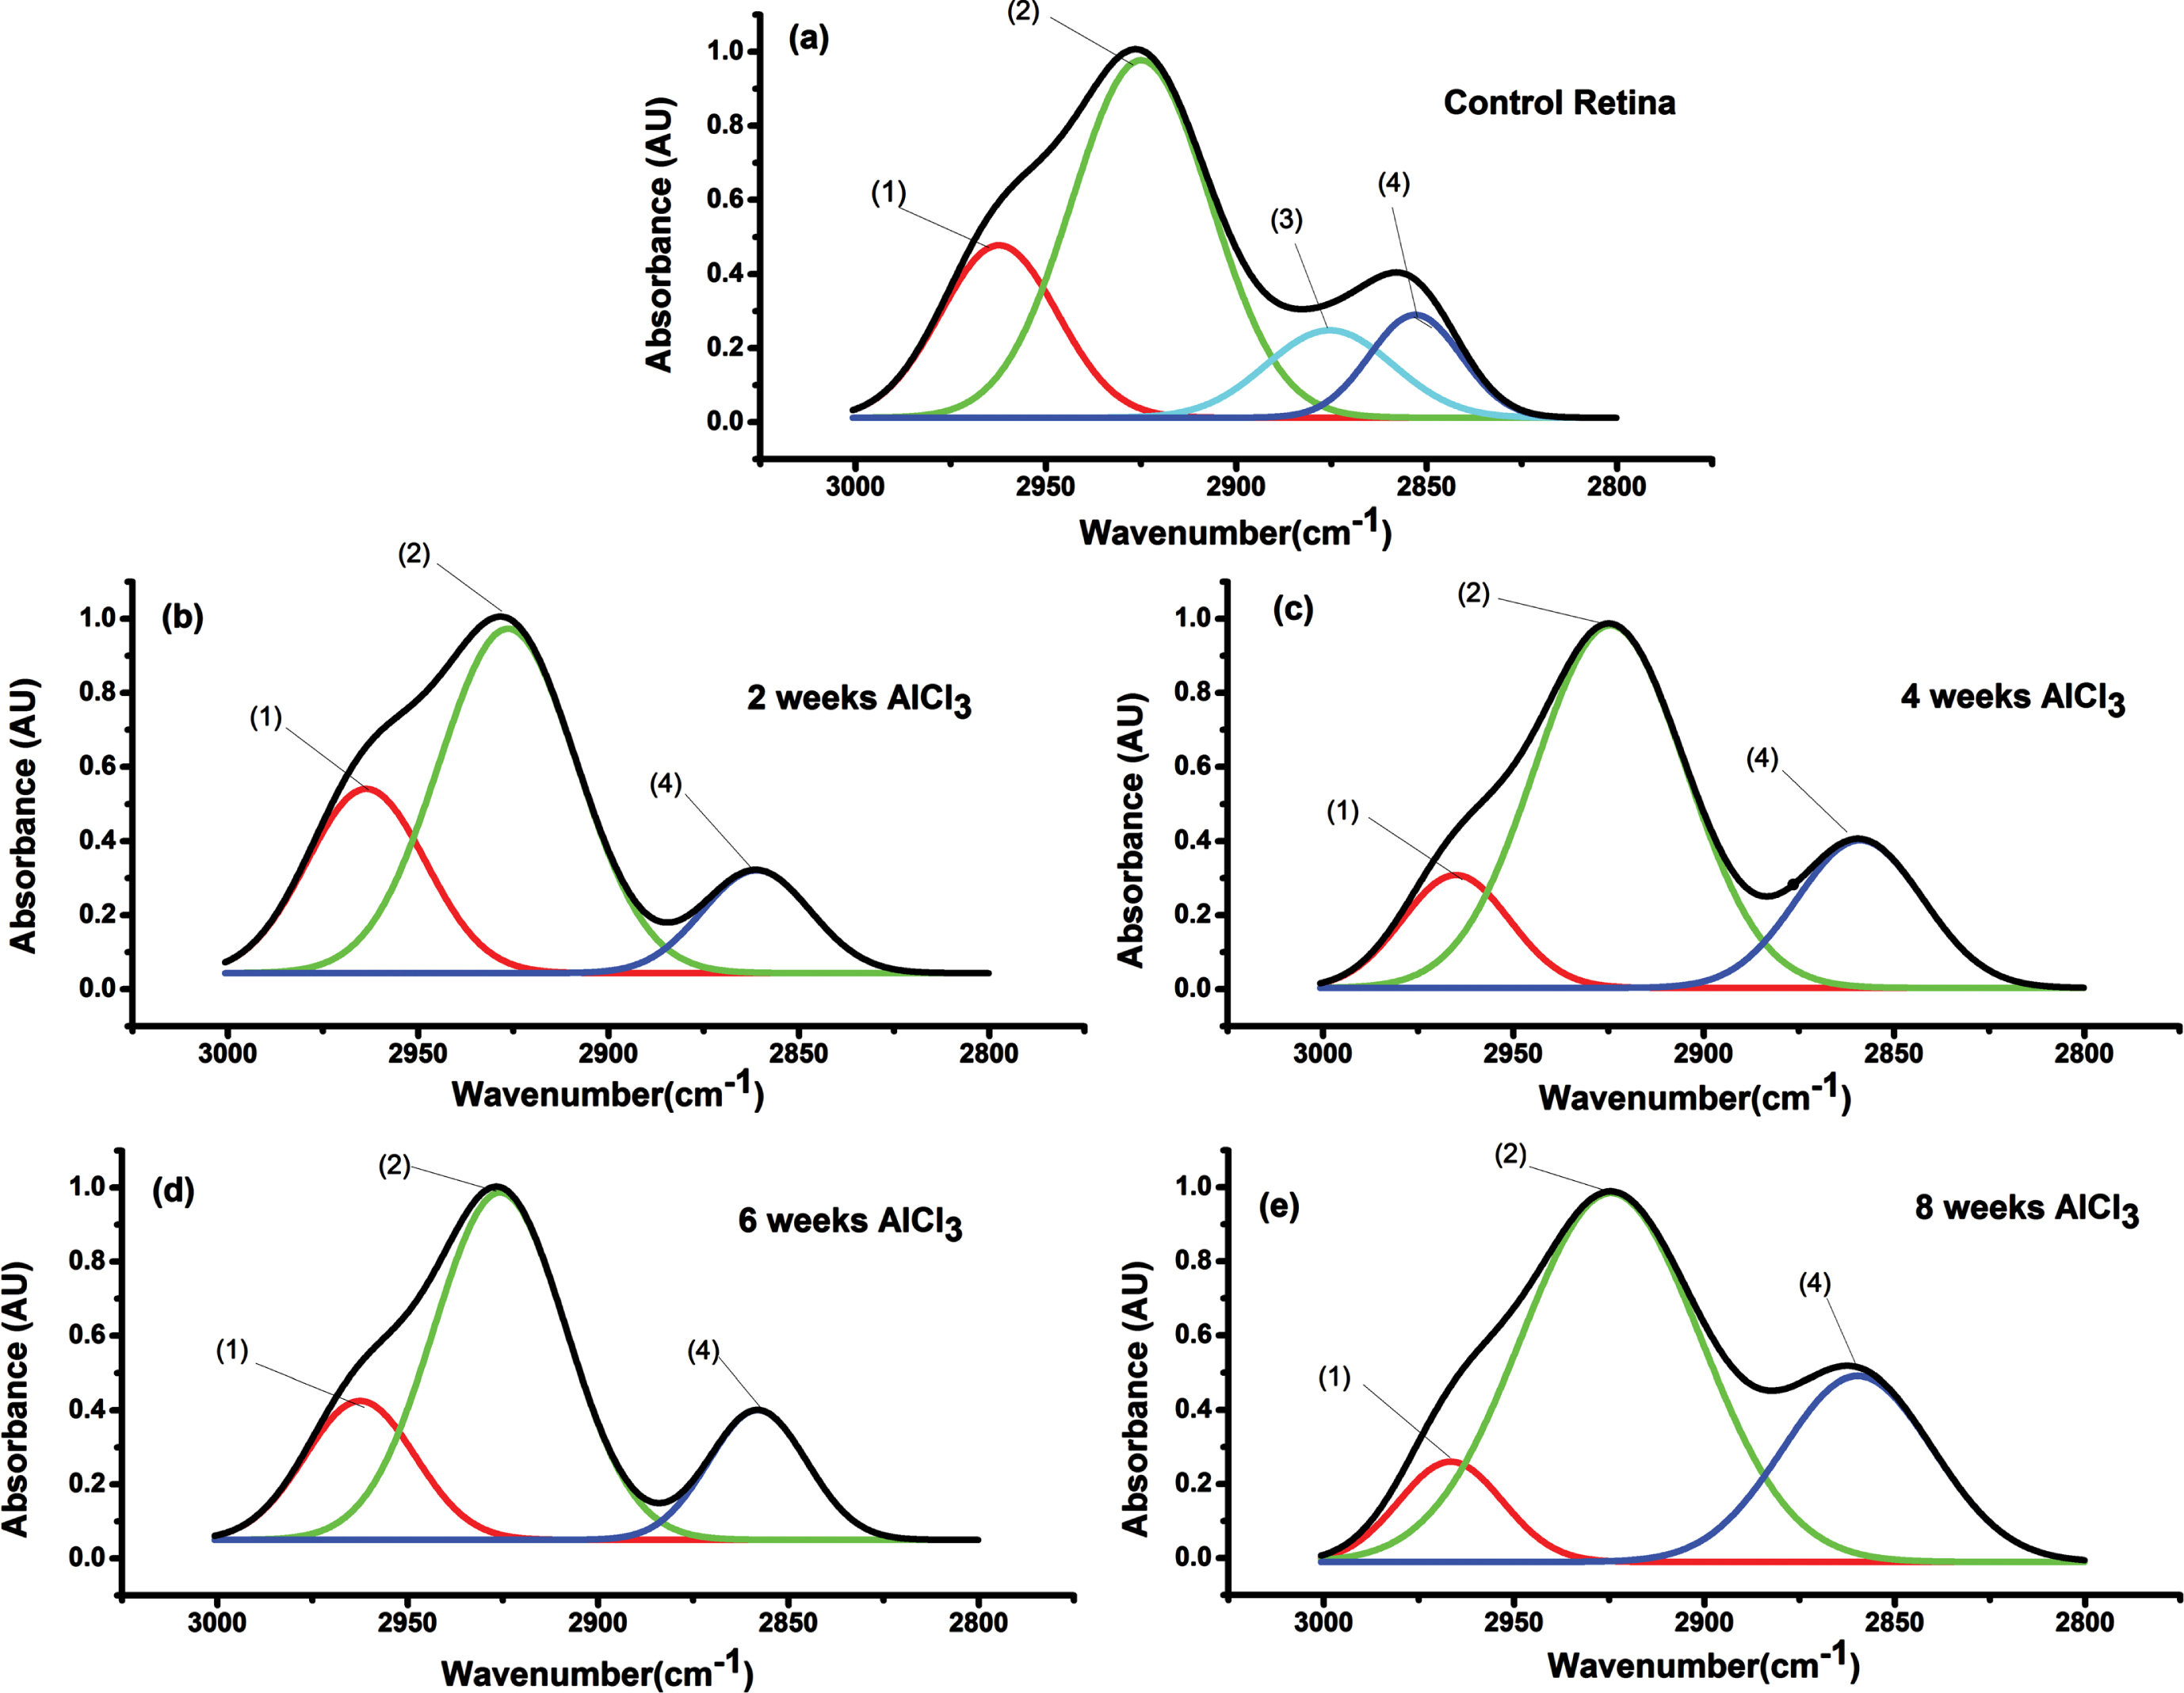
Table 2
CH spectra in the region 3000-2800 cm–1 of retinal tissue for all groups received AlCl3 compared to control
| asym CH3 | asym CH2 | sym CH3 | sym CH2 | |
| Control | 2962±1 | 2925±2 | 2875±2 | 2850±2 |
| 30.8±1 | 35.4±1 | 33.3±1 | 24.1±1 | |
| 2 weeks AlCl3 | 2964±1 | 2926±2 | 2861±2† | |
| 36.7±1† | 42.4±1† | 33.4±1† | ||
| 4 weeks AlCl3 | 2963±1 | 2924±2 | 2858±1† | |
| 34.1±2† | 46.7±1† | 38.8±2 | ||
| 6 weeks AlCl3 | 2962±2 | 2926±2 | 2859±1† | |
| 29.9±2 | 34.8±1 | 25.8±1 | ||
| 8 weeks AlCl3 | 2966±1† | 2924±2 | 2860±1† | |
| 28.3±2 | 47.3±1† | 39.5±1† |
†Statistically significant (n = 10, p < 0.05). First line is band wavenumber and the last line is the band width.
Fingerprint region
Figure 8a-e illustrated the third analysis region (1600-900 cm–1) due to fingerprint vibration that resulted from protein and lipid parts of retinal tissue from all groups administrated AlCl3 compared to control. Fingerprint spectra bands decrease from 6 bands in control to 5, 4, 4, and 4 bands in 2, 4, 6, and 8 weeks AlCl3 groups, respectively. Table 3 illustrated the wavelength for each band and their bandwidths to all groups administrated AlCl3 and control. The normal pattern revealed six bands and their assignments were as follow: absorption band at 1538±2 cm–1 corresponding to (1) amide II (N = Hbend); 1453±1 cm–1 due to (2) CH2 bend; 1400±3 cm–1 due to (3) strCOO-sym; 1314±2 cm–1 due to CH3 deform; 1233±2 cm–1 due to (5) asymPO2; 1081±1 cm–1 corresponding to symPO2. Two weeks AlCl3 administrations lead to minor changes which disappear of CH3deform vibration and statistically significant increase (p < 0.05) in width of asymPO2 and symPO2vibrations. By increasing the time of AlCl3 administrations to 4-, 6-, and 8-weeks lead to statistically significant changes (p < 0.05) in all band position and width for modes of vibration observed. Disappearance of CH2 bend and CH3 deform vibration in the 4- and 6-week AlCl3 groups and disappearance of COOsym and CH3deform in the 8-week AlCl3 group were observed.
Fig. 8
FTIR spectra of the fingerprint region (1600-900) of all the studied groups compared to control. The numbers above the peaks are to facilitate their assignment. (1) Amide II, (2) CH2 bend, (3) COO sym, (4) CH3def, (5) asym PO2, (6) sym PO2.
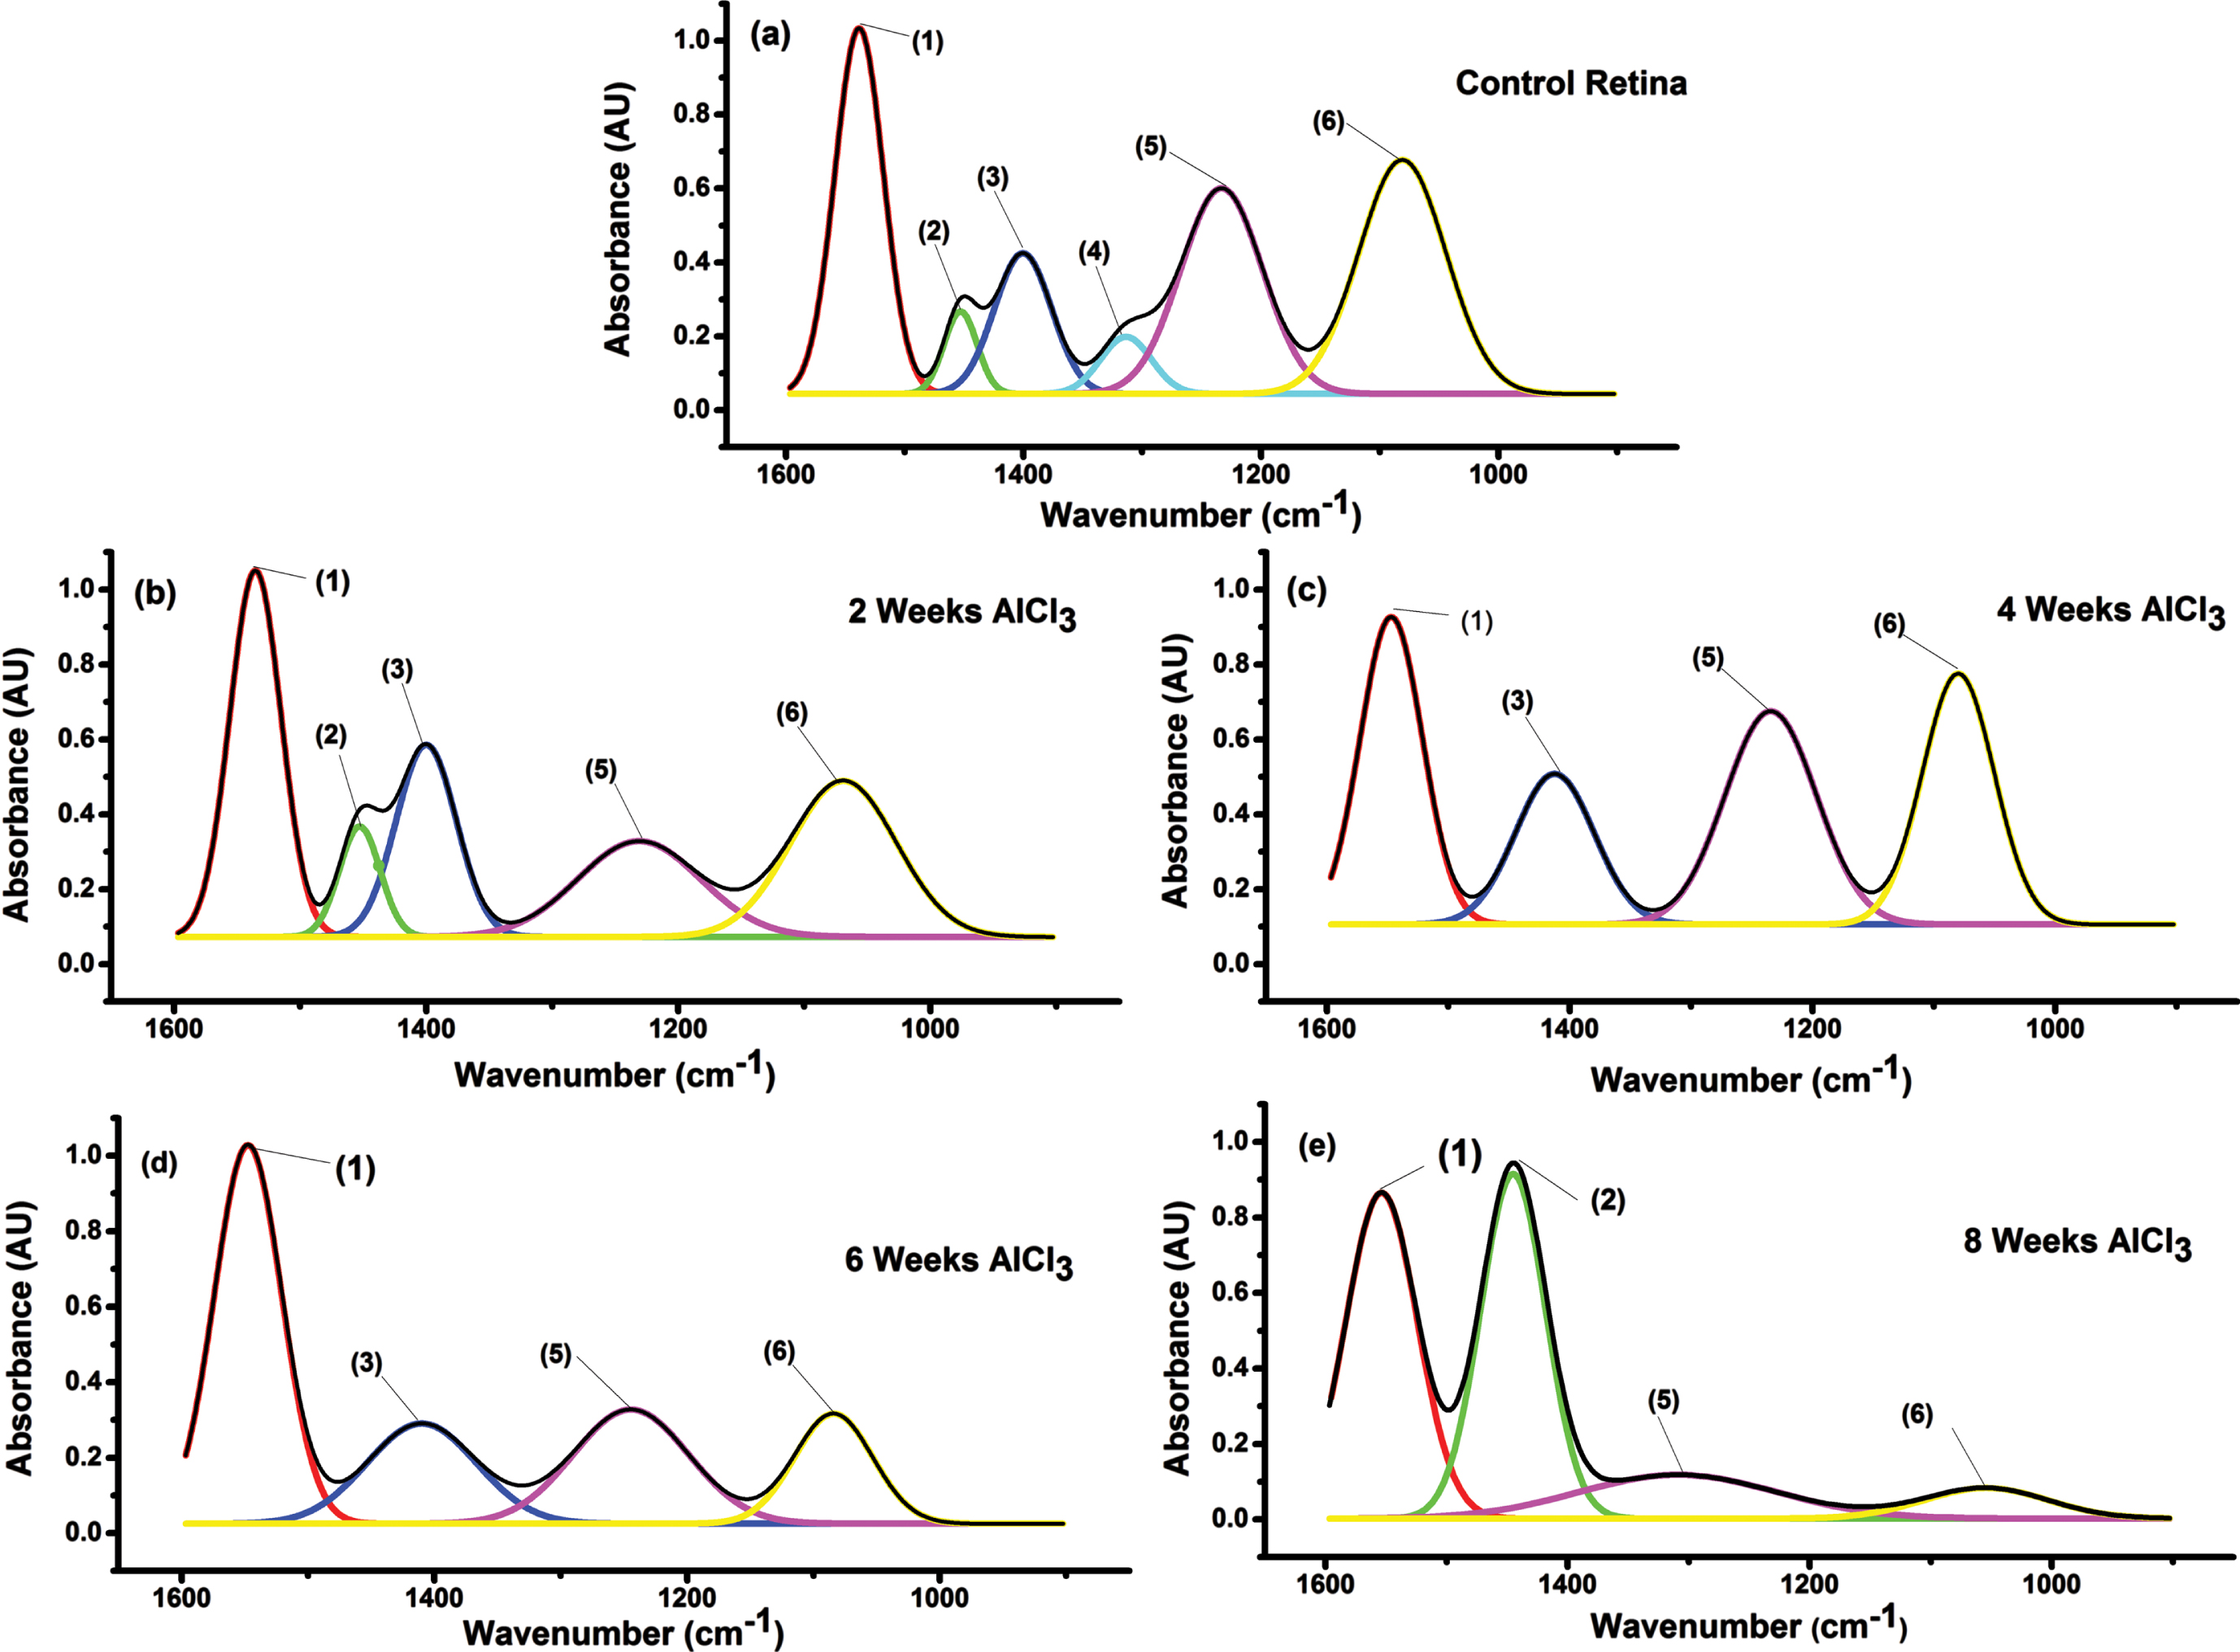
Table 3
Fingerprint region (1600-900 cm–1) of retinal tissue to all groups administrated AlCl3 compared to control
| (1) | (2) | (3) | (4) | (5) | (6) | |
| Amide II | CH2 bend | COOsym | CH3 deform | asymPO2 | symPO2 | |
| Control | 1538±2 | 1453±1 | 1400±3 | 1314±2 | 1233±2 | 1081±1 |
| 48.1±2 | 32.9±3 | 56.8±2 | 50.7±3 | 85.1±2 | 87.3±4 | |
| 2 weeks AlCl3 | 1535±3 | 1453±3 | 1399±1 | 1230±3 | 1078±3 | |
| 47.9±2 | 37.2±4 | 56.4±2 | 114.8±4† | 95.9±4† | ||
| 4 weeks AlCl3 | 1546±2† | 1412±3† | 1234±1 | 1080±4 | ||
| 60.6±1† | 76.8±1† | 88.6±3 | 69.6±1† | |||
| 6 weeks AlCl3 | 1547±1† | 1409±2† | 1244±2† | 1084±3 | ||
| 62.8±3† | 102.3±4† | 107.8±2† | 72.9±2† | |||
| 8 weeks AlCl3 | 1553±3† | 1445±2† | 1294±3† | 1054±2† | ||
| 69.7±2† | 63.4±1† | 192.1±4† | 120.7±2† |
†Statistical significant (n = 10, p < 0.05). First line is band wavenumber and the last line is the band width.
Ratiometric analysis
Table 4 summarizes AlCl3 effects for the studied periods used in experiment on the acyl chain induced gauche rotamers and on the absorption intensity ratio of both asymCH2/symCH2 and asymPO2/symPO2. As shown in that table and by comparing to control value, gauche rotamers increased due to AlCl3 administration, but it is not dependent on the time of receiving AlCl3. The absorption intensity ratio of both symmetric and asymmetric of vibration mode CH2 was decreased in function of time of receiving AlCl3 in the animals of experimental groups.
Table 4
Ratiometric analysis of different parameters in FTIR data due to AlCl3 administration for 2, 4, 6, and 8 weeks compared to control value
| *gauche rotamers | asymCH2/symCH2 | asymPO2/symPO2 | |
| Control | 0.18 | 3.45 | 0.89 |
| 2 weeks AlCl3 | 2.18 | 3.10 | 0.67 |
| 4 weeks AlCl3 | 1.64 | 2.43 | 0.87 |
| 6 weeks AlCl3 | 1.82 | 2.50 | 1.04 |
| 8 weeks AlCl3 | 2.00 | 1.91 | 1.30 |
*calculated using the position of symCH2 band. The other numbers depend on the absorbance intensity ratios.
The phosphate group intensity ratio that is asymPO2/symPO2 behaves in two configurations; the ratio was decreased after 2 and 4 weeks of AlCl3 administration, while increased after 6 and 8 weeks of AlCl3 administration.
DISCUSSION
Over 50 million people worldwide suffer from AD, which is a chronic neurodegenerative disorder that is recognized by memory impairments, cognitive decline, and behavioral changes that eventually with disease progression leads to death within 3–9 years after the diagnosis [17]. As a multi-factorial disease, various modifiable and non-modifiable risk factors have been implicated in the initiation and progression of AD. Undoubtedly, the most prominent threat factor associated with this disease is aging. The probability of developing AD escalates tremendously as an individual grows older, notably beyond 65 years old where there is a doubling in its occurrence every five years. There are various potent elucidations for the cognitive decline associated with AD. Oxidative stress is one of these potent explanations which are closely linked to AD due to the facilitation of neurotoxicity by free radicals.
The results indicated that cognitive impairment starting from 6 weeks of AlCl3 administration. Retinal concentration of Aβ42 was significant increase (p < 0.05) from 2 weeks that precedes the observed increase of Aβ42 in the brain which appeared after 4 weeks of AlCl3 administration. FTIR spectra revealed an early detection of different variations in both frequencies and bandwidths of most function groups of retinal tissue due to AlCl3 administration.
The exposure to AlCl3 was found to negatively impact memory capabilities, as evidenced by the prolonged time taken to locate the hidden platform during MWM testing. This deficiency may be attributed to decreased acetylcholine levels, which are caused by the elevation of acetylcholinesterase [21]. Memory defects observed from 6 weeks of AlCl3 administration could also attributed to alterations in synaptic transmission resulted from diminished synaptic elasticity [22] due to inhibition of voltage activated calcium channel currents [23].
AlCl3-induced AD models have been used in numerous previous studies in mice [24], rats [25], rabbits [26], and cultured cells [27]. These investigations revealed an elevation in Aβ content and alterations in its conformation, which improve its aggregation in a manner that resembles the characteristic structure of AD observed in humans.
Our study indicated a statistically significant increase (p < 0.05) of Aβ42 level in the brain from the fourth week of AlCl3 administration. This finding suggests that the administration of AlCl3 could contribute to the deposition and aggregation of Aβ42 in brains, which is a crucial factor in the development of AD.
The Aβ is formed by the breakdown of the parent protein, AβPP, through sequential cleavages by β-and γ-secretases [28]. For maintaining homeostasis in the brain, it is critical to balance the production and clearance of Aβ. The clearance mechanisms include transporting the extra Aβ across the blood-brain barrier by receptor advanced glycation end productions (RAGE) proteins and low-density lipoprotein receptor-related protein-1 (LRP1), as well as enzymatic degradation by zinc associated metalloendopeptidase, insulin-degrading enzyme and neprilysin [29]. As LRP1 is responsible for efflux Aβ out of the brain into the blood, RAGE facilitates the influx of Aβ from the blood into the brain. However, when the balance between Aβ production and clearance is disrupted, that leads to the accumulation of Aβ in the brain [7].
Moreover, the results of this study revealed a significant surge (p < 0.05) in Aβ42 levels of the retina subsequent to two weeks of AlCl3 administration. Interestingly, these findings indicate that an AD marker is present and detectable in the retina prior to indication within the brain. The retinal Aβ deposits seem to be noticeable earlier than the onset of neurodegeneration and related cerebral Aβ accumulation in animal models used to study AD pathology [30, 31].
The exact functions of Aβ within the eye remain elusive and require further investigation. However, emerging research has proposed that this peptide may possess potent antimicrobial properties in the brain, which could extend to its actions within the retina [32]. Aβ42 has been found to be more neurotoxic in the retina and is present throughout the retina for various neurodegenerative disorders. Besides the accessibility of the neuroretina for non-invasive imaging, retina and CNS share several similarities in terms of their development, structure, and disease pathophysiology. Therefore, retina serves as valuable model for studying neurodegenerative disease affecting the CNS such as AD. Several recent studies have focused on investigating the role of Aβ42 in the retina and its potential as a biomarker for AD progression [33–35].
Aluminum exposure induced alterations in the molecular structure of the retina, which were identified using FTIR spectroscopy in our study. These alterations were evidenced by changes observed in the absorption frequencies and bandwidth of functional groups analyzed from the samples administrated with AlCl3. The alterations in the frequencies and bandwidths of NH-OH vibrational bands caused by AlCl3 reveal changes in hydrogen bond formation/destruction, as these bands are present in membrane components such as lipids, proteins, and genetic material [36]. The OH bond’s vibrational characteristic, particularly the strOH asym mode, displayed a decrease in band position upon AlCl3 administration for 4 and 6 weeks. This strongly suggests that there is intramolecular hydrogen bonding occurring. The administration of AlCl3 over an extended period of time (8 weeks) caused broadening of the OHsym band, providing confirmation that a hydrogen bond has indeed been formed. The hydrogen bond network surrounding proteins is closely linked to this common feature, making it a useful indicator for changes in retinal structure caused by varying hydration levels [37].
The CH stretched region in IR spectroscopy is a crucial aspect in characterizing the lipid structure of tissue samples. In particular, an increase in the asymCH2 bandwidth can be indicative of an elevation in the degree of acyl-chain disorder within these tissues. In all AlCl3-treated groups, the vibration mode of CH region displayed some restriction degree. This observed restriction demonstrates the change occurs in the packing of retinal lipids. This change in lipid-hydrocarbon chain packing impacts an important membrane characteristic, phase transition, and consequently affects retinal function. Furthermore, the absence of CH vibrational mode in the retinal degeneration case was previously documented as lipid-related phenomenon that is associated with the denaturation of the protein structure [38]. This highlights the importance of proper lipid packing for maintaining retinal function and preventing degeneration, as changes in lipid structure can greatly impact the protein structure and function within the retina [21].
The bands of symCH2 bond were shifted to higher wavenumber in all experimental groups treated with AlCl3, which implies an increase in the gauche bonds within the acyl chains of lipids bilayers present in the retina samples investigated. The analysis of the symCH2 band position can provide important insight into changes in the lipid bilayer structure and conformation. The band situated at ≤2850 cm–1 in highly conformational order is a significant indicator of the intricately structured orthorhombic phase. This observation has been validated by this study’s control retinae, which exhibit a similar pattern with precise arrangement and alignment. However, upon exposure to AlCl3, there is an observable shift in this band towards ≥2854 cm–1 indicating that lipid structures had transitioned from their hexagonal phase to fluid-phase arrangements [39]. The alterations in the conformational order of the membrane can be attributed to the upsurge in the relative quantity of gauche rotamers. It is noteworthy that an increased number of such rotamers results in a more disordered membrane structure, indicating a significant reduction in acyl chain packing.
Ratiometric analysis is an invaluable tool for discerning the molecular transformations that take place in retinae due to AlCl3 exposure. The asymCH2/symCH2 absorption intensity ratio effectively reveals alterations in lipid chain length and branching, with a diminished ratio value indicating depleted lipid content [40].
The fingerprint region analysis focuses on the vibrational mode variations of the amide II band, which results from coupling between CN stretching and N-H group’s in-plane bending. In this study, the observed increase in amide II vibration modes in AlCl3-treated groups for 4, 6, and 8 weeks indicates its impact. In addition to these findings, it has been observed that certain vibrations modes of infrared bands (CH2bend, COOsym, and CH3 deform) either appear or disappear due to carbonization as well as degeneration of biological tissues leading to loss of function, findings supported by previous research conducted by Zezell et al. [41]. Another potential reason for such variations could be attributed transcriptional regulation effect according to the previous studies by [42].
By referring to the absorption intensity ratios of asymPO2/symPO2 illustrated in Table 4 and taking into account the values associated with the hydrated phosphate group as indicated by Brogna et al. [43], it is evident that a paradox effect was observed. This paradox effect consisted of the presence of dehydrated phosphate groups after 2 and 4 weeks of AlCl3 administration. However, as the period of administration extended to 6 and subsequently to 8 weeks, an unexpected enhancement in the phosphorylation process became evident instead.
According to the PCA observations which reveal the discrimination between groups of rats administered with AlCl3 for 6 and 8 weeks and those who administered with AlCl3 for shorter periods (2 and 4 weeks), this analysis showed that the significant alteration in the retinal molecular structure is associated with the durations of AlCl3 exposure, which highlight time as an essential parameter in causing molecular structural changes in the retina due to AD.
Conclusion
The study concluded that some aspects of the pathology of AD were induced in rats by administration of AlCl3 for 6 weeks and accumulation of Aβ42 in retina precedes brain due to AD. Changes in hydrogen bond formation or destruction, alterations in lipid chain length and branching accompanied by depleted lipid content and carbonization, as well as degeneration of the retina leading to loss of function, are due to AD.
ACKNOWLEDGMENTS
The authors have no acknowledgments to report.
FUNDING
The authors have no funding to report.
CONFLICT OF INTEREST
The authors have no conflict of interest to report.
DATA AVAILABILITY
Data is available upon request.
REFERENCES
[1] | Walsh S , Govia I , Wallace L , Richard E , Peters R , Anstey KJ , Brayne C ((2022) ) A whole-population approach is required for dementia risk reduction, Lancet Healthy Longev 3: , e6–e8. |
[2] | Alzheimer’s Association ((2022) ) 2022 Alzheimer’s disease facts and figures, Alzheimers Dement 18: , 700–789. |
[3] | Hampel H , Hardy J , Blennow K , Chen C , Perry G , Kim SH , Villemagne VL , Aisen P , Vendruscolo M , Iwatsubo T , Masters CL , Cho M , Lannfelt L , Cummings JL , Vergallo A ((2021) ) The amyloid-β pathway in Alzheimer’s disease, Mol Psychiatry 26: , 5481–5503. |
[4] | Wang J , Gu BJ , Masters CL , Wang YJ ((2017) ) A systemic view of Alzheimer disease — insights from amyloid-β metabolism beyond the brain, Nat Rev Neurol 13: , 612–623. |
[5] | Friedberg JS , Aytan N , Cherry JD , Xia W , Standring OJ , Alvarez VE , Nicks R , Svirsky S , Meng G , Jun G , Ryu H , Au R , Stein TD ((2020) ) Associations between brain inflammatory profiles and human neuropathology are altered based on apolipoprotein E ɛ4 genotype, Sci Rep 10: , 2924. |
[6] | Zeng J , Libien J , Shaik F , Wolk J , Hernández AI ((2016) ) Nucleolar PARP-1 expression is decreased in Alzheimer’s disease: Consequences for epigenetic regulation of rDNA and cognition, Neural Plast 2016: , 8987928. |
[7] | Bates KA , Verdile G , Li QX , Ames D , Hudson P , Masters CL , Martins RN ((2009) ) Clearance mechanisms of Alzheimer’s amyloid-β peptide: Implications for therapeutic design and diagnostic tests, Mol Psychiatry 14: , 469–486. |
[8] | Long JM , Holtzman DM ((2019) ) Alzheimer disease: An update on pathobiology and treatment strategies, Cell 179: , 312–339. |
[9] | Islam F , Shohag S , Akhter S , Islam MR , Sultana S , Mitra S , Chandran D , Khandaker MU , Ashraf GM , Idris AM , Emran TB , Cavalu S ((2022) ) Exposure of metal toxicity in Alzheimer’s disease: An extensive review, Front Pharmacol 13: , 903099. |
[10] | Sanajou S , Erkekoğlu P , Sahin G , Baydar T ((2023) ) Role of aluminum exposure on Alzheimer’s disease and related glycogen synthase kinase pathway, Drug Chem Toxicol 46: , 510–522. |
[11] | Zhao Y , Dang M , Zhang W , Lei Y , Ramesh T , Veeraraghavan VP , Hou X ((2020) ) Neuroprotective effects of Syringic acid against aluminium chloride induced oxidative stress mediated neuroinflammation in rat model of Alzheimer’s disease, J Funct Foods 71: , 104009. |
[12] | Alawdi SH , El-Denshary ES , Safar MM , Eidi H , David MO , Abdel-Wahhab MA ((2017) ) Neuroprotective effect of nanodiamond in Alzheimer’s disease rat model: A pivotal role for modulating NF-κB and STAT3 signaling, Mol Neurobiol 54: , 1906–1918. |
[13] | Depciuch J , Zawlik I , Skrzypa M , Pajak J , Potocka N , Łach K , Bartosik-Psujek H , Koziorowska A , Kaznowska E , Cebulski J ((2019) ) FTIR spectroscopy of cerebrospinal fluid reveals variations in the lipid: Protein ratio at different stages of Alzheimer’s disease, J Alzheimers Dis 68: , 281–293. |
[14] | Correia M , Lopes J , Silva R , Martins Rosa I , Henriques AG , Delgadillo I , Da Cruz Silva E OAD , Nunes A ((2016) ) FTIR spectroscopy - a potential tool to identify metabolic changes in dementia patients, J Alzheimers Neurodegener Dis 2: , 007. |
[15] | Leskovjan AC , Kretlow A , Miller LM ((2010) ) Fourier transform infrared imaging showing reduced unsaturated lipid content in the hippocampus of a mouse model of Alzheimer’s disease, Anal Chem 82: , 2711–2716. |
[16] | Majeed A , Marwick B , Yu H , Fadavi H , Tavakoli M ((2021) ) Ophthalmic biomarkers for Alzheimer’s disease: A review, Front Aging Neurosci 13: , 720167. |
[17] | Chen X , Zhang M , Ahmed M , Surapaneni KM , Veeraraghavan VP , Arulselvan P ((2021) ) Neuroprotective effects of ononin against the aluminium chloride-induced Alzheimer’s disease in rats, Saudi J Biol Sci 28: , 4232–4239. |
[18] | Sayed NH , Fathy N , Kortam MA , Rabie MA , Mohamed AF , Kamel AS ((2020) ) Vildagliptin attenuates Huntington’s disease through activation of GLP-1 receptor/PI3K/Akt/BDNF pathway in 3-nitropropionic acid rat model, Neurotherapeutics 17: , 252–268. |
[19] | Lin SY , Li MJ , Liang RC , Lee SM ((1998) ) Non-destructive analysis of the conformational changes in human lens lipid and protein structures of the immature cataracts associated with glaucoma, Spectrochim Acta A Mol Biomol Spectrosc 54: , 1509–1517. |
[20] | Severcan F , Toyran N , Kaptan N , Turan B Fourier transform infrared study of the effect of diabetes on rat liver and heart tissues in the C–H region, Talanta 53: , 55–59. |
[21] | Gaber HA , Aly EM , Mohamed ES , Elfouly M , Talaat MS , El-Sayed EM ((2000) ) ((2023) ) Prognosis of biomarker of Alzheimer’s disease in the function of the retina and secondary molecular structure variation of the retina and brain, Int J Alzheimers Dis 2023: , 9775921. |
[22] | Sethi P , Jyoti A , Singh R , Hussain E , Sharma D ((2008) ) Aluminium-induced electrophysiological, biochemical and cognitive modifications in the hippocampus of aging rats, Neurotoxicology 29: , 1069–1079. |
[23] | Platt B , Haas H , Büsselberg D ((1994) ) Aluminium reduces glutamate activated currents of rat hippocampal neurons, Neuroreport 5: , 2329–2332. |
[24] | Praticò D , Uryu K , Sung S , Tang S , Trojanowski JQ , Lee VM ((2002) ) Aluminum modulates brain amyloidosis through oxidative stress in APP transgenic mice, FASEB J 16: , 1138–1140. |
[25] | Chen SM , Fan CC , Chiue MS , Chou C , Chen JH , Hseu RS ((2013) ) Hemodynamic and neuropathological analysis in rats with aluminum trichloride-induced Alzheimer’s disease, PLoS One 8: , e82561. |
[26] | Panahi N , Mahmoudian M , Mortazavi P , Hashjin GS ((2013) ) Effects of berberine on β-secretase activity in a rabbit model of Alzheimer’s disease, Arch Med Sci 9: , 146–150. |
[27] | Kawahara M , Kato M , Kuroda Y ((2001) ) Effects of aluminum on the neurotoxicity of primary cultured neurons and on the aggregation of β-amyloid protein, Brain Res Bull 55: , 211–217. |
[28] | De Strooper B , Vassar R , Golde T ((2010) ) The secretases: Enzymes with therapeutic potential in Alzheimer disease, Nat Rev Neurol 6: , 99–107. |
[29] | Yoon SS , Jo SA ((2012) ) Mechanisms of amyloid-β peptide clearance: Potential therapeutic targets for Alzheimer’s disease, Biomol Ther (Seoul) 20: , 245–55. |
[30] | Koronyo-Hamaoui M , Koronyo Y , Ljubimov AV , Miller CA , Ko MK , Black KL , Schwartz M , Farkas DL ((2011) ) Identification of amyloid plaques in retinas from Alzheimer’s patients and noninvasive optical imaging of retinal plaques in a mouse model, Neuroimage 54: , S204–S217. |
[31] | Criscuolo C , Cerri E , Fabiani C , Capsoni S , Cattaneo A , Domenici L ((2018) ) The retina as a window to early dysfunctions of Alzheimer’s disease following studies with a 5xFAD mouse model, Neurobiol Aging 67: , 181–188. |
[32] | Kumar DK , Choi SH , Washicosky KJ , Eimer WA , Tucker S , Ghofrani J , Lefkowitz A , McColl G , Goldstein LE , Tanzi RE , Moir RD ((2016) ) Amyloid-beta peptide protects against microbial infection in mouse and worm models of Alzheimer’s disease, Sci Transl Med 8: , 340ra72. |
[33] | Dumitrascu OM , Lyden PD , Torbati T , Sheyn J , Sherzai A , Sherzai D , Sherman DS , Rosenberry R , Cheng S , Johnson KO , Czeszynski AD , Verdooner S , Frautschy S , Black KL , Koronyo Y , Koronyo-Hamaoui M ((2020) ) Sectoral segmentation of retinal amyloid imaging in subjects with cognitive decline, Alzheimers Dement (Amst) 12: , e12109. |
[34] | Yang J , Yang J , Li Y , Xu Y , Ran C ((2019) ) Near-infrared fluorescence ocular imaging (NIRFOI) of Alzheimer’s disease, Mol. Imaging Biol 21: , 35–43. |
[35] | Hadoux X , Hui F , Lim JKH , Masters CL , Pébay A , Chevalier S , Ha J , Loi S , Fowler CJ , Rowe C , Villemagne VL , Taylor EN , Fluke C , Soucy JP , Lesage F , Sylvestre JP , Rosa-Neto P , Mathotaarachchi S , Gauthier S , Nasreddine ZS , Arbour JD , Rhéaume MA , Beaulieu S , Dirani M , Nguyen CTO , Bui BV , Williamson R , Crowston JG , van Wijngaarden P ((2019) ) Non-invasive hyperspectral imaging of the retina for potential biomarker use in Alzheimer’s disease, Nat Commun 10: , 4227. |
[36] | Kumar S , Chaudhary S , Jain DC ((2014) ) Vibrational studies of different human body disorders using FTIR spectroscopy, Open J Appl Sci 04: , 103–129. |
[37] | Bridelli MG ](2017) Fourier transform infrared spectroscopy in the study of hydrated biological macromolecules. In Fourier Transform, Goran SN, Milorad DC, Dragan JC, eds. IntechOpen, Rijeka, pp. 191-213. |
[38] | Szalontai B , Kóta Z , Nonaka H , Murata N ((2003) ) Structural consequences of genetically engineered saturation of the fatty acids of phosphatidylglycerol in tobacco thylakoid membranes. An FTIR study, Biochemistry 42: , 4292–4299. |
[39] | Beddoes CM , Rensen DE , Gooris GS , Malfois M , Bouwstra JA ((2021) ) The importance of free fatty chain length on the lipid organization in the long periodicity phase, Int J Mol Sci 22: , 3679. |
[40] | Yu P , Christensen CR , Christensen DA , McKinnon JJ ((2005) ) Ultrastructural-chemical makeup of yellow-seeded (Brassica rapa) and brown-seeded (Brassica napus) canola within cellular dimensions, explored with synchrotron reflection FTIR microspectroscopy, Can J Plant Sci 85: , 533–541. |
[41] | Zezell DM , Benetti C , Veloso MN , Castro PA , Ana PA ((2015) ) FTIR spectroscopy revealing the effects of laser and ionizing radiation on biological hard tissues, J Braz Chem Soc 26: , https://doi.org/10.5935/0103-5053.20150246. |
[42] | Lima EB , Sousa CN , Meneses LN , Ximenes NC , Santos Júnior MA , Vasconcelos GS , Lima NB , Patrocínio MC , Macedo D , Vasconcelos SM ((2015) ) Cocos nucifera (L.) (Arecaceae): A phytochemical and pharmacological review, Braz J Med Biol Res 48: , 953–964. |
[43] | Brogna R , Oldenhof H , Sieme H , Wolkers WF ((2020) ) Spectral fingerprinting to evaluate effects of storage conditions on biomolecular structure of filter-dried saliva samples and recovered DNA, Sci Rep 10: , 21442. |


