
Prognostic and Predictive Factors in Early Alzheimer’s Disease: A Systematic Review
Abstract
Background:
Alzheimer’s disease (AD) causes progressive decline of cognition and function. There is a lack of systematic literature reviews on prognostic and predictive factors in its early clinical stages (eAD), i.e., mild cognitive impairment due to AD and mild AD dementia.
Objective:
To identify prognostic factors affecting eAD progression and predictive factors for treatment efficacy and safety of approved and/or under late-stage development disease-modifying treatments.
Methods:
Databases were searched (August 2022) for studies reporting prognostic factors associated with eAD progression and predictive factors for treatment response. The Quality in Prognostic Factor Studies tool or the Cochrane risk of bias tool were used to assess risk of bias. Two reviewers independently screened the records. A single reviewer performed data extraction and quality assessment. A second performed a 20% check. Content experts reviewed and interpreted the data collected.
Results:
Sixty-one studies were included. Self-reporting, diagnosis definition, and missing data led to high risk of bias. Population size ranged from 110 to 11,451. Analyses found data indicating that older age was and depression may be associated with progression. Greater baseline cognitive impairment was associated with progression. APOE4 may be a prognostic factor, a predictive factor for treatment efficacy and predicts an adverse response (ARIA). Elevated biomarkers (CSF/plasma p-tau, CSF t-tau, and plasma neurofilament light) were associated with disease progression.
Conclusions:
Age was the strongest risk factor for progression. Biomarkers were associated with progression, supporting their use in trial selection and aiding diagnosis. Baseline cognitive impairment was a prognostic factor. APOE4 predicted ARIA, aligning with emerging evidence and relevant to treatment initiation/monitoring.
INTRODUCTION
Alzheimer’s disease (AD) and other neurodegenerative diseases causing dementia are a substantial health and societal challenge. An estimated 57 million people globally were living with dementia in 2019 and this is expected to increase to more than 150 million by 2050 [1]. AD is the most common form of dementia and accounts for 60–80% of cases [2].
AD is characterized by cognitive deficits that manifest as decline in memory, reasoning, and thinking, as well as changes in function and behavior [3]. AD is a progressive condition, although the rate of decline is heterogeneous among patients [4]. AD progression can be divided into three phases: 1) preclinical disease, 2) mild cognitive impairment (MCI, also known as prodromal AD), and 3) clinically apparent dementia [5]. The early clinical stages of AD (eAD) are defined as MCI due to AD and mild AD dementia [3].
AD is defined by neuropathologic changes, including amyloid-β (Aβ) plaques comprised of aggregated Aβ, neurofibrillary tangles containing aggregated tau proteins, and neurodegeneration [6]. Although, there is no cure for AD, there are treatment options—anti-amyloid monoclonal antibodies—that have been recently approved in the US (aducanumab [7] and lecanemab [8]) and more that are currently in late-stage clinical trials or under review (donanemab, remternetug) [9, 10]. As of early 2022, there are more than 140 agents in clinical trials for AD [11].
Randomized controlled trials (RCTs) of anti-amyloid monoclonal antibodies show marked reduction of plaque amyloid on amyloid PET. The US Food and Drug Administration (FDA) accepted this biomarker change as reasonably likely to predict clinical benefit from treatment with lecanenamb and aducanumab and granted accelerated approval on that basis [7, 8]. Results from lecanemab confirmed the “reasonably likely” hypothesis by demonstrating clinical benefit in a Phase 3 clinical trials and being granted with full approval in the US [12, 13].
Most of the published reviews on prognostic factors focus on progression from pre-clinical stages to either MCI or dementia or MCI to dementia. Despite many single studies having evaluated factors that are prognostic of the natural history of AD in its early clinical stages or that may be predictive of the efficacy and safety of current treatments, there is a lack of systematic literature reviews (SLRs) that have collated this evidence. Therefore, the present systematic review was conducted to synthesize evidence on prognostic factors associated with eAD progression and predictive factors for treatment efficacy and safety.
METHODS
Study identification
Literature searches and study selection
The systematic review protocol was pre-registered in the International Prospective Register of Systematic Reviews (PROSPERO) and can be accessed at https://www.crd.york.ac.uk/prospero/display_record.php?ID=CRD42022358716. Reporting aligns with the Preferred Reporting Items for Systematic Reviews and Meta-Analyses (PRISMA) statement and checklists can be found in Supplementary Tables 1 and 2 [14].
Table 1
Eligibility criteria for systematic literature review
| Inclusion criteria | Exclusion criteria | |
| Population | •Mild cognitive impairment or mild dementia due to AD (also referred to as early AD) | •Familial AD •Moderate to severe dementia due to AD •Any other dementia not caused by AD (e.g. vascular dementia, Lewy body dementia, mixed dementia, etc.) |
| Intervention | •No restrictions for prognostic studies •For predictive studies, approved or under late-stage development disease-modifying treatments: ∘ Aducanumab ∘ Donanemab ∘ Gantenerumab ∘ Lecanemab | •NA |
| Index prognostic factor | •No restrictions however examples may include: •Risk factors (age, sex, smoking, co-morbidities) •Symptoms (depression) •Global performance (MMSE, FAQ) •Biomarkers •Imaging biomarker •Genetic factors such as APOE | •NA |
| Comparator prognostic factors | •No restrictions | •NA |
| Outcomes* | •No restrictions for prognostic studies however examples may include: ∘ Progression from one clinical state to another (MCI due to AD to AD) ∘ Progression measured an outcome measure (MMSE, CDR-SB) •No restrictions for prediction studies however outcomes may typically be categorized as ∘ Efficacy outcomes (as measured by MMSE, CDR-SB) ∘ Safety outcomes (ARIA) | •NA |
| Timing | •No restrictions | •NA |
| Setting | •Predictive factors ∘ Clinical setting (Randomized controlled trials) •Prognostic factors ∘ Clinical and real-world setting (Prospective cohort studies, Retrospective cohort studies) •Systematic literature reviews | •Preclinical/animal studies •Cross-sectional studies •Case series •Case reports |
| Language | •English language publications only | •NA |
| Publication type | •Full publications only | •Conference abstracts |
| Publication date | •2011 onwards |
AD, Alzheimer’s disease; APOE, apolipoprotein E; ARIA, amyloid related imaging abnormalities, CDR-SB, clinical dementia rating scale –sum of boxes; FAQ, functional activities questionnaire; HR, hazard ratio; MCI, mild cognitive impairment; MMSE, Mini-Mental State Examination; NA, not applicable; OR, odds ratio; RR, risk ratio. *Association of prognostic factors and progression reported as HR, RR, or OR.
Systematic literature searches were performed on 3 August 2022 to identify prognostic factors associated with eAD progression and predictive factors associated with treatment outcomes (efficacy and safety) with high-clearance anti-amyloid monoclonal antibodies. A combination of subject heading terms and text words were used to identify relevant publications in the following electronic bibliographic databases (searched via Ovid): Embase, Evidence-based medicine (EBM) Reviews, and Medline (Epub Ahead of Print and In-Process, In-Data-Review & Other Non-Indexed Citations). A full search strategy is presented in Supplementary Table 3. The reference lists of the included studies and an associated SLR of RCTs evidence of high-clearance amyloid-beta-targeting monoclonal antibodies for the treatment of eAD (https://www.crd.york.ac.uk/prospero/display_record.php?ID=CRD42022360446) were also searched to identify relevant evidence.
Two reviewers independently performed title and abstract screening followed by full paper screening using the inclusion and exclusion criteria presented in Table 1. Data were extracted by a single reviewer based the checklist for critical appraisal and data extraction for systematic reviews of prediction modelling studies (CHARMS) checklist [15] and a second reviewer performed a 20% check. Any discrepancies were checked and resolved by a third reviewer. In summary, full publications of observational studies were included if they reported prognostic factors associated with disease progression in eAD (MCI and mild AD dementia). Full publications of RCTs were included if they reported factors affecting response to currently approved and/or under late stage of development, anti-amyloid monoclonal antibodies (aducanumab, donanemab, gantenerumab, or lecanemab [no dose restriction]) in eAD. Restrictions included full publications only, English language and studies published from 2005 onwards (to coincide with the year of last approved indication extension of an AD symptomatic treatment) [16].
AD is a well-researched disease area, and a high number of eligible studies were expected. Therefore, a mapping exercise informed by clinical experts was performed based on factors reported by multiple publications, study size (n > 100), further restriction of publication date (last 10 years) and prognostic and predictive factors at both title and abstract and full paper screening stage. A summary of mapped studies was presented to clinical experts via email and advice sought on which factors were most appropriate to prioritize.
Data extraction
The following data were extracted: study design, study location, data source, diagnostic criteria (for both MCI and AD), sex, age, follow up, population size, type of progression (e.g., MCI to AD, mild to moderate AD, decline in Mini-Mental State Examination (MMSE)), proportion who progressed, definition of prognostic/predictive factor, effect measure (hazard ratio (HR), odds ratio (OR), risk ratio (RR)), type of analysis and factors adjusted for. Data were extracted into tables by a single reviewer and a second reviewer performed a 20% check.
Risk of bias assessment
The QUIPS tool was used to assess risk of bias in observational studies [17], while the Cochrane risk of bias tool was used for randomized controlled trials [18]. The assessment was performed by a single reviewer and a 20% check conducted by a second reviewer. Any discrepancies were resolved by a third reviewer.
Data analysis and reporting
Data were analyzed separately for prognostic and predictive factors in eAD. Prognostic factors are measures associated with changes in prognosis in the natural course of disease. Evidence on prognostic factors was extracted from observational studies. Predictive factors are factors that are predictive of a greater benefit or greater harm in response to a given therapy and identified by comparing the effects of factors in treated versus untreated populations. RCTs are the most suitable studies to evaluate predictive factors because they apply the strictest approach to determine a cause-and-effect relationship.
The definitions of prognostic and predictive as applied to the biomarkers identified adhere to the Context of Use approach presented in the Biomarkers, Endpoints, and other Tools (BEST) Resource of the US Food and Drug Administration [19]. Predictive biomarker is defined by the finding that the presence or change in the biomarker predicts an individual or group of individuals more likely to experience a favorable or unfavorable effect from the exposure to a medical product or environmental agent. A prognostic biomarker is used to identify the likelihood of a clinical event, disease recurrence, or disease progression in patients with a disease or medical condition of interest.
Data interpretation
The findings of this SLR were reviewed by content experts who provided perspectives on the data collected.
Use of human or animal subjects
This study did not have any direct human or animal participants.
RESULTS
Search results
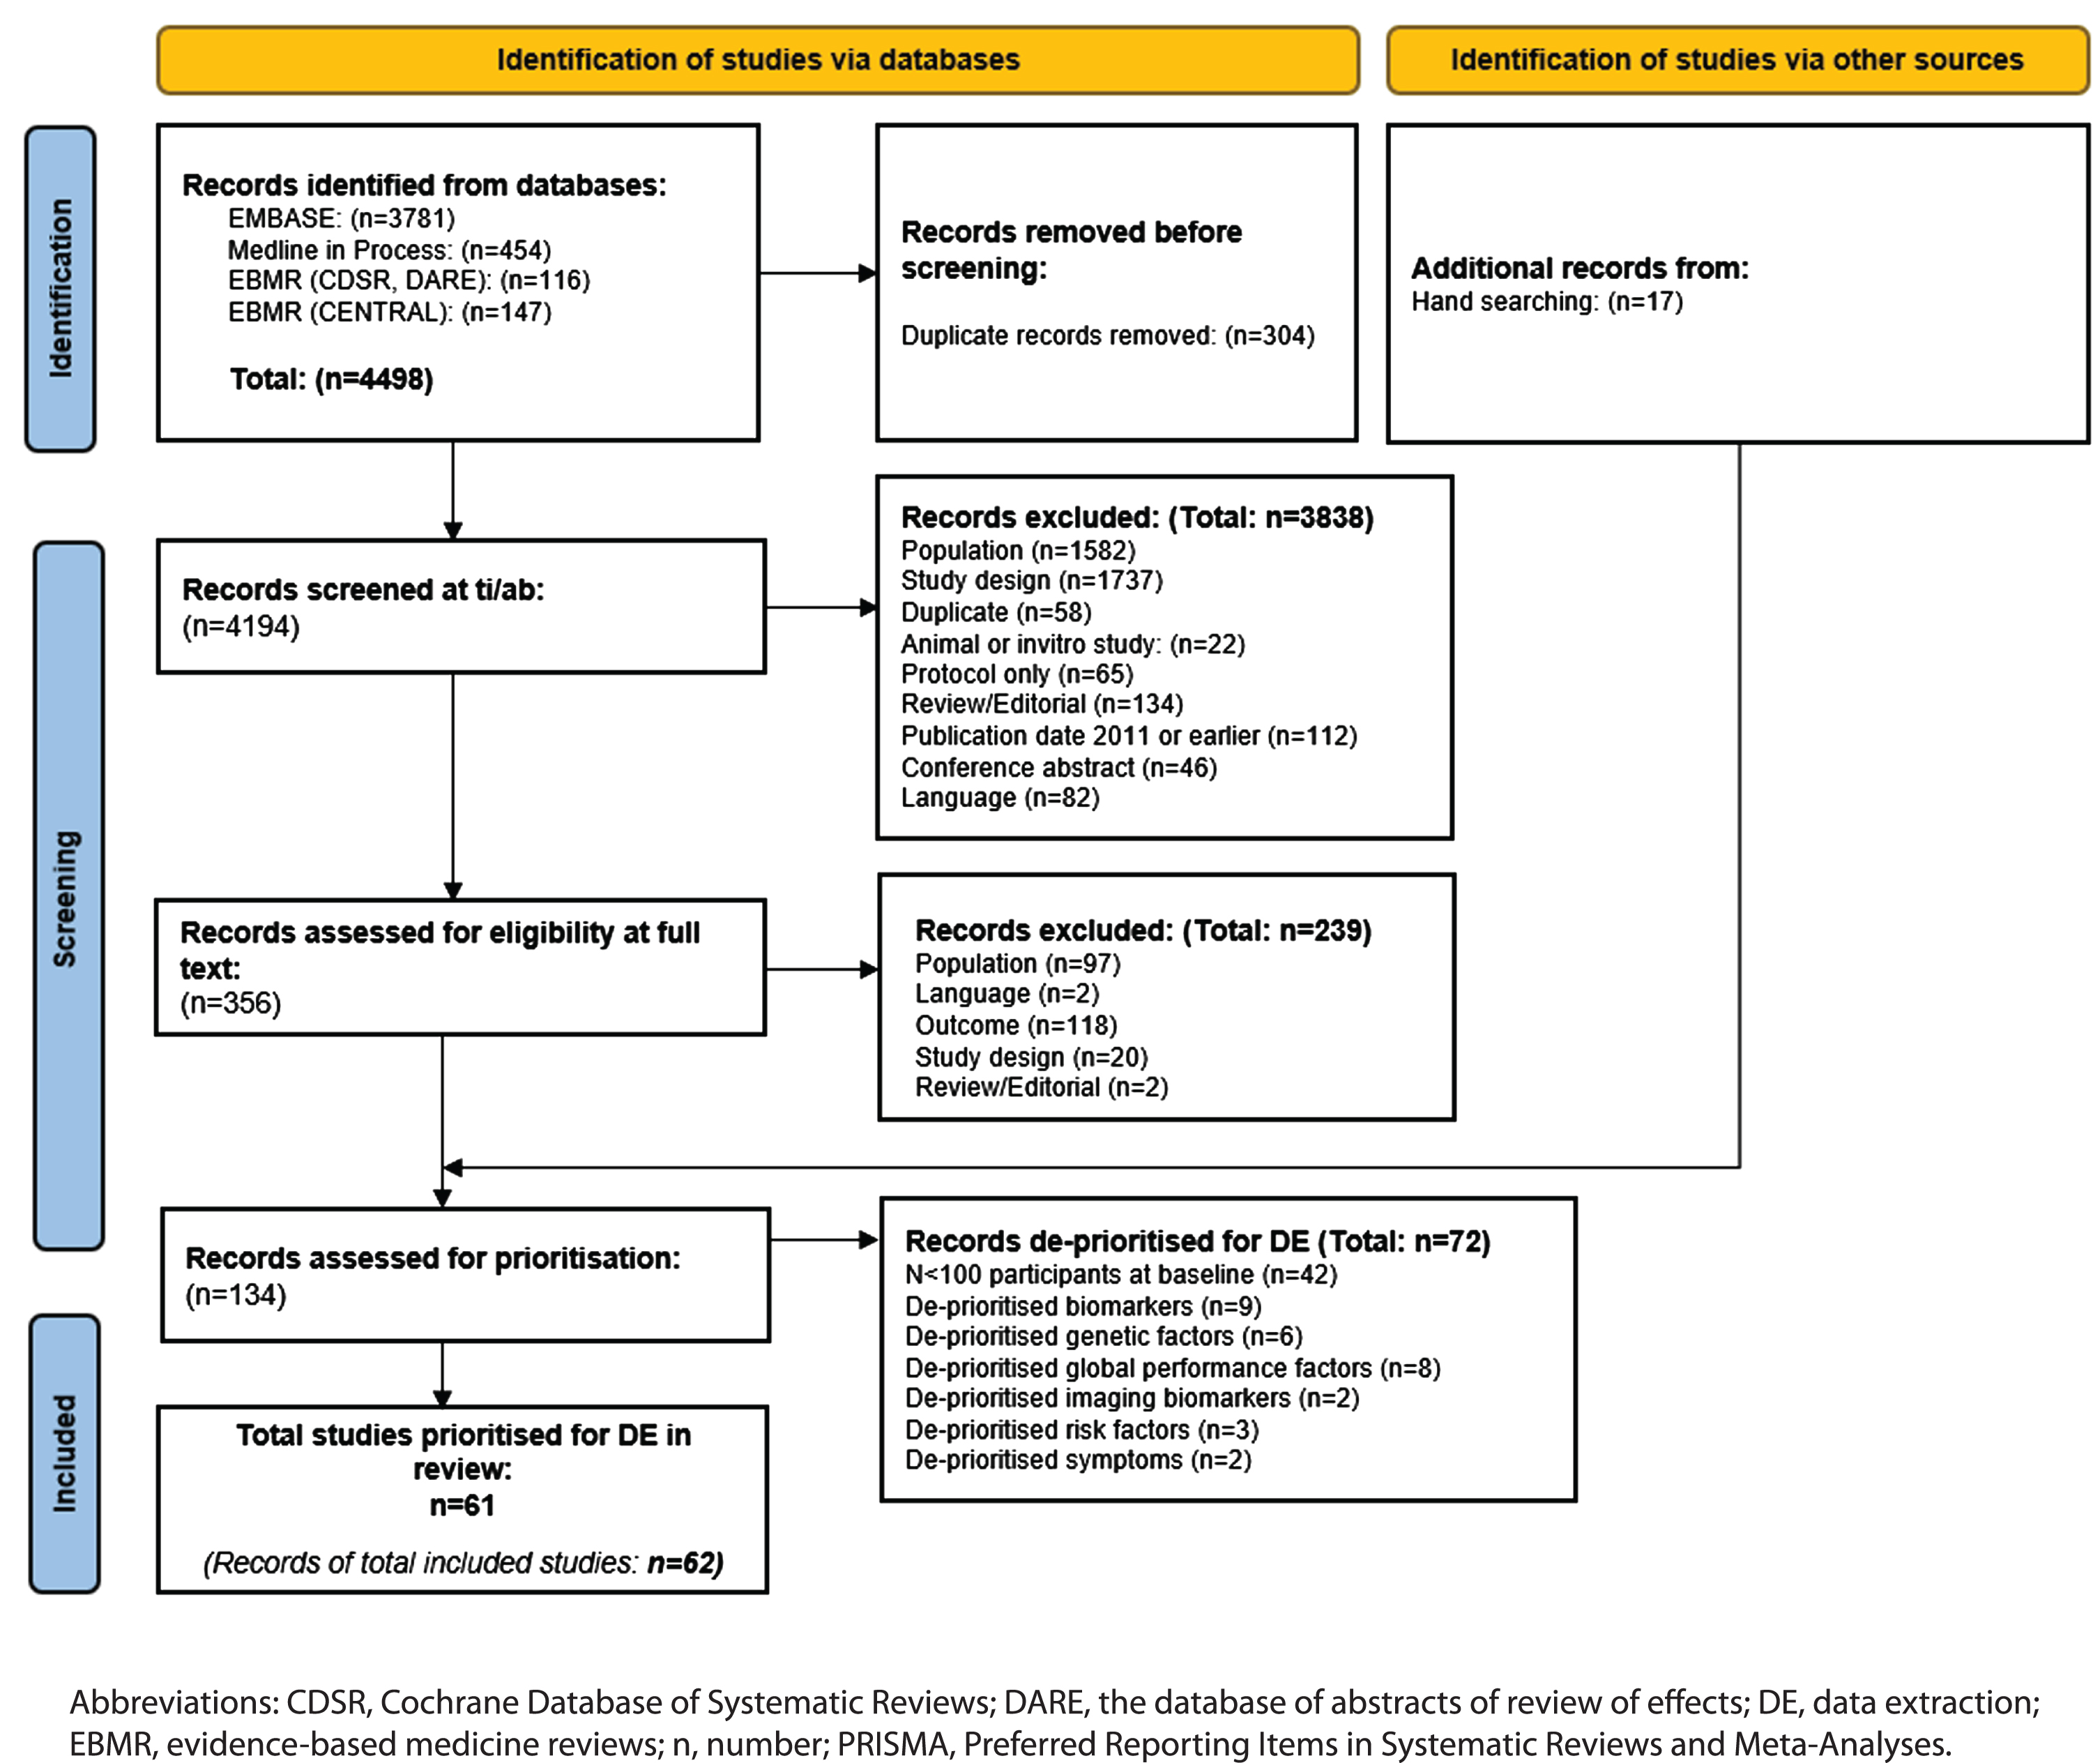
The PRISMA flow chart of record screening is presented in Fig. 1. A total of 4,498 records were retrieved by the database searches. Deduplication resulted in the removal of 304 records, leaving 4,194 eligible publications that were screened by title and abstract. A total of 356 records were screened by full text and 239 were excluded. Excluded studies and the reasons for exclusion are reported in Supplementary Table 5. A further 17 studies were identified by reference checking, giving 134 records that were eligible for prioritization. Following consultation with clinical experts, 62 records (61 studies) were prioritized for data extraction. The main reason for de-prioritization was study size, i.e., n < 100 (n = 41 studies; Supplementary Table 6).
Fig. 1
PRISMA flow chart.
Risk of bias assessment
The QUIPS risk of bias assessment tool showed that 42 of the included observational studies had a high risk of bias, 11 had a moderate risk, and 3 had a low risk (Supplementary Table 7). In general, studies had a high or moderate risk of bias due to methods of reporting prognostic factor measurement (self-reporting), outcome measurement (definition of diagnosis of AD), or study confounding (poor reporting of definitions).
The RoB2 risk of bias assessment tool showed that three studies had a high risk of bias and two had a moderate risk of bias (Supplementary Table 8). The main reasons for high risk of bias were missing data (i.e., loss to follow up, results not reported for all patients and missing data for cerebrospinal fluid (CSF) and magnetic resonance imaging (MRI) assessments) and measurement of the outcomes (i.e., it was unclear if outcome assessors were blinded).
Characteristics of included studies
A summary of the characteristics of the 61 included studies is presented in Table 2 (all RCTs and observational studies at low or moderate risk of bias) and Supplementary Table 4 (observational studies at high risk of bias). Overall, 41 of the studies had a retrospective cohort design while 15 were prospective cohort studies. Five RCTs were included. Most studies (n = 32) were conducted in North America, while 16 were conducted in Europe, eight in Asia, and five were worldwide. The population size ranged from 110 [20] to 11,451 [21]. The maximum follow-up duration was up to 15 years [22].
Table 2
Included studies
| Study | Country | Study design | Population n | Diagnostic criteria | Diagnostic use | Female: N (%) | Mean age | Follow up | ||
| (centers) | (source, date) | MCI due to AD | AD dementia | CSF | PET | (SD)* | ||||
| Prognostic factors | ||||||||||
| Cullen 2021 [28] •• | BioFINDER Sweden Multiple (n = NR) ADNI USA, Canada | Retrospective cohort BioFINDER Dates: July 2008 to June 2019 ADNI Dates: Sep 2005 and Dec 2019 | BioFINDER MCI: n = 340 ADNI MCI: n = 543 | BioFINDER Petersen criteria (Petersen 2004) ADNI NR | BioFINDER DSM-5 criteria ADNI NINCDS-ADRDA criteria (McKhann 1984) | NR | NR | BioFINDER 54 (36.5) ADNI 42 (51.2) | BioFINDER 71.36 (5.47) ADNI 71.51 (7.59) | 4 y |
| Janelidze 2020 [51] •• | Sweden (Multicenter: n = 2) USA (Single center n = 1) | Prospective cohort (Swedish BioFINDER study and Arizona Study of Aging and Neurodegenerative Disorders/Brain and Body Donation Program) Dates: NR | MCI: n = 125 | Petersen criteria (Petersen 2004) | As reported in BIOFINDER | NR | NR | 48 (38.4) | Range: 63-76 | 4.9 y |
| Lee 2012 [25] •• | South Korea Multicenter (n = 56) | Prospective cohort (Nationwide hospital-based cohort from Clinical Research Center for Dementia of South Korea) Dates: 2006 to 2010 | MCI: n = 504 | Petersen criteria (Winbland 2004) | NINCDS-ADRDA criteria (McKhann 1984) | NR | NR | 325 (64.5) | 70.8 (NR) | 1.47 y (Range: 5.5 mo to 5 y) |
| LoBue 2018 [27] •• | Canada, USA Multiple (n = 34) | Retrospective cohort (ADNI) Dates: Sep 2005 to Jun 2015 | MCI: n = 2719 | Peterson 2005 | NINCDS/ADRDA criteria (McKhann 1984) | NR | NR | 1342 (49.4) | NR | Median: 4 y (IQR 2 to 5 y) |
| Mouchet 2021 [35] •• | USA Multiple (n = NR) | Prospective cohort (NACC UDS) Dates: Sep 2005 to Feb 2019 | MCI: n = 830 | Albert 2011 | McKhann 2011 | NR | NR | 483 (58.2) | 78.5 (8.8) | Mean 3.6 y (SD: 2.5; Range: 0–11) |
| Palmqvist 2021 [29] • | ADNI: USA, Canada Multiple (n = NR) BioFINDER: Sweden Multiple (n = NR) | Retrospective cohort ADNI Dates 2003 to 2019 BioFINDER Dates: 2010 to 2014 | BioFINDER MCI: n = 148 ADNI MCI: n = 86 | BioFINDER Petersen 2004 ADNI Subjective memory concern; abnormal memory function score MMSE score between 24 and 30, CDR = 0.5, preserved cognition and functional performance | BioFINDER NINCDS/ADRDA criteria (McKhann 2011) were Aβ-positive according to the Aβ PET scan (Landau 2012) ADNI NINCDS/ADRDA criteria (McKhann 2011) | NR | Yes | BioFINDER 283 (52.1) ADNI 168 (49.4) | NR | 4 y |
| Pichet Binette 2022 [20] • | USA Unclear (n = NR) | Retrospective cohort NCT01028053 Dates: 2009 to 2014 | MCI: n = 110 | Peterson 2005 | McKhann 2011 | Y | Y | 52 (47.3) | NR | 3 y |
| Pyun 2017 [26] •• | Canada, USA Multicenter (n = NR) | Retrospective cohort (ADNI) Dates: 2003 to 25th May 2017 | MCI: n = 258 | Presence of objective memory impairment but without meeting the criteria for dementia | As described in ADNI | NR | NR | 101 (39.1) | Median: 74.1 (IQR: 69.5–78.5) | Up to 3 y; Median 24 mo |
| Richard 2012 [23] •• | Canada, USA Multiple (n > 50) | Retrospective cohort (ADNI) Dates: 2003 to Jun 2011 | MCI: n = 397 | As reported in the ADNI | As reported in the ADNI | NR | NR | 141 (35.5) | NR | Average: 2.7 y (SD 1.0) |
| Spalletta 2012 [34] • | Italy Multiple (n = 3) | Prospective cohort (Italian memory clinics) Dates NR | Mild AD dementia: n = 119 | NA | NINCDS-ADRDA criteria (McKhann 1984) | NR | NR | 67 (56.3) | 74.7 (6.3) | 1 y |
| Spencer 2019 [31] •• | Canada, USA Multiple (n = NR) | Retrospective cohort (ADNI) Dates: Aug 2005 and Sep 2007 | MCI: 185 | MMSE score between 24 and 30, a CDR rating of 0.5, both a subjective memory complaint and an objective memory impairment, intact ADL, and absence of dementia | Diagnosis of dementia at follow-up was determined by the study clinician. Criteria as described in the ADNI | NR | NR | 63 (34) | NR | Mean 4.3 y (SD: 2.8) |
| Therriault 2021 [30] •• | Canada, USA Multiple (n = NR) | Retrospective cohort (ADNI) Dates: NR to 2020 | MCI: n = 604 | CDR of 0.5, with the memory box score of at least 0.5, with preserved general cognitive performance | As reported in ADNI | NR | NR | 257 (42.5) | 72.2 (7.47) | Median 4.1 y (SD:1.34)* |
| Tosto 2014 [36] •• | Canada, USA Multicenter (n = NR) | Retrospective cohort (ADNI) Dates: NR | MCI:N=332 | Aged between 55 and 90 y; a memory symptom; objective evidence of abnormal memory; CDR score of 0.5, with a Memory Box score of at least 0.5; MMSE score between 24 and 30 (inclusive); preserved general cognition | NA | NR | NR | 118 (35) | 74.6 (7.4) | 48 mo |
| Van Loenhoud 2022 [52] • | Netherlands Single (n = 1) | Retrospective cohort (Amsterdam Dementia Cohort) Dates: 2000 and 2019 | MCI: n = 274 | Albert 2011 | McKhann 2011 | Y | Y | 130 (47.4) | 67.1 (7.4) | Median 2.3 y* |
| Wolfsgruber 2017 [33] •• | Germany Multiple (n = NR) | Retrospective cohort (German DCN) Dates: NR | MCI: n = 134 | Bondi 2014 | Dubois 2016 | Y | Y | 62 (46.3) | 65.5 (8.1) | 27.0 (0.95) mo |
| Xue 2020 [32] •• | Canada, USA Multiple (n > 50) | Retrospective cohort (ADNI) Dates: From 2003 | MCI: n = 193 | MMSE score between 24 and 30; CDR score of 0.5; objective memory loss preserved ADL, and the absence of dementia | NINCDS-ADRDA criteria (had MMSE scores between 20-26 and a CDR of 0.5 or 1.0) | NR | NR | 63 (32.6) | 74.4 (7.5) | NR |
| Budd Haeberlein 2022 [7] •• (Associated publication Salloway 2022 [37] | EMERGE: Multiple (n = 180) ENGAGE: Multiple (n = 181) | Two Phase 3 RCTs: EMERGE &ENGAGE Enrolment occurred from Aug 2015 to Jul 2018, and the trials were terminated early (Mar 21, 2019) based on a futility analysis. | eAD EMERGE Placebo: n = 548 Low dose: n = 543 High dose: n = 547 ENGAGE Placebo: n = 545 Low dose: n = 547 High dose: n = 555 | MCI due to AD or mild AD dementia, CDR of 0.5, objective evidence of cognitive impairment at screening, MMSE score of 24 to 30 | MCI due to AD or mild AD dementia, CDR of 0.5, objective evidence of cognitive impairment at screening, MMSE score of 24 to 30 | NR | Y | eAD EMERGE Placebo: 290 (53) Low dose: 269 (50) High dose: 284 (52) ENGAGE Placebo: 287 (53) Low dose: 284 (52) High dose: 292 (53) | eAD EMERGE Placebo: 70.8 (7.4) Low dose: 70.6 (7.4) High dose: 70.6 (7.5) ENGAGE Placebo: 69.8 (7.7) Low dose: 70.4 (7.0) High dose: 70.0 (7.7) | 78 weeks |
| Mintun 2021 [9] •• | Canada, USA Multiple (n = 56) | Phase 2 RCT: TRAILBLAZER-ALZ (donanemab versus placebo) | eAD Donanemab: n = 131 Placebo: n = 126 | Dubois 2007 | Dubois 2007 | NR | ✓ | Donanemab: 68 (51.9) Placebo: 65 (51.6) | Donanemab: 75.0 (5.6) Placebo: 75.4 (5.4) | 72 wk |
| Ostrowitzki 2017 [39] ••• | Worldwide Multiple (n = 128) | Phase 3 RCT: Scarlet RoAD (gantenerumab versus placebo) | Prodromal AD Placebo: n = 266 105 mg: n = 271 255 mg: n = 260 | Dubois 2007 | NA | ✓ | ✓ | NR | Placebo: 69.5 (7.5) 105 mg: 70.3 (7.0) 255 mg: 71.3 (7.1) | 2 y |
| Sevigny 2016 [38] •• | USA Multiple (n = 33) | Phase 1b RCT: PRIME (placebo versus multiple dose aducanumab) Oct 2012 to Jan 2014 | eAD Placebo: n = 40 1 mg/kg: n = 31 3 mg/kg: n = 32 6 mg/kg: n = 30 10 mg/kg: n = 32 | Derby 2013 Dubois 2010 | McKhann 2011 | NR | ✓ | Placebo: 23 (58) 1 mg/kg: 13 (42) 3 mg/kg: 17 (53) 6 mg/kg: 15 (50) 10 mg/kg: 15 (47) | Placebo: 72.8 (7.2) 1 mg/kg: 72.6 (7.8) 3 mg/kg: 70.5 (8.2) 6 mg/kg: 73.3 (9.3) 10 mg/kg: 73.7 (8.3) | 54 wk |
| Swanson 2021 [8] ••• | Worldwide Multiple (n = 169) | Phase 2b RCT: BAN2401-G000-201 (placebo versus multiple dose lecanemab) | Patients with MCI due to AD or mild AD dementia Dates: NR | eAD Placebo: n = 245 Lecanemab: n = 609 | NIAA-AA | NIAA-AA | ✓ | Placebo: 137 (58) 2.5 mg/kg biweekly: 26 (50) 5 mg/kg Monthly: 24 (50) 5 mg/kg Biweekly 48 (54) 10 mg/kg Monthly 110 (45) 10 mg/kg Biweekly 64 (42) | Median (range) Placebo: 72 (50–89) 2.5 mg/kg biweekly: 71 (50–86) 5 mg/kg Monthly: 71 (55–84) 5 mg/kg Biweekly 72 (52–87) 10 mg/kg Monthly 71 (53–90) 10 mg/kg Biweekly 73 (51–88) | 18 mo |
AD, Alzheimer’s Disease; ADL, Activities of daily living; ADNI, Alzheimer’s Disease Neuroimaging Initiative; CDR, The Clinical Dementia Rating; DCN, German Dementia Competence Network; DSM, Diagnostic and Statistical Manual of Mental Disorders; IQR, interquartile range; MCI, mild cognitive impairment; mo, month; MoCA, The Montreal Cognitive Assessment; MMSE, Mini-Mental State Examination; MSCI, Moderate/Severe Cognitive Impairment; NACC, National Alzheimer’s Coordinating Center; NIA-AA, National Institute on Aging and the Alzheimer’s Association criteria; NINCDS/ADRDA, National Institute of Neurological and Communicative Diseases and Stroke/Alzheimer’s Disease and Related Disorders Association; NR, not reported; PET, positron emission tomography; SD, standard deviation; UDS, uniform data set; wk, week; y, year. *Unless otherwise stated. •low risk of bias •• moderate risk of bias ••• high risk of bias.
Prognostic factors and their association with disease progression
Results of identified studies reporting prognostic factors associated with disease progression in terms of transition from one disease stage to another, i.e., MCI to AD or mild AD to moderate AD are summarized in Table 3. For the purposes of analysis, the focus was on observational studies with a low or moderate risk of bias.
Apathy. One study assessed the relationship between apathy and disease progression in non-depressed MCI patients [23] (Table 3). This study found that symptoms of apathy increased the risk of progression from MCI to AD in non-depressed patients over an average follow up of 2.7 years (HR 1.85; 95% CI 1.09, 3.15; p = not report [NR]) [23].
Table 3
Prognostic factors and their association with disease progression in eAD studies with low or moderate risk of bias
| Prognostic factor | Study | Population (N) | Measure of progression | Follow-up | Type of analysis | Statistical results | Effect on progression |
| Symptoms (apathy) | |||||||
| Using the GDS-15 assessment the presence of symptoms of apathy were dichotomized into any symptom versus no symptoms | Richard 2012 [23] •• | MCI N = 397 | MCI ⟶ AD | Average: 2.7 y (SD 1.0) | Cox proportional hazards models (adjusted for age, gender, education, and baseline MMSE score) | HR: 1.85; 95% CI: 1.09, 3.15; p = NR | Increase |
| Symptoms (depression) | |||||||
| Using the GDS-15 assessment the presence of symptoms of depressive affect were dichotomized into any symptom versus no symptoms | Richard 2012 [23] •• | MCI N = 397 | MCI ⟶ AD | Average: 2.7 y (SD 1.0) | Cox proportional hazards models (adjusted for age, gender, education, and baseline MMSE score) | HR: 1.15; 95% CI: 0.72, 1.83; p = NR | No evidence of effect |
| Risk factor (age) | |||||||
| Definition NR | Lee 2012 [25] •• | MCI N = 504 | MCI ⟶ AD | 1.47 y (Range: 5.5 mo to 5 y) | Multivariable Cox proportional hazards model analysis (adjusted model for age, education and KMMSE score) | OR: 1.03; 95% CI: 1.00, 1.06; p = 0.041 | Increase |
| Definition NR | Pyun 2017 [26] •• | MCI N = 258 | MCI ⟶ AD | Up to 3 y; Median 24 mo | Multivariate Cox regression analysis (adjusted for MTA, PA, age, sex, education, APOE ɛ4 carrier, ADAS-cog 11, CDR SB, and CSF p-tau) | HR: 0.996; 95% CI: 0.970, 1.023; p = NR | No evidence of effect |
| Risk factor (sex) | |||||||
| Female | Pyun 2017 [26] •• | MCI N = 258 | MCI ⟶ AD | Up to 3 y; Median 24 mo | Multivariate Cox regression analysis (adjusted for MTA, PA, age, sex, education, APOE ɛ4 carrier, ADAS-cog 11, CDR SB, and CSF p-tau) | HR: 1.152; 95% CI: 0.797, 1.665; p = NR | No evidence of effect |
| Risk factor (education) | |||||||
| Definition NR | Lee 2012 [25] •• | MCI N = 504 | MCI ⟶ AD | 1.47 y (Range: 5.5 mo to 5 y) | Multivariable Cox proportional hazards model analysis (adjusted model for age, education and KMMSE score) | OR: 1.08; 95% CI: 1.04, 1.13; p < 0.001 | Increase |
| Education duration | Pyun 2017 [26] •• | MCI N = 258 | MCI ⟶ AD | Up to 3 y; Median 24 mo | Multivariate Cox regression analysis (adjusted for MTA, PA, age, sex, education, APOE ɛ4 carrier, ADAS-cog 11, CDR SB, and CSF p-tau) | HR: 0.954; 95% CI: 0.900, 1.011; p = NR | No evidence of effect |
| Risk factor (amnesic MCI) | |||||||
| Amnesic MCI | Lee 2012 [25] •• | MCI N = 504 | MCI ⟶ AD | 1.47 y (Range: 5.5 mo to 5 y) | Multivariable Cox proportional hazards model analysis (adjusted model for age, education and KMMSE score) | OR: 2.47; 95% CI: 0.94, 6.52; p = 0.068 | No evidence of effect |
| Risk factor (traumatic brain injury) | |||||||
| Subjects with a history of traumatic brain injury with loss of consciousness | LoBue 2018 [27] •• | MCI N = 870 | Amnestic MCI ⟶ AD | Median: 4 y (IQR 2 to 5 y) | Cox proportional hazards models (adjusted for age of MCI diagnosis, race, presence of APOE4 alleles, and family history of dementia) | HR: 0.90; 95% CI: 0.70, 1.15; p = 0.39 | No evidence of effect |
| ADAS-cog 11 (impaired cognition indicated by higher score) | Pyun 2017 [26] •• | MCI N = 258 | MCI ⟶ AD | Up to 3 y; Median 24 mo | Multivariate Cox regression analysis (adjusted for MTA, PA, age, sex, education, APOE ɛ4 carrier, ADAS-cog 11, CDR SB, and CSF p-tau) | HR: 1.101; 95% CI: 1.061, 1.144; p < 0.001 | Increase |
| CDR SB (impaired cognition indicated by higher score) | Pyun 2017 [26] •• | MCI N = 258 | MCI ⟶ AD | Up to 3 y; Median 24 mo | Multivariate Cox regression analysis (adjusted for MTA, PA, age, sex, education, APOE ɛ4 carrier, ADAS-cog 11, CDR SB, and CSF p-tau) | HR: 1.526; 95% CI: 1.276, 1.824; p < 0.001 | Increase |
| K-MMSE score (normal at baseline) | Lee 2012 [25] •• | MCI N = 504 | MCI ⟶ AD | 1.47 y (Range: 5.5 mo to 5 y) | Multivariable Cox proportional hazards model analysis (adjusted model for age, education and KMMSE score) | OR: 0.90; 95% CI: 0.85, 0.95; p < 0.001 | Decrease |
| Genetic factors | |||||||
| APOE ɛ4 allele carrier | Pyun 2017 [26] •• | MCI N = 258 | MCI ⟶ AD | Up to 3 y; Median 24 mo | Multivariate Cox regression analysis (adjusted for MTA, PA, age, sex, education, APOE ɛ4 carrier, ADAS-cog 11, CDR SB, and CSF p-tau) | HR: 0.996; 95% CI: 0.674, 1.470; p = NR | No evidence of effect |
| Biomarkers (Aβ) | |||||||
| CSF Aβ | Spencer 2019 [31] •• | MCI N = 185 | MCI ⟶ AD | Mean 4.3 y (SD: 2.8) | Cox proportional hazards regressions controlling for age | HR: 3.5; 95% CI: 2.0, 6.1; p = 1.63x10⁻⁵ | Increase |
| CSF Aβ42 (abnormally low:<600 pg/ml) | Wolfsgruber 2017 [33] •• | MCI due to AD N = 134 | MCI due to AD ⟶ AD | 27.0 (0.95) mo | Cox-Proportional Hazard regression analyses (adjusted for age, gender) | HR: 6.4; 95% CI: 2.9, 14.2; p < 0.001 | Increase |
| CSF Aβ | Xue 2020 [32] •• | MCI N = 193 | MCI ⟶ AD | NR | Cox proportional hazard regression model (adjusted for age, sex, educational level, APOE ɛ4 genotype) | HR: 0.55; 95% CI: 0.41, 0.75; p < 0.001 | Decrease |
| Biomarkers (Aβ42/Aβ40) | |||||||
| Plasma Aβ42/Aβ40 (Abnormal) | Cullen 2021 [28] •• | MCI BioFINDER: n = 148 | MCI ⟶ AD | 4 y | Cox regression modelling adjusted for age, sex, education, and baseline MMSE | HR: 0.79; 95% CI:NR, NR; p = 0.5205 | No evidence of effect |
| Plasma Aβ42/Aβ40 (Abnormal) | Cullen 2021 [28] •• | MCI ADNI: n = 87 | MCI ⟶ AD | 4 y | Cox regression modelling adjusted for age, sex, education and baseline MMSE | HR: 0.8; 95% CI:NR, NR; p = 0.0835 | No evidence of effect |
| Biomarkers (p-tau) | |||||||
| CSF p-tau | Pyun 2017 [26] •• | MCI N = 258 | MCI ⟶ AD | Up to 3 y; Median 24 mo | Multivariate Cox regression analysis (adjusted for MTA, PA, age, sex, education, APOE ɛ4 carrier, ADAS-cog 11, CDR SB, and CSF p-tau) | HR: 1.006; 95% CI: 1.000, 1.013; p = NR | No evidence of effect |
| CSF P-tau | Spencer 2019 [31] •• | MCI N = 185 | MCI ⟶ AD | Mean 4.3 y (SD: 2.8) | Cox proportional hazards regressions controlling for age | HR: 2.9; 95% CI: 1.7, 4.7; p = 3.08x10⁻⁵ | Increase |
| CSF p-tau | Xue 2020 [32] •• | MCI N = 193 | MCI ⟶ AD | NR | Cox proportional hazard regression model (adjusted for age, sex, educational level, APOE e4 genotype) | HR: 2.31; 95% CI: 1.34, 3.93; p = 0.002 | Increase |
| Plasma p-tau 181 Abnormal | Cullen 2021 [28] •• | MCI BioFINDER: n = 148 | MCI ⟶ AD | 4 y | Cox regression modelling adjusted for age, sex, education and baseline MMSE | HR: 2.44; 95% CI:NR, NR; p = 0.0047 | Increase |
| Plasma p-tau 181 Abnormal | Cullen 2021 [28] •• | MCI ADNI: n = 87 | MCI ⟶ AD | 4 y | Cox regression modelling adjusted for age, sex, education and baseline MMSE | HR: 2.500.8; 95% CI:NR, NR; p < 0.0001 | Increase |
| Plasma p-tau 181 Abnormal | Palmqvist 2021 [29] • | MCI ADNI: n = 437 | MCI ⟶ AD | 4 y | Logistic regression models | OR: 2.84; 95% CI:2.06, 4.04; p = NR | Increase |
| Plasma p-tau181 > 17.71 (high) | Therriault 2021 [30] •• | MCI N = 604 | MCI ⟶ AD | 5 y | Cox proportional hazards models (adjusted for APOE ɛ4, age, sex and years of education) | HR: 2.06; 95% CI: 1.55, 2.74; p < 0.001 | Increase |
| CSF pTau 181 (abnormally high:>60 pg/ml) | Wolfsgruber 2017 [33] •• | MCI due to AD N = 134 | MCI due to AD ⟶ AD | 27.0 (0.95) mo | Cox-Proportional Hazard regression analyses (adjusted for age, gender) | HR: 6.3; 95% CI: 2.1, 16.3; p < 0.001 | Increase |
| Plasma P-Tau 217 Abnormal | Palmqvist 2021 [29] • | MCI N = BioFINDER: n = 176 | MCI ⟶ AD | 4 y | Logistic regression models | OR: 3.88; 95% CI:2.42, 6.66; p = NR | Increase |
| t-tau | |||||||
| CSF t-tau | Spencer 2019 [31] •• | MCI N = 185 | MCI ⟶ AD | Mean 4.3 y (SD: 2.8) | Cox proportional hazards regressions controlling for age | HR: 1.9; 95% CI: 1.3, 2.8; p = 1.15x10⁻³ | Increase |
| CSF tau (abnormally high: > 300 pg/ml) | Wolfsgruber 2017 [33] •• | MCI due to AD N = 134 | MCI due to AD ⟶ AD | 27.0 (0.95) mo | Cox-Proportional Hazard regression analyses (adjusted for age, gender) | HR: 8.6; 95% CI: 2.0, 36.7; p < 0.001 | Increase |
| CSF total tau | Xue 2020 [32] •• | MCI N = 193 | MCI ⟶ AD | NR | Cox proportional hazard regression model (adjusted for age, sex, educational level, APOE ɛ4 genotype) | HR: 1.63; 95% CI: 1.09, 2.44; p = 0.016 | Increase |
| t-tau/Aβ ratio | |||||||
| CSF t-tau/Aβ ratio | Spencer 2019 [28] •• | MCI N = 185 | MCI ⟶ AD | Mean 4.3 y (SD: 2.8) | Cox proportional hazards regressions controlling for age | HR: 3.6; 95% CI: 2.2, 6.1; p = 9.83x10⁻⁷ | Increase |
| p-tau/Aβ ratio | |||||||
| CSF p-tau/Aβ ratio | Spencer 2019 [31] •• | MCI N = 185 | MCI ⟶ AD | Mean 4.3 y (SD: 2.8) | Cox proportional hazards regressions controlling for age | HR: 3.3; 95% CI: 1.9, 5.9; p = 4.03x10⁻⁵ | Increase |
| Ng | |||||||
| CSF Ng | Xue 2020 [32] •• | MCI N = 193 | MCI ⟶ AD | NR | Cox proportional hazard regression model (adjusted for age, sex, educational level, APOE ɛ4 genotype) | HR: 0.90; 95% CI: 0.72, 1.11; p = 309 | No evidence of effect |
| NFL | |||||||
| Plasma NFL (abnormal) | Cullen 2021 [28] •• | MCI BioFINDER: n = 148 | MCI ⟶ AD | 4 y | Cox regression modelling adjusted for age, sex, education, and baseline MMSE | HR: 2.56; 95% CI:NR, NR; p = 0.0177 | Increase |
| Plasma NFL (abnormal) | Cullen 2021 [28] •• | MCI ADNI: n = 87 | MCI ⟶ AD | 4 y | Cox regression modelling adjusted for age, sex, education, and baseline MMSE | HR: 1.75; 95% CI:NR, NR; p = 0.0001 | Increase |
| Imaging Biomarker | |||||||
| MTA: Evaluated using a five-point rating scale developed by Scheltens et al. | Pyun 2017 [26] •• | MCI N = 258 | MCI ⟶ AD | Up to 3 y; Median 24 mo | Multivariate Cox regression analysis (adjusted for MTA, PA, age, sex, education, APOE ɛ4 carrier, ADAS-cog 11, CDR SB, and CSF p-tau) | HR: 1.424; 95% CI: 0.997, 2.034; p < 0.05 | Increase |
| Hippocampal volume as a percent of intracranial volume (HC % ICV) | Spencer 2019 [31] •• | MCI N = 185 | MCI ⟶ AD | Mean 4.3 y (SD: 2.8) | Cox proportional hazards regressions controlling for age | HR: 2.4; 95% CI: 1.6, 3.6; p = 2.19x10⁻⁵ | Increase |
Aβ, amyloid β-protein; AD, Alzheimer’s disease; ADAS-cog, the Alzheimer’s Disease Assessment Scale-Cognitive Subscale; ADNI, Alzheimer’s Disease Neuroimaging Initiative; APOE, apolipoprotein E; CDR-SB, The Clinical Dementia Rating –sum of boxes; CSF, cerebrospinal fluid; GDS, Geriatric Depression Scale; HR, hazard ratio; K-MMSE, Korean Mini-Mental State Examination; MCI, mild cognitive impairment; MMSE, Mini-Mental State Examination; mo, month; MSCI, Moderate/Severe Cognitive Impairment; MTA, medial temporal lobe atrophy; N, number; NFL, neurofilament light; NG, neurogranin; NR, not reported; OR: Odds Ratio; PA, posterior atrophy; P-Tau, phosphorylated tau; RR, Risk Ratio; t-tau, total tau; wk, week; y, year. •low risk of bias •• moderate risk of bias.
Depression. One study assessed the relationship between depression and disease progression [23, 24] (Table 3). Over an average follow up on 2.7 years depression had no impact on progression (HR 1.15; 95% CI 0.72, 1.83; p = NR) [23].
Risk factors. Two studies assessed the relationship between age and disease progression, with one reporting that older age increased the risk of progression [25] and a second showing no impact [26] (Table 3).
One study investigated sex as a prognostic factor for disease progression [26]. Over a median of 24 months, the study found that female sex did not affect the risk of progression from MCI AD to AD (HR 1.152; 95% CI 0.797, 1.665; p = NR) [26].
There were risk factors for which only one study was identified where there was no statistically significant association with disease progression (e.g., amnesic MCI, history of traumatic brain injury) [25, 27].
Education was reported in two studies but there was no clear relationship with disease progression [25, 26].
Baseline cognition. Two studies assessed the relationship between cognition and disease progression (Table 3) [25, 26]. One study found that impaired cognition at baseline (indicated by higher scores on the Alzheimer’s Disease Assessment Scale-Cognitive Subscale [ADAS-cog 11] and Clinical Dementia Rating Scale –Sum of Boxes [CDR-SB]) were associated with a significantly increased risk of progression from MCI to AD dementia over median 24 months [26]. A second study gave similar results, this time looking at the effect in the opposite direction, i.e., normal cognition at baseline (determined by the Korean Mini Mental State Examination, K-MMSE) was associated with return from MCI to normal cognition over 1.47 years in patients [25].
Genetic factors. One study reported genetics as a prognostic factor for disease progression and found that being a carrier of the apolipoprotein E ɛ4 (APOE4) allele was not significantly associated with progression from MCI to AD dementia over 1.47 years [26].
Biomarkers. In total, eight studies reported on the relationship between disease progression and biomarkers. There was a clear association between elevated phosphorylated tau (p-tau) and increased risk of progression from MCI to AD dementia for both plasma [28–30] and CSF measures [31–33]. CSF total tau (t-tau) was significantly associated with risk of progression in three studies [31–33]. One study reported that biomarkers such as CSF t-tau/Aβ ratio and CSF p-tau/Aβ ratio were associated with disease progression over mean 4.3 years [31] (HR 3.6; 95% CI 2.2, 6.1; p = 9.83×10⁻⁷ and HR 3.3; 95% CI 1.9, 5.9; p = 4.03×10⁻⁵, respectively) while another reported that plasma neurofilament light was associated with disease progression over 4 years in two separate cohorts (HR 2.56; 95% CI NR; p = 0.0177, HR 1.75; 95% CI: NR; p = 0.0001) [28].
Imaging biomarkers. Two studies reported imaging biomarkers and found significant associations with disease progression. Reduced hippocampal volume corrected for intracranial volume at baseline increased the risk of MCI progression to AD dementia over mean 4.3 years (HR 2.4; 95% CI 1.6, 3.6; p < 0.0001) [31], while baseline mesiotemporal atrophy was also significantly associated with risk of progression over median 24 months (HR 1.424; 95% CI 0.997, 2.034; p < 0.05) [26].
Prognostic factors and their association with cognitive outcomes
Results of identified studies reporting prognostic factors associated with cognitive outcomes i.e. decline in MMSE are summarized in Table 4. For the purposes of analysis, the focus was on observational studies with a low or moderate risk of bias.
Depression. One study reported that patients with mild AD dementia and persistent depression (depressed at both baseline and 1 year follow-up) had a higher risk of MMSE score decline (OR 6.4; 95% CI 1.7, 24.9; p = NR) than those with mild AD dementia and recovered depression (depression at baseline that recovers) and a similarly increased risk was reported for patients with mild AD dementia who had incident depression (depression at 1 year follow-up only) (OR 7.3; 95% CI 1.4, 38.1; p = NR) [34]. However, a second study found no association between depression, Geriatric Depression Scale score, or Neuropsychiatric Inventory Questionnaire in MCI due to AD patients and progression on the CDR-SB rating scale at mean follow up of 3.6 years [35] (Table 4). Given these contradictory results, decline in MMSE score may be associated with a history of depression.
Risk factors. Two studies reported the relationship between different risk factors and cognitive outcomes in people with MCI [35, 36] (Table 4). Mouchet et al. (2021) [35] used multivariate logistic regression analysis to identify risk factors for disease progression over mean 3.6 years on the CDR-SB scale (compared with no progression). Participants were classified according to whether they experienced fast, slow, or no disease progression as measured using the CDR-SB score; fast progression was defined as a mean change/year [95% CI] of+1.8 [1.6–2.1] points, slow progression was defined as+0.5 [0.4–0.6] points, and no progression was defined as no change in the score. Compared with people aged≤70 years, older people (aged≥86 years, 76–80 years, and 71–75 years) generally had an increased risk of disease progression [35]. There was no relationship between age 71–75 years and fast progression, nor between 76–80 years and risk of progression of any speed. A second study of people with MCI found no relationship between age and risk of progression according to the MMSE score at 48 months follow up [36].
Education did not appear to be associated with cognitive outcomes; only one significant association was reported between ‘some college’ education and slow progression on the CDR-SB rating scale compared with no progression over mean 3.6 years (OR 2.08; 95% CI 1.04, 4.14; p < 0.05) [35]. No association between sex and cognitive outcomes was observed [35, 36].
Sex, dependence (requiring some assistance with basic or complex tasks) prior AD medication use (including donepezil, galantamine, memantine, and rivastigmine) were not significantly associated with fast or slow progression on the CDR-SB scale over mean 3.6 years [35].
Baseline cognition. One study reported the relationship between global performance scores and disease progression in patients with MCI due to AD over mean 3.6 years [35]. A higher (worse) CDR-SB score at baseline was found to be associated with an increased risk of disease progression (fast progression OR:2.46; 95% CI:1.56, 3.88; p < 0.05; slow progression OR 2.32; 95% CI 1.49, 3.61; p < 0.05). A higher baseline Functional Activities Questionnaire (FAQ) score (indicating greater dependence) was associated with faster progression on the CDR-SB scale (OR 1.13; 95% CI 1.02, 1.26; p < 0.05) (Table 4). Finally, a higher baseline MMSE score at (indicating more normal cognitive function) was associated with a lower risk of fast progression on the CDR-SB scale (OR 0.85; 95% CI 0.75, 0.97; p < 0.05) [35].
Genetic factors. One study reported the association of genetic factors with cognitive outcomes in people with MCI due to AD. People with one copy of the APOE4 allele were found to have an increased risk of fast progression on the CDR-SB scale over mean 3.6 years (OR 1.94; 95% CI 1.08, 3.47; p < 0.05) versus no allele copy [35]. Having two copies of the APOE4 allele did not increase the risk of either fast or slow progression (Table 4).
Imaging biomarkers. One study reported the association between imaging biomarkers and cognitive outcomes [36]. White matter hyperintensities were significantly associated with cognitive decline at 48 months follow up (defined as a 3-point decline in MMSE over 6 months or a 6-point decline over 1 year).
Table 4
Prognostic factors and their associated with cognitive outcomes in eAD studies with low or moderate risk of bias
| Prognostic factor | Study Study | Population (N) | Progression in terms of cognitive outcomes | Follow up | Type of analysis (and factors adjusted for) | Statistical results | Effect on progression |
| Symptoms (depression) | |||||||
| Depression | Mouchet 2021 [35] •• | MCI due to AD N = 830 | CDR-SB Fast progression (mean change/y [95% CI]=+1.8 [1.6–2.1] points | Mean 3.6 y (SD: 2.5; Range: 0–11) | Multivariate multinomial logistic regression analyses | OR: 1.19; 95% CI: 0.61, 2.32; p = NR | No evidence of effect |
| Depression | Mouchet 2021 [35] •• | MCI due to AD N = 830 | CDR-SB Slow progression (mean change/y [95% CI]=+0.5 [0.4–0.6] points) | Mean 3.6 y (SD: 2.5; Range: 0–11) | Multivariate multinomial logistic regression analyses | OR: 0.93; 95% CI: 0.49, 1.75; p = NR | No evidence of effect |
| Depression (incident): only depression at follow-up | Spalletta 2012 [34] • | Mild AD dementiaN = 119 | Decline in MMSE score | 1 y | Adjusted risk (adjusted for age, sex, education, apathy, AChEI, MMSE, antidepressant medication) | OR: 7.3; 95% CI: 1.4, 38.1; p = NR | Increase |
| Depression (never depressed): never depressed at baseline or follow-up | Spalletta 2012 [34] • | Mild AD dementia N = 119 | Decline in MMSE score | 1 y | Adjusted risk (adjusted for age, sex, education, apathy, AChEI, MMSE, antidepressant medication) | OR: 3.1; 95% CI: 1.0, 10.1; p = NR | No evidence of effect |
| Depression (persistent): depressed at both baseline and follow-up) | Spalletta 2012 [34] • | Mild AD dementia N = 119 | Decline in MMSE score | 1 y | Adjusted risk (adjusted for age, sex, education, apathy, AChEI, MMSE, antidepressant medication) | OR: 6.4; 95% CI: 1.7, 24.9; p = NR | Increase |
| GDS | Mouchet 2021 [35] •• | MCI due to AD N = 830 | CDR-SB Fast progression (mean change/y [95% CI]=+1.8 [1.6–2.1] points | Mean 3.6 y (SD: 2.5; Range: 0–11) | Multivariate multinomial logistic regression analyses | OR: 1.04; 95% CI: 0.91, 1.20; p = NR | No evidence of effect |
| GDS | Mouchet 2021 [35] •• | MCI due to AD N = 830 | CDR-SB Slow progression (mean change/y [95% CI]=+0.5 [0.4–0.6] points) | Mean 3.6 y (SD: 2.5; Range: 0–11) | Multivariate multinomial logistic regression analyses | OR: 0.93; 95% CI: 0.81, 1.07; p = NR | No evidence of effect |
| Symptoms (neuropsychiatric symptoms) | |||||||
| Baseline NPI-Q | Mouchet 2021 [35] •• | MCI due to AD N = 830 | CDR-SB Fast progression (mean change/y [95% CI]=+1.8 [1.6–2.1] points | Mean 3.6 y (SD: 2.5; Range: 0–11) | Multivariate multinomial logistic regression analyses | OR: 1.02; 95% CI: 0.91, 1.13; p = NR | No evidence of effect |
| Baseline NPI-Q | Mouchet 2021 [35] •• | MCI due to AD N = 830 | CDR-SB Slow progression (mean change/y [95% CI]=+0.5 [0.4–0.6] points) | Mean 3.6 y (SD: 2.5; Range: 0–11) | Multivariate multinomial logistic regression analyses | OR: 1.07; 95% CI: 0.97, 1.19; p = NR | No evidence of effect |
| Risk factors (age) | |||||||
| Definition NR | Tosto 2014 [36] •• | MCI due to AD N = 332 | Progression rate of a 3-point decline in MMSE over 6 mo or 6-point decline over 1 y was considered as the event outcome | 48 mo | Cox proportional hazards models - Sex, education, and age at baseline were included as covariates in all the models presented | HR: 0.992; 95% CI: 0.97, 1.01; p = NR | No evidence of effect |
| Age:≥86 y | Mouchet 2021 [35] •• | MCI due to AD N = 830 | CDR-SB Fast progression (mean change/y [95% CI]=+1.8 [1.6–2.1] points | Mean 3.6 y (SD: 2.5; Range: 0–11) | Multivariate multinomial logistic regression analyses | OR: 5.26; 95% CI: 1.78, 15.54; p < 0.05 | Increase |
| Age:≥86 y | Mouchet 2021 [35] •• | MCI due to AD N = 830 | CDR-SB Slow progression (mean change/y [95% CI]=+0.5 [0.4–0.6] points) | Mean 3.6 y (SD: 2.5; Range: 0–11) | Multivariate multinomial logistic regression analyses | OR: 5.57; 95% CI: 2.00, 15.55; p < 0.05 | Increase |
| Age: 71–75 y | Mouchet 2021 [35] •• | MCI due to AD N = 830 | CDR-SB Fast progression (mean change/y [95% CI]=+1.8 [1.6–2.1] points | Mean 3.6 y (SD: 2.5; Range: 0–11) | Multivariate multinomial logistic regression analyses | OR: 2.99; 95% CI: 0.99, 9.06; p = NR | No evidence of effect |
| Age: 71–75 y | Mouchet 2021 [35] •• | MCI due to AD N = 830 | CDR-SB Slow progression (mean change/y [95% CI]=+0.5 [0.4–0.6] points) | Mean 3.6 y (SD: 2.5; Range: 0–11) | Multivariate multinomial logistic regression analyses | OR: 3.09; 95% CI: 1.11, 8.63; p < 0.05 | Increase |
| Age: 76–80 y | Mouchet 2021 [35] •• | MCI due to AD N = 830 | CDR-SB Fast progression (mean change/y [95% CI]=+1.8 [1.6–2.1] points | Mean 3.6 y (SD: 2.5; Range: 0–11) | Multivariate multinomial logistic regression analyses | OR: 2.90; 95% CI: 1.02, 8.26; p < 0.05 | Increase |
| Age: 76–80 y | Mouchet 2021 [35] •• | MCI due to AD N = 830 | CDR-SB Slow progression (mean change/y [95% CI]=+0.5 [0.4–0.6] points) | Mean 3.6 y (SD: 2.5; Range: 0–11) | Multivariate multinomial logistic regression analyses | OR: 5.21; 95% CI: 2.01, 13.54; p < 0.05 | Increase |
| Age: 81–85 y | Mouchet 2021 [35] •• | MCI due to AD N = 830 | CDR-SB Fast progression (mean change/y [95% CI]=+1.8 [1.6–2.1] points | Mean 3.6 y (SD: 2.5; Range: 0–11) | Multivariate multinomial logistic regression analyses | OR: 2.90; 95% CI: 0.99, 8.49; p = NR | No evidence of effect |
| Age: 81–85 y | Mouchet 2021 [35] •• | MCI due to AD N = 830 | CDR-SB Slow progression (mean change/y [95% CI]=+0.5 [0.4–0.6] points) | Mean 3.6 y (SD: 2.5; Range: 0–11) | Multivariate multinomial logistic regression analyses | OR: 2.73; 95% CI: 0.99, 7.52; p = NR | No effect |
| Risk factor (sex) | |||||||
| Female | Mouchet 2021 [35] •• | MCI due to AD N = 830 | CDR-SB Fast progression (mean change/y [95% CI]=+1.8 [1.6–2.1] points | Mean 3.6 y (SD: 2.5; Range: 0–11) | Multivariate multinomial logistic regression analyses | OR: 1.50; 95% CI: 0.82, 2.76; p = NR | No evidence of effect |
| Female | Mouchet 2021 [35] •• | MCI due to AD N = 830 | CDR-SB Slow progression (mean change/y [95% CI]=+0.5 [0.4–0.6] points) | Mean 3.6 y (SD: 2.5; Range: 0–11) | Multivariate multinomial logistic regression analyses | OR: 1.76; 95% CI: 1.00, 3.11; p = NR | No evidence of effect |
| Definition NR | Tosto 2014 [36] •• | MCI N = 332 | Progression rate of a 3-point decline in MMSE over 6 mo or 6-point decline over 1 y was considered as the event outcome | 48 mo | Cox proportional hazards models - Sex, education, and age at baseline were included as covariates in all the models presented | HR: 1.2; 95% CI: 0.9, 1.64; p = NR | No evidence of effect |
| Risk factor (education) | |||||||
| College | Mouchet 2021 [35] •• | MCI due to AD N = 830 | CDR-SB Fast progression (mean change/y [95% CI]=+1.8 [1.6–2.1] points | Mean 3.6 y (SD: 2.5; Range: 0–11) | Multivariate multinomial logistic regression analyses | OR: 1.63; 95% CI: 0.81, 3.29; p = NR | No evidence of effect |
| College | Mouchet 2021 [35] •• | CDR-SB Slow progression (mean change/y [95% CI]=+0.5 [0.4–0.6] points) | Mean 3.6 y (SD: 2.5; Range: 0–11) | Multivariate multinomial logistic regression analyses | OR: 1.16; 95% CI: 0.60, 2.26; p = NR | No evidence of effect | |
| High School | Mouchet 2021 [35] •• | MCI due to AD N = 830 | CDR-SB Fast progression (mean change/y [95% CI]=+1.8 [1.6–2.1] points | Mean 3.6 y (SD: 2.5; Range: 0–11) | Multivariate multinomial logistic regression analyses | OR: 1.20; 95% CI: 0.52, 2.75; p = NR | No evidence of effect |
| High School | Mouchet 2021 [35] •• | CDR-SB Slow progression (mean change/y [95% CI]=+0.5 [0.4–0.6] points) | Mean 3.6 y (SD: 2.5; Range: 0–11) | Multivariate multinomial logistic regression analyses | OR: 1.58; 95% CI: 0.76, 3.32; p = NR | No evidence of effect | |
| Education: No definition | Tosto 2014 [36] •• | MCI N = 332 | Progression rate of a 3-point decline in MMSE over 6 mo or 6-point decline over 1 y was considered as the event outcome | 48 mo | Cox proportional hazards models - Sex, education, and age at baseline were included as covariates in all the models presented | HR: 0.98; 95% CI: 0.92, 1.02; p = NR | No evidence of effect |
| Some college | Mouchet 2021 [35] •• | MCI due to AD N = 830 | CDR-SB Fast progression (mean change/y [95% CI]=+1.8 [1.6–2.1] points | Mean 3.6 y (SD: 2.5; Range: 0–11) | Multivariate multinomial logistic regression analyses | OR: 1.33; 95% CI: 0.61, 2.91; p = NR | No evidence of effect |
| Some college | Mouchet 2021 [35] •• | CDR-SB Slow progression (mean change/y [95% CI]=+0.5 [0.4–0.6] points) | Mean 3.6 y (SD: 2.5; Range: 0–11) | Multivariate multinomial logistic regression analyses | OR: 2.08; 95% CI: 1.04, 4.14; p < 0.05 | Increase | |
| Some high school | Mouchet 2021 [35] •• | MCI due to AD N = 830 | CDR-SB Fast progression (mean change/y [95% CI]=+1.8 [1.6–2.1] points | Mean 3.6 y (SD: 2.5; Range: 0–11) | Multivariate multinomial logistic regression analyses | OR: 0.86; 95% CI: 0.24, 3.15; p = NR | No evidence of effect |
| Some high school | Mouchet 2021 [35] •• | CDR-SB Slow progression (mean change/y [95% CI]=+0.5 [0.4–0.6] points) | Mean 3.6 y (SD: 2.5; Range: 0–11) | Multivariate multinomial logistic regression analyses | OR: 0.63; 95% CI: 0.16, 2.40; p = NR | No evidence of effect | |
| Risk factor (dependance) | |||||||
| Requires some assistance with basic or complex tasks | Mouchet 2021 [35] •• | MCI due to AD N = 830 | CDR-SB Fast progression (mean change/y [95% CI]=+1.8 [1.6–2.1] points | Mean 3.6 y (SD: 2.5; Range: 0–11) | Multivariate multinomial logistic regression analyses | OR: 1.90; 95% CI: 0.73, 4.94; p = NR | No evidence of effect |
| Requires some assistance with basic or complex tasks | Mouchet 2021 [35] •• | MCI due to AD N = 830 | CDR-SB Slow progression (mean change/y [95% CI]=+0.5 [0.4–0.6] points) | Mean 3.6 y (SD: 2.5; Range: 0–11) | Multivariate multinomial logistic regression analyses | OR: 0.77; 95% CI: 0.26, 2.28; p = NR | No evidence of effect |
| Risk factor (AD medication use) | |||||||
| Any FDA approved AD medication use (including donepezil, galantamine, memantine, and rivastigmine) | Mouchet 2021 [35] •• | MCI due to AD N = 830 | CDR-SB Fast progression (mean change/y [95% CI]=+1.8 [1.6–2.1] points | Mean 3.6 y (SD: 2.5; Range: 0–11) | Multivariate multinomial logistic regression analyses | OR: 2.19; 95% CI: 0.78, 6.14; p = NR | No evidence of effect |
| Any FDA approved AD medication use (including donepezil, galantamine, memantine, and rivastigmine) | Mouchet 2021 [35] •• | MCI due to AD N = 830 | CDR-SB Slow progression (mean change/y [95% CI]=+0.5 [0.4–0.6] points) | Mean 3.6 y (SD: 2.5; Range: 0–11) | Multivariate multinomial logistic regression analyses | OR: 2.11; 95% CI: 0.78, 5.71; p = NR | No evidence of effect |
| Baseline cognition | |||||||
| CDR-GS score | Mouchet 2021 [35] •• | MCI due to AD N = 830 | CDR-SB Fast progression (mean change/y [95% CI]=+1.8 [1.6–2.1] points | Mean 3.6 y (SD: 2.5; Range: 0–11) | Multivariate multinomial logistic regression analyses | OR: 0.51; 95% CI: 0.21, 1.24; p = NR | No evidence of effect |
| CDR-GS score | Mouchet 2021 [35] •• | MCI due to AD N = 830 | CDR-SB Slow progression (mean change/y [95% CI]=+0.5 [0.4–0.6] points) | Mean 3.6 y (SD: 2.5; Range: 0–11) | Multivariate multinomial logistic regression analyses | OR: 0.67; 95% CI: 0.30, 1.48; p = NR | No evidence of effect |
| CDR-SB score | Mouchet 2021 [35] •• | MCI due to AD N = 830 | CDR-SB Fast progression (mean change/y [95% CI]=+1.8 [1.6–2.1] points | Mean 3.6 y (SD: 2.5; Range: 0–11) | Multivariate multinomial logistic regression analyses | OR: 2.46; 95% CI: 1.56, 3.88; p < 0.05 | Increase |
| CDR-SB score | Mouchet 2021 [35] •• | MCI due to AD N = 830 | CDR-SB Slow progression (mean change/y [95% CI]=+0.5 [0.4–0.6] points) | Mean 3.6 y (SD: 2.5; Range: 0–11) | Multivariate multinomial logistic regression analyses | OR: 2.32; 95% CI: 1.49, 3.61; p < 0.05 | Increase |
| FAQ | Mouchet 2021 [35] •• | MCI due to AD N = 830 | CDR-SB Fast progression (mean change/y [95% CI]=+1.8 [1.6–2.1] points | Mean 3.6 y (SD: 2.5; Range: 0–11) | Multivariate multinomial logistic regression analyses | OR: 1.13; 95% CI: 1.02, 1.26; p < 0.05 | Increase |
| FAQ | Mouchet 2021 [35] •• | MCI due to AD N = 830 | CDR-SB Slow progression (mean change/y [95% CI]=+0.5 [0.4–0.6] points) | Mean 3.6 y (SD: 2.5; Range: 0–11) | Multivariate multinomial logistic regression analyses | OR: 1.10; 95% CI: 0.98, 1.22; p = NR | No evidence of effect |
| MMSE | Mouchet 2021 [35] •• | MCI due to AD N = 830 | CDR-SB Fast progression (mean change/y [95% CI]=+1.8 [1.6–2.1] points | Mean 3.6 y (SD: 2.5; Range: 0–11) | Multivariate multinomial logistic regression analyses | OR: 0.85; 95% CI: 0.75, 0.97; p < 0.05 | Decrease |
| MMSE | Mouchet 2021 [35] •• | MCI due to AD N = 830 | CDR-SB Slow progression (mean change/y [95% CI]=+0.5 [0.4–0.6] points) | Mean 3.6 y (SD: 2.5; Range: 0–11) | Multivariate multinomial logistic regression analyses | OR: 0.94; 95% CI: 0.82, 1.07; p = NR | No evidence of effect |
| Genetic factors | |||||||
| APOE ɛ4 (1 copy) | Mouchet 2021 [35] •• | MCI due to AD N = 830 | CDR-SB Fast progression (mean change/y [95% CI]=+1.8 [1.6–2.1] points | Mean 3.6 y (SD: 2.5; Range: 0–11) | Multivariate multinomial logistic regression analyses | OR: 1.94; 95% CI: 1.08, 3.47; p < 0.05 | Increase |
| APOE ɛ4 (1 copy) | Mouchet 2021 [35] •• | MCI due to AD N = 830 | CDR-SB Slow progression (mean change/y [95% CI]=+0.5 [0.4–0.6] points) | Mean 3.6 y (SD: 2.5; Range: 0–11) | Multivariate multinomial logistic regression analyses | OR: 1.39; 95% CI: 0.81, 2.41; p = NR | No evidence of effect |
| APOE ɛ4 (2 copies) | Mouchet 2021 [35] •• | MCI due to AD N = 830 | CDR-SB Fast progression (mean change/y [95% CI]=+1.8 [1.6–2.1] points | Mean 3.6 y (SD: 2.5; Range: 0–11) | Multivariate multinomial logistic regression analyses | OR: 1.55; 95% CI: 0.36, 6.74; p = NR | No evidence of effect |
| APOE ɛ4 (2 copies) | Mouchet 2021 [35] •• | MCI due to AD N = 830 | CDR-SB Slow progression (mean change/y [95% CI]=+0.5 [0.4–0.6] points) | Mean 3.6 y (SD: 2.5; Range: 0–11) | Multivariate multinomial logistic regression analyses | OR: 1.56; 95% CI: 0.42, 5.79; p = NR | No evidence of effect |
| Imaging biomarker | |||||||
| WMHs | Tosto 2014 [36] •• | MCI N = 332 | Progression rate of a 3-point decline in MMSE over 6 mo or 6-point decline over 1 y was considered as the event outcome | 48 mo | Cox proportional hazards models - Sex, education, and age at baseline were included as covariates in all the models presented | HR: 1.23; 95% CI: 1.05, 1.43; p = 0.01 | Increase |
AD, Alzheimer’s disease; APOE, apolipoprotein E; CDR-GS, The Clinical Dementia Rating- global score; CDR-SB, The Clinical Dementia Rating- sum of boxes; CI, confidence interval; CSF, cerebrospinal fluid; FAQ, Functional Activities Questionnaire; FDA, Food and Drug Administration; HR, hazard ratio; MCI, mild cognitive impairment; MMSE, Mini-Mental State Examination; mo, month; NPI-Q, Neuropsychiatric Inventory–Questionnaire; N, number; NR, not reported; OR, odds ratio; PET, positron emission tomography; RR, risk ratio; wk, week; WMH, white matter hyperintensities; y, year. •low risk of bias •• moderate risk of bias.
Predictive factors
Plaque-lowering anti-amyloid immunotherapies in eAD are summarized in Table 5. Five studies (six publications) contributed data [7–9, 37–39].
Two publications reported on two Phase 3 RCTs (EMERGE and ENGAGE; n = 3,285) conducted in eAD patients receiving aducanumab (a monoclonal antibody) [7, 37]. Patients were randomized to receive (1 : 1:1) low-dose aducanumab, high-dose aducanumab, or placebo stratified by APOE4 carrier status and followed for 78 weeks. In the low-dose group, the dose was titrated to a target of 3 mg/kg (APOE4+) or 6 mg/kg (APOE4–) and in the high-dose group, the dose was titrated to a target of 6 mg/kg (APOE4+) or 10 mg/kg (APOE4–). Following a protocol amendment each group received 6 or 10 mg/kg. The main publication focused on efficacy and safety of aducanumab presenting subgroup analyses (in the form of forest plots) based on patient and disease characteristics for CDR-SB, MMSE, ADAS-Cog13, and Alzheimer’s Disease Cooperative Study –Activities of Daily Living Scale for use in MCI (ADCS-ADL-MCI) [7]; however, no statistical comparison was presented. The second publication investigated amyloid-related imaging abnormalities (ARIA), that can occur in AD patients treated with monoclonal antibodies and are detected using magnetic resonance imaging [37]. A proportional hazards model was used to assess risk factors for ARIA related to either brain edema/sulcal effusion (ARIA-E) or to isolated hemosiderin deposits resulting from microhemorrhage in the brain parenchyma or on the pial surface (isolated ARIA-H).
TRAILBLAZER-ALZ was a Phase II placebo-controlled trial of donanemab in patients with eAD [9]. Patients received donanemab (700 mg for first three doses and then 1400 mg) or placebo intravenously every four weeks for up to 72 weeks. Safety in terms of number of patients experiencing ARIA-E or ARIA-H were presented for several APOE genotypes.
Scarlet Road was a Phase III placebo controlled RCT investigating gantenerumab treatment (105 mg or 225 mg) in prodromal AD over two years [39]. Safety in terms of number of patients experiencing ARIA-E and ARIA-H were presented for both APOE4 carriers and non-carriers.
PRIME was a Phase 1b RCT conducted in patients with prodromal or mild AD dementia receiving 1, 3, 6, or 10 mg/kg aducanumab for 1 year [38]. Efficacy in terms of amyloid plaque reduction and safety in terms of ARIA were presented for both APOE4 carriers and non-carriers.
BAN2401-G000-201 was an 18-month Bayesian design RCT employing response adaptive randomization across placebo and multiple dose lecanemab arms in patients with early AD [8]. Efficacy in terms of Alzheimer’s Disease Composite Score (ADCOMS) and safety in terms of patients experiencing ARIA were presented for both APOE4 carriers and non-carriers.
Risk factors
In EMERGE, older age (≥75 years) was associated with more favorable outcome with aducanumab treatment in terms of CDR-SB, ADAS-cog13, and ADCS-ADL-MC [7]. There was no difference in these outcomes in ENGAGE. In both EMERGE and ENGAGE, older age was associated with an increased risk of isolated ARIA-H (HR 1.055; 95% CI 1.017, 1.094; p = NR) but not with risk of ARIA-E or ARIA-E/ARIA-H combined [37]. In EMERGE, male sex was associated with more favorable outcomes in terms of ADAS-cog13 and ADCS-ADL-MCI. There was no difference in these outcomes in ENGAGE. In both EMERGE and ENGAGE, sex and baseline use of anti-thrombotic medication (specifically aspirin) were not associated with any of the ARIA outcomes (Table 5).
Clinical outcomes
In EMERGE, MMSE≤26 at baseline was associated with more favorable outcomes with aducanumab treatment in terms of CDR-SB, ADAS-cog13, and ADCS-ADL-MCI. There was no difference in ENGAGE.
Genetic factors
In the RCTs, APOE4 carriers were found to be a greater risk for ARIA complications of anti-amyloid monoclonal antibody therapy [8, 9, 37–39]. In two RCTs, APOE4 carriers were found to benefit more from therapy than non-carriers [7, 8] (Table 5).
In EMERGE, APOE4 gene carriers were associated with more favorable outcomes with aducanumab treatment in terms of CDR-SB, MMSE, ADAS-cog13, and ADCS-ADL-MCI [7]. In ENGAGE, APOE4 gene non-carriers were associated with more favorable outcomes in terms of ADAS-cog13 only [7]. In both EMERGE and ENGAGE, APOE4 gene carriers had an increased risk of ARIA-E (HR 2.456; 95% CI 1.897, 32.04; p = NR) and ARIA-E/ARIA-H (HR 2.838; 95% CI 2.002, 4.024; p = NR) but there was no effect on isolated ARIA-H [37].
In TRAILBLAZER, ARIA-E or ARIA-H were more common in patients with two copies of the APOE4 gene who receiving donanemab compared to placebo (44% versus 3.6%) [9].
In Scarlet Road, both ARIA-E and ARIA-H events were more common in APOE4 gene carriers and occurred more frequently in the gantenerumab arm (increasing with dose) [39].
In PRIME, amyloid positron emission tomography (PET) standard uptake value ratio (SUVR) composite score was similarly reduced in both APOE ɛ4 carriers and non-carriers [38]. ARIA-E and ARIA-H were more common in aducanumab treated patients (increasing with dose) and in APOE ɛ4 carriers.
In BAN2401-G000-201, APOE4 gene carriers were associated with more favorable outcomes with lecanemab treatment in terms of efficacy (ADCOMS) but less favorable outcomes in terms of safety (ARIA-E) (Table 5) [8]. In a Bayesian sensitivity analyses, APOE4 gene carriers receiving 10 mg/kg of lecanemab biweekly showed greater reduction in cognitive decline than APOE4 non-carriers when compared to placebo. In comparison, most ARIA-E cases (77%) occurred in APOE4 gene carriers (placebo n = 2; lecanemab n = 46).
Table 5
Predictive factors in eAD studies
| Predictive factor | AD | Measure of | Follow up | Favors | Favors | No | Study |
| Treatment | efficacy/safety | intervention | placebo | difference | |||
| Risk factor (Age) | |||||||
| ≤64 | Aducanumab (10 mg/kg) | Efficacy: CDR-SB | 78 weeks | ✓ | Budd Haeberlein 2022EMERGE •• [7] | ||
| 65–74 | ✓ | ||||||
| ≥75 | ✓ | ||||||
| ≤64 | ✓ | Budd Haeberlein 2022ENGAGE •• [7] | |||||
| 65–74 | ✓ | ||||||
| ≥75 | ✓ | ||||||
| ≤64 | Aducanumab (10 mg/kg) | Efficacy: MMSE | 78 weeks | ✓ | Budd Haeberlein 2022EMERGE •• [7] | ||
| 65–74 | ✓ | ||||||
| ≥75 | ✓ | ||||||
| ≤64 | ✓ | Budd Haeberlein 2022ENGAGE •• [7] | |||||
| 65–74 | ✓ | ||||||
| ≥75 | ✓ | ||||||
| ≤64 | Aducanumab (10 mg/kg) | Efficacy: ADAS-cog 13 | 78 weeks | ✓ | Budd Haeberlein 2022EMERGE •• [7] | ||
| 65–74 | ✓ | ||||||
| ≥75 | ✓ | ||||||
| ≤64 | ✓ | Budd Haeberlein 2022ENGAGE •• [7] | |||||
| 65–74 | ✓ | ||||||
| ≥75 | ✓ | ||||||
| ≤64 | Aducanumab (10 mg/kg) | ADCS-ADL-MCI | 78 weeks | ✓ | Budd Haeberlein 2022EMERGE •• [7] | ||
| 65–74 | ✓ | ||||||
| ≥75 | ✓ | ||||||
| ≤64 | ✓ | Budd Haeberlein 2022ENGAGE •• [7] | |||||
| 65–74 | ✓ | ||||||
| ≥75 | ✓ | ||||||
| 1 y increase | Aducanumab (10 mg/kg) | Safety: ARIA-E | 78 weeks | ✓ | Salloway 2022 EMERGE and ENGAGE •• [37] | ||
| 1 y increase | Safety: ARIA-H | ✓ | |||||
| 1 y increase | Safety: ARIA-E and ARIA-H | ✓ | |||||
| Risk factor (sex) | |||||||
| Female | Aducanumab (10 mg/kg) | Efficacy: CDR-SB | 78 weeks | ✓ | Budd Haeberlein 2022EMERGE •• [7] | ||
| Male | ✓ | ||||||
| Female | ✓ | Budd Haeberlein 2022ENGAGE •• [7] | |||||
| Male | ✓ | ||||||
| Female | Aducanumab (10 mg/kg) | Efficacy: MMSE | 78 weeks | ✓ | Budd Haeberlein 2022EMERGE •• [7] | ||
| Male | ✓ | ||||||
| Female | ✓ | Budd Haeberlein 2022ENGAGE •• [7] | |||||
| Male | ✓ | ||||||
| Female | Aducanumab (10 mg/kg) | Efficacy: ADAS-cog 13 | 78 weeks | ✓ | Budd Haeberlein 2022EMERGE •• [7] | ||
| Male | ✓ | ||||||
| Female | ✓ | Budd Haeberlein 2022ENGAGE •• [7] | |||||
| Male | ✓ | ||||||
| Female | Aducanumab (10 mg/kg) | Efficacy: ADCS-ADL-MCI | 78 weeks | ✓ | Budd Haeberlein 2022EMERGE •• [7] | ||
| Male | ✓ | ||||||
| Female | ✓ | Budd Haeberlein 2022ENGAGE •• [7] | |||||
| Male | ✓ | ||||||
| Male | Aducanumab (10 mg/kg) | Safety: ARIA-E | 78 weeks | ✓ | Salloway 2022 EMERGE and ENGAGE •• [37] | ||
| Safety: ARIA-H | ✓ | ||||||
| Safety: ARIA-E and ARIA-H | ✓ | ||||||
| Risk factor (AD medication) | |||||||
| AD symptomatic medication use at baseline | Aducanumab (10 mg/kg) | Efficacy: CDR-SB | 78 weeks | ✓ | Budd Haeberlein 2022EMERGE •• [7] | ||
| No AD symptomatic medication use at baseline | ✓ | ||||||
| AD symptomatic medication use at baseline | Aducanumab (10 mg/kg) | ✓ | Budd Haeberlein 2022ENGAGE •• [7] | ||||
| No AD symptomatic medication use at baseline | ✓ | ||||||
| AD symptomatic medication use at baseline | Aducanumab (10 mg/kg) | Efficacy: MMSE | 78 weeks | ✓ | Budd Haeberlein 2022EMERGE •• [7] | ||
| No AD symptomatic medication use at baseline | ✓ | ||||||
| AD symptomatic medication use at baseline | ✓ | Budd Haeberlein 2022ENGAGE •• [7] | |||||
| No AD symptomatic medication use at baseline | ✓ | ||||||
| AD symptomatic medication use at baseline | Aducanumab (10 mg/kg) | Efficacy: ADAS-cog 13 | 78 weeks | ✓ | Budd Haeberlein 2022EMERGE •• [7] | ||
| No AD symptomatic medication use at baseline | ✓ | ||||||
| AD symptomatic medication use at baseline | Aducanumab (10 mg/kg) | ✓ | Budd Haeberlein 2022ENGAGE •• [7] | ||||
| No AD symptomatic medication use at baseline | ✓ | ||||||
| AD symptomatic medication use at baseline | Aducanumab (10 mg/kg) | Efficacy: ADCS-ADL-MCI | 78 weeks | ✓ | Budd Haeberlein 2022EMERGE •• [7] | ||
| No AD symptomatic medication use at baseline | ✓ | ||||||
| AD symptomatic medication use at baseline | Aducanumab (10 mg/kg) | ✓ | Budd Haeberlein 2022ENGAGE •• [7] | ||||
| No AD symptomatic medication use at baseline | ✓ | ||||||
| Anti-thrombotic medication (specifically aspirin) | Aducanumab (10 mg/kg) | Safety: ARIA-E | 78 weeks | ✓ | Salloway 2022 EMERGE and ENGAGE •• [37] | ||
| Safety: ARIA-H | ✓ | ||||||
| Safety: ARIA-E and ARIA-H | ✓ | ||||||
| Clinical outcomes | |||||||
| MMSE≥27 | Aducanumab (10 mg/kg) | Efficacy: CDR-SB | 78 weeks | ✓ | Budd Haeberlein 2022EMERGE •• [7] | ||
| MMSE≤26 | ✓ | ||||||
| MMSE≥27 | ✓ | Budd Haeberlein 2022ENGAGE •• [7] | |||||
| MMSE≤26 | ✓ | ||||||
| MMSE≥27 | Aducanumab (10 mg/kg) | Efficacy: MMSE | 78 weeks | ✓ | Budd Haeberlein 2022EMERGE •• [7] | ||
| MMSE≤26 | ✓ | ||||||
| MMSE≥27 | ✓ | Budd Haeberlein 2022ENGAGE •• [7] | |||||
| MMSE≤26 | ✓ | ||||||
| Aducanumab (10 mg/kg) | Aducanumab (10 mg/kg) | Efficacy: ADAS-cog 13 | 78 weeks | ✓ | Budd Haeberlein 2022EMERGE •• [7] | ||
| MMSE≤26 | ✓ | ||||||
| MMSE≥27 | ✓ | Budd Haeberlein 2022ENGAGE •• [7] | |||||
| MMSE≤26 | ✓ | ||||||
| MMSE≥27 | Aducanumab (10 mg/kg) | Efficacy: ADCS-ADL-MCI | 78 weeks | ✓ | Budd Haeberlein 2022EMERGE •• [7] | ||
| MMSE≤26 | ✓ | ||||||
| MMSE≥27 | ✓ | Budd Haeberlein 2022ENGAGE •• [7] | |||||
| MMSE≤26 | ✓ | ||||||
| Genetic factors | |||||||
| APOE carrier | Aducanumab (10 mg/kg) | Efficacy: CDR-SB | 78 weeks | ✓ | Budd Haeberlein 2022EMERGE •• [7] | ||
| APOE noncarrier | ✓ | ||||||
| APOE carrier | ✓ | Budd Haeberlein 2022ENGAGE •• [7] | |||||
| APOE noncarrier | ✓ | ||||||
| APOE carrier | Aducanumab (10 mg/kg) | Efficacy: MMSE | 78 weeks | ✓ | Budd Haeberlein 2022EMERGE •• [7] | ||
| APOE noncarrier | ✓ | ||||||
| APOE carrier | ✓ | Budd Haeberlein 2022ENGAGE •• [7] | |||||
| APOE noncarrier | ✓ | ||||||
| APOE carrier | Aducanumab (10 mg/kg) | Efficacy: ADAS-cog 13 | 78 weeks | ✓ | Budd Haeberlein 2022EMERGE •• [7] | ||
| APOE noncarrier | ✓ | ||||||
| APOE carrier | ✓ | Budd Haeberlein 2022ENGAGE •• [7] | |||||
| APOE noncarrier | ✓ | ||||||
| APOE carrier | Aducanumab (10 mg/kg) | Efficacy: ADCS-ADL-MCI | 78 weeks | ✓ | Budd Haeberlein 2022EMERGE •• [7] | ||
| APOE noncarrier | ✓ | ||||||
| APOE carrier | ✓ | Budd Haeberlein 2022ENGAGE •• [7] | |||||
| APOE noncarrier | ✓ | ||||||
| APOE carrier | Aducanumab (10 mg/kg) | Safety: ARIA-E | 78 weeks | ✓ | Salloway 2022 EMERGE and ENGAGE •• [37] | ||
| Safety: ARIA-H | ✓ | ||||||
| Safety: ARIA-E and ARIA-H | ✓ | ||||||
| APOE genotype (ɛ2/ɛ3) | Donanemab | Safety ARIA-E/ARIA-H | 72 weeks | ✓ | Mintun 2021 TRAILBLAZER-ALZ ••• [9] | ||
| APOE genotype (ɛ2/ɛ4) | ✓ | ||||||
| APOE genotype (ɛ3/ɛ3) | ✓ | ||||||
| APOE genotype (ɛ3/ɛ4) | ✓ | ||||||
| APOE genotype (ɛ4/ɛ4) | ✓ | ||||||
| APOE carrier (1 copy) | Gantenerumab(105 mg) | Safety: ARIA-E | 2 y | ✓ | Ostrowitzki 2017 Scarlet Road ••• [39] | ||
| APOE carrier (2 copies) | ✓ | ||||||
| APOE noncarrier | ✓ | ||||||
| APOE carrier (1 copy) | Gantenerumab(225 mg) | Safety: ARIA-E | 2 y | ✓ | Ostrowitzki 2017 Scarlet Road ••• [39] | ||
| APOE noncarrier | ✓ | ||||||
| APOE carrier (1 copy) | Gantenerumab(105 mg) | Safety: ARIA-H | 2 y | ✓ | Ostrowitzki 2017 Scarlet Road ••• [39] | ||
| APOE carrier (2 copies) | ✓ | ||||||
| APOE noncarrier | ✓ | ||||||
| APOE carrier (1 copy) | Gantenerumab(225 mg) | Safety: ARIA-H | 2 y | ✓ | Ostrowitzki 2017 Scarlet Road ••• [39] | ||
| APOE noncarrier | ✓ | ||||||
| APOE ɛ4 carrier | Aducanumab | Efficacy: PET SUVR | 54 weeks | ✓ | Sevigny 2016 PRIME ••• [38] | ||
| APOE ɛ4 noncarrier | ✓ | ||||||
| APOE ɛ4 carrier | Aducanumab (10 mg/kg) | Safety: ARIA-E | 54 weeks | ✓ | Sevigny 2016 PRIME •• [38] | ||
| APOE ɛ4 noncarrier | ✓ | ||||||
| APOE ɛ4 carrier | Aducanumab (10 mg/kg) | Safety: ARIA-E and ARIA-H | ✓ | ||||
| APOE ɛ4 noncarrier | ✓ | ||||||
| APOE ɛ4 carrier | Aducanumab (10 mg/kg) | Safety: ARIA-H | ✓ | ||||
| APOE ɛ4 noncarrier | ✓ | ||||||
| APOE carrier | Lecanemab(10 mg/kg biweekly) | Efficacy: ADCOMS | 18 mo | ✓ | Swanson 2021 BAN2401-G000-201 ••• [8] | ||
| APOE noncarrier | ✓ | ||||||
| APOE carrier | Lecanemab(2.5 mg/kg biweekly) | Safety: ARIA-E | 18 mo | ✓ | Swanson 2021 BAN2401-G000-201 ••• [8] | ||
| APOE noncarrier | ✓ | ||||||
| APOE carrier | Lecanemab(5 mg/kg monthly) | Safety: ARIA-E | 18 mo | ✓ | Swanson 2021 BAN2401-G000-201 ••• [8] | ||
| APOE noncarrier | ✓ | ||||||
| APOE carrier | Lecanemab(5 mg/kg biweekly) | Safety: ARIA-E | 18 mo | ✓ | Swanson 2021 BAN2401-G000-201 ••• [8] | ||
| APOE noncarrier | ✓ | ||||||
| APOE carrier | Lecanemab(10 mg/kg monthly) | Safety: ARIA-E | 18 mo | ✓ | Swanson 2021 BAN2401-G000-201 ••• [8] | ||
| APOE noncarrier | ✓ | ||||||
| APOE carrier | Lecanemab(10 mg/kg biweekly) | Safety: ARIA-E | 18 mo | ✓ | Swanson 2021 BAN2401-G000-201 ••• [8] | ||
| APOE noncarrier | ✓ |
AD, Alzheimer’s disease; ADAS-cog 13, Alzheimer’s Disease Assessment Scale-Cognitive Subscale; ADCS ADL, Alzheimer’s Disease Cooperative Study-Activities of Daily Living; APOE ɛ4, apolipoprotein E ɛ4 allele; ARIA-E, amyloid-related imaging abnormalities (oedema); ARIA-H, amyloid-related imaging abnormalities (micro-hemorrhages, macro-hemorrhages, or superficial siderosis); CDR-SB, Clinical Dementia Rating—Sum of Boxes; eAD, early AD; kg; kilograms; MCI, mild cognitive impairment; mg, milligrams; MMSE, Mini-Mental State Examination; mo, month; PET, positron emission tomography; SUVR, standard uptake composite score; wk, week; y, year. •low risk of bias •• moderate risk of bias ••• high risk of bias.
DISCUSSION
Summary of findings
Overall, this review identified an abundance of studies reporting prognostic factors for disease progression in eAD. Studies reporting predicting factors were more limited and the main evidence was derived from five RCTs. Older age was associated with greater risk of disease progression. Greater cognitive impairment at baseline (measured by ADAS-cog11, CDR-SB, MMSE, FAQ) was associated with increased risk of disease progression. APOE genotype is a genetic biomarker present in approximately 70% of patients with AD. APOE4 may be a prognostic factor associated with disease progression as well as a predictive factor for treatment efficacy (APOE4 carriers were found to benefit more from therapy than non-carriers) and predictor of adverse response (ARIA) in the course of treatment with anti-amyloid monoclonal antibodies. Elevated biomarkers such as CSF or plasma p-tau, CSF t-tau, CSF t-tau/Aβ ratio, CSF p-tau/Aβ ratio, and plasma neurofilament light were all associated with increased risk of disease progression.
Comparison with other reviews
This systematic review contributes to the understanding of AD progression because it uses robust methodology to offer insights specifically regarding the progression of MCI to AD dementia. Although other reviews have been published, most focus on progression from pre-clinical stages to either MCI [40] or dementia [41] or MCI to dementia [42], and/or machine learning approaches [43]. Campbell et al. (2013) reviewed both markers of disease activity and clinical risk factors influencing the progression of MCI to dementia [42]. Authors identified modifiable and non-modifiable risk factors for progression of MCI to normal cognition, vascular or mixed dementia or AD. Non-modifiable factors for transition from MCI to AD included APOE and amnestic MCI while modifiable factors included anxiety, depression, apathy, diabetes/pre-diabetes, or neuropsychological symptoms. Ansart et al. (2021) performed a SLR focusing on automatically predicting clinical diagnosis of AD dementia in patients with MCI and a quantitative analysis of methodological choices [43]. Authors concluded that studies using cognitive variables or F-fluorodeoxyglucose (FDG) PET reported significantly better results than studies that did not, and that including other feature types does not significantly improve performance compared to using cognition or FDG PET alone. A recently published SLR by Mohanannair Geethadevi et al. aimed to identify multi-domain prognostic models used in middle-aged adults (aged 45 to 65 years) for predicting cognitive impairment or dementia [44]. The authors identified 14 unique multi-domain prognostic models and found diabetes, hypertension, obesity, and smoking were the most common modifiable risk factors used as predictors. The findings of the current systematic review align with those of a 2016 systematic review and meta-analysis that also investigated factors for progression from MCI to AD dementia (publication cutoff date: March 2015) [45]. Strong positive associations were found between several biomarkers (abnormal CSF p-tau, abnormal CSF tau/Aβ1 - 42) and progression to AD dementia. The presence of APOE4, white matter hyperintensities, older age, depression, and poor global performance scores at baseline were also found to be associated with disease progression [45], as was reported in the current review.
Implications
Many studies have evaluated factors that are prognostic of the natural history of AD in its early clinical stages or that may be predictive of the efficacy and safety of current treatments. However, the lack of SLRs mean that this literature is rather disparate and not easy to draw conclusions from. This systematic review seeks to bring this literature together and thereby contribute to the understanding of AD progression. The results of this review may have useful implications for recruitment of future clinical trials in that inclusion criteria could potentially be modified to include patients who are more likely to benefit from treatment or more likely to progress in the course of a clinical trial. The data may also be valuable in pre-specifying sub-group analyses.
Limitations
The findings presented here were identified using robust systematic review methodology. Nevertheless, the review has some limitations.
There were limited data available on predictive factors, with data available from only five studies and criteria focusing on four anti-amyloid monoclonal antibodies (among many other treatments under development); however, these were RCTs, which represent higher quality evidence.
We applied a restriction to English language studies only. This may mean that some relevant non-English language studies may have been excluded.
A prioritization step was used to focus on the most relevant studies; however, this may also have been a source of bias. Studies published before 2012 were excluded and small studies with less than 100 participants were de-prioritized. A group of clinical experts were consulted for their advice on which factors were most relevant.
More evidence was expected in the areas of genetic factors (APOE4) and imaging biomarkers, this may be due to low quality evidence being de-prioritized [46, 47] or exclusion of studies focusing on participants with normal cognition progressing to MCI or AD dementia.
Many of the included studies used data from the National Alzheimer’s Coordinating Center registry, which could have resulted in patient crossover among studies.
Although recent recommendations suggest diagnosis of AD should include Aβ biomarkers (CSF or positron emission tomography) and tau marker biomarkers (CSF or positron emission tomography), typically this more robust diagnosis has not been used in many of the retrospective studies or historical registries [48]. However, the number of studies including confirmatory biomarkers is expected to increase with the availability of disease-modifying therapies. This review highlights complexities around diagnosis and heterogeneity of studies. In the future, more studies assessing prognostic and predictive factors specifically in confirmed the MCI due to AD population will likely be available and significantly add to the evidence base. It should be noted that in this review some baseline populations described as MCI where patients are monitored for progression to AD, may be of mixed pathology.
In recent anti-amyloid RCTs, the specific populations recruited have been enriched for progression and exclude confounding pathologies [7, 38]. This may impact findings in that the population in RCTs may be quite different to those in observational studies.
This field of research is rapidly developing, and several interesting publications have been published since the literature searches for the review were conducted. Of note, the results of CLARITY AD and TRAILBLAZER-ALZ2 studies have been published [12, 49, 50]. In CLARITY AD, patients with eAD were randomly assigned to receive lecanemab (10 mg per kilogram of body weight every 2 weeks) or placebo for 18 months [12]. The publication presents subgroup analyses which indicated that factors such as use of symptomatic AD medication, clinical subgroup (mild AD), APOE4 (non-carrier), gender (male), age (older) were associated with more favorable outcomes (in terms of CDR-SB) when patients were treated with lecanemab [12]. In TRAILBLAZER-ALZ2, patients with eAD were randomly assigned to receive donanemab (700 mg for the first 3 doses and 1400 mg thereafter) or placebo, intravenously every 4 weeks for up to 72 weeks. Subgroup analyses of low-medium-tau participants showed greater cognitive and functional benefits of donanemab in those at earlier stage of disease and under the age of 75 [50].
Conclusions
Age was the strongest prognostic factor associated with disease progression. Elevated biomarkers were also associated with increased risk of disease progression, providing further support for their use in patient selection for clinical trials and as aids in diagnosis of eAD. Baseline impairment was a prognostic factor. APOE4 was predictive of an adverse response, the occurrence of ARIA, in the course of treatment with anti-amyloid monoclonal antibodies. This fits with emerging evidence from clinical trials and is of relevance to treatment initiation and monitoring.
ACKNOWLEDGMENTS
The authors would like to thank Helen Lilley, Principal Medical Writer at Mtech Access for providing medical writing support.
FUNDING
Mtech Access Ltd were commissioned by Roche to conduct the SLR, analyze the findings, and prepare the manuscript.
CONFLICT OF INTEREST
Jeffrey Cummings has provided consultation to Acadia, Actinogen, Acumen, AlphaCognition, Aprinoia, AriBio, Artery, Biogen, BioVie, Cassava, Cerecin, Diadem, EIP Pharma, Eisai, GemVax, Genentech, GAP Innovations, Janssen, Jocasta, Karuna, Lilly, Lundbeck, LSP, Merck, NervGen, Novo Nordisk, Oligomerix, Optoceutics, Ono, Otsuka, PRODEO, Prothena, ReMYND, Roche, Sage Therapeutics, Signant Health, Simcere, Sunbird Bio, Suven, SynapseBio, TrueBinding, Vaxxinity, and Wren pharmaceutical, assessment, and investment companies. Jeffrey Cummings is supported by NIGMS grant P20GM109025; NINDS grant U01NS093334; NIA grant R01AG053798; NIA grant P20AG068053; NIA grant P30AG072959; NIA grant R35AG71476; Alzheimer’s Disease Drug Discovery Foundation (ADDF); Ted and Maria Quirk Endowment; and the Joy Chambers-Grundy Endowment.
Independent of this work, Nicolas Villian received research support from Fondation Bettencourt-Schueller, Fondation Servier, Union Nationale pour les Intérêts de la Médecine (UNIM), Fondation Claude Pompidou, Fondation Alzheimer and Fondation pour la Recherche sur l’Alzheimer; travel grant from the Movement Disorders Society, Merz-Pharma, UCB Pharma, and GE Healthcare SAS; is an unpaid local principal investigator or sub-investigator in NCT04241068 and NCT05310071 (aducanumab, Biogen), NCT04437511 (donanemab, Eli-Lilly), NCT05463731 (remternetug, Eli-Lilly), NCT04592341 (gantenerumab, Roche), NCT03887455 (lecanemab, Eisai), NCT03352557 (gosuranemab, Biogen), NCT03828747 and NCT03289143 (semorinemab, Roche), NCT04619420 (JNJ-63733657, Janssen –Johnson & Johnson), NCT04374136 (AL001, Alector), NCT04592874 (AL002, Alector), NCT04867616 (bepranemab, UCB Pharma), NCT04777396 and NCT04777409 (semaglutide, Novo Nordisk), NCT05469360 (NIO752, Novartis), is an unpaid national coordinator for NCT05564169 (masitinib, ABScience), NCT (AD04, ADvantage Therapeutics GmbH); and has given unpaid lectures in symposia organized by Eisai and the Servier Foundation.
Oskar Hansson has acquired research support (for the institution) from ADx, AVID Radiopharmaceuticals, Biogen, Eli Lilly, Eisai, Fujirebio, GE Healthcare, Pfizer, and Roche. In the past 2 years, he has received consultancy/speaker fees from AC Immune, Amylyx, Alzpath, BioArctic, Biogen, Cerveau, Eisai, Eli Lilly, Fujirebio, Merck, Novartis, Novo Nordisk, Roche, Sanofi and Siemens.
Work at the authors’ research center was supported by the Swedish Research Council (2022-00775), ERA PerMed (ERAPERMED2021-184), the Knut and Alice Wallenberg foundation (2017-0383), the Strategic Research Area MultiPark (Multidisciplinary Research in Parkinson’s disease) at Lund University, the Swedish Alzheimer Foundation (AF-980907), the Swedish Brain Foundation (FO2021-0293), The Parkinson foundation of Sweden (1412/22), the Cure Alzheimer’s fund, the Konung Gustaf V:s och Drottning Victorias Frimurarestiftelse, the Skåne University Hospital Foundation (2020-O000028), Regionalt Forskningsstöd (2022-1259) and the Swedish federal government under the ALF agreement (2022-Projekt0080).
Takeshi Iwatsubo has provided consultation to Biogen, Eisai, Eli Lilly, and Roche/Chugai.
Maria João Garcia and Sasha Bozeat are employees of and hold shares in F. Hoffmann-La Roche, Ltd.
Regina Leadley, Janine Ross, and Gabrielle Redhead are employees of Mtech Access.
DATA AVAILABILITY
The data supporting the findings of this study are available within the article and/or its supplementary material and/or the cited publications.
SUPPLEMENTARY MATERIAL
[1] The supplementary material is available in the electronic version of this article: https://dx.doi.org/10.3233/ADR-230045.
REFERENCES
[1] | Nichols E , Vos T ((2021) ) The estimation of the global prevalence of dementia from 1990-2019 and forecasted prevalence through 2050: An analysis for the Global Burden of Disease (GBD) study 2019. Alzheimers Dement 17: , e051496. |
[2] | Alzheimer’s Association ((2020) ) 2020 Alzheimer’s disease facts and figures. Alzheimers Dement 16: , 391–460. |
[3] | Porsteinsson AP , Isaacson RS , Knox S , Sabbagh MN , Rubino I ((2021) ) Diagnosis of early Alzheimer’s disease: Clinical practice in 2021. J Prev Alzheimers Dis 8: , 371–386. |
[4] | Jutten RJ , Sikkes SAM , Van der Flier WM , Scheltens P , Visser PJ , Tijms BM ; Alzheimer’s Disease Neuroimaging Initiative ((2021) ) Finding treatment effects in Alzheimer trials in the face of disease progression heterogeneity. Neurology 96: , e2673. |
[5] | Marasco RA ((2020) ) Current and evolving treatment strategies for the Alzheimer disease continuum. Am J Manag Care 26: , S167–S176. |
[6] | Jack CR Jr , Bennett DA , Blennow K , Carrillo MC , Dunn B , Haeberlein SB , Holtzman DM , Jagust W , Jessen F , Karlawish J , Liu E , Molinuevo JL , Montine T , Phelps C , Rankin KP , Rowe CC , Scheltens P , Siemers E , Snyder HM , Sperling R ; Contributors ((2018) ) NIA-AA Research Framework: Toward a biological definition of Alzheimer’s disease. Alzheimers Dementia 14: , 535–562. |
[7] | Budd Haeberlein S , Aisen PS , Barkhof F , Chalkias S , Chen T , Cohen S , Dent G , Hansson O , Harrison K , von Hehn C , Iwatsubo T , Mallinckrodt C , Mummery CJ , Muralidharan KK , Nestorov I , Nisenbaum L , Rajagovindan R , Skordos L , Tian Y , van Dyck CH , Vellas B , Wu S , Zhu Y , Sandrock A ((2022) ) Two randomized phase 3 studies of aducanumab in early Alzheimer’s disease. J Prev Alzheimers Dis 9: , 197–210. |
[8] | Swanson CJ , Zhang Y , Dhadda S , Wang J , Kaplow J , Lai RYK , Lannfelt L , Bradley H , Rabe M , Koyama A , Reyderman L , Berry DA , Berry S , Gordon R , Kramer LD , Cummings JL ((2021) ) A randomized, double-blind,phase 2b proof-of-concept clinical trial in early Alzheimer’sdisease with lecanemab, an anti-Abeta protofibril antibody. Alzheimers Res Ther 13: , 80. |
[9] | Mintun MA , Lo AC , Evans CD , Wessels AM , Ardayfio PA , Andersen SW , Shcherbinin S , Sparks J , Sims JR , Brys M , Apostolova LG , Salloway SP , Skovronsky DM ((2021) ) Donanemab in early Alzheimer’s disease. N Engl J Med 384: , 1691–1704. |
[10] | ClinicalTrials.gov AStudy of Remternetug (LY3372993) in Participants With Alzheimer’s Disease (TRAILRUNNERALZ 1), https://clinicaltrials.gov/ct2/show/NCT05463731, Accessed 15 November 2023. |
[11] | Cummings J , Lee G , Nahed P , Kambar MEZN , Zhong K , Fonseca J , Taghva K ((2022) ) Alzheimer’s disease drug development pipeline: 2022. Alzheimers Dement (N Y) 8: , e12295. |
[12] | van Dyck CH , Swanson CJ , Aisen P , Bateman RJ , Chen C , Gee M , Kanekiyo M , Li D , Reyderman L , Cohen S , Froelich L , Katayama S , Sabbagh M , Vellas B , Watson D , Dhadda S , Irizarry M , Kramer LD , Iwatsubo T ((2023) ) Lecanemab in early Alzheimer’s disease. N Engl J Med 388: , 9–21. |
[13] | Food and Drug Administration (FDA) FDA Converts Novel Alzheimer’s Disease Treatment to Traditional Approval, https://www.fda.gov/news-events/press-announcements/fda-converts-novel-alzheimers-disease-treatmenttraditional-approval, Accessed 15 November 2023. |
[14] | PRISMA Group PRISMA (Preferred Reporting Items for Systematic Reviews and Meta-Analyses) statement [Internet], http://prisma-statement.org/ |
[15] | Riley RD , Moons KGM , Snell KIE , Ensor J , Hooft L , Altman DG , Hayden J , Collins GS , Debray TPA ((2019) ) A guide to systematic review and meta-analysis of prognostic factor studies. BMJ 364: , k4597. |
[16] | European Medicines Agency Ebixa: Procedural steps taken and scientific information after the authorisation, https://www.ema.europa.eu/en/documents/procedural-steps-after/ebixa-epar-procedural-steps-taken-scientific-information-after-authorisationen.pdf, Accessed 15 November 2023. |
[17] | Cochrane The Quality In Prognosis Studies (QUIPS) tool, http://methods.cochrane.org/sites/methods.cochrane.org.prognosis/files/uploads/QUIPS%20tool.pdf, Accessed 17 January 2022. |
[18] | Sterne JAC , Savović J , Page MJ , Elbers RG , Blencowe NS , Boutron I , Cates CJ , Cheng HY , Corbett MS , Eldridge SM , Emberson JR , Hernán MA , Hopewell S , Hróbjartsson A , Junqueira DR , Jüni P , Kirkham JJ , Lasserson T , Li T , McAleenan A , Reeves BC , Shepperd S , Shrier I , Stewart LA , Tilling K , White IR , Whiting PF , Higgins JPT ((2019) ) RoB 2: A revised tool for assessing risk of biasin randomised trials. BMJ 366: , l4898. |
[19] | FDA-NIH Biomarker Working Group BEST (Biomarkers, EndpointS, and other Tools) Resource, Food and Drug Administration (US), https://www.ncbi.nlm.nih.gov/books/NBK326791/, Accessed 15 November 2023. |
[20] | Pichet Binette A , Palmqvist S , Bali D , Farrar G , Buckley CJ , Wolk DA , Zetterberg H , Blennow K , Janelidze S , Hansson O ((2022) ) Combining plasma phospho-tau and accessible measures to evaluate progression to Alzheimer’s dementia in mild cognitive impairment patients. Alzheimers Res Ther 14: , 46. |
[21] | Tifratene K , Robert P , Metelkina A , Pradier C , Dartigues JF ((2015) ) Progression of mild cognitive impairment to dementia due to AD in clinical settings. Neurology 85: , 331–338. |
[22] | Mai Y , Cao Z , Xu J , Yu Q , Yang S , Tang J , Zhao L , Fang W , Luo Y , Lei M , Mok VCT , Shi L , Liao W , Liu J ; Alzheimer’s Disease Neuroimaging Initiative ((2022) ) AD resemblance atrophy index of brain magnetic resonance imaging in predicting the progression of mild cognitive impairment carrying Apolipoprotein E-epsilon4 Allele. Front Aging Neurosci 14: , 859492. |
[23] | Richard E , Schmand B , Eikelenboom P , Yang SC , Ligthart SA , Moll Van Charante EP , Van Gool WA ((2012) ) Symptoms of apathy are associated with progression from mild cognitive impairment to Alzheimer’s disease in non-depressed subjects for the Alzheimer’s disease neuroimaging initiative. Dement Geriatr Cogn Disord 33: , 204–209. |
[24] | Han H , Qin Y , Ge X , Cui J , Liu L , Luo Y , Yang B , Yu H ((2021) ) Risk assessment during longitudinal progression of cognition in older adults: A community-based bayesian networks model. Curr Alzheimer Res 18: , 232–242. |
[25] | Lee YM , Park JM , Lee BD , Moon E , Chung YI , Kang CJ ((2012) ) Memory impairment, in mild cognitive impairment without significant cerebrovascular disease, predicts progression to Alzheimer’s disease. Dement Geriatr Cogn Disord 33: , 240–244. |
[26] | Pyun JM , Park YH , Kim HR , Suh J , Kang MJ , Kim BJ , Youn YC , Jang JW , Kim S ((2017) ) Posterior atrophy predicts time to dementia in patients with amyloid-positive mild cognitive impairment. Alzheimers Res Ther 9: , 99. |
[27] | LoBue C , Woon FL , Rossetti HC , Hynan LS , Hart J , Cullum CM ((2018) ) Traumatic brain injury history and progression from mild cognitive impairment to Alzheimer disease. Neuropsychology 32: , 401–409. |
[28] | Cullen NC , Leuzy A , Palmqvist S , Janelidze S , Stormrud S , Pesini P , Sarasa L , Allue JA , Proctor NK , Zetterberg H , Dage JL , Blennow K , Mattsson-Carlgren N , Hansson O ((2021) ) Individualized prognosis of cognitive decline and dementia in mild cognitive impairment based on plasma biomarker combinations. Nat Aging 1: , 114–123. |
[29] | Palmqvist S , Tideman P , Cullen N , Zetterberg H , Blennow K , ; Alzheimer’s Disease Neuroimaging Initiative; Dage JL , Stomrud E , Janelidze S , Mattsson-Carlgren N , Hansson O ((2021) ) Prediction of future Alzheimer’s disease dementia using plasma phospho-tau combined with other accessible measures. Nat Med 27: , 1034–1042. |
[30] | Therriault J , Benedet AL , Pascoal TA , Lussier FZ , Tissot C , Karikari TK , Ashton NJ , Chamoun M , Bezgin G , Mathotaarachchi S , Gauthier S , Saha-Chaudhuri P , Zetterberg H , Blennow K , Rosa-Neto P ; Alzheimer’s Disease Neuroimaging Initiative ((2021) ) Association of plasma P-tau181 with memory decline in non-demented adults. fcab. Brain Commun 3: , 136. |
[31] | Spencer BE , Jennings RG , Brewer JB ((2019) ) Combined biomarker prognosis of mild cognitive impairment: An 11-year follow-up study in the Alzheimer’s Disease Neuroimaging Initiative. J Alzheimers Dis 68: , 1549–1559. |
[32] | Xue M , Sun FR , Ou YN , Shen XN , Li HQ , Huang YY , Dong Q , Tan L , Yu JT ((2020) ) Association of cerebrospinal fluid neurogranin levels with cognition and neurodegeneration in Alzheimer’s disease. Aging 12: , 9365–9379. |
[33] | Wolfsgruber S , Polcher A , Koppara A , Kleineidam L , Frolich L , Peters O , Hull M , Ruther E , Wiltfang J , Maier W , Kornhuber J , Lewczuk P , Jessen F , Wagner M ((2017) ) Cerebrospinal fluid biomarkers and clinical progression in patients with subjective cognitive decline and mild cognitive impairment. J Alzheimers Dis 58: , 939–950. |
[34] | Spalletta G , Caltagirone C , Girardi P , Gianni W , Casini AR , Palmer K ((2012) ) The role of persistent and incident major depression on rate of cognitive deterioration in newly diagnosed Alzheimer’s disease patients. Psychiatry Res 198: , 263–268. |
[35] | Mouchet J , Betts KA , Georgieva MV , Ionescu-Ittu R , Butler LM , Teitsma X , Delmar P , Kulalert T , Zhu J , Lema N , Desai U ((2021) ) Classification, prediction, and concordance of cognitive and functional progression in patients with mild cognitive impairment in the United States: A latent class analysis. J Alzheimers Dis 82: , 1667–1682. |
[36] | Tosto G , Zimmerman ME , Carmichael OT , Brickman AM ((2014) ) Predicting aggressive decline in mild cognitive impairment: The importance of white matter hyperintensities. JAMA Neurol 71: , 872–877. |
[37] | Salloway S , Chalkias S , Barkhof F , Burkett P , Barakos J , Purcell D , Suhy J , Forrestal F , Tian Y , Umans K , Wang G , Singhal P , Budd Haeberlein S , Smirnakis K ((2022) ) Amyloid-related imaging abnormalities in 2 phase 3 studies evaluating aducanumab in patients with early Alzheimer disease. JAMA Neurol 79: , 13–21. |
[38] | Sevigny J , Chiao P , Bussiere T , Weinreb PH , Williams L , Maier M , Dunstan R , Salloway S , Chen T , Ling Y , O’Gorman J , Qian F , Arastu M , Li M , Chollate S , Brennan MS , Quintero-Monzon O , Scannevin RH , Arnold HM , Engber T , Rhodes K , Ferrero J , Hang Y , Mikulskis A , Grimm J , Hock C , Nitsch RM , Sandrock A ((2016) ) The antibody aducanumab reduces Abeta plaques in Alzheimer’s disease. Nature 537: , 50–56. |
[39] | Ostrowitzki S , Lasser RA , Dorflinger E , Scheltens P , Barkhof F , Nikolcheva T , Ashford E , Retout S , Hofmann C , Delmar P , Klein G , Andjelkovic M , Dubois B , Boada M , Blennow K , Santarelli L , Fontoura P , SCarlet RoAD Investigators ((2017) ) A phase III randomized trial of gantenerumab in prodromal Alzheimer’s disease. Alzheimers Res Ther 9: , 95. |
[40] | Wang J , Wang L , Zhou X , Wen X , Zhen X ((2019) ) Risk factors for predicting progression from normal cognition to mild cognitive impairment: Protocol for a systematic review and meta-analysis of cohort studies. BMJ Open 9: , e027313. |
[41] | Gao Q , Gwee X , Feng L , Nyunt MSZ , Feng L , Collinson SL , Chong MS , Lim WS , Lee TS , Yap P , Yap KB , Ng TP ((2018) ) Mild cognitive impairment reversion and progression: Rates and predictors in community-living older persons in the Singapore longitudinal ageing studies cohort. Dement Geriatr Cogn Dis Extra 8: , 226–237. |
[42] | Campbell NL , Unverzagt F , LaMantia MA , Khan BA , Boustani MA ((2013) ) Risk factors for the progression of mild cognitive impairment to dementia. Clin Geriatr Med 29: , 873–893. |
[43] | Ansart M , Epelbaum S , Bassignana G , Bône A , Bottani S , Cattai T , Couronné R , Faouzi J , Koval I , Louis M , Thibeau-Sutre E , Wen J , Wild A , Burgos N , Dormont D , Colliot O , Durrleman S ((2021) ) Predicting the progression of mild cognitive impairment usingmachine learning: A systematic, quantitative and critical review. Med Image Anal 67: , 101848. |
[44] | Mohanannair Geethadevi G , Quinn TJ , George J , Anstey KJ , Bell JS , Sarwar MR , Cross AJ (2023) Multi-domain prognostic models used inmiddle-aged adults without known cognitive impairment for predictingsubsequent dementia. Cochrane Database Syst Rev CD014885. |
[45] | Li JQ , Wang HF , Tan MS , Tan L , Xu W , Zhao QF , Wang J , Jiang T , Yu JT ((2016) ) Risk factors for predicting progression from mild cognitive impairment to Alzheimer’s disease: A systematic review and meta-analysis of cohort studies. J Neurol Neurosurg Psychiatry 87: , 476–484. |
[46] | Tarnanas I , Tsolaki A , Wiederhold M , Wiederhold B , Tsolaki M ((2015) ) Five-year biomarker progression variability for Alzheimer’s disease dementia prediction: Can a complex instrumental activities of daily living marker fill in the gaps? Alzheimers Dement (Amst) 1: , 521–532. |
[47] | Choo IH , Chong A , Chung JY , Ha JM , Choi YY , Kim H ((2022) ) A single ine amyloid positron emission tomography could be sufficient for predicting Alzheimer’s disease conversion in mild cognitive impairment. Psychiatry Investig 19: , 394–400 basel. |
[48] | Dubois B , Villain N , Frisoni GB , Rabinovici GD , Sabbagh M , Cappa S , Bejanin A , Bombois S , Epelbaum S , Teichmann M , Habert MO , Nordberg A , Blennow K , Galasko D , Stern Y , Rowe CC , Salloway S , Schneider LS , Cummings JL , Feldman HH ((2021) ) Clinical diagnosis of Alzheimer’s disease: Recommendations of the International Working Group. Lancet Neurol 20: , 484–496. |
[49] | Sims JR , Zimmer JA , Evans CD , Lu M , Ardayfio P , Sparks J , Wessels AM , Shcherbinin S , Wang H , Monkul Nery ES , Collins EC , Solomon P , Salloway S , Apostolova LG , Hansson O , Ritchie C , Brooks DA , MintunM , Skovronsky DM ; TRAILBLAZER-ALZ 2 Investigators ((2023) ) Donanemabin early symptomatic Alzheimer disease: The TRAILBLAZER-ALZ 2randomized clinical trial. JAMA 330: , 512–527. |
[50] | Skovronsky D , White A , Mintun M 2023 AAIC Lilly Alzheimer’s Disease Update, https://investor.lilly.com/static-files/ab284d69-1723-41e4-b234-357bfad8849a, Accessed 15 November 2023. |
[51] | Janelidze S , Mattsson N , Palmqvist S , Smith R , Beach TG , Serrano GE , Chai X , Proctor NK , Eichenlaub U , Zetterberg H , Blennow K , Reiman EM , Stomrud E , Dage JL , Hansson O ((2020) ) Plasma P-tau181 in Alzheimer’s disease: Relationship to other biomarkers, differential diagnosis, neuropathology and longitudinal progression to Alzheimer’s dementia. Nat Med 26: , 379–386. |
[52] | Van Loenhoud AC , Groot C , Bocancea DI , Barkhof F , Teunissen C , Scheltens P , Van De Flier WM , Ossenkoppele R ((2022) ) Association of education and intracranial volume with cognitive trajectories and mortality rates across the Alzheimer disease continuum. Neurology 98: , E1679–E1691. |


