
Principles of Design of Clinical Trials for Prevention and Treatment of Alzheimer’s Disease and Aging-Associated Cognitive Decline in the ACH2.0 Perspective: Potential Outcomes, Challenges, and Solutions
Abstract
With the Amyloid Cascade Hypothesis (ACH) largely discredited, the ACH2.0 theory of Alzheimer’s disease (AD) has been recently introduced. Within the framework of the ACH2.0, AD is triggered by amyloid-β protein precursor (AβPP)-derived intraneuronal Aβ (iAβ) and is driven by iAβ produced in the AβPP-independent pathway and retained intraneuronally. In this paradigm, the depletion of extracellular Aβ or suppression of Aβ production by AβPP proteolysis, the two sources of AβPP-derived iAβ, would be futile in symptomatic AD, due to its reliance on iAβ generated independently of AβPP, but effective in preventing AD and treating Aging-Associated Cognitive Decline (AACD) driven, in the ACH2.0 framework, by AβPP-derived iAβ. The observed effect of lecanemab and donanemab, interpreted in the ACH2.0 perspective, supports this notion and mandates AD-preventive clinical trials. Such trials are currently in progress. They are likely, however, to fail or to yield deceptive results if conducted conventionally. The present study considers concepts of design of clinical trials of lecanemab, donanemab, or any other drug, targeting the influx of AβPP-derived iAβ, in prevention of AD and treatment of AACD. It analyzes possible outcomes and explains why selection of high-risk asymptomatic participants seems reasonable but is not. It argues that outcomes of such AD preventive trials could be grossly misleading, discusses inevitable potential problems, and proposes feasible solutions. It advocates the initial evaluation of this type of drugs in clinical trials for treatment of AACD. Whereas AD protective trials of these drugs are potentially of an impractical length, AACD clinical trials are expected to yield unequivocal results within a relatively short duration. Moreover, success of the latter, in addition to its intrinsic value, would constitute a proof of concept for the former. Furthermore, this study introduces concepts of the active versus passive iAβ depletion, contends that targeted degradation of iAβ is the best therapeutic strategy for both prevention and treatment of AD and AACD, proposes potential iAβ-degrading drugs, and describes their feasible and unambiguous evaluation in clinical trials.
INTRODUCTION
The clinical trials of candidate drugs for Alzheimer’s disease (AD) and Aging-Associated Cognitive Decline (AACD) described in the present study have been designed within the framework of the Amyloid Cascade Hypothesis version 2.0 (ACH2.0) theory of AD. The ACH2.0 refers to its predecessor, the ACH, an interpretation of AD that has been largely discredited. Despite a similarity in their designations (“ACH” and “ACH2.0”), the two theories of AD are fundamentally different. Their only common element is the centrality of amyloid-β (Aβ) as the causative agent in the disease. But even this limited and narrow commonality is superficial: Whereas in the ACH, AD is caused by extracellular Aβ, within the framework of the ACH2.0 the disease is triggered by the intraneuronal amyloid-β protein precursor (AβPP)-derived Aβ (iAβ) accumulated to the critical level, and its symptomatic stage is driven by iAβ generated in the AβPP-independent, self-perpetuating pathway. The fundamentals of the ACH2.0 are described and analyzed in detail elsewhere [1–4] and its principles are briefly summarized in the following section below.
The requirements for potential AD drugs within the ACH2.0 framework are distinctly different from those defined in the ACH. Within the ACH, the drugs (referred to below as “ACH-based”) are designed to reduce the levels of extracellular Aβ. Within the framework of the ACH2.0, on the other hand, the potential AD drugs are intended to reduce the levels of iAβ. Since the ACH-based drugs affect only extracellular Aβ (e.g., various mAbs, such as lecanemab and donanemab) and the AβPP proteolysis (e.g., BACE1 inhibitors), within the ACH2.0 framework they would be completely ineffective in symptomatic AD, that is driven by the AβPP-independent iAβ production pathway, which is insensitive to the above-mentioned drugs [1–4].
On the other hand, within the framework of the ACH2.0, ACH-based drugs, if administered sufficiently early pre-symptomatically, could be effective in prevention of AD by precluding AβPP-derived iAβ from reaching the critical level and triggering the activation of the AβPP-independent iAβ production pathway, the event which initiates the disease; this would delay or prevent the commencement of symptomatic AD for the duration of a treatment.
The ACH2.0 also provides guidelines for the design of conceptually different type of AD and AACD drugs [1–4]. These drugs act via the depletion of iAβ by its targeted degradation (reviewed in detail in [1, 4] and briefly discussed below) and are potentially effective both preventively and at the symptomatic stages of the disease. As analyzed below, whereas the design of clinical trials of the ACH2.0-guided drugs is relatively straightforward, the potential outcomes of clinical trials of the ACH-based drugs in prevention of AD are highly problematic. The present study analyzes these outcomes, discusses the inevitable challenges, and proposes feasible solutions.
PRINCIPLES OF THE AMYLOID CASCADE HYPOTHESIS 2.0: THE ENGINE THAT DRIVES AD
To better orient the reader, the present section briefly summarizes the Amyloid Cascade Hypothesis 2.0 (for in-detail description, see [1, 2, 4]). The ACH2.0 fundamentals include four core principles [1–4]. The first is that AD is both caused and driven by intraneuronal, rather than by extracellular, Aβ (posited in [1, 4]; supported by the observations in [5–17]). The second principle posits that AD is a two-stage disease [1, 2, 4]. The largely asymptomatic stage One is a decades-long accumulation of iAβ produced in the AβPP proteolytic/secretory pathway; when it reaches the critical level, it triggers the stage Two: the iAβ-anchored devastating cascade that includes tau pathology and culminates in neuronal loss [1–4]. The third ACH2.0 principle postulates that stage Two of AD is driven by iAβ produced in the AβPP-independent pathway [1, 2, 4]. The fourth AD principle asserts that the bulk, if not the entire output of the AβPP-independent Aβ production pathway is not secreted but is retained intraneuronally and, consequently, perpetuates its own production [1, 4]. Thus, in the ACH2.0, iAβ, generated by two discrete AD stage-specific cellular mechanisms, namely the AβPP proteolysis at the first stage and the AβPP-independent process at the second stage, powers the entire course of the disease [1, 2, 4].
The life-long accumulation of AβPP-derived iAβ occurs physiologically via two distinct mechanisms. The first mechanism is cellular uptake of secreted Aβ [18–33]. It appears that Aβ is internalized predominantly in the oligomerized form and that Aβ oligomerization is a prerequisite for its cellular uptake [23]. Thus, Aβ42 is taken up twice as effectively as Aβ40 because of its increased propensity to aggregate [20, 23]. The second source of AβPP-derived iAβ is its retention within the neuron [34–44]. The bulk of Aβ produced by AβPP proteolysis undergoes gamma cleavage on the external plasma membrane and is secreted. However, a fraction of AβPP and/or its C99 fragment is processed on the intracellular membranes in various cellular organelles [37, 38]. This fraction is retained intraneuronally.
Both the internalization of secreted Aβ and the retention of Aβ generated on the internal cellular membranes occurs physiologically in healthy humans as well as in future and current AD patients [33]; what distinguishes healthy and AD-destined individuals is the efficiency of these two components of the influx of AβPP-derived iAβ and, consequently, the rate of its accumulation. Consistent with this notion, all known mutation(s) or factors that protect from AD reduce the rate of AβPP-derived iAβ accumulation whereas the opposite is true for all known familial AD (FAD)-causing mutations and factors predisposing to AD [4]. For example, members of the ApoE family were shown to mediate internalization of extracellular Aβ [22]. The ApoE4 does it more effectively than other ApoE isoforms and, consequently, predisposes its carriers to AD [22]. Mutations in AβPP and in the presenilins that facilitate generation of the Aβ42 isoform expedite its influx into the iAβ pool via more effective cellular uptake of the secreted peptide; this, in turn, increases the rate of AβPP-derived iAβ accumulation and causes familiar AD [20]. Another example is the Swedish AβPP mutation that facilitates the gamma cleavage of the C99 fragment of AβPP on the intracellular membranes and thus increases the influx of AβPP-derived iAβ via its intraneuronal retention [43]. This elevates the rate of its accumulation and, consequently, causes familial AD. Similarly, some PSEN mutations increase the retention of Aβ produced in the AβPP proteolytic pathway within neuronal cells by facilitating the gamma-cleavage of C99 on internal (rather than on plasma) membranes; this also causes FAD [44].
In terms of the ACH2.0, AβPP-derived iAβ, accumulated to sufficient levels, elicits the integrated stress response (ISR) [45–55]. The elicitation of the ISR happens via iAβ-mediated activation of the PKR and/or HRI kinases; both processes were shown to occur in multiple model systems [55–61] and, in the case of PKR, in AD-affected neurons [56, 57]. iAβ-mediated activation of the PKR kinase occurs either via TNFα [60] or through the stimulation of the PKR activator protein, PACT [61], whereas activation of the HRI kinase occurs via the OMA1-DELE1-HRI signaling pathway [62, 63] as a consequence of mitochondrial distress shown to be caused by the high levels of iAβ [64–80]. PKR and/or HRI phosphorylate eIF2α at the serine 51 residue; when this occurs, the elicitation of the ISR ensues [45–48].
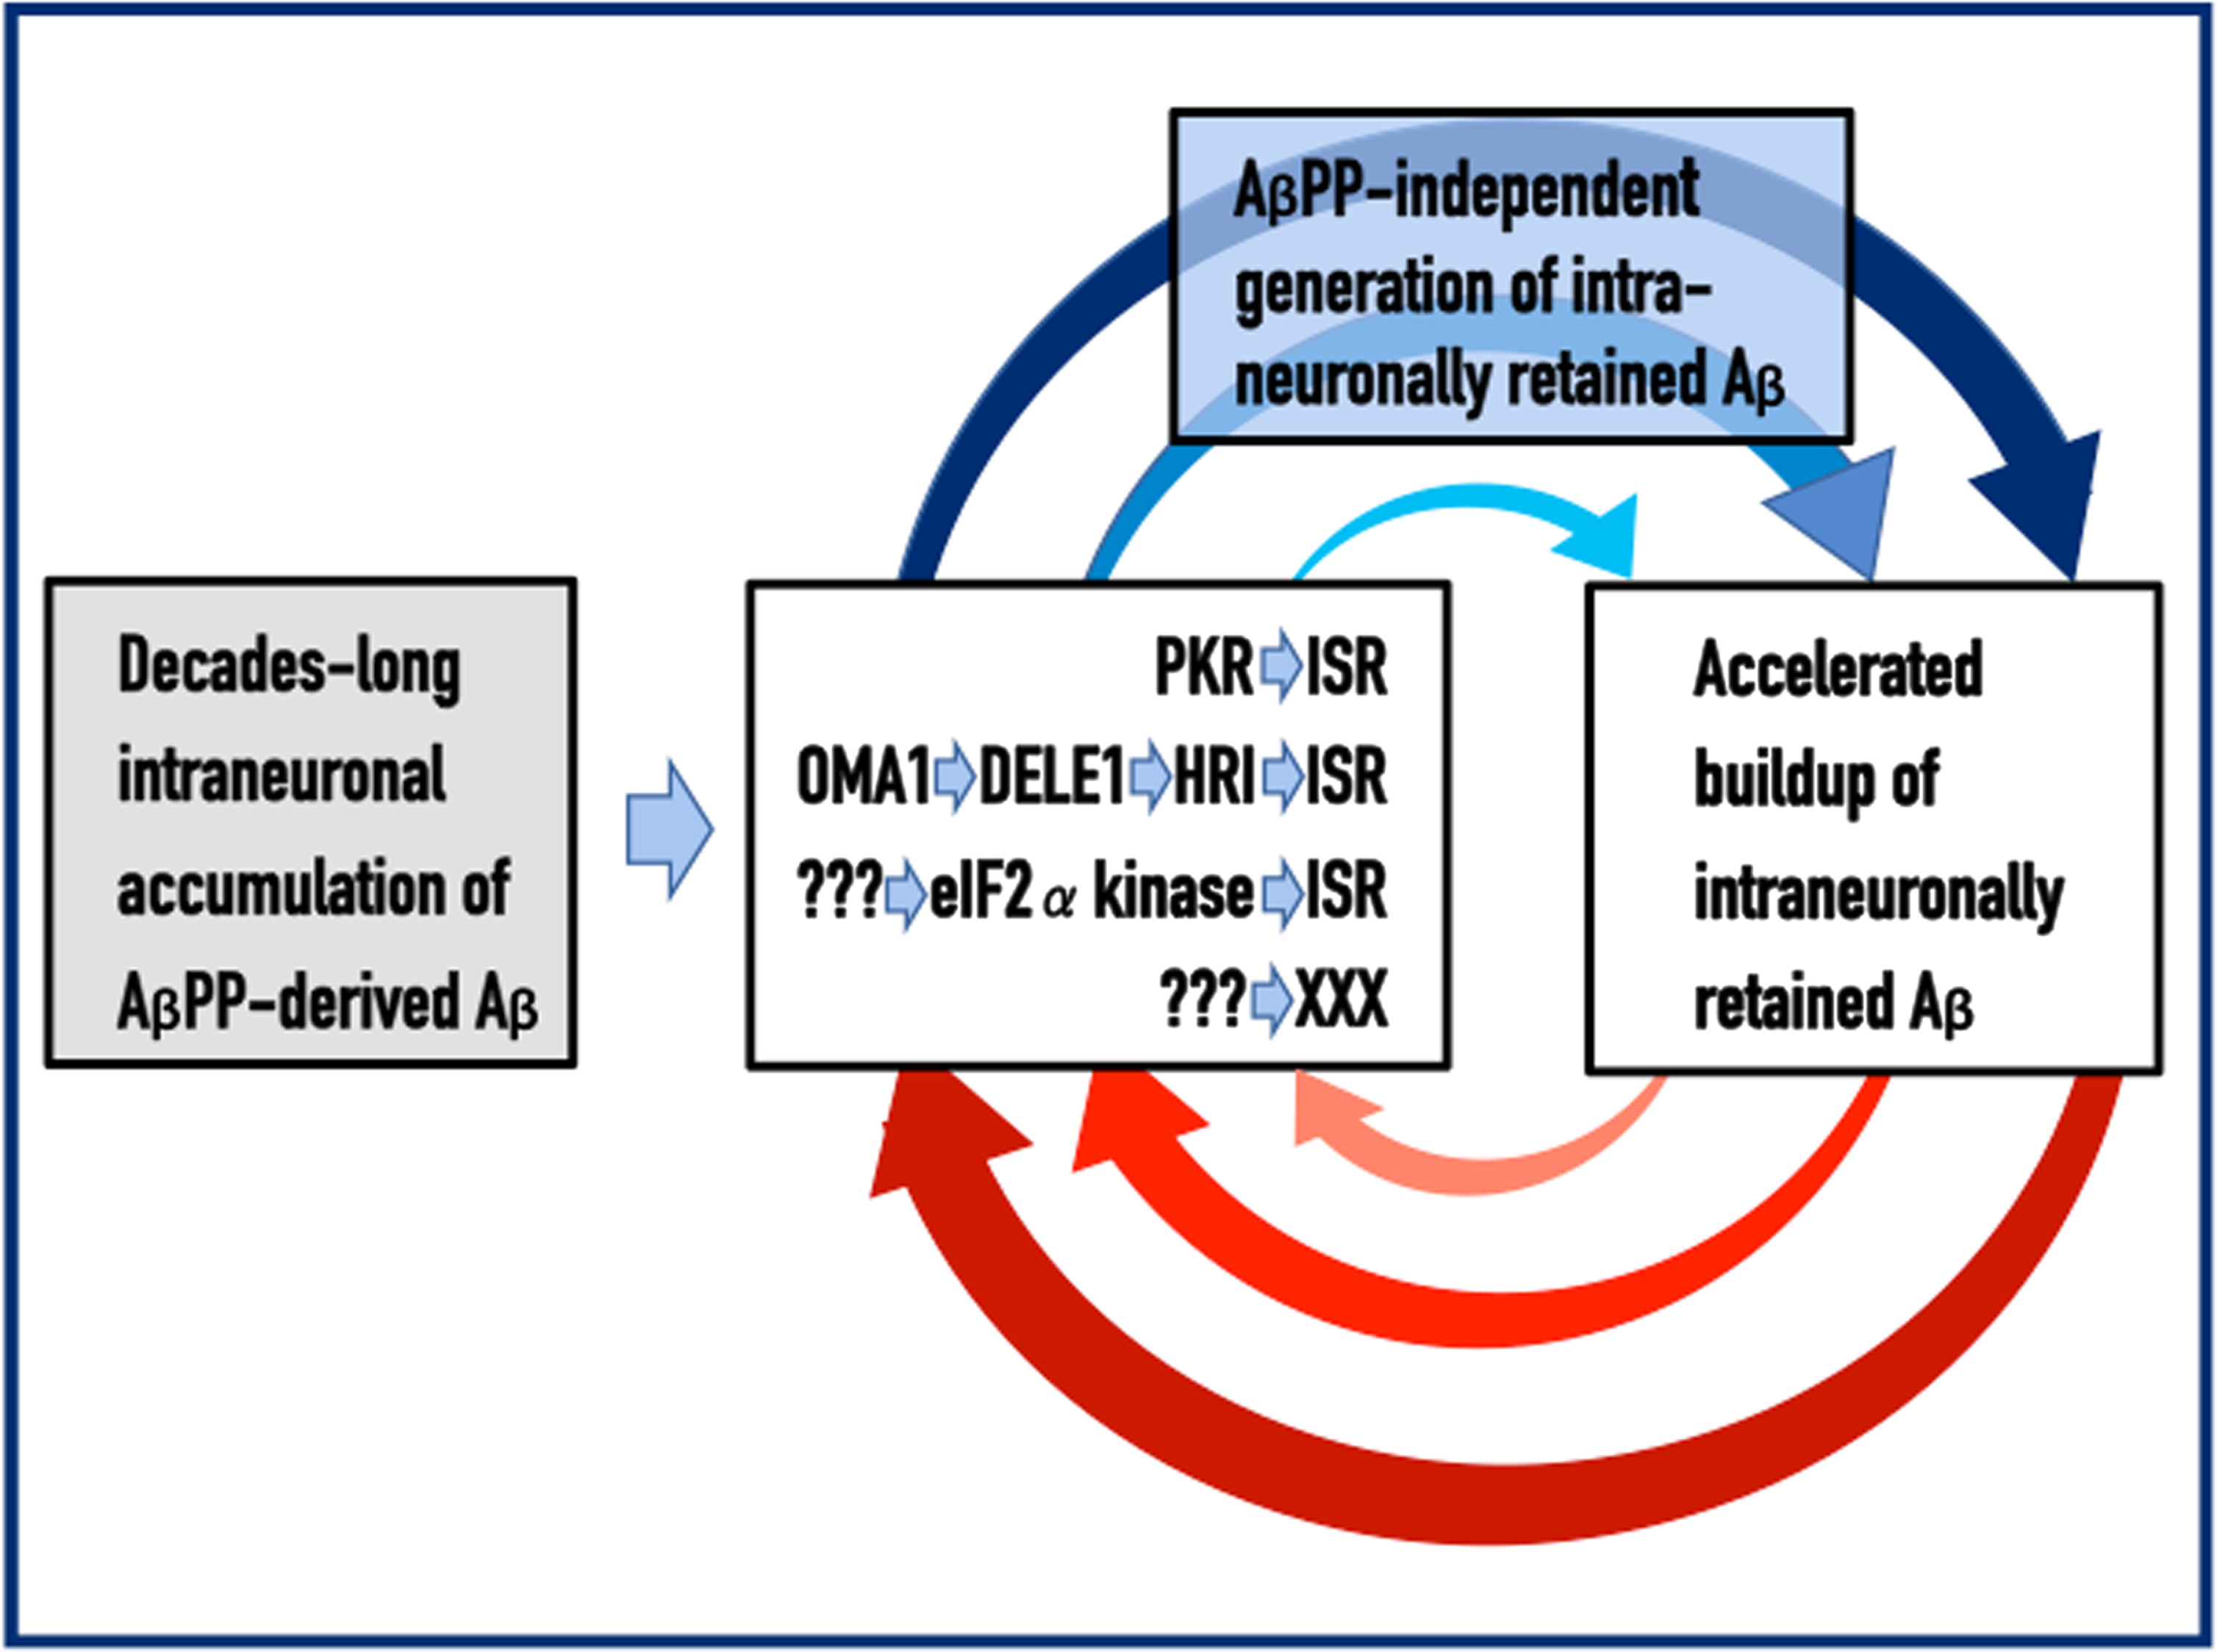
Under the ISR conditions, global cellular protein synthesis undergoes a severe reduction. Simultaneously, however, translation of selected mRNAs, notably including those encoding specific transcription factors, is significantly increased [45–50]. Apparently, these translation products contain components crucial for the operation of the AβPP-independent iAβ production pathway [1, 4]. When the latter is activated, the production of iAβ increases and, because it is retained within the cell, its intraneuronal levels are drastically and rapidly elevated. Increased iAβ levels both drive the AD pathology and sustain the activity of PKR and/or HRI; this, in turn, maintains the ISR, which propagates the operation of the AβPP-independent iAβ generation pathway and perpetuates the continuous influx of iAβ. These incessant cycles of iAβ-mediated propagation of its own generation, which continuously elevate its levels and thus promulgate a cascade of cellular events that include tau pathology and culminate in the neuronal loss, constitute the Engine that drives AD. The activation and operation of the AD Engine are depicted diagrammatically in Fig. 1.
Fig. 1
Principles of the Amyloid Cascade Hypothesis 2.0: The Engine that drives AD. Left box: The life-long accumulation of intraneuronal Aβ (iAβ) produced in the AβPP proteolytic pathway. It occurs via internalization of secreted extracellular Aβ and through retention within the neuron of a fraction of Aβ generated by gamma-cleavage of the C99 fragment of AβPP on intracellular rather than on plasma membranes. Middle box: iAβ, accumulated to the critical threshold, mediates the elicitation of the integrated stress response, ISR (or of a yet undefined pathway marked XXX). This occurs via the documented activation of two eIF2α kinases, PKR and HRI (other eIF2α kinases, or yet unidentified mediators denoted ???, could be also involved). Activated PKR and/or HRI phosphorylate eIF2α; this triggers the ISR. Top box: The ISR provides component(s) critical for the operation of the AβPP-independent iAβ generation pathway thus activating it; the bulk of the iAβ output in this pathway is retained intraneuronally. Right box: The increased influx of iAβ generated in the AβPP-independent pathway substantially elevates its steady-state levels, thus sustaining the activity of PKR and/or HRI that maintain the ISR, which propagates the operation of the AβPP-independent Aβ generation pathway and perpetuates the continuous influx of iAβ. These continuous cycles of iAβ-mediated propagation of its own generation constitute the Engine that drives AD. Arched arrows: The AD Engine, continuous cycles of iAβ-stimulated propagation of its own production.
ALZHEIMER’S DISEASE IS DEFINED BY THE DYNAMICS OF ACCUMULATION OF INTRANEURONAL Aβ: T1 THRESHOLD ARBITRATES BETWEEN HEALTH AND DISEASE
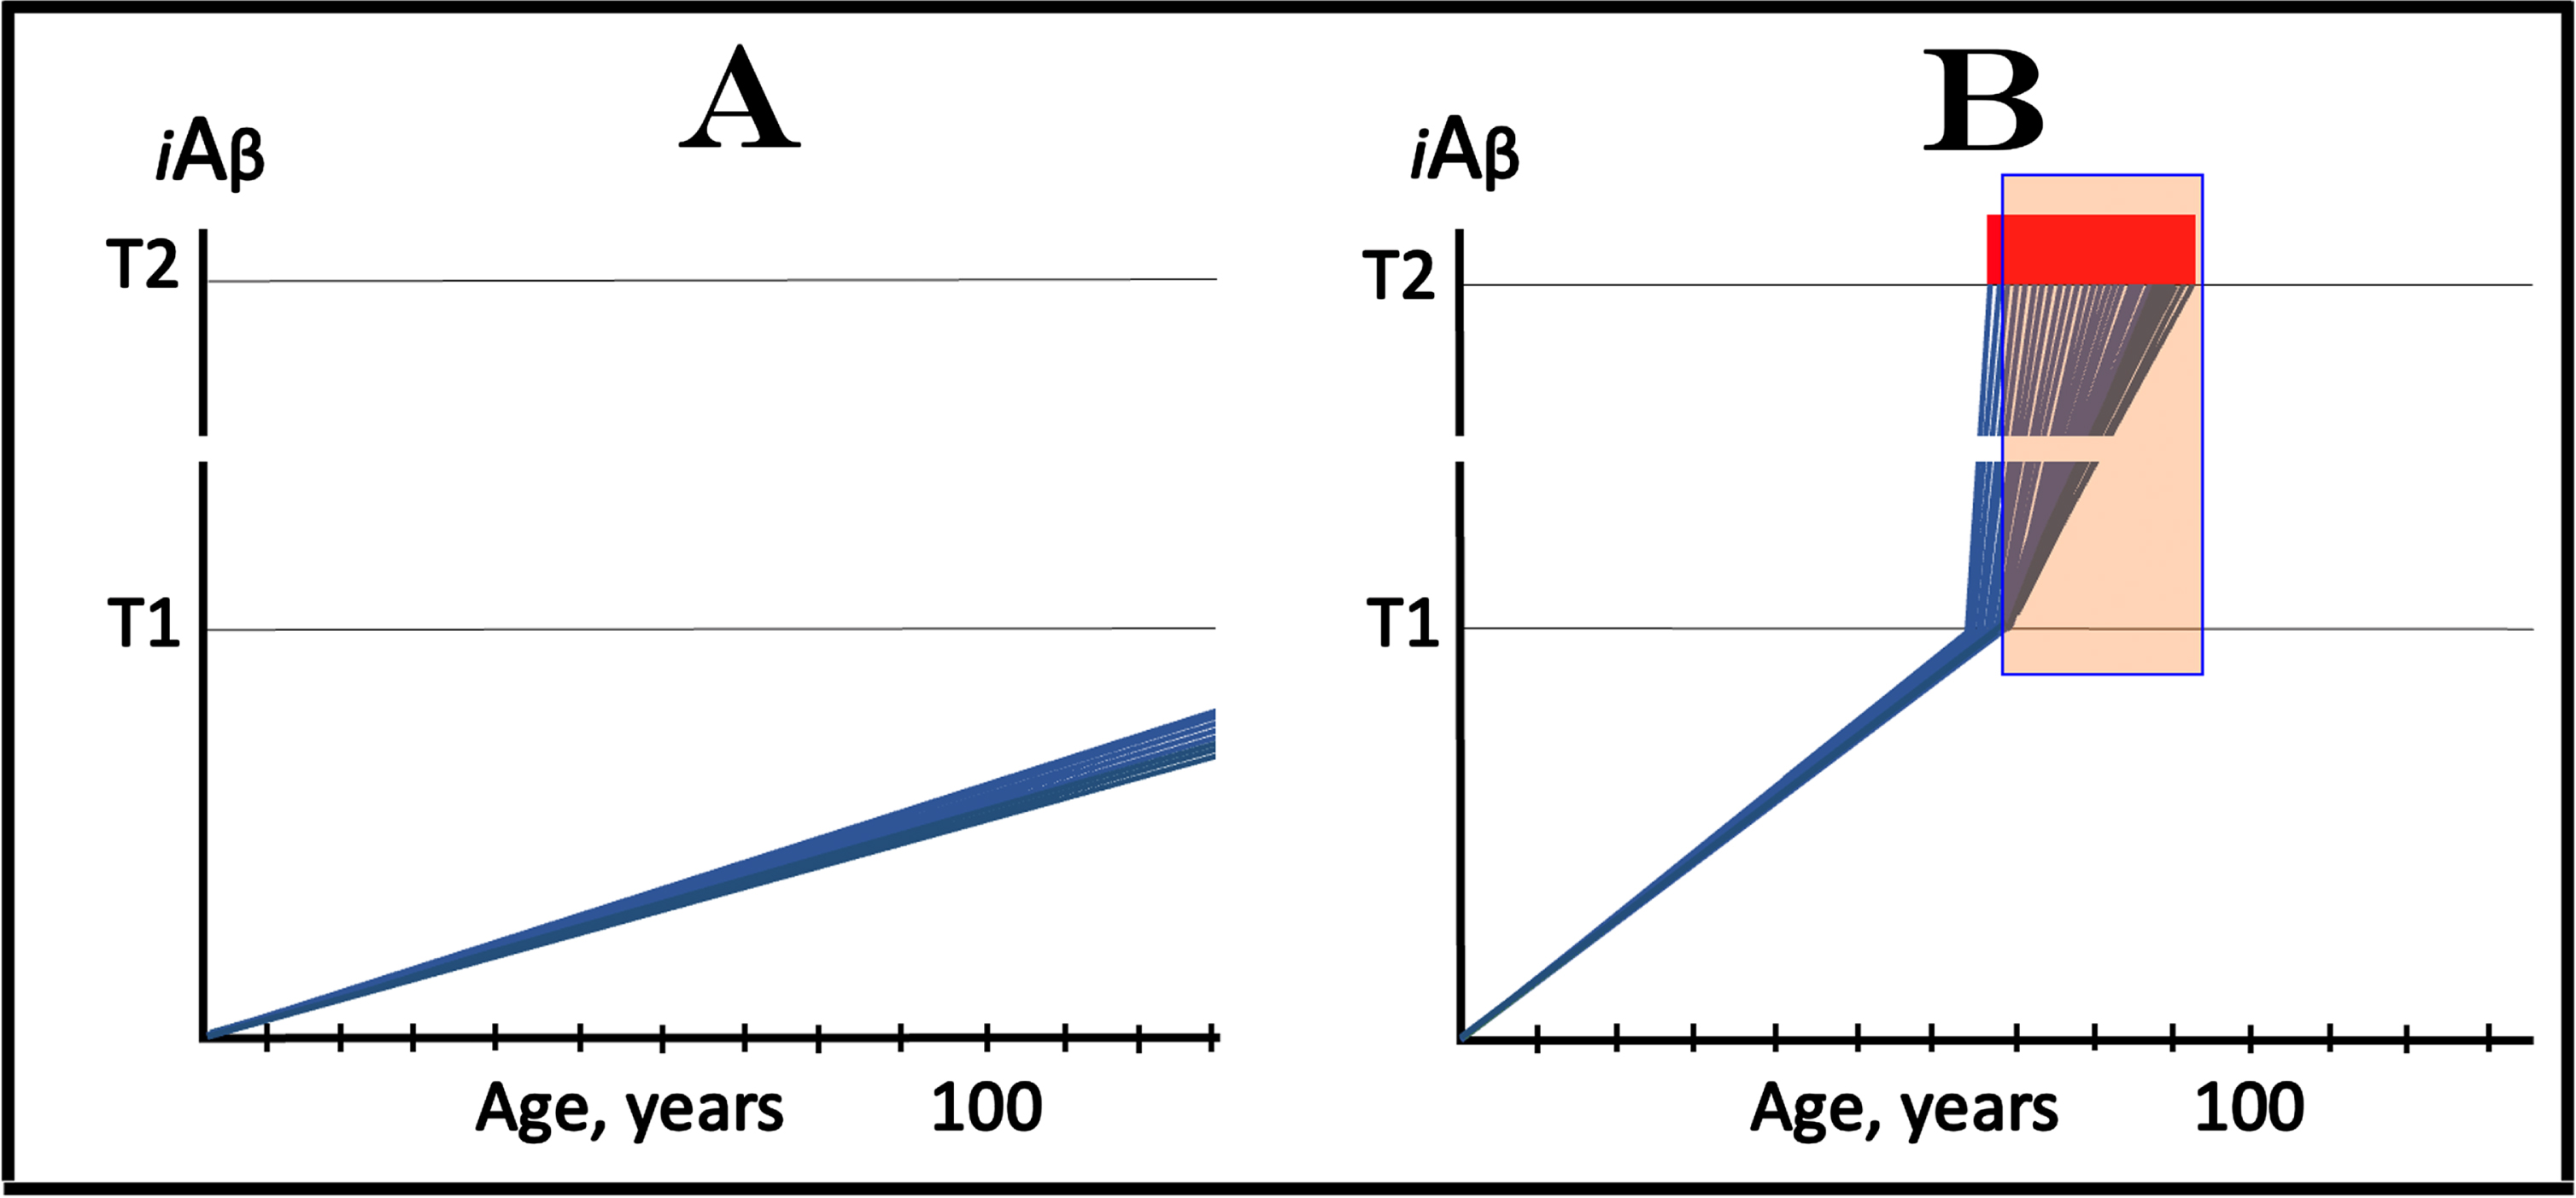
The dynamics of the iAβ accumulation in health and in AD is summarized in Fig. 2 (for more complete analysis, see [4]). In healthy individuals (Fig. 2A), AβPP-derived iAβ accumulates via the two mechanisms described above but it does not reach the T1 threshold, which activates the AβPP-independent iAβ production pathway, within an individual’s lifespan. This, in fact, is the prevailing scenario: indeed, only a minority of the population develops AD. In this minority (which nevertheless translates into over hundred millions of individuals worldwide), AβPP-derived iAβ levels reach and cross the T1 threshold in affected neurons within a relatively narrow time window [1, 4] as shown in Fig. 2B. Following the T1 crossing, the AβPP-independent iAβ production pathway is activated, commencing the second AD stage. iAβ levels rapidly increase in a relatively wide stochastic distribution and trigger a cascade which includes tau pathology. When iAβ levels in individual neurons reach the T2 threshold, cells commit apoptosis. When a fraction of affected neurons lose their functionality and/or die, AD symptoms manifest. Importantly, at this time the bulk of the affected neurons have already crossed the T1 threshold [1, 4]. When sufficient portion of the affected neurons commit apoptosis, the disease enters its end-stage (shown in Fig. 2B).
It should be emphasized that the first AD stage earns its name post-factum, only if and when the T1 crossing and the second AD stage occur, otherwise this is just a normal physiological process depicted in Fig. 2A. In terms of the ACH2.0, therefore, AD commences with the crossing of the T1 threshold and the activation of the AβPP-independent iAβ production pathway [1, 2, 4]; accordingly, the “second AD stage” is synonymous and interchangeable with “AD”. Therapeutic implications of the processes shown in Fig. 2 are simple: Delay the crossing of the T1 threshold and the commencement of AD is delayed, preclude it and the disease is prevented, interrupt the operation of the AβPP-independent iAβ production pathway and the progression of AD is stopped [4].
Fig. 2
T1 threshold arbitrates between health and disease: AD is defined by the dynamics of iAβ accumulation. Blue lines: Levels of iAβ in individual AD-affected neurons. Threshold T1: The level of AβPP-derived iAβ that triggers cellular processes resulting in the activation of the AβPP-independent generation of iAβ. Threshold T2: The level of iAβ and the consequent degree of neurodegeneration causing cellular commitment to apoptosis and acute AD symptoms. Red blocks: Apoptotic zone. Panel A: Levels of iAβ do not reach the T1 threshold within the lifetime of an individual; no AD occurs. Panel B: the neuronal crossing of the T1 threshold occurs within a narrow time window. Subsequent to the crossing of the T1 threshold, the AβPP-independent iAβ generation pathway is activated, the rate of iAβ accumulation is sharply elevated and its levels advance toward and cross the T2 threshold in a broad stochastic distribution; the temporal duration of this distribution determines the duration of the disease. Orange field: A zone where drugs targeting the influx of AβPP-derived iAβ would have no effect on the disease. For details see main text.
In the second AD stage, the operation of the AβPP-independent pathway generating Aβ, which is retained intraneuronally as iAβ, renders the AβPP proteolytic Aβ production pathway irrelevant for the progression of the disease. This is because the contribution of the latter into the iAβ pool becomes insignificant in comparison with that of the AβPP-independent iAβ generation pathway. This is the reason why, with the exception of lecanemab and donanemab (see below for their effect in early symptomatic AD), all candidate AD drugs that either deplete extracellular Aβ or suppress the operation of the AβPP proteolytic pathway could not and did not have any beneficial effect at symptomatic stages of the disease. However, in the ACH2.0 paradigm, these drugs can and should be effective in prevention of AD if administered prior to the T1 crossing and the activation of the AβPP-independent iAβ production pathway [1, 4]. Indeed, depletion of extracellular Aβ lowers its pool and decreases the rate of its internalization. This would reduce both the influx of AβPP-derived iAβ and its rate of accumulation. Consequently, the crossing of the T1 threshold and the commencement of the second AD stage should be at least delayed. Suppression of Aβ production in the AβPP proteolytic pathway would reduce its pools both extra- and intracellularly. This should result in the reduction of both components of the AβPP-derived iAβ influx: its uptake and retention, and potentially could be even more effective in delaying or preventing the T1 crossing than the depletion of extracellular Aβ alone. Importantly, these strategies would work only with neurons where iAβ levels have not yet crossed the T1 threshold. The orange field in Fig. 2B signifies a zone where these approaches would have no effect on the disease because at this point the T1 threshold has been crossed by and AβPP-independent iAβ production pathway was activated in all affected neurons rendering them unresponsive to this type of drugs.
ACH2.0-BASED MECHANISTIC INTERPRETATION OF THE EFFECT OF LECANEMAB AND DONANEMAB IN EARLY AD: PROOF OF CONCEPT FOR ITS POTENTIAL EFFICIENCY IN PREVENTION OF THE DISEASE
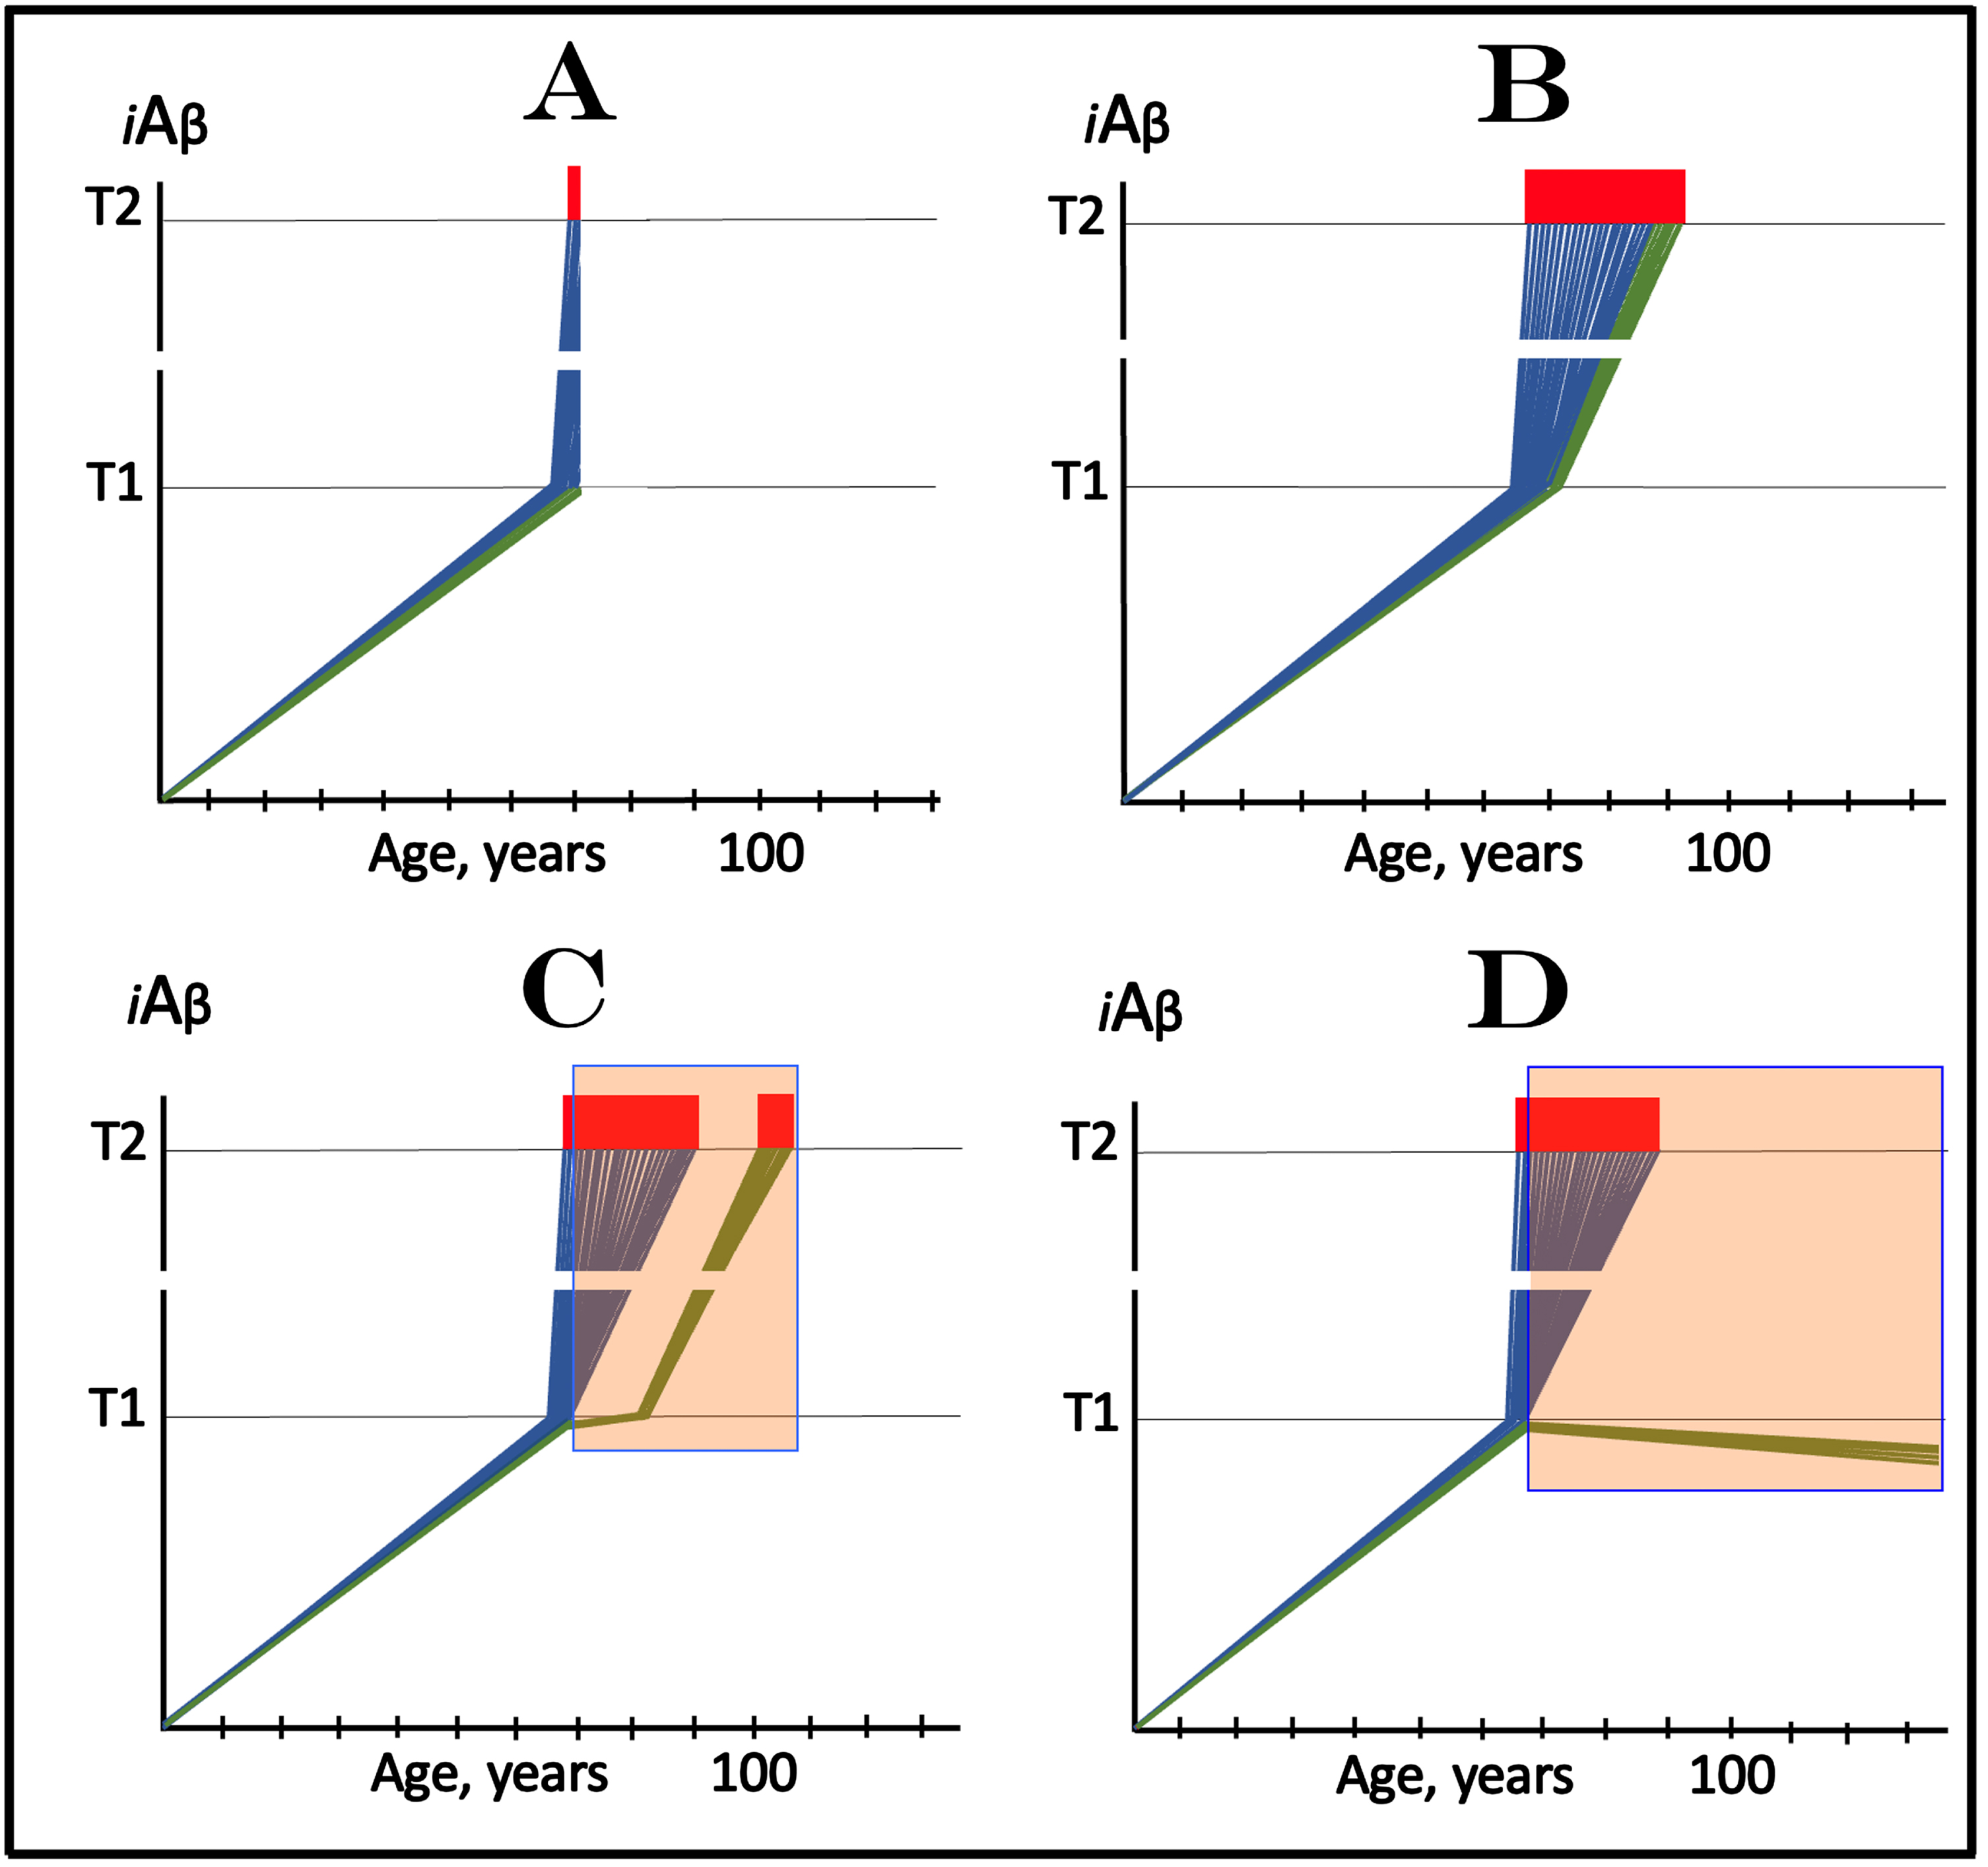
The above considerations bring us to the case of lecanemab, donanemab, and similar drugs (the following is a short summary of an in-detail analysis presented in [3]). Lecanemab is, essentially, a monoclonal antibody binding oligomerized extracellular Aβ [81]. In doing this, it sequesters the intermediate of the cellular uptake of extracellular Aβ (discussed above) and thus should be especially effective in reducing the influx of AβPP-derived iAβ via its internalization. In its clinical trial, it was administered to the subjects who have already manifested AD symptoms. In the light of the above discussion, it should not have worked. Yet it did work, albeit only marginally [81]. In terms of the ACH2.0, there is one and only one interpretation that explains both why lecanemab worked in clinical trials and why the effect was marginal [3]. Since lecanemab could be effective only with the neurons that have not yet cross the T1 threshold, it has to be assumed that sufficiently early symptoms were utilized in trial subjects’ selection and at the time of the drug’s administration a fraction of the affected neurons in selected participants have not yet crossed the T1 threshold. Figure 3A depicts diagrammatically the initial state, i.e., iAβ levels in the affected neurons of an individual participant immediately prior to the drug administration. The bulk of the affected neurons (blue lines) have already crossed the T1 threshold and a fraction of them have also crossed the T2 threshold and triggered AD symptoms, whereas another neuronal fraction (green lines) has not yet reached the T1 threshold. Figure 3B shows the end-stage of the evolution of the initial state in the absence of the drug: all affected neurons, including the “green” fraction, have crossed the T2 threshold; this is the end-stage of the disease. Figure 3C and 3D depict two potential outcomes of the evolution of the initial state in the presence of the drug. In both panels, neurons that crossed the T1 threshold are not affected by the drug and progress toward the T2 threshold. The fate of the “green” neuronal fraction, on the other hand, depends on the efficiency of the drug. In Fig. 3C, the drug reduces the rate of AβPP-derived iAβ accumulation but its levels continue to increase. Eventually they would cross the T1 threshold even in the presence of the drug and would progress toward and cross the T2 threshold; they fate would be the same as in Fig. 3B but with a delay. In Fig. 3D, the drug reverses the accumulation of AβPP-derived iAβ, i.e., the decrease in its influx is sufficient to allow the physiologically occurring degradation and clearance to shift the balance toward the decrease of its levels. In this scenario the “green” neuronal fraction does not cross the T1 threshold and is “redeemed” for the duration of the treatment.
Fig. 3
Effect of lecanemab and donanemab in early symptomatic AD. Blue and green lines: Individual affected neurons. Green lines: A fraction of affected neurons that have not reached the T1 threshold at the start of lecanemab or donanemab treatment. iAβ: Level of intraneuronal Aβ. T1 threshold: Levels of iAβ triggering, plausibly via activation of PKR and HRI kinases, elicitation of the ISR and initiation of AβPP-independent production of iAβ. T2 threshold: Levels of iAβ triggering neuronal entrance into the apoptotic pathway. Red blocks: Apoptotic zone. Orange fields: The duration of lecanemab or donanemab treatment. Panel A: The initial state of iAβ levels in affected neurons at the start of treatment. Panel B: Evolution of the initial state in the absence of a treatment. The “green” neuronal fraction reaches the T1 threshold, iAβ levels in both neuronal fractions crosses the T2 threshold and AD enters the end-stage. Panels C and D: Evolution of the initial state in the presence of the drug; note that the drug has no effect over the T1 threshold. Panel C: The rate of accumulation of AβPP-derived iAβ in “green” neuronal fraction is reduced but its levels continue to increase. Eventually, they reach the T1 threshold, cross the T2 threshold and cells commit apoptosis. The fate of the “green” neuronal population is the same as in panel B but occurs with a delay. Panel D: The drug reverses the accumulation of AβPP-derived iAβ. Levels of AβPP-derived iAβ do not reach the T1 threshold in the “green” neuronal fraction; it is redeemed for the duration of the treatment.
Conceptually similar results were recently obtained with donanemab, a humanized IgG1 antibody directed at an N-terminal pyroglutamate Aβ epitope that is present only in established plaques [82–84]. Its mode of operation is, in fact, identical to that of lecanemab. Indeed, as discussed in [3], by sequestering extracellular Aβ deposits, donanemab shifts the equilibrium of extracellular Aβ processing toward formation of plaques and thus reduces the levels of extracellular soluble Aβ. This, in turn, reduces the rate of extracellular Aβ internalization, inhibits the influx of iAβ, and suppresses the rate of its accumulation.
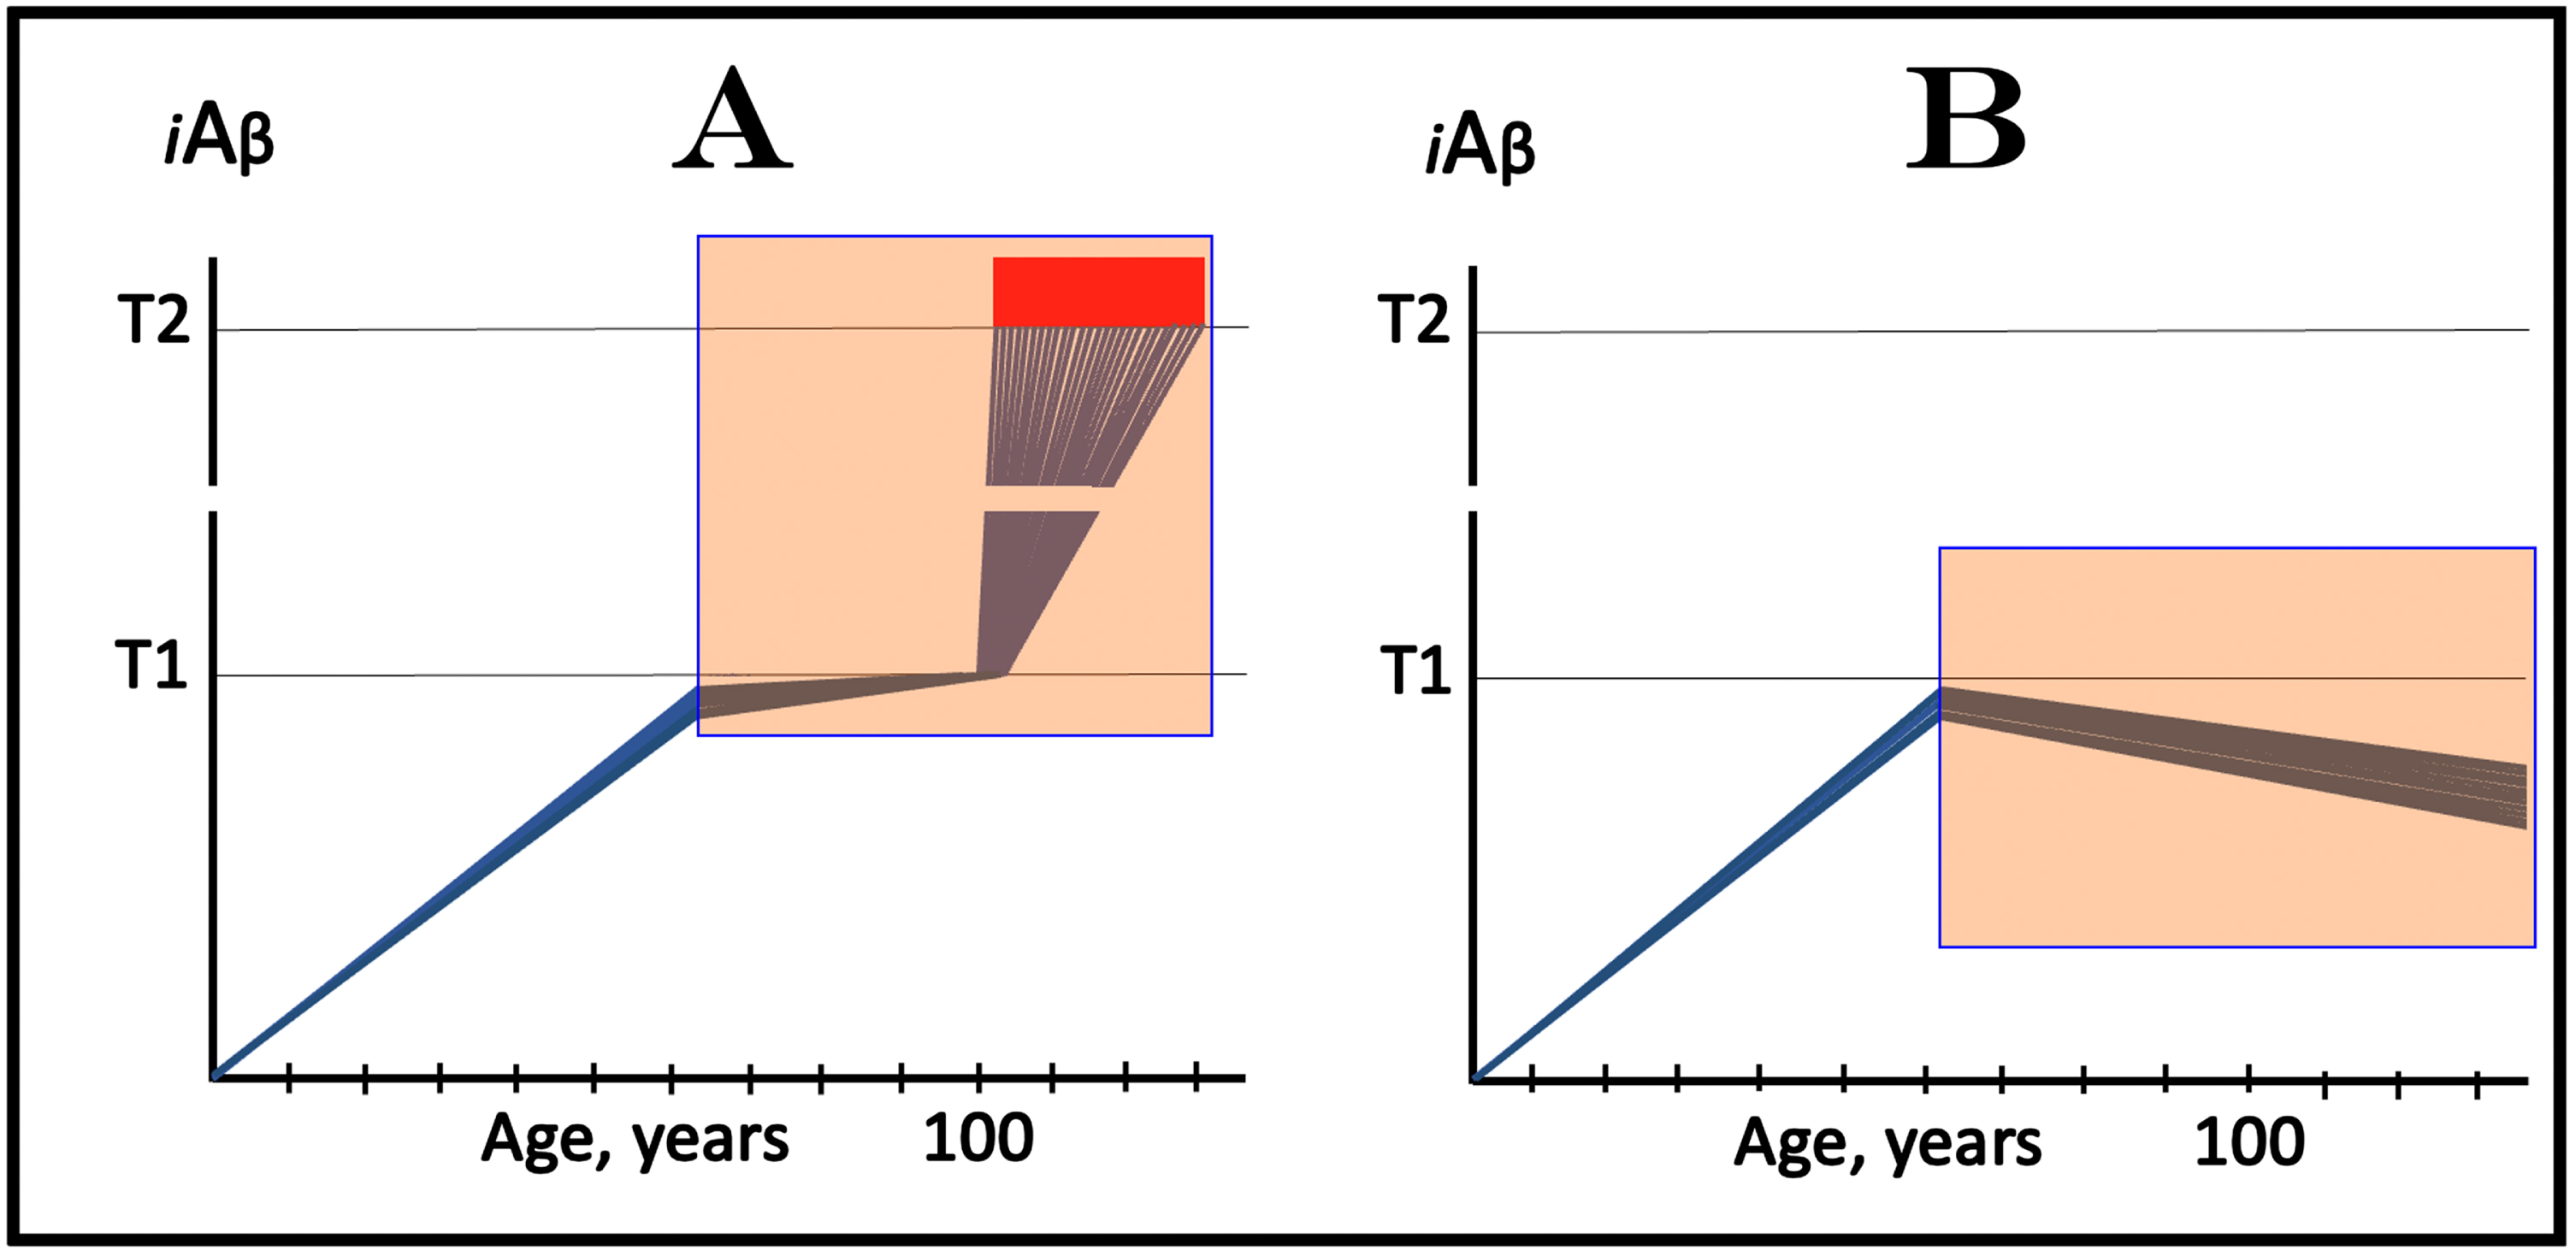
In this interpretation of the effect of lecanemab and donanemab in early AD, the drugs worked preventively, not curatively, and their effect was marginal because the neuronal fraction that responded to them was marginal. On the other hand, this interpretation constitutes a proof of principle for potential effect of lecanemab, donanemab, and other drugs that reduce the influx of AβPP-derived iAβ in the prevention of AD. Such effect is illustrated in Fig. 4. In this scenario, the drug is administered to an asymptomatic individual. Crucially, the individual is not only asymptomatic but AβPP-derived iAβ levels in his/her neurons have not yet reached the T1 threshold. In Fig. 4A, the drug reduces the rate of AβPP-derived iAβ accumulation but its level continue to increase. The reduction in the rate of AβPP-derived iAβ accumulation could be sufficient to prevent the T1 threshold crossing within the lifespan of the individual. However, if the individual’s lifespan is long enough and the T1 crossing eventually occurs, the second AD stage would ensue but with a considerable delay. In Fig. 4B, the reduction in the influx of AβPP-derived iAβ is sufficient to reverse the rate of its accumulation. Its levels would continue to decrease; neither T1 crossing nor AD would occur for the duration of the treatment.
Fig. 4
Prevention of AD with drugs targeting the influx of AβPP-derived iAβ: Two outcomes. Blue lines: Individual affected neurons. iAβ: Level of intraneuronal Aβ. T1 threshold: Levels of iAβ triggering, plausibly via activation of PKR and HRI kinases, elicitation of the ISR and initiation of AβPP-independent production of iAβ. T2 threshold: Levels of iAβ triggering neuronal commitment to apoptosis. Red block: Apoptotic zone. Orange fields: The duration of the treatment. Note that the treatment commences prior to the crossing of the T1 threshold and that the drug has no effect over the T1 threshold. Panel A: The rate of accumulation of AβPP-derived iAβ is reduced but its levels continue to increase. Eventually, they reach the T1 threshold, activate the second AD stage, cross the T2 threshold and cells commit apoptosis. A substantial delay in the T1 crossing may prevent it within the lifetime of an individual (not shown). Panel D: The drug reverses the accumulation of AβPP-derived iAβ. Levels of AβPP-derived iAβ do not reach the T1 threshold; the neurons are redeemed for the duration of the treatment.
CONCEPTS OF DESIGN AND OUTCOMES OF CLINICAL TRIALS OF DRUGS TARGETING THE INFLUX OF AβPP-DERIVED iAβ IN PREVENTION OF AD, WITH ALL PARTICIPANTS AT SUB-T1 LEVELS OF iAβ
The present and several following sections are concerned with the design of AD-preventive clinical trials of lecanemab or donanemab, or other drugs capable of reducing the influx of AβPP-derived iAβ. In any version of such trials only asymptomatic individuals are selected as subjects. However, “asymptomatic” is not synonymous with “sub-T1” iAβ levels: the latter ensures the former but not the other way around. An individual can remain asymptomatic for a substantial duration after levels of AβPP-derived iAβ in his/her affected neurons have crossed the T1 threshold but have not reach the symptoms-causing levels. In this case, the AβPP-independent iAβ generation pathway is activated but it can take a considerable time for its product (iAβ) to accumulate to symptoms-causing levels. On the other hand, as is demonstrated below, whether or not cohorts participating in trials include asymptomatic individuals who have crossed the T1 threshold would make a drastic difference in the outcomes of these trials. To determine whether AβPP-derived iAβ levels have crossed the T1 threshold is challenging. Since the T1 threshold differs individually, the best objective operational criteria to define it is the activation of AβPP-independent iAβ production pathway. However, whereas the activity of this pathway can be determined in a model system by the occurrence of C99 and/or Aβ containing the additional N-terminal methionine (described in detail in [1, 4]), such determination is currently not feasible in clinical trial subjects.
Figure 5 considers an AD-preventive trial scenario where all participants are not only asymptomatic but also sub-T1, i.e., their iAβ levels are below the T1 threshold. In this figure, each blue line represents the iAβ levels in the neurons of an individual participant. Figure 5A depicts the initial state: the iAβ levels of individual participants at the start of the trial. Figure 5B shows the evolution of the initial state in the absence of the drug in the placebo cohort. If the composition of trial cohorts reflects that of general population, neurons in the majority of participants would not cross the T1 threshold within their lifetime; these subjects would not develop AD. In those individuals who cross the T1 threshold, AβPP-independent iAβ production pathway would be activated and the levels of iAβ would rapidly (in comparison with the sub-T1 stage) increase. When iAβ levels reach the Ts threshold (“Ts” stands for “symptomatic threshold”) and cross into the “Symptomatic Zone” (pink field), AD symptoms would manifest.
Fig. 5
Design and outcomes of clinical trials of drugs targeting the influx of AβPP-derived iAβ in prevention of AD, with all participants at sub-T1 levels of iAβ. iAβ: Level of intraneuronal Aβ. Blue lines: iAβ levels in individual trial participants. T1 threshold: Levels of iAβ triggering, plausibly via activation of PKR and HRI kinases, elicitation of the ISR and initiation of AβPP-independent production of iAβ. Ts threshold: Levels of iAβ triggering manifestation of AD symptoms. Pink fields: AD Symptomatic Zone. Orange fields: The duration of the treatment. Note that the treatment commences prior to the crossing of the T1 threshold in all participants and that the drug has no effect over the T1 threshold. Panel A: The initial state of iAβ levels in individual participants at the start of treatment. Panel B: Evolution of the initial state in the absence of a treatment results in two distinct outcomes. In a fraction of participants the rate of accumulation of iAβ is such that it does not cross the T1 threshold within the lifetime of an individual. In those participants where the T1 crossing occurs, the AβPP-independent pathway of iAβ production is activated, its rate of accumulation increases, its levels cross the Ts threshold and AD symptoms manifest. Panels C and D: Evolution of the initial state in the presence of the drug. Panel C: The rate of accumulation of AβPP-derived iAβ is reduced but its levels continue to increase. In some subjects, eventually, they reach the T1 threshold and cross into the Symptomatic Zone; the outcome is the same as in panel B but occurs with a delay. In other subjects the delay is sufficient to prevent the T1 crossing and the occurrence of the disease within the lifetime of an individual. Panel D: The drug reverses the accumulation of AβPP-derived iAβ. Its levels do not reach the T1 threshold and no disease occurs in all trial subjects for the duration of the treatment.
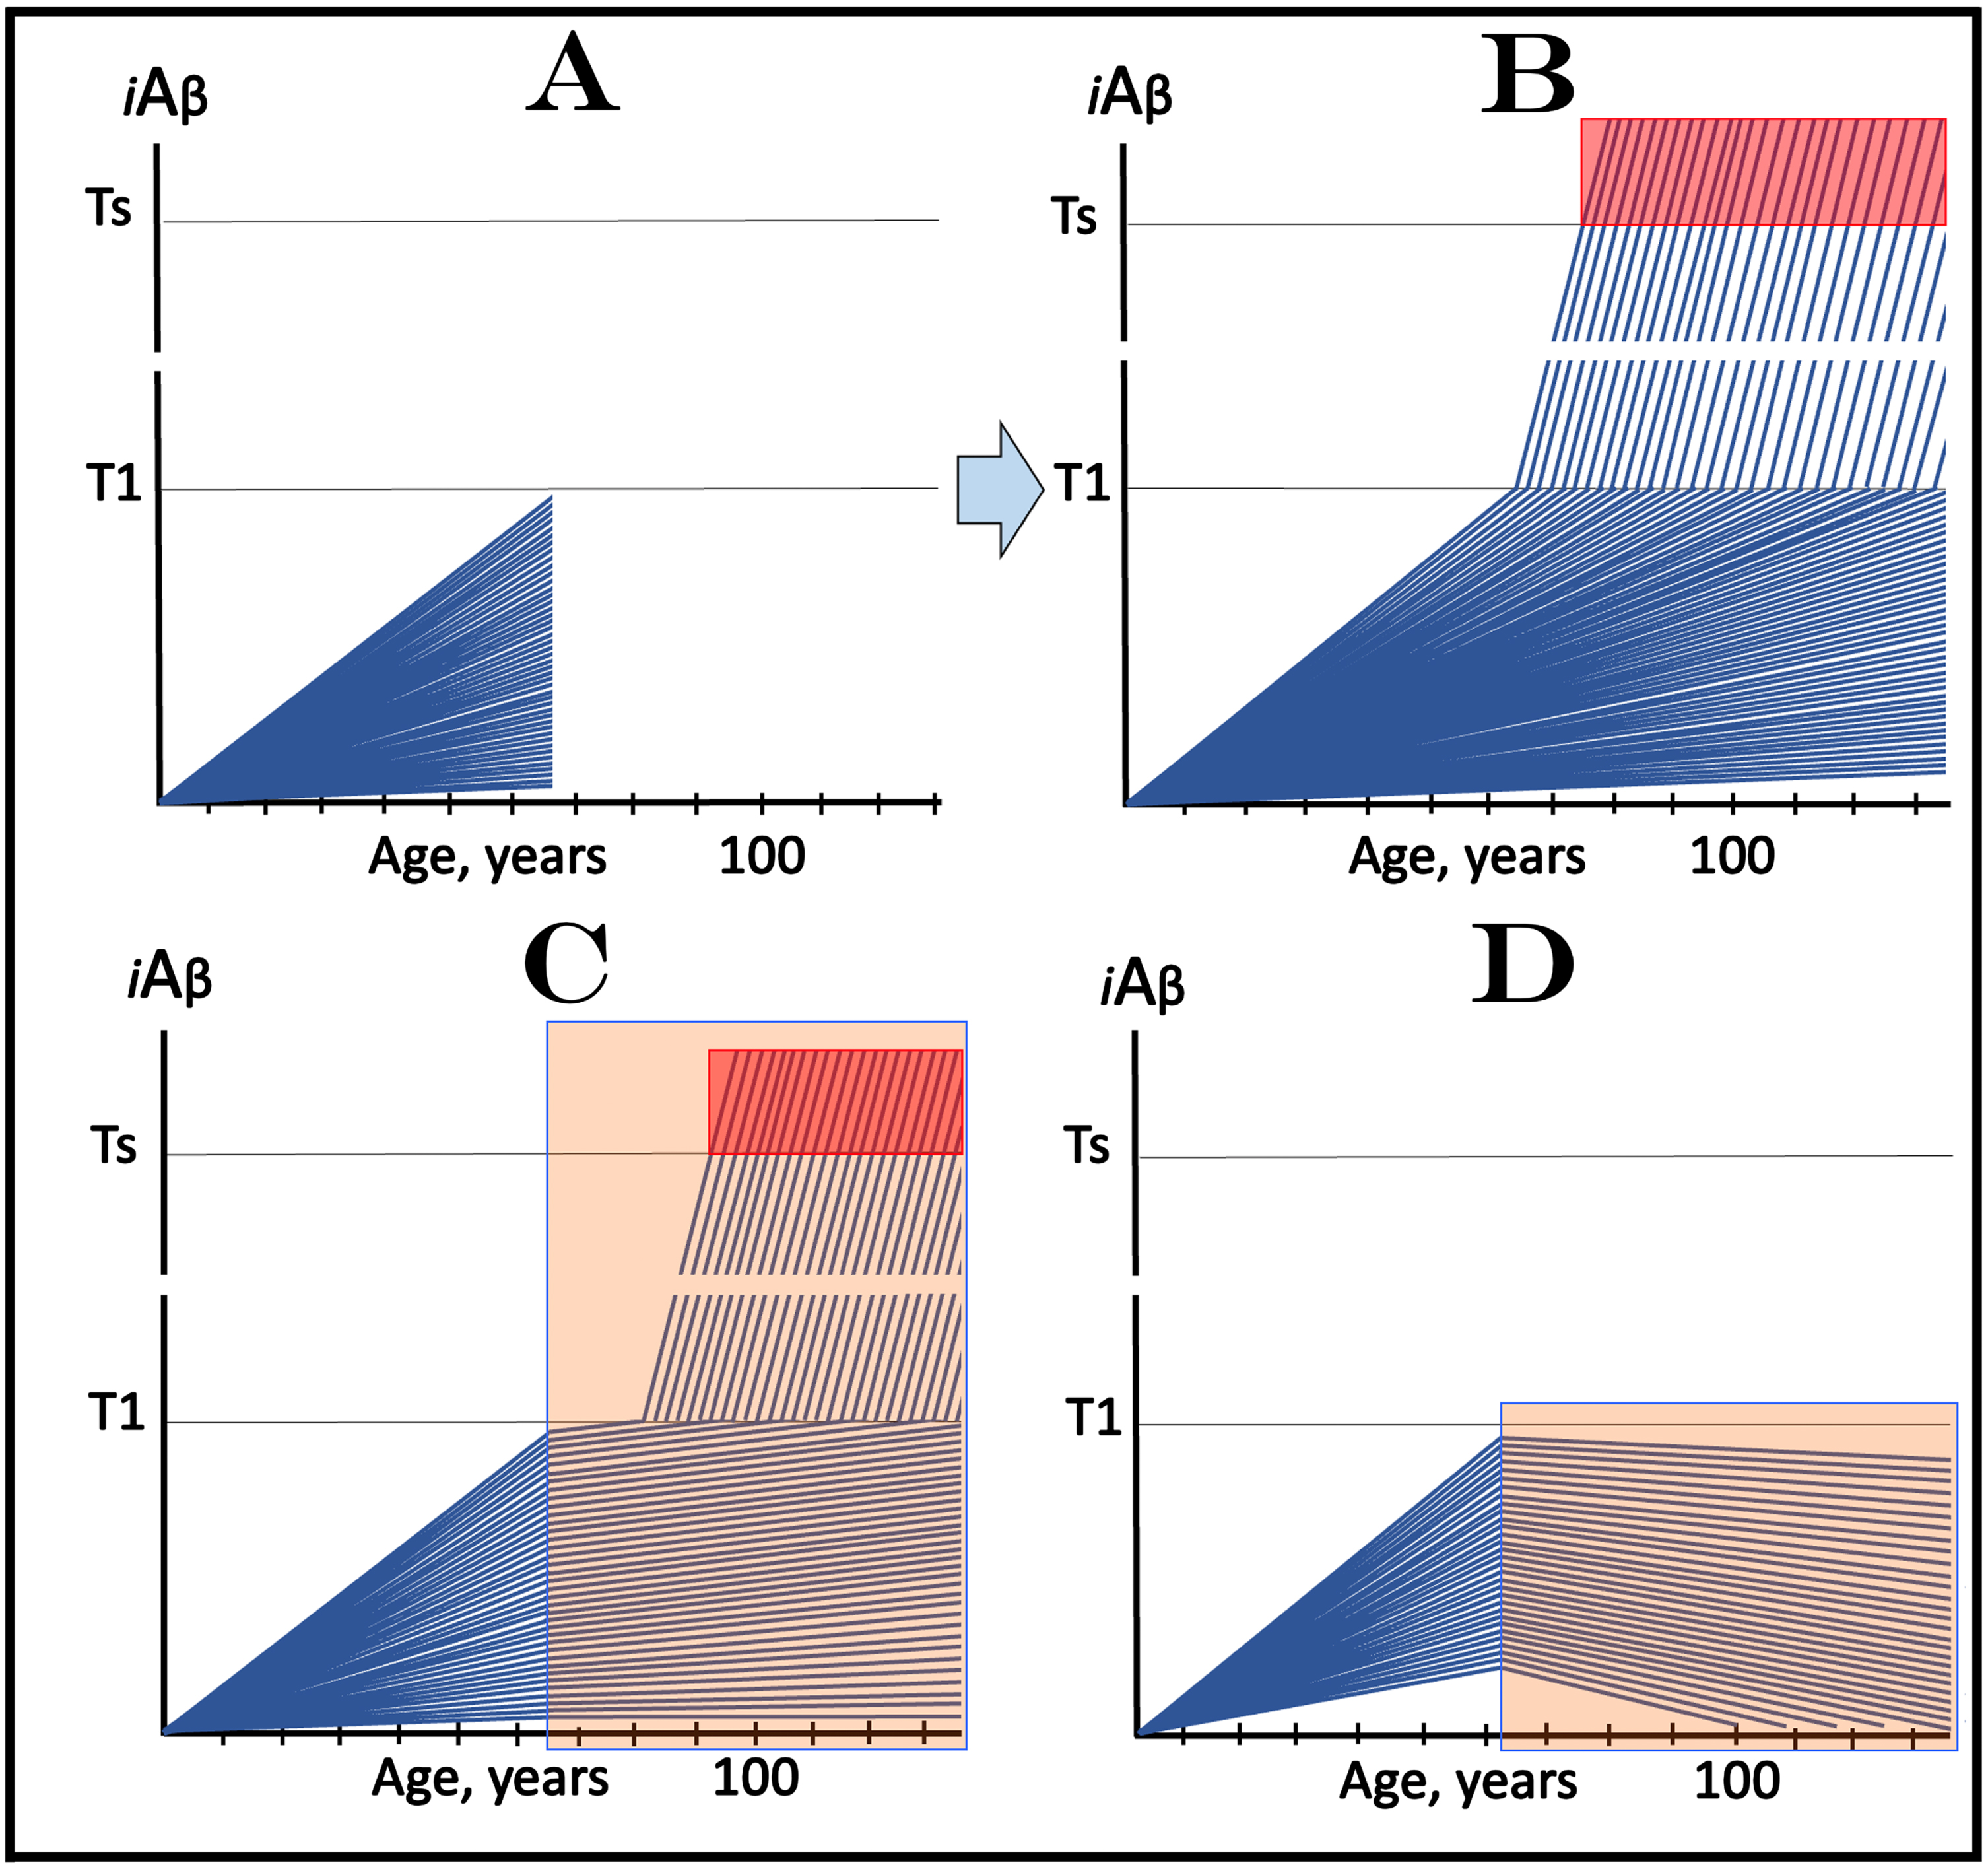
Figure 5C and 5D depict the evolution of the initial state in the presence of the drug (orange fields). In Fig. 5C the drug reduces the rate of AβPP-derived iAβ accumulation but its levels continue to increase. If and when they reach and cross the T1 threshold, rates of accumulation of iAβ, produced at this stage predominantly in the AβPP-independent pathway, would be the same as in the placebo group since this pathway is not affected by the drug. The Symptomatic Zone would be reached, and AD symptoms would manifest but with a considerable delay (in comparison with the placebo group). In Fig. 5D, the drug reverses the accumulation of AβPP-derived iAβ. Consequently, its level would steadily decline in all participants. Neither T1 threshold would be crossed nor AD symptoms would manifest for the duration of the treatment (and for a certain time following the treatment if it is terminated; see below on the subject). In this type of AD-preventive trial, the effect of the drug would be readily evident in comparison with the placebo results.
CONCEPTS OF DESIGN AND OUTCOMES OF CLINICAL TRIALS OF DRUGS TARGETING THE INFLUX OF AβPP-DERIVED iAβ IN PREVENTION OF AD, WITH A FRACTION OF ASYMPTOMATIC SUBJECTS AT OVER-T1 LEVELS OF iAβ
In the absence of means to determine the extents of the T1 threshold and to measure the levels of iAβ and the activity of the AβPP-independent iAβ production pathway, to conduct the trial described in the preceding section, with all participants at sub-T1 iAβ levels, is truly challenging. The only realistic way to assemble sub-T1 participants would be to limit them to low-risk individuals of age at least a decade below statistical age of the onset of sporadic AD (which is about 65 years). But in such a case, it would be over a decade until enough AD cases would occur in the placebo group to establish the effect of a drug in the medicated cohort. In an alternative approach, selecting asymptomatic trial subjects of age close to or over the statistical age of the sporadic AD (SAD) onset, and, moreover, favoring high-risk participants, using criteria such as the increased load of Aβ plaques or elevated tau levels to select individuals close to symptomatic manifestation of AD [81, 85], would inevitably result in a significant fraction of asymptomatic trial subjects with iAβ levels over the T1 threshold and, consequently with the operational AβPP-independent iAβ production pathway.
The scenario, which includes a fraction of asymptomatic participants with over-T1 levels of iAβ is considered in Fig. 6. Figure 6A shows the initial state. It includes a fraction of trial subjects whose iAβ levels are over the T1 level but who are asymptomatic and indistinguishable from the rest of the participants. The evolution of this initial state in the absence of the drug (Fig. 6B) is similar to that shown in the preceding section. In addition to the over-T1 fraction where the AβPP-independent iAβ production pathway has been already activated, more participants would cross the T1 threshold. iAβ levels would rapidly increase and when they reach the Symptomatic Zone, AD symptoms would manifest as shown in Fig. 6B.
Fig. 6
Design and outcomes of clinical trials of drugs targeting the influx of AβPP-derived iAβ in prevention of AD, with a fraction of asymptomatic participants at over-T1 levels of iAβ. iAβ: Level of intraneuronal Aβ. Blue lines: iAβ levels in individual trial participants. T1 threshold: Levels of iAβ triggering, plausibly via activation of PKR and HRI kinases, elicitation of the ISR and initiation of AβPP-independent production of iAβ. Ts threshold: Levels of iAβ triggering manifestation of AD symptoms. Pink fields: AD Symptomatic Zone. Orange fields: The duration of the treatment. Note that the treatment commences prior to the crossing of the T1 threshold in all participants and that the drug has no effect over the T1 threshold. Panel A: The initial state of iAβ levels in individual participants at the start of treatment; note that in a fraction they are over the T1 threshold. Panel B: Evolution of the initial state in the absence of a treatment results in two distinct outcomes. In a fraction of participants the rate of accumulation of iAβ is such that it does not cross the T1 threshold within the lifetime of an individual. In those where the T1 crossing occurs (or occurred, i.e., the initial over-T1 fraction), the AβPP-independent pathway of iAβ production is activated, its rate of accumulation increases, its levels cross the Ts threshold and AD symptoms manifest. Panels C and D: Evolution of the initial state in the presence of the drug. Panel C: With the exception of the initial over-T1 fraction, the rate of accumulation of AβPP-derived iAβ is reduced but its levels continue to increase. Eventually, they reach the T1 threshold and cross into the Symptomatic Zone but with a delay; in some subjects the delay is sufficient to prevent the T1 crossing within the lifetime of an individual. Panel D: With the exception of the initial over-T1 fraction, the drug reverses the accumulation of AβPP-derived iAβ. Its levels do not reach the T1 threshold and no disease occurs in all trial subjects for the duration of the treatment. Importantly, in panels C and D, the initial over-T1 fraction would continue its progress toward and into the Symptomatic Zone, largely unaffected by the drug. Consequently, for a substantial duration, possibly a number of years, the trial outcomes in the medicated cohort would be similar to those in the placebo group; eventually, they would drastically diverge.
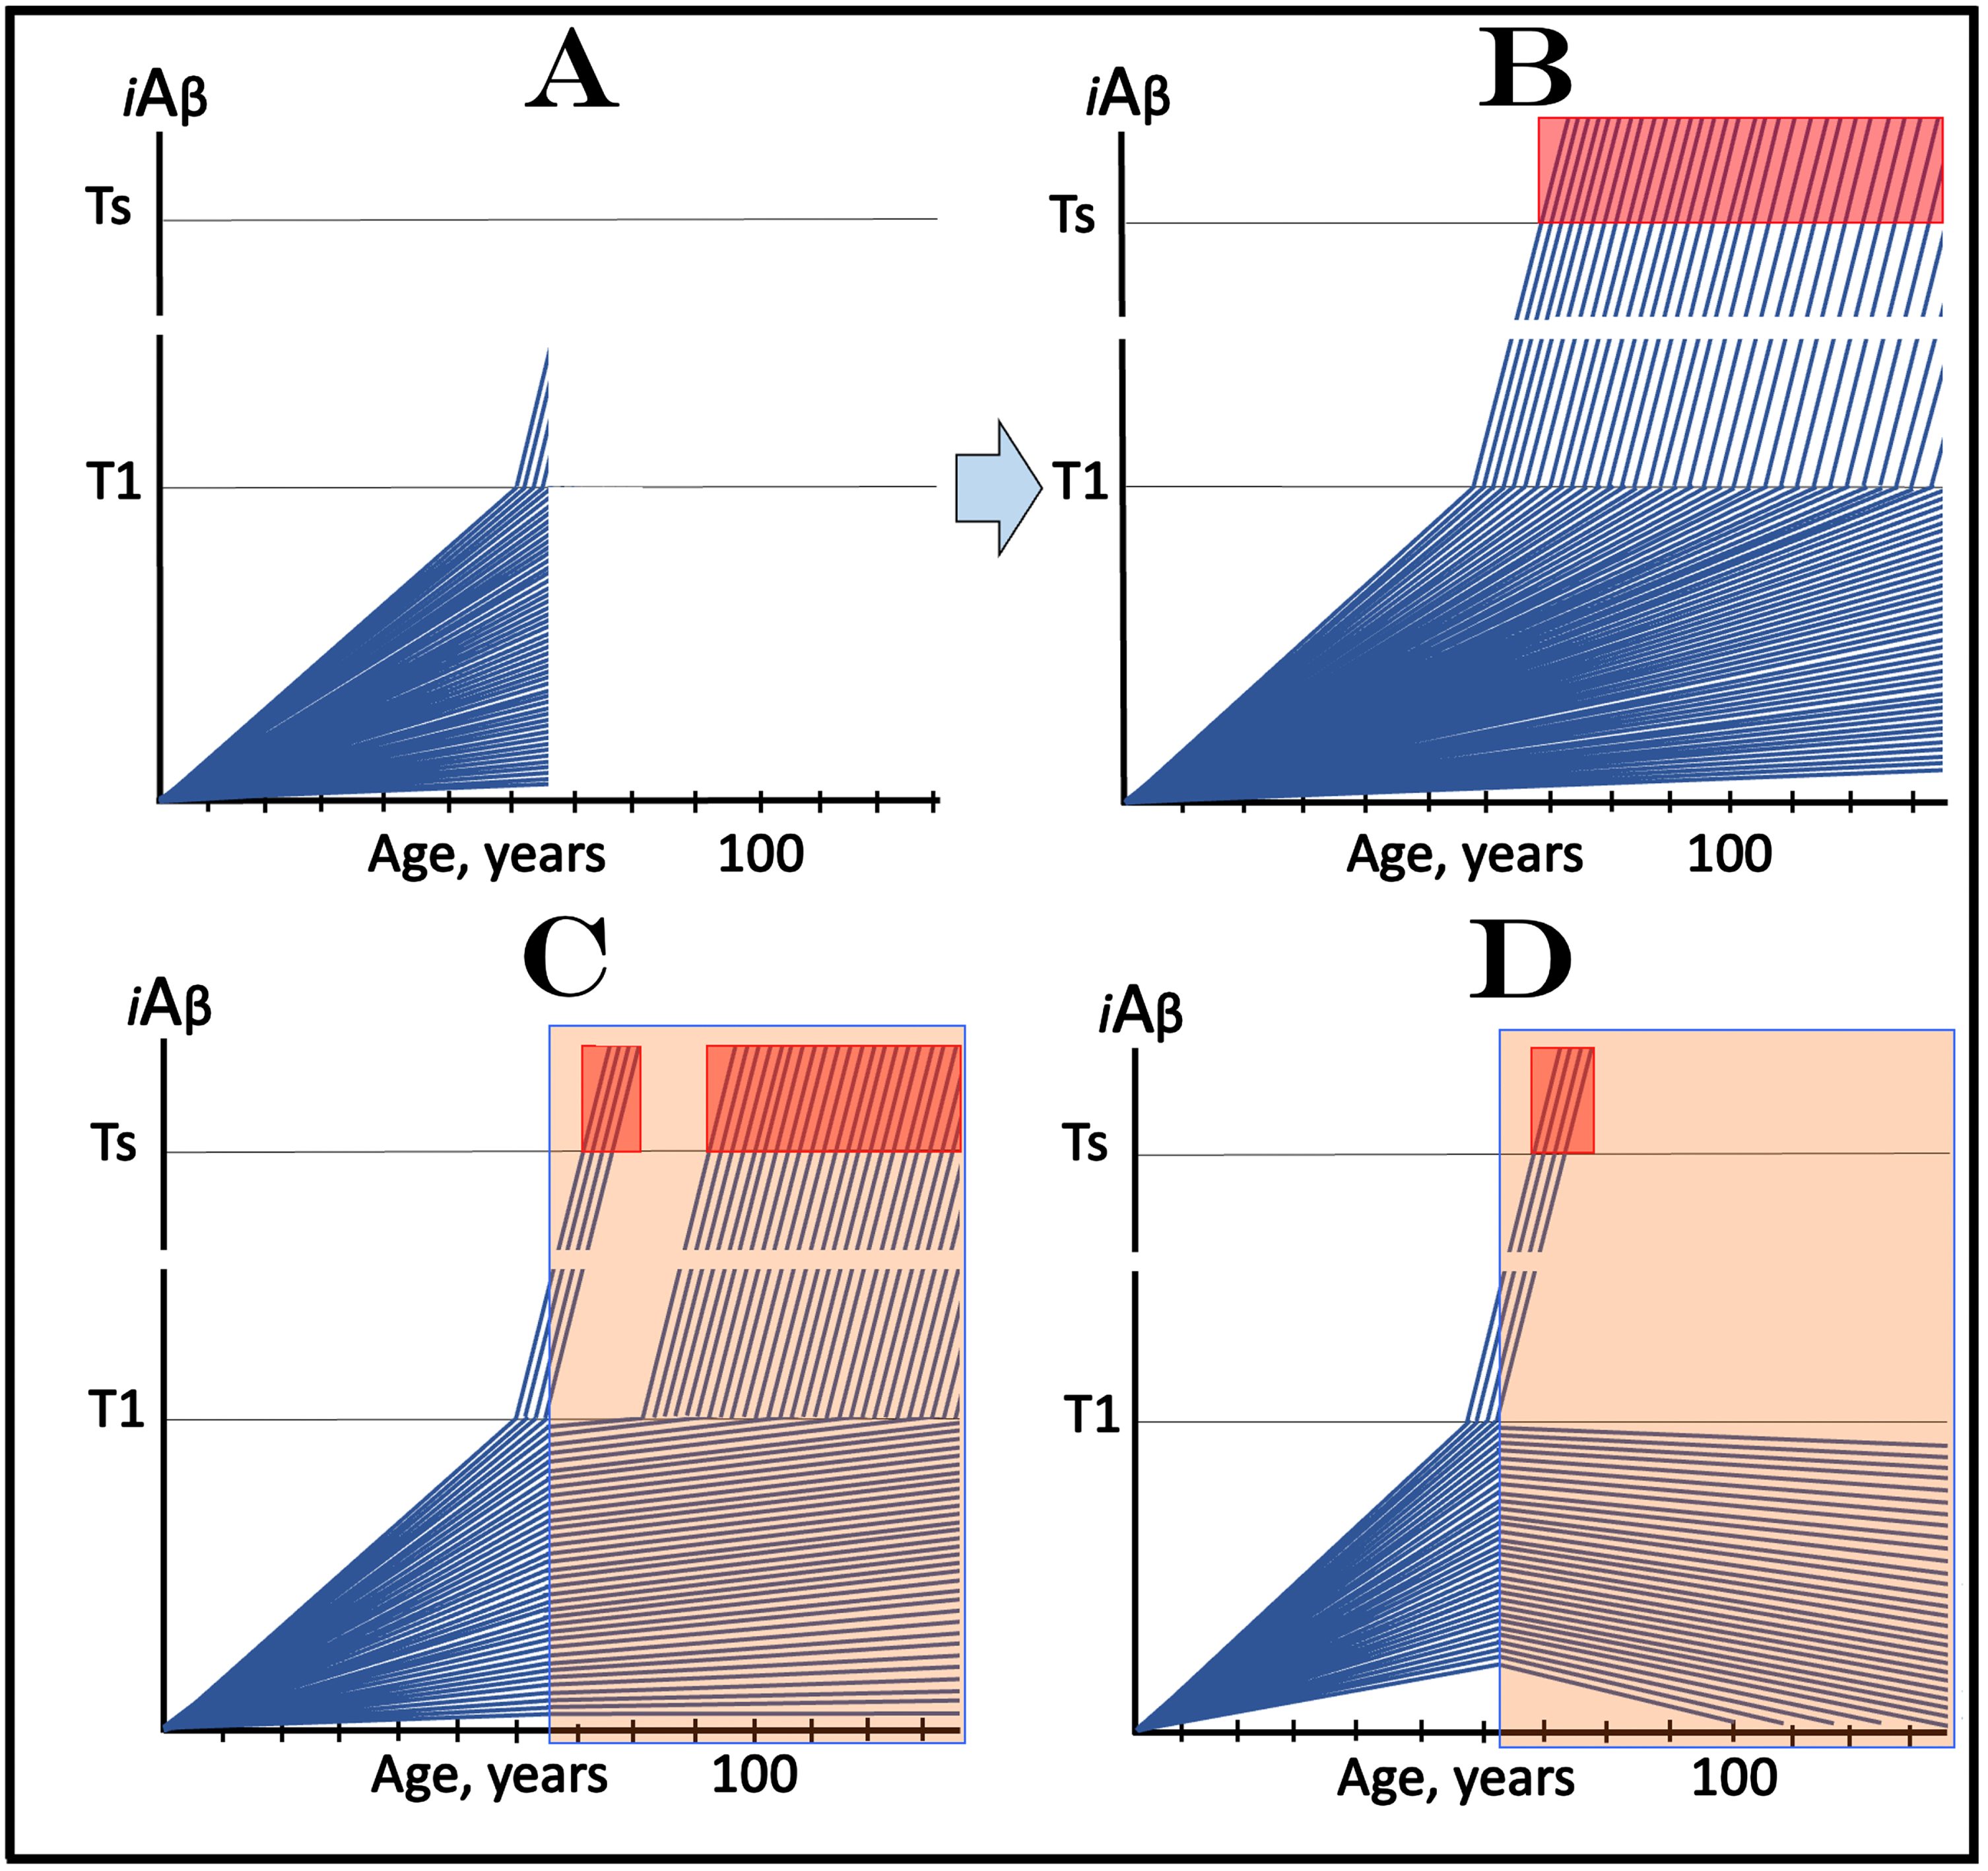
The evolution of the initial state in the presence of the drug, illustrated in Fig. 6C and 6D, is interesting. With the exception of the initial over-T1 fraction of participants, this evolution is identical to that shown in the preceding section. In Fig. 6C, where the drug only reduces the AβPP-derived iAβ influx and, consequently, the rate of its accumulation, the crossing of the T1 threshold and the manifestation of AD symptoms would be delayed. In Fig. 6D, where the drug reverses the accumulation of AβPP-derived iAβ, there would be neither new T1 crossings nor manifestations of AD symptoms at least for the duration of the treatment. Importantly, however, the initial over-T1 fraction would continue, unimpeded, its progress toward and into the Symptomatic Zone, unaffected by the drug. Consequently, for a substantial duration, possibly a number of years, the trial outcomes in the medicated cohort would be similar to those in the placebo group. In this type of clinical trial, a situation may arise akin to that seen in the lecanemab trial [3, 81], namely that in over-T1 individuals a fraction of affected neurons would remain sub-T1 in the initial state. In such a case, medicated over-T1 fraction may develop AD symptoms partially or slower in comparison with the placebo group, but even such results would still obscure and/or distort the actual effect of the drug. The utmost importance of this complication for the design, conduct, and evaluation of trials of drugs targeting the influx of AβPP-derived iAβ in the prevention of AD warrants a separate section for its analysis (see the following section below).
OUTCOMES OF AD-PREVENTIVE TRIALS IN MEDICATED AND PLACEBO COHORTS COULD BE SIMILAR FOR A SUBSTANTIAL DURATION BEFORE DIVERGING
The present section analyzes a temporal segment of the scenario discussed in the preceding section, representing only the duration of the evolution of the initial over-T1 fraction of trial participants (referred to below as the “time period of interest”). The initial state shown in Fig. 7A is the same as in the preceding section (Fig. 6 above), its main feature is the presence of a fraction of asymptomatic participants whose iAβ levels have already crossed the T1 threshold and where the AβPP-independent iAβ production pathway has been already activated. The evolution of the initial state in the absence of the drug within the time period of interest is shown in Fig. 7B (transparent green field). In the initial over-T1 subjects, iAβ levels, driven in the AβPP-independent pathway, rapidly increase, cross into the Symptomatic Zone, and trigger the manifestation of AD symptoms. Within this time period, iAβ crosses the T1 threshold in many additional trial subjects who thus enter the second AD stage pipeline. In these participants, AβPP-independent iAβ production pathway is activated and iAβ levels rapidly increase. However, by the time of completion of the evolution of the initial over-T1 fraction, in none of the additional participants do iAβ levels reach the Symptomatic Zone.
Fig. 7
In clinical trials of drugs targeting the influx of AβPP-derived iAβ in prevention of AD, with a fraction of asymptomatic participants at over-T1 levels of iAβ, outcomes in medicated and placebo cohorts could be similar for a substantial duration before diverging. iAβ: Level of intraneuronal Aβ. Blue lines: iAβ levels in individual trial participants. T1 threshold: Levels of iAβ triggering, plausibly via activation of PKR and HRI kinases, elicitation of the ISR and initiation of AβPP-independent production of iAβ. Ts threshold: Levels of iAβ triggering manifestation of AD symptoms. Pink fields: AD Symptomatic Zone. Orange fields: The duration of the treatment. Green field: duration of the evolution of the initial over-T1 fraction of trial participants (referred to as the “time period of interest”). Note that the treatment commences prior to the crossing of the T1 threshold in all initially sub-T1 participants and that the drug has no effect over the T1 threshold. Panel A: The initial state of iAβ levels in individual participants at the start of treatment; note that in a fraction of trial subjects they are over the T1 threshold. Panel B: Evolution of the initial state in the absence of a treatment for the duration of the period of interest. Note that, in addition to the initial over-T1 fraction, more trial subjects enter the second AD stage pipeline but none of them reaches the Symptomatic Zone. Panels C and D: Evolution of the initial state in the presence of the drug during the period of interest. In both panels the initial over–T1 fraction crosses the Ts threshold and AD symptoms manifest. No additional AD crossings occur. Note that the only difference in the outcomes in the medicated and placebo cohorts within the time period of interest is the presence in the latter of additional subjects in the second AD stage pipeline who remain asymptomatic.
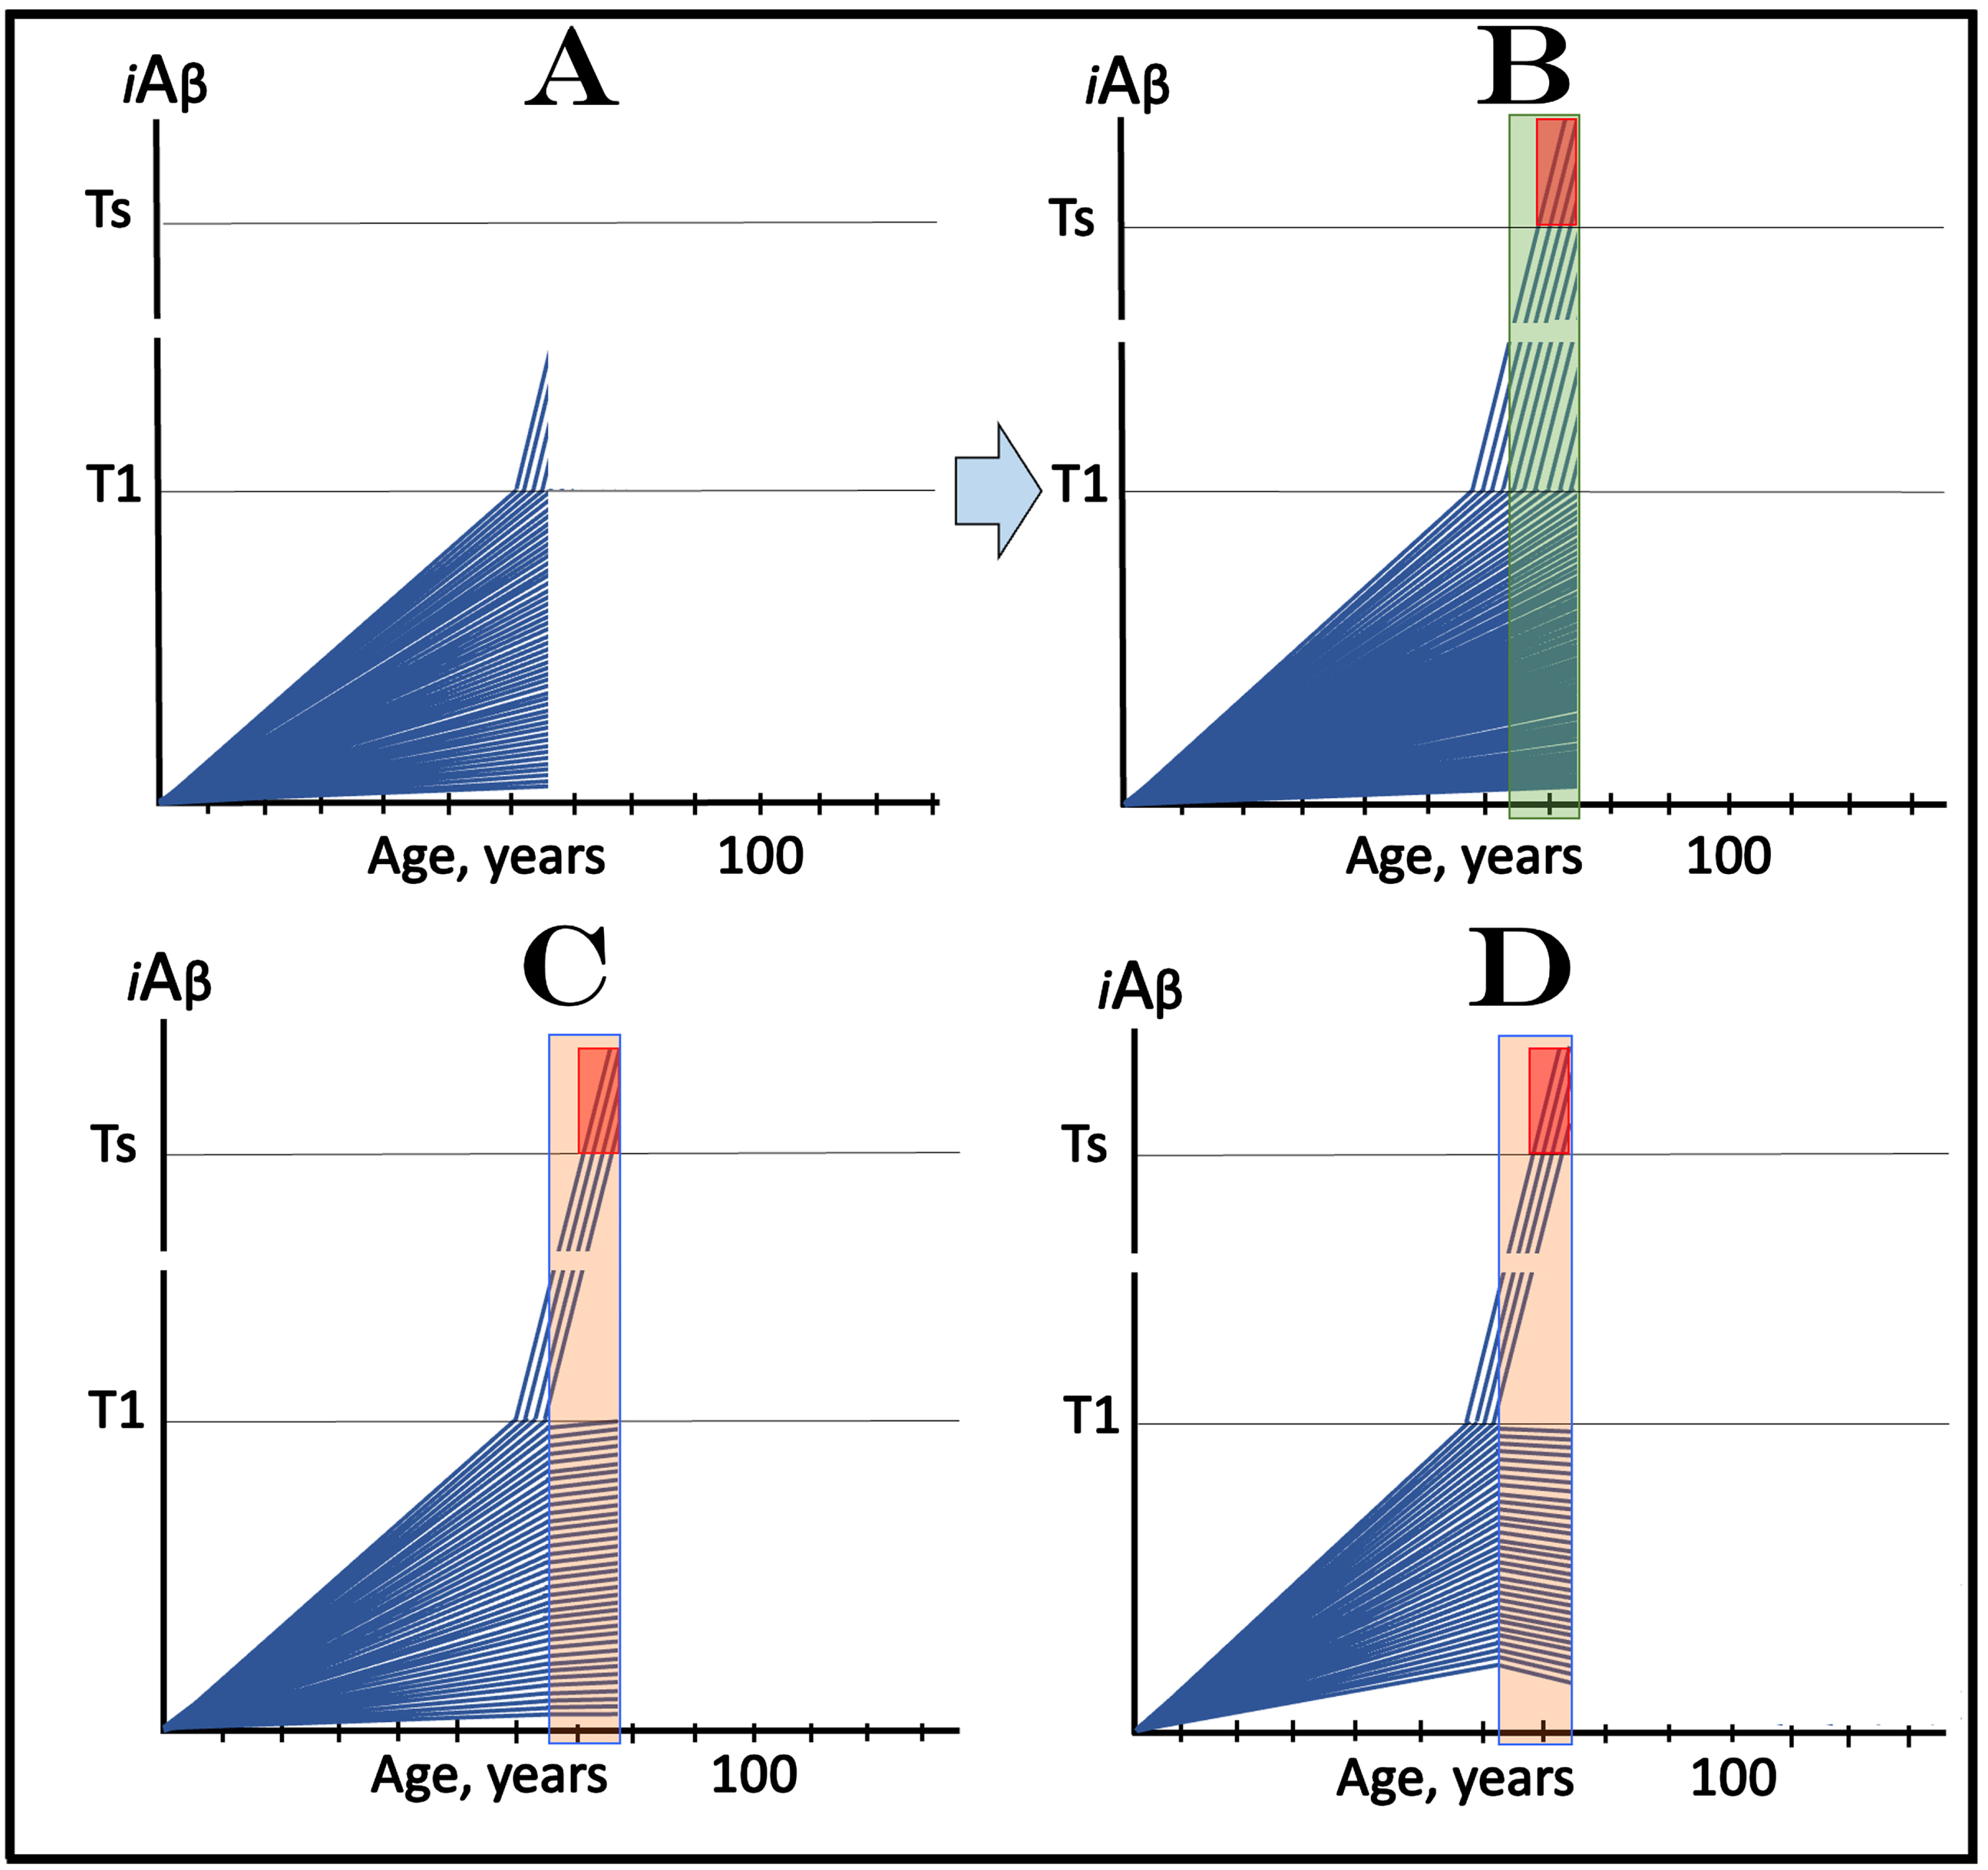
In Fig. 7C, the presence of the drug (orange field) causes the reduction of the rate of AβPP-derived iAβ accumulation and, consequently, no T1 crossings occur within the time period of interest. In panel D the presence of the drug reverses the accumulation of AβPP-derived iAβ and also precludes the T1 crossings within the time period of interest. Thus, within the time period of interest the only difference in the outcomes in the medicated and the placebo cohorts would be the presence in the latter of numerous sub-Ts cases in the second AD stage pipeline, absent in the former. These cases, however, would remain asymptomatic and therefore undetectable and invisible in the analysis of the outcomes. With additional time (not shown on Fig. 7), these new cases would reach the Symptomatic Zone, AD symptoms would manifest, and the outcomes in the medicated and placebo cohorts would diverge, but if the trial were terminated within the time period of interest (defined above), it would be considered either ineffective or a failure.
Importantly, such outcome is expected even if only a minor fraction of selected cohorts are over-T1 individuals. Figures 6 and 7 depict a situation where the composition of trial cohort reflects the general population and only a few percent of trial participants have iAβ levels exceeding the T1 threshold. If high-risk cohorts are selected on the basis of their likelihood to develop symptomatic AD in the near future as described in [82–85], the majority of the participants could be over-T1, and the results of the trials, even over the long duration, could be grossly distorting and misleading. As described below, the possibly extraordinary, practically unfeasible, duration of trials of drugs targeting the influx of AβPP-derived iAβ in the prevention of AD is one of the reasons why these drugs should be first evaluated in clinical trials for the treatment of AACD.
AACD ZONE: AGING-ASSOCIATED COGNITIVE DECLINE IS DRIVEN BY AND SHOULD BE RESPONSIVE TO DRUGS TARGETING THE INFLUX OF AβPP-DERIVED iAβ
In terms of the ACH2.0, AACD is an extended segment of the first stage of AD, which occurs in individuals with sufficiently high extents of the T1 threshold [2, 4]. The boundaries of AACD and its relationship with AD are depicted diagrammatically in Fig. 8. This figure introduces a concept of the T0 threshold, namely the iAβ levels that trigger neuronal damage manifesting as AACD [2, 4]. Figure 8 shows the dynamics of iAβ accumulation in the neurons of an individual. In healthy individuals (Fig. 8A), AβPP-derived iAβ levels do not cross the T0 threshold within their lifespan; consequently AACD does not occur (neither does AD since the T1 threshold, which is by definition higher than the T0, is also not crossed).
Fig. 8
Effect of drugs targeting the influx of AβPP-derived iAβ in treatment of Aging-Associated Cognitive Decline (AACD). Blue lines: Levels of iAβ in individual AD-affected neurons. Threshold T0: iAβ levels that trigger neuronal damage manifesting as AACD. Threshold T1: The level of AβPP-derived iAβ that triggers cellular processes resulting in the activation of the AβPP-independent generation of iAβ. T2 threshold: Levels of iAβ triggering neuronal commitment to apoptosis. Red block: Apoptotic zone. Gradient-pink boxes: “AACD Zone”, the continuum of AβPP-derived iAβ levels between T0 and T1 thresholds. Orange fields: The duration of the treatment. Note that the treatment commences prior to the crossing of the T1 threshold and that the drug has no effect over the T1 threshold. Panel A: In healthy individuals, AβPP-derived iAβ levels do not cross the T0 threshold within their lifespan; consequently AACD does not occur. Panel B: AβPP-derived iAβ levels cross the T0 threshold and thus trigger AACD. As iAβ levels increase, so do the neuronal damage and the severity of the condition. If the T1 threshold is not crossed within the lifespan of an individual, AACD continues for the remaining portion of the individual’s lifetime (not shown). If and when AβPP-derived iAβ levels cross the T1 threshold, AACD morphs into AD. Panel C: The drug is administered within the AACD Zone. The rate of accumulation of AβPP-derived iAβ is reduced but its levels continue to increase. If the T1 threshold is not crossed within the remaining lifetime, AACD would not evolve into AD and the progression of AACD in the treated individual would slow down for the duration of the treatment. If, under the treatment, the T1 threshold would be eventually crossed (not shown), AACD would evolve into AD which would be unaffected by the drug. Panel D: The reduction in the influx of AβPP-derived iAβ is such that its accumulation is reversed and its levels are steadily decreasing for the duration of the treatment. The progression of AACD in the treated patient ceases. His/her condition improves and when the declining levels of AβPP-derived iAβ exit the AACD Zone, the patient would be, at least technically, “cured”.
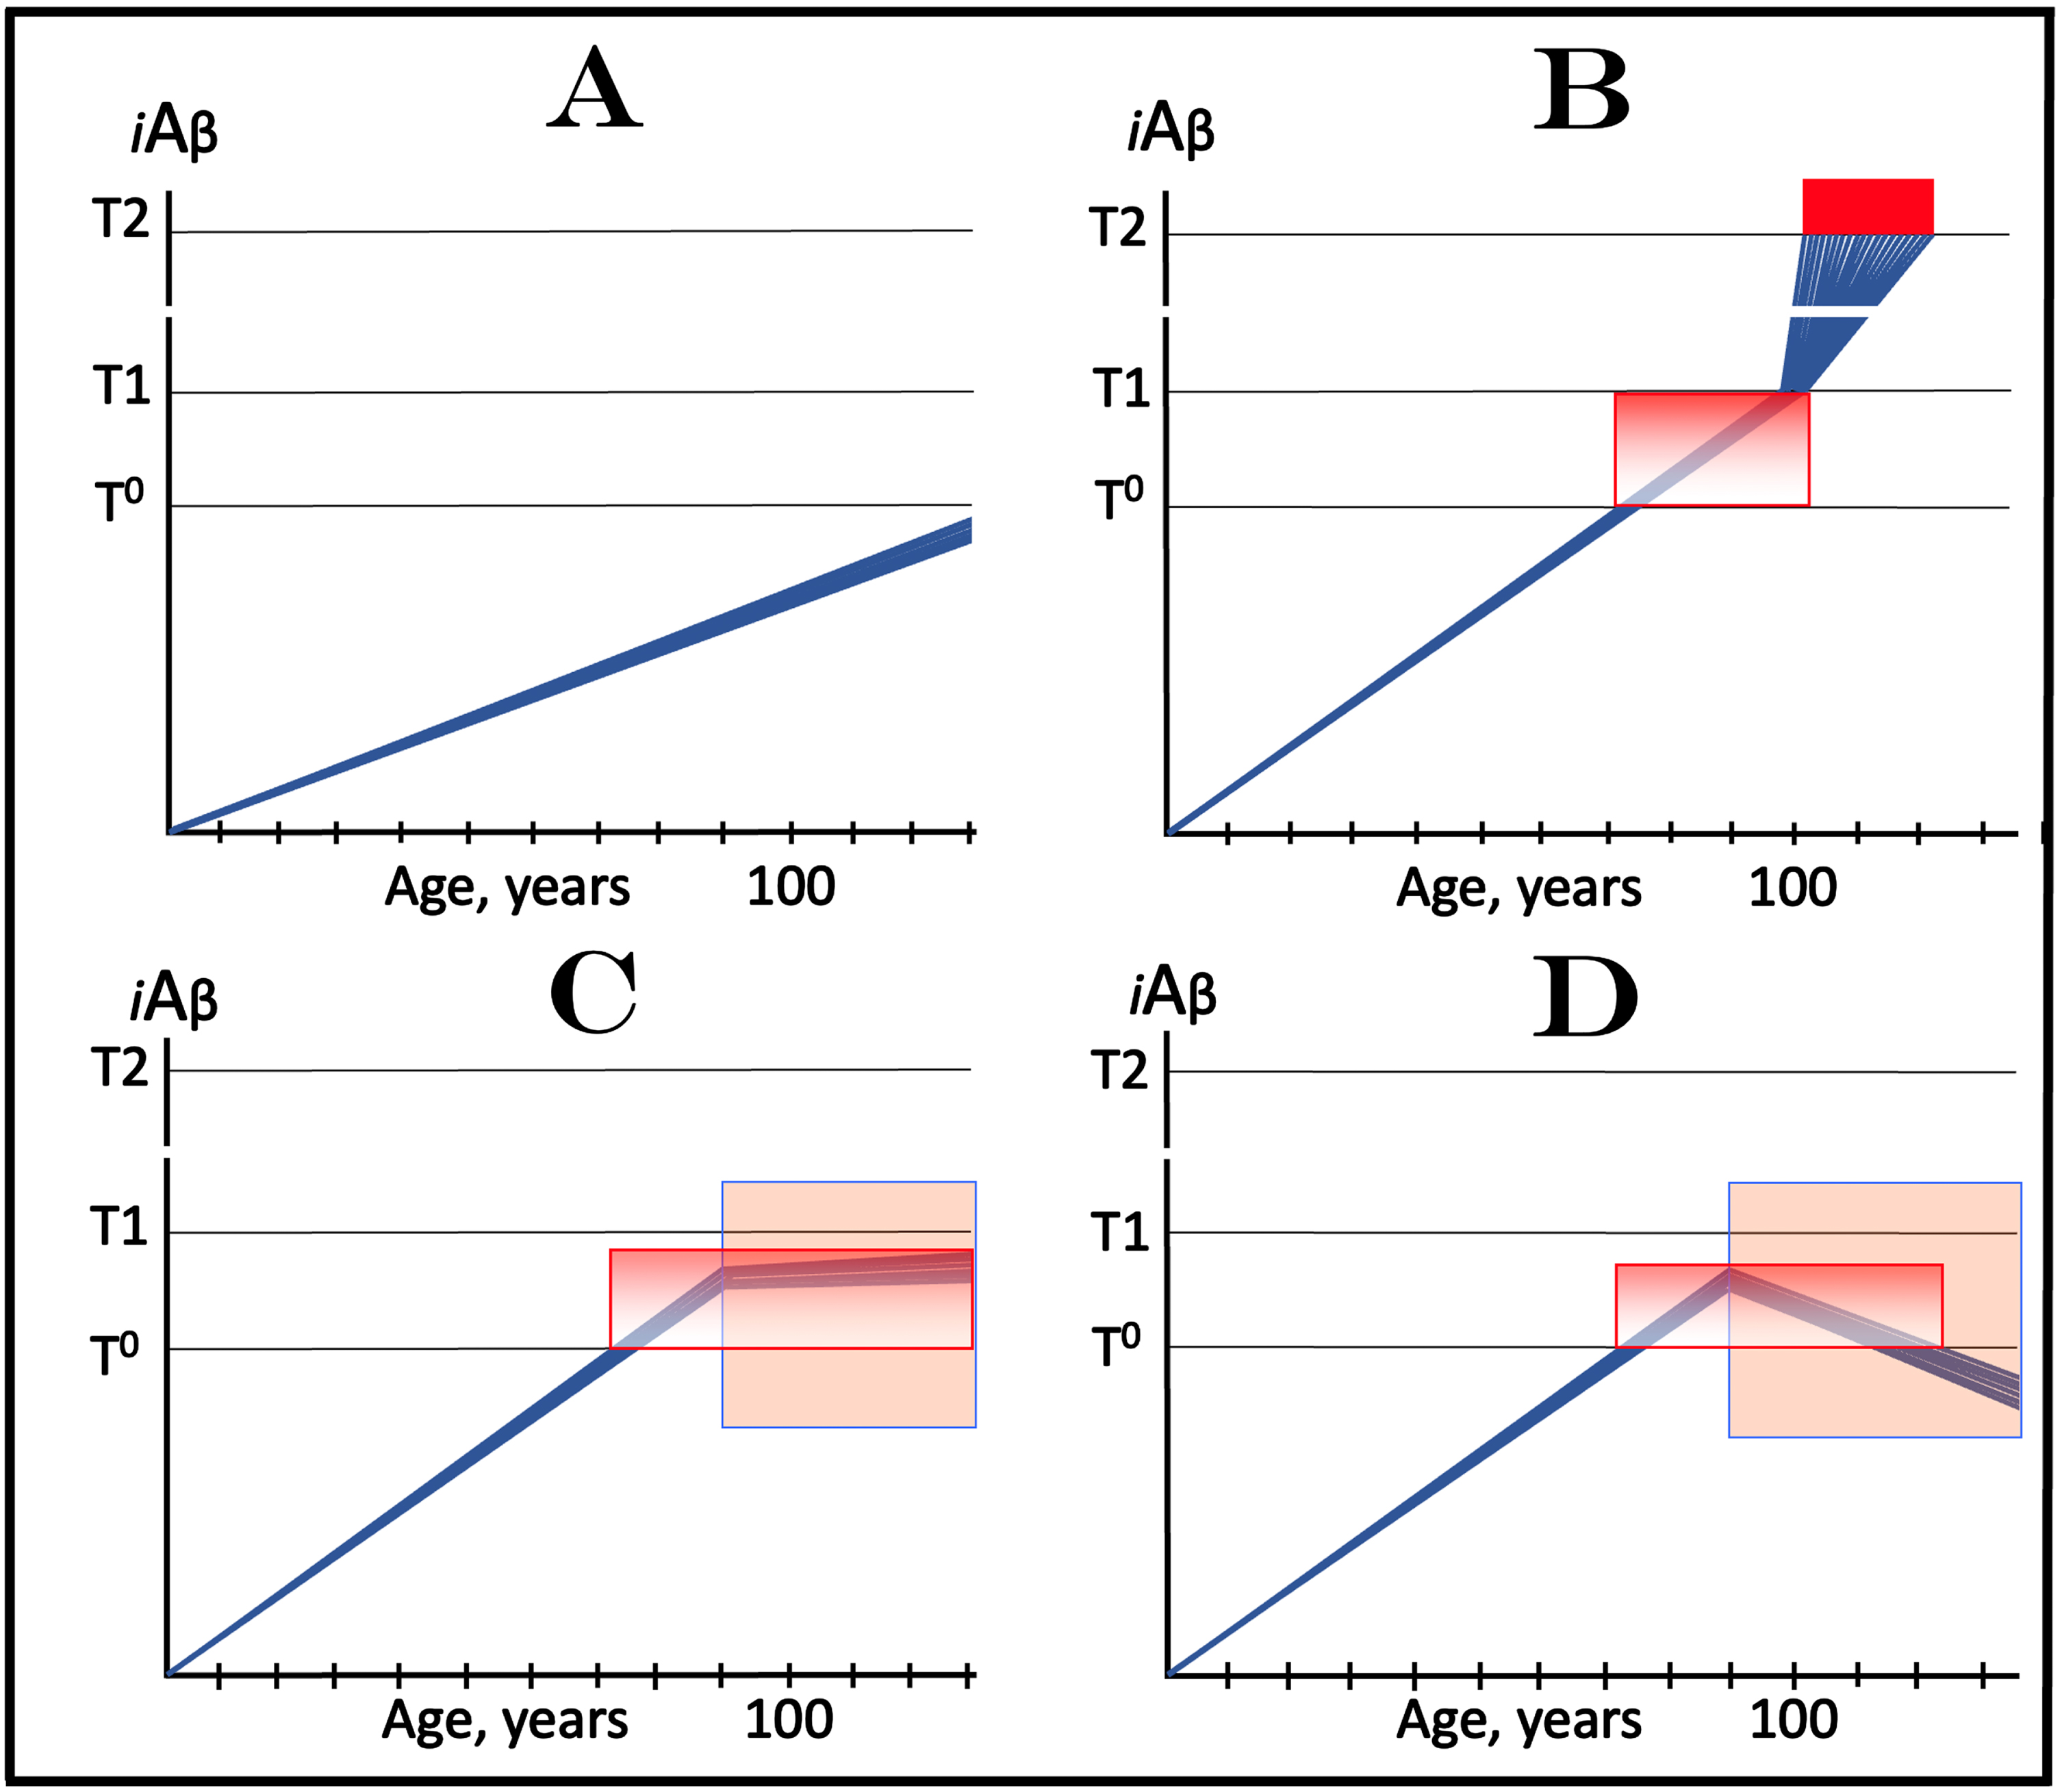
In Fig. 8B, AβPP-derived iAβ levels do cross the T0 threshold and thus trigger AACD. As iAβ levels increase, so do the neuronal damage and the severity of the condition. If the T1 threshold is not crossed within the lifespan of an individual, AACD continues for the remaining portion of the individual’s lifetime (not shown). If and when AβPP-derived iAβ levels cross the T1 threshold, AACD morphs into AD (Fig. 8B). Therefore, the T0 and T1 thresholds define the lower and upper boundaries of AACD; the continuum of AβPP-derived iAβ levels between these two thresholds constitutes the “AACD Zone” (gradient-pink boxes).
Because AACD is driven by iAβ produced in the AβPP proteolytic/secretory pathway and either imported or retained within the neuron, potential AD-preventing drugs targeting the influx of AβPP-derived iAβ should be effective in the treatment of the condition. The dual efficiency of such drugs in both AD and AACD is, in fact, indicated by and consistent with the observed effect of the Icelandic Aβ mutation which protects from both AD and AACD [86, 87] by lowering the rate of AβPP-derived iAβ accumulation [1, 2, 4]. Two potential outcomes of the deployment (orange fields) of such a drug (e.g., lecanemab or donanemab, or a drug suppressing Aβ production by AβPP proteolysis) are shown diagrammatically in Fig. 8C and 8D. In both panels, the reduction of the influx of the AβPP-derived iAβ causes a decrease in its rate of accumulation.
In Fig. 8C, the rate of accumulation is reduced but levels of AβPP-derived iAβ continue to increase. If the T1 threshold is not crossed within the remaining lifetime (as shown in Fig. 8C), AACD would not evolve into AD and the progression of AACD in the treated individual would slow down for the duration of the treatment (orange field). If, under the treatment, the T1 threshold would be eventually crossed (not shown in Fig. 8C), AACD would evolve into AD which would be unaffected by the drug, as discussed above. In Fig. 8D, the reduction in the influx of AβPP-derived iAβ is such that its accumulation is reversed and its levels are steadily decreasing for the duration of the treatment (orange field). The progression of AACD in the treated individual should cease. Patient’s condition is likely to improve with the treatment and when the declining levels of AβPP-derived iAβ exit the AACD Zone (gradient-pink box), the patient would be, technically, “cured”.
CONCEPTS OF DESIGN AND OUTCOMES OF CLINICAL TRIALS OF DRUGS TARGETING THE INFLUX OF AβPP-DERIVED iAβ IN TREATMENT OF AACD, WITH ALL PARTICIPANTS AT THE SUB-T1 LEVELS OF iAβ
Figure 9 depicts a scenario of clinical trial of drugs targeting the influx of AβPP-derived iAβ in treatment of AACD (each blue line represents individual trial participant). In this scenario, all participants have been diagnosed with AACD and in none of the participants did the levels of AβPP-derived iAβ cross the T1 threshold. Figure 9A shows the initial condition, i.e., iAβ levels of individual participants at the beginning of the trial; all these levels are within the AACD Zone (gradient-pink box). Figure 9B shows the evolution of the initial condition in the absence of a drug. The levels of AβPP-derived iAβ increase and if/when they cross the T1 threshold (this depends on the lifespan of an individual), the AβPP-independent iAβ production pathway is activated, the rate of iAβ accumulation increases, and when its levels reach the AD Symptomatic Zone (pink box), AD symptoms manifest.
Fig. 9
Design and outcomes of clinical trials of drugs targeting the influx of AβPP-derived iAβ in treatment of AACD, with all participants at sub-T1 levels of iAβ. Blue lines: Levels of iAβ in individual trial participants. Threshold T0: iAβ levels that trigger neuronal damage manifesting as AACD. Threshold T1: The level of AβPP-derived iAβ that triggers cellular processes resulting in the activation of the AβPP-independent generation of iAβ. Ts threshold: Levels of iAβ triggering the manifestation of AD symptoms. Pink fields: AD Symptomatic Zone. Gradient-pink boxes: “AACD Zone”, the continuum of AβPP-derived iAβ levels between T0 and T1 thresholds. Orange fields: The duration of the treatment. Note that the treatment commences prior to the crossing of the T1 threshold and that the drug has no effect over the T1 threshold. Panel A: The initial state of iAβ levels in trial subjects. Panel B: Evolution of the initial condition in the absence of a drug. The levels of AβPP-derived iAβ increase; if/when they cross the T1 threshold, the AβPP-independent iAβ production pathway is activated, the rate of iAβ accumulation increases, and when its levels cross the Ts threshold, AD symptoms manifest. Panels C and D show the evolution of the initial condition in the presence of the drug. In panel C, the reduction of the influx of AβPP-derived iAβ results in the decrease of the rate of its accumulation but its levels continue to increase. In a fraction of participants the decrease in the rate of AβPP-derived iAβ accumulation is sufficient to prevent the T1 crossing within their lifespans. In another fraction of participants AβPP-derived iAβ levels do eventually reach and cross the T1 threshold and AACD morphs into AD. AD symptoms manifest but with considerable delay in comparison with the placebo group, and while the condition remains AACD, cognitive decline would occur slower than in the placebo group. In panel D the reduction of the influx of AβPP-derived iAβ is such that the rate of its accumulation is reversed and its levels are declining. Neither the T1 threshold is crossed nor AD manifests for the duration of the treatment. Moreover, subjects’ condition should improve and those whose AβPP-derived iAβ levels decline below the T0 threshold would be, at least technically, cured.
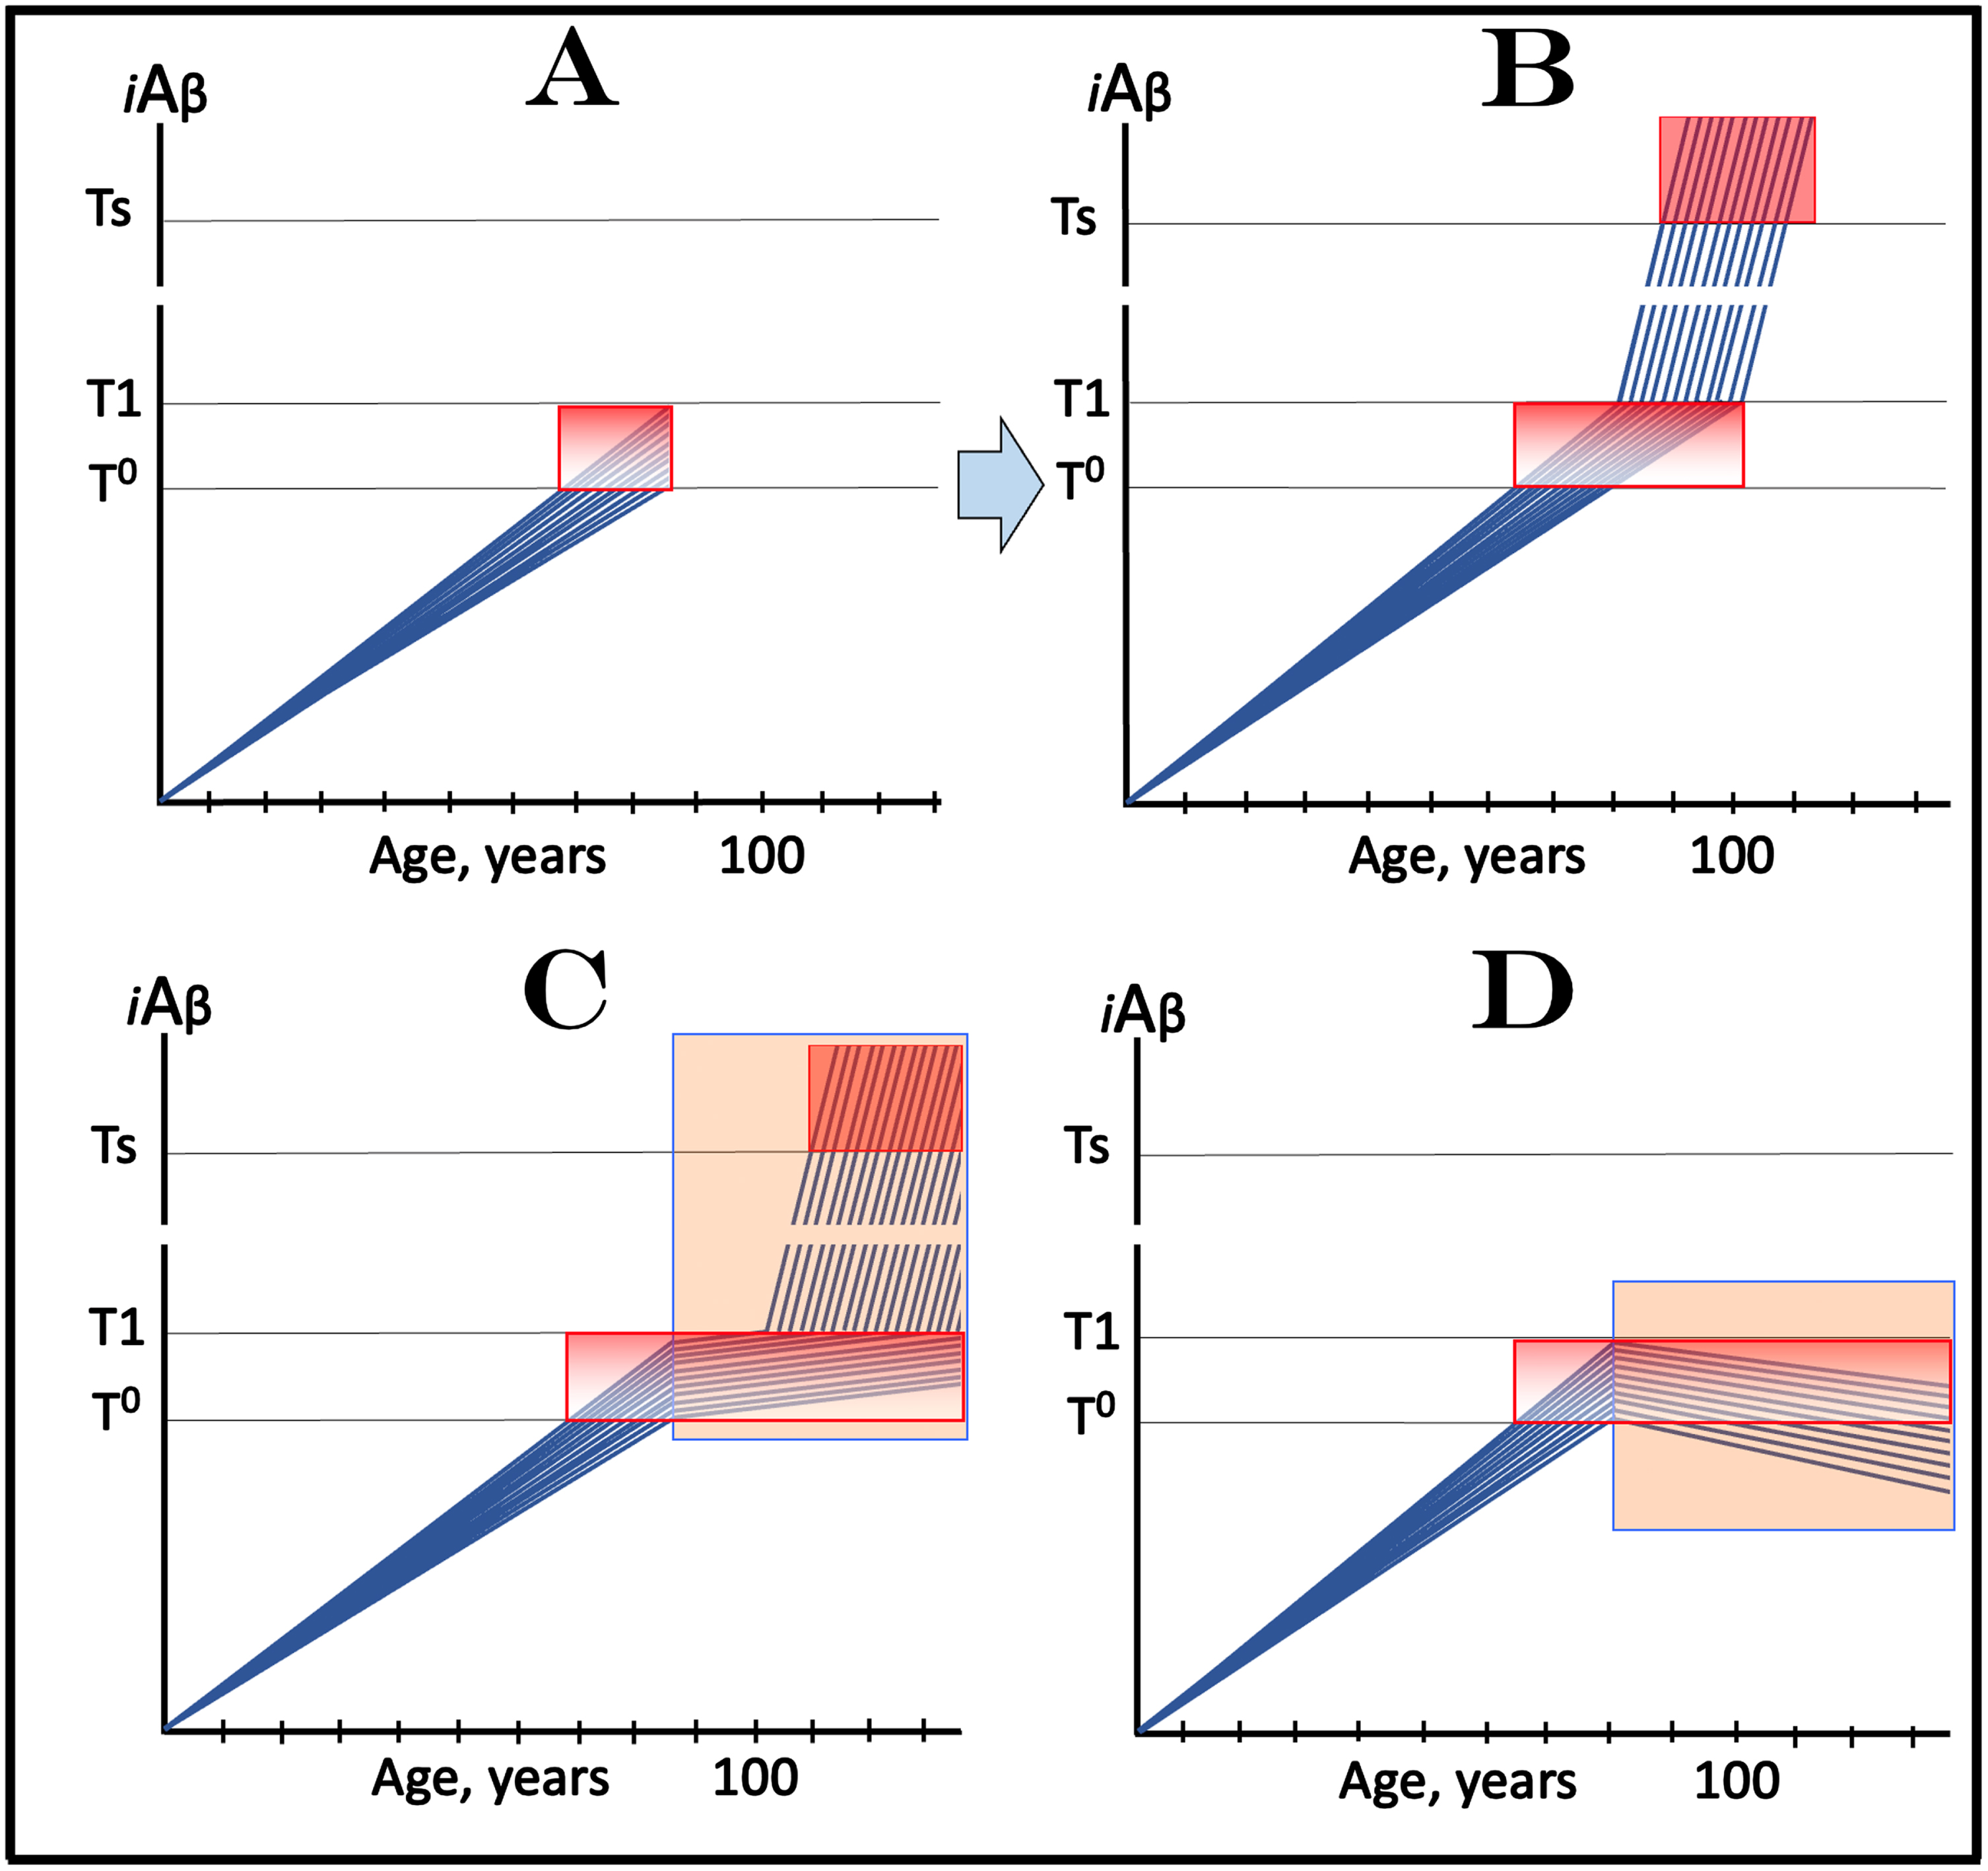
Figure 9C and 9D show the evolution of the initial condition in the presence of the drug (orange fields). In Fig. 9C, the reduction of the influx of AβPP-derived iAβ results in the decrease of the rate of its accumulation but its levels continue to increase. In a fraction of participants, the decrease in the rate of AβPP-derived iAβ accumulation is sufficient to prevent the T1 crossing within their lifespans. In another fraction of participants AβPP-derived iAβ levels do eventually reach and cross the T1 threshold. In this fraction AβPP-independent iAβ production pathway is activated, iAβ levels reach and cross into the AD Symptomatic Zone. AD symptoms manifest but with considerable delay in comparison with the placebo group, and while the condition remains AACD (i.e., while the T1 threshold is not crossed), cognitive decline would occur slower than in the placebo group. In panel D the reduction of the influx of AβPP-derived iAβ is such that the rate of its accumulation is reversed, and its levels are declining. Neither the T1 threshold is crossed nor AD manifests for the duration of the treatment. Moreover, patients’ condition should improve and those whose AβPP-derived iAβ levels decline below the T0 threshold would be, at least technically, cured.
Importantly, the strict selection of trial subjects with only early AACD symptoms, who by definition have elevated T1 thresholds, would substantially minimize and probably eliminate the possibility of the inclusion in the trial of participants with initial over-T1 iAβ levels, resulting in unequivocally interpretable outcomes. On the other hand, if participants with late AACD and, potentially, over-T1 iAβ levels were included in the trial, this could greatly complicate the outcomes as discussed in the following section.
CONCEPTS OF DESIGN AND OUTCOMES OF CLINICAL TRIALS OF DRUGS TARGETING THE INFLUX OF AβPP-DERIVED iAβ IN TREATMENT OF AACD, WITH A FRACTION OF SUBJECTS AT OVER-T1 LEVELS OF iAβ
If participants of clinical trial of a drug targeting the influx of AβPP-derived iAβ in treatment of AACD are selected only by the occurrence of AACD symptoms, including its late-stage symptoms, and by the absence of AD symptoms, it is inevitable that a fraction of selected cohorts, although asymptomatic for AD, would have iAβ levels exceeding the T1 threshold (over-T1). The initial state of such cohort is depicted in Fig. 10A. In this panel, in all participants AβPP-derived iAβ levels have crossed the T0 threshold and entered the AACD Zone (gradient-pink box). All participants are asymptomatic for AD yet in a fraction of them the levels of AβPP-derived iAβ have crossed the T1 threshold and activated the AβPP-independent iAβ production pathway. In this fraction, iAβ levels are rapidly increasing but did not yet reach the AD Symptomatic Zone (pink box). Figure 10B shows the evolution of the initial state in the absence of the drug. The initial over-T1 fraction continues its ascend toward the Ts threshold. In all other participants, provided their lifespans are sufficiently long, AβPP-derived iAβ levels cross the T1 threshold and activate the AβPP-independent iAβ generation pathway. When iAβ levels cross the Ts threshold, AD symptoms manifest.
Fig. 10
Design and outcomes of clinical trials of drugs targeting the influx of AβPP-derived iAβ in treatment of AACD, with a fraction of participants at over-T1 levels of iAβ. Blue lines: Levels of iAβ in individual trial participants. Threshold T0: iAβ levels that trigger neuronal damage manifesting as AACD. Threshold T1: The level of AβPP-derived iAβ that triggers cellular processes resulting in the activation of the AβPP-independent generation of iAβ. Ts threshold: Levels of iAβ triggering the manifestation of AD symptoms. Pink fields: AD Symptomatic Zone. Gradient-pink boxes: “AACD Zone”, the continuum of AβPP-derived iAβ levels between T0 and T1 thresholds. Orange fields: The duration of the treatment. Note that the treatment commences prior to the crossing of the T1 threshold and that the drug has no effect over the T1 threshold. Panel A: The initial state of iAβ levels in trial subjects. Panel B: Evolution of the initial condition in the absence of a drug. The initial over-T1 fraction ascends toward and crosses the Ts threshold. In all other participants, AβPP-derived iAβ levels cross the T1 threshold and activate the AβPP-independent iAβ generation pathway. When iAβ levels cross the Ts threshold, AD symptoms manifest. Panels C and D: Evolution of the initial state in the presence of the drug. In both panels, the initial over-T1 fraction is unaffected by the drug and proceeds unimpeded toward the Ts threshold; the drug affects only the participants who were initially sub-T1. In panel C the drug reduces the influx of AβPP-derived iAβ and its rate of accumulation decreases. In some participants this decrease is sufficient to prevent the T1 crossing within their lifespans. Participants whose AβPP-derived iAβ levels do eventually cross the T1 threshold enter the second AD stage but this occurs with a considerable delay in comparison with the placebo group. While participants’ condition remains AACD, their deterioration occurs slower than in the control group. In panel D the reduction of the influx of AβPP-derived iAβ is such that the rate of its accumulation is reversed and its levels decrease. Neither T1 crossing nor the manifestation of AD symptoms occur in participants who were initially sub-T1; their condition should improve and those whose iAβ levels decline below the T0 threshold would be technically cured. Note that the outcomes in the medicated and placebo cohorts would be similar for a substantial duration prior to their divergence.
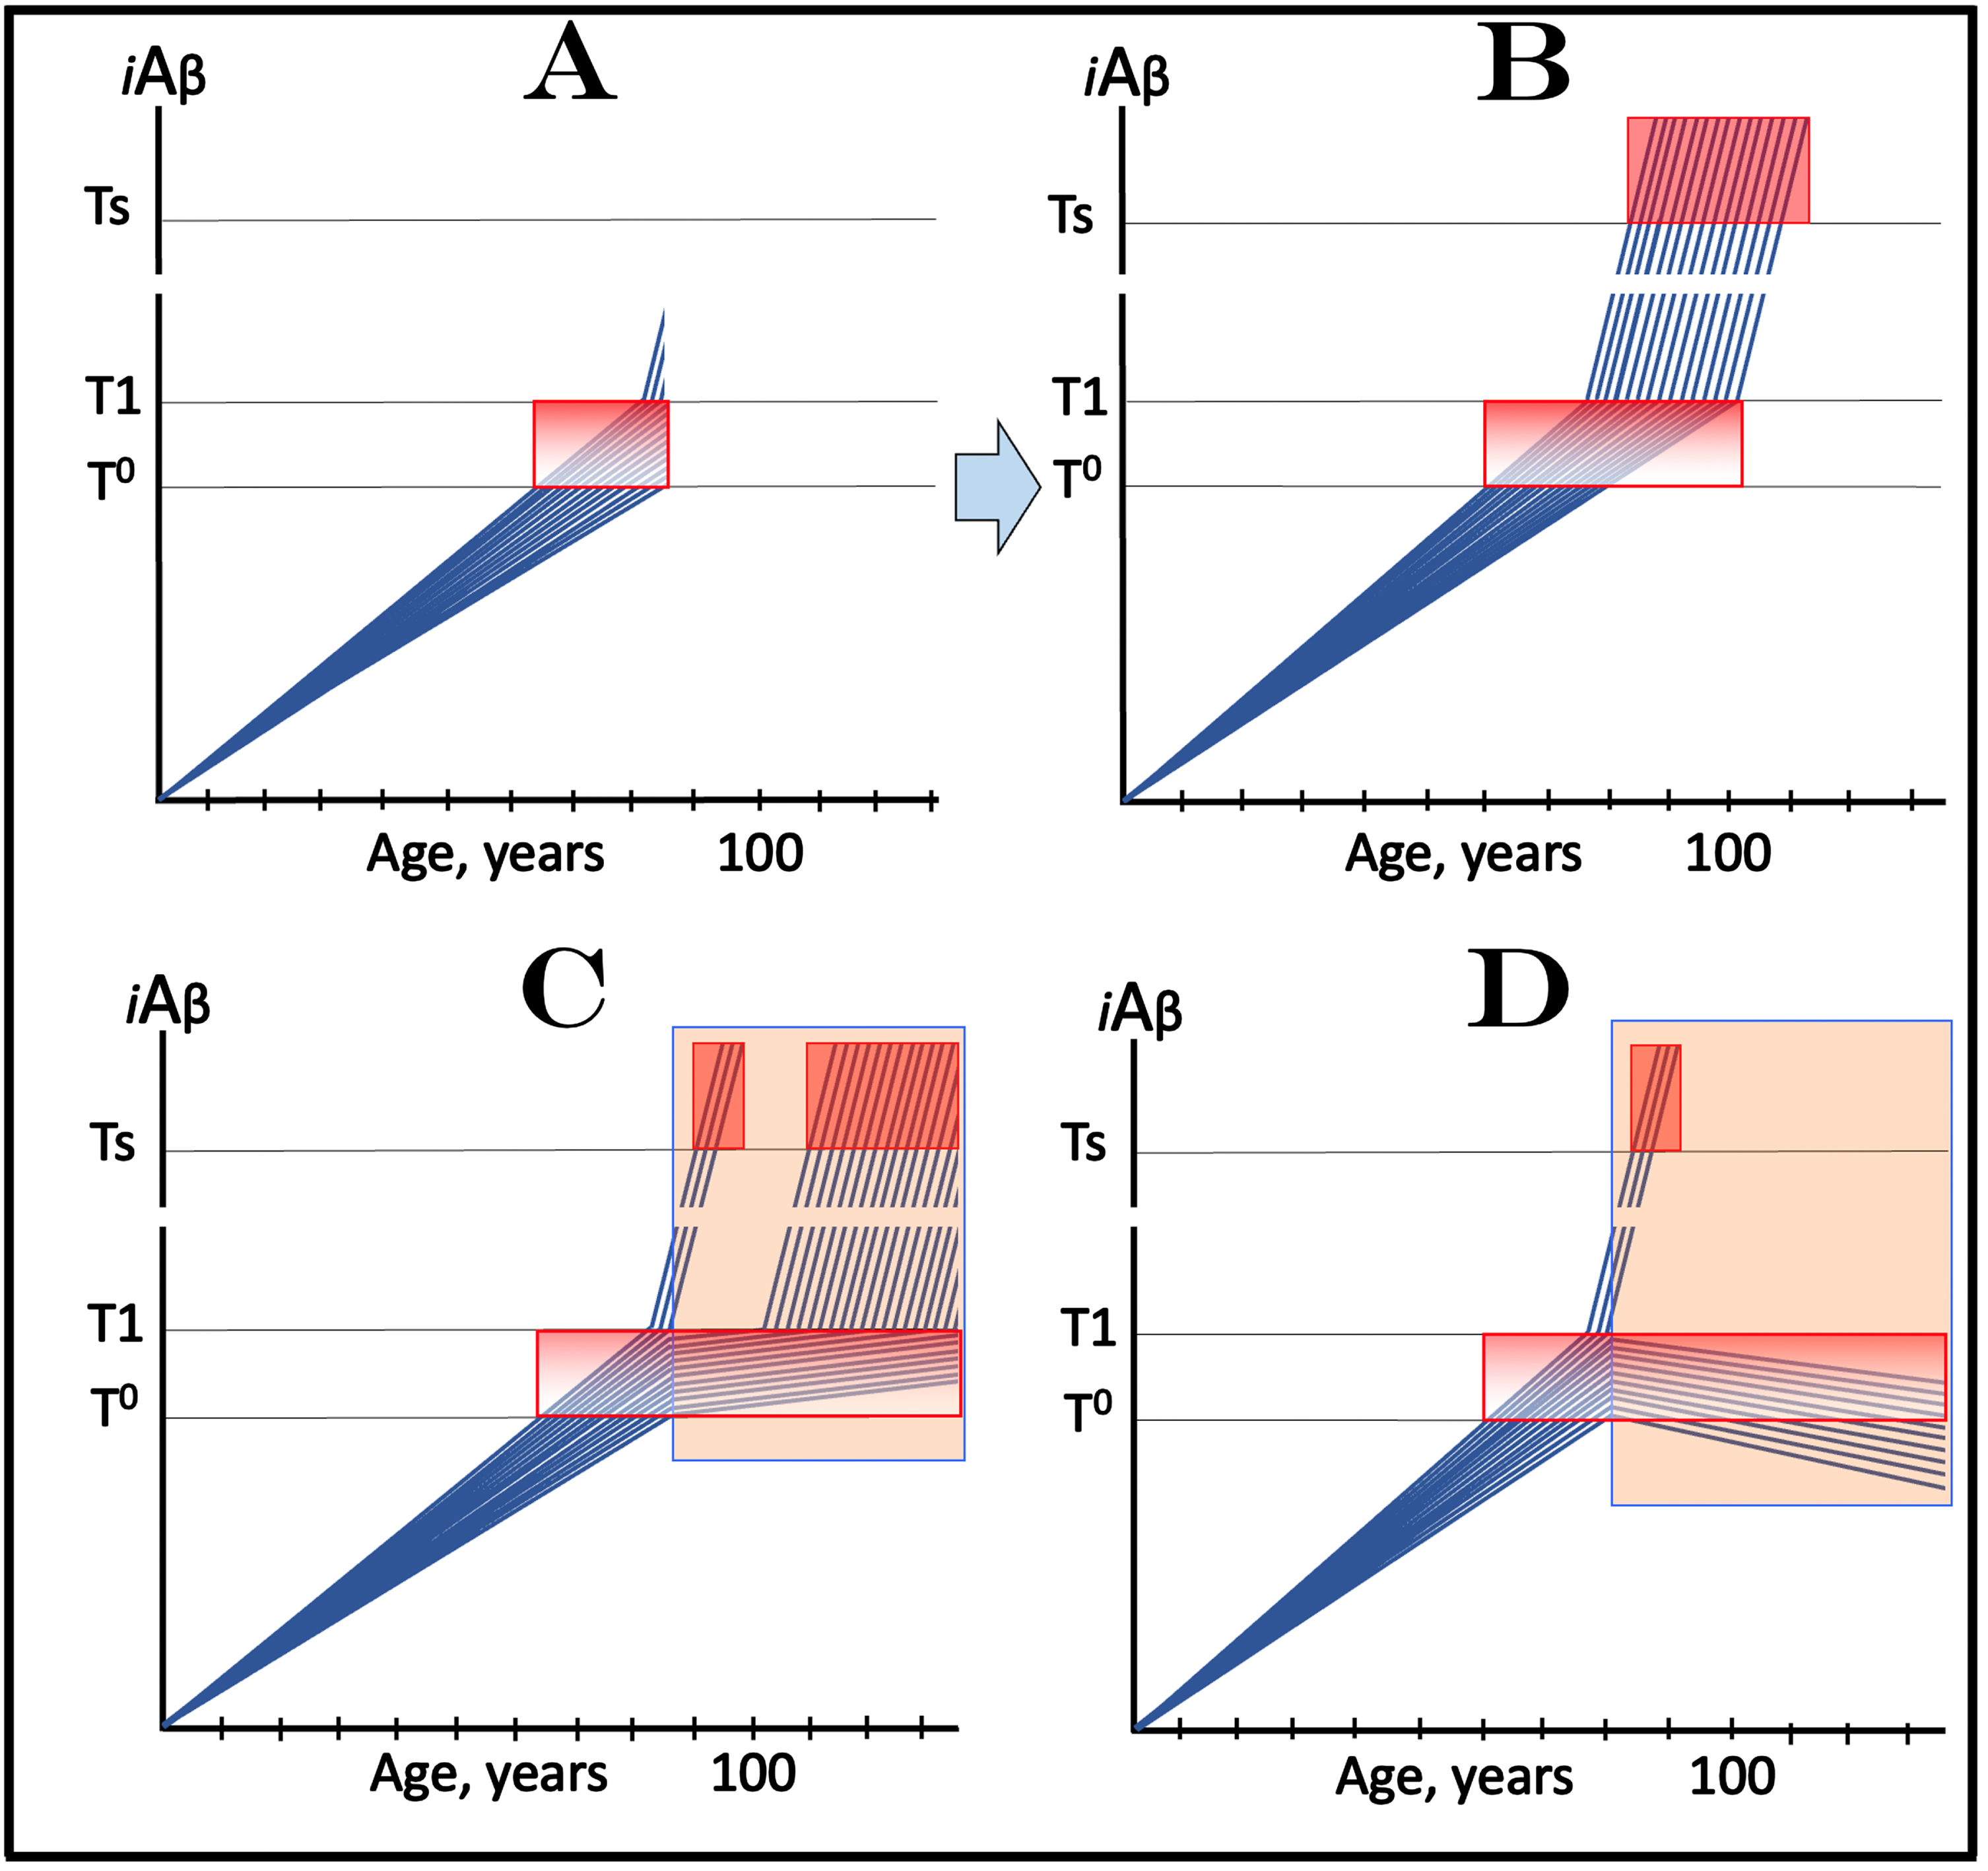
Figure 10C and 10D show the evolution of the initial state in the presence of the drug (orange fields). In both panels, the initial over-T1 fraction proceeds unimpeded toward the Ts threshold. This is because in this fraction iAβ is produced predominantly in the AβPP-independent pathway, which is insensitive to the drug. Therefore, in both panels, the drug affects only the participants who were initially sub-T1. In Fig. 10C, the drug reduces the influx of AβPP-derived iAβ and its rate of accumulation decreases. In some participants this decrease is sufficient to prevent the T1 crossing within their lifespans. Participants whose AβPP-derived iAβ levels do eventually cross the T1 threshold enter the second AD stage but this occurs with a considerable delay in comparison with the placebo group. While participants’ condition remains AACD (i.e., prior to the T1 crossing), their deterioration occurs slower than in the control group. In Fig. 10D, the reduction of the influx of AβPP-derived iAβ is such that the rate of its accumulation is reversed, and its levels decrease. Neither T1 crossing nor the manifestation of AD symptoms occur in participants who were initially sub-T1; in these trial participants condition should improve and those whose iAβ levels decline below the T0 threshold would be technically cured.
The principal problem with this type of clinical AACD trials is the same as described above for AD-preventive trials: Prior to their divergence, the outcomes in the medicated and placebo cohorts would be similar for a substantial duration. As described above, this problem can be easily avoided (for AACD treatment clinical trials but not for AD-preventive clinical trials) simply by adjusting the criteria of selection of trial subjects. Importantly, this problem arises only with the category of drugs that target the influx of AβPP-derived iAβ. Below, in sections on the “active” (versus “passive”) iAβ depletion, a different category of drugs is proposed for both AD and AACD and a different therapeutic strategy is described that render this problem irrelevant.
TRANSIENT DEPLOYMENT OF DRUGS TARGETTING THE INFLUX OF AβPP-DERIVED iAβ IN PREVENTION OF AD AND TREATMENT OF AACD
Scenarios of clinical trials discussed above have considered the effect of continuous administration of drugs reducing the influx of AβPP-derived iAβ. It is, however, inconceivable to envision preventive administration of lecanemab or donanemab for a substantial duration. Both drugs need to be administered frequently and intravenously by a medical professional. Moreover, the recipient has to be under constant observation because both drugs were shown to occasionally cause potentially life-threatening brain swellings and bleedings [84, 85]. As for drugs that suppress the production of Aβ in the AβPP proteolytic pathway and thus reduce both components of the influx of AβPP-derived iAβ, multiple BACE inhibitors, while very effective in their mechanistic mission, caused adverse effects in clinical trials when used for a long duration [88, 89].
These complications can be minimized and possibly avoided altogether if drugs were administered transiently. The rationale for this approach is simple. A drug is administered prior to the T1 crossing, when Aβ (and iAβ) are produced solely in the AβPP proteolytic pathway. If the influx of AβPP-derived iAβ is sufficiently reduced, its rate of accumulation would be reversed, and it would be depleted through the physiologically ongoing degradation and clearance. The withdrawal of the drug would force the de novo accumulation of AβPP-derived iAβ from a low baseline. Such accumulation is a very slow process. Indeed, in the majority of population levels of AβPP-derived iAβ do not reach the T1 threshold within the lifetime, and even in individuals predisposed to AD it takes decades to reach the T1 threshold. If the iAβ depletion is substantial, a single depletion treatment could be sufficient to prevent the T1 or T0 crossing for the remaining portion of the lifetime. Any depletion, in fact, would be beneficial since it would delay the crossing of T1 or T0 thresholds and could be repeated if necessary. Two unknowns are (a) how long the “transient” treatment is and (b) what degree of depletion it can achieve. As for the duration of transiency, it can be defined as a time period during which the drug does not cause an adverse effect. As for the degree of depletion, it could be assessed experimentally in an appropriate model system [1, 4].
The above concept is illustrated in Fig. 11A that depicts the initial state, i.e., the levels of AβPP-derived iAβ in the affected neurons of an individual; these levels have not yet reached the T1 threshold. Figure 11B shows the evolution of the initial state following the transient exposure to a drug targeting the influx of AβPP-derived iAβ and capable of depleting its levels. As the result, the accumulation of AβPP-derived iAβ resumes from a low baseline. If the depletion is substantial enough, as shown in Fig. 11B, the levels of AβPP-derived iAβ may not reach the T1 threshold within the remaining lifetime of the individual; in such a case, neither the T1 crossing nor the manifestation of AD symptoms would occur. Even if the iAβ depletion were not as substantial as shown in the figure, it still would be beneficial through delaying the crossing of the T1 threshold and the entry into the second AD stage.
Fig. 11
Effect of transient deployment of drugs reducing the influx of AβPP-derived iAβ in prevention of AD and treatment of AACD. Blue lines: Levels of iAβ in individual AD-affected neurons. Threshold T0: iAβ levels that trigger neuronal damage manifesting as AACD. Threshold T1: The level of AβPP-derived iAβ that triggers cellular processes resulting in the activation of the AβPP-independent generation of iAβ. T2 threshold: Levels of iAβ triggering neuronal commitment to apoptosis. Gradient-pink boxes: “AACD Zone”, the continuum of AβPP-derived iAβ levels between T0 and T1 thresholds. Orange fields: The duration of the treatment. Note that the treatment commences prior to the crossing of the T1 threshold and that the drug has no effect over the T1 threshold. Panel A: The initial state of iAβ levels in trial subjects with the low T1 threshold. Panel B: Evolution of the initial state following the transient exposure to a drug targeting the influx of AβPP-derived iAβ and depleting its levels. The accumulation of AβPP-derived iAβ resumes from a low baseline. If the depletion is substantial enough, the levels of AβPP-derived iAβ do not reach the T1 threshold within the remaining lifetime of the individual; it still would be beneficial through delaying the crossing of the T1 threshold and the entry into the second AD stage. Panels C and D: The outcome of the transient administration of a drug targeting the influx of AβPP-derived iAβ and depleting its levels in treatment of AACD. Panel C: The initial state of AβPP-derived iAβ levels in the affected neurons of an AACD patient. They all have crossed the T0 threshold but none have reached the T1 threshold. Panel D: Evolution of the initial state following transient administration of the drug. AβPP-derived iAβ is substantially depleted and its accumulation resumes from a low baseline. Its levels do not reach the T0 threshold within the remaining lifetime of the patient; technically, the patient is cured. Note that any degree of depletion of AβPP-derived iAβ would also be beneficial.
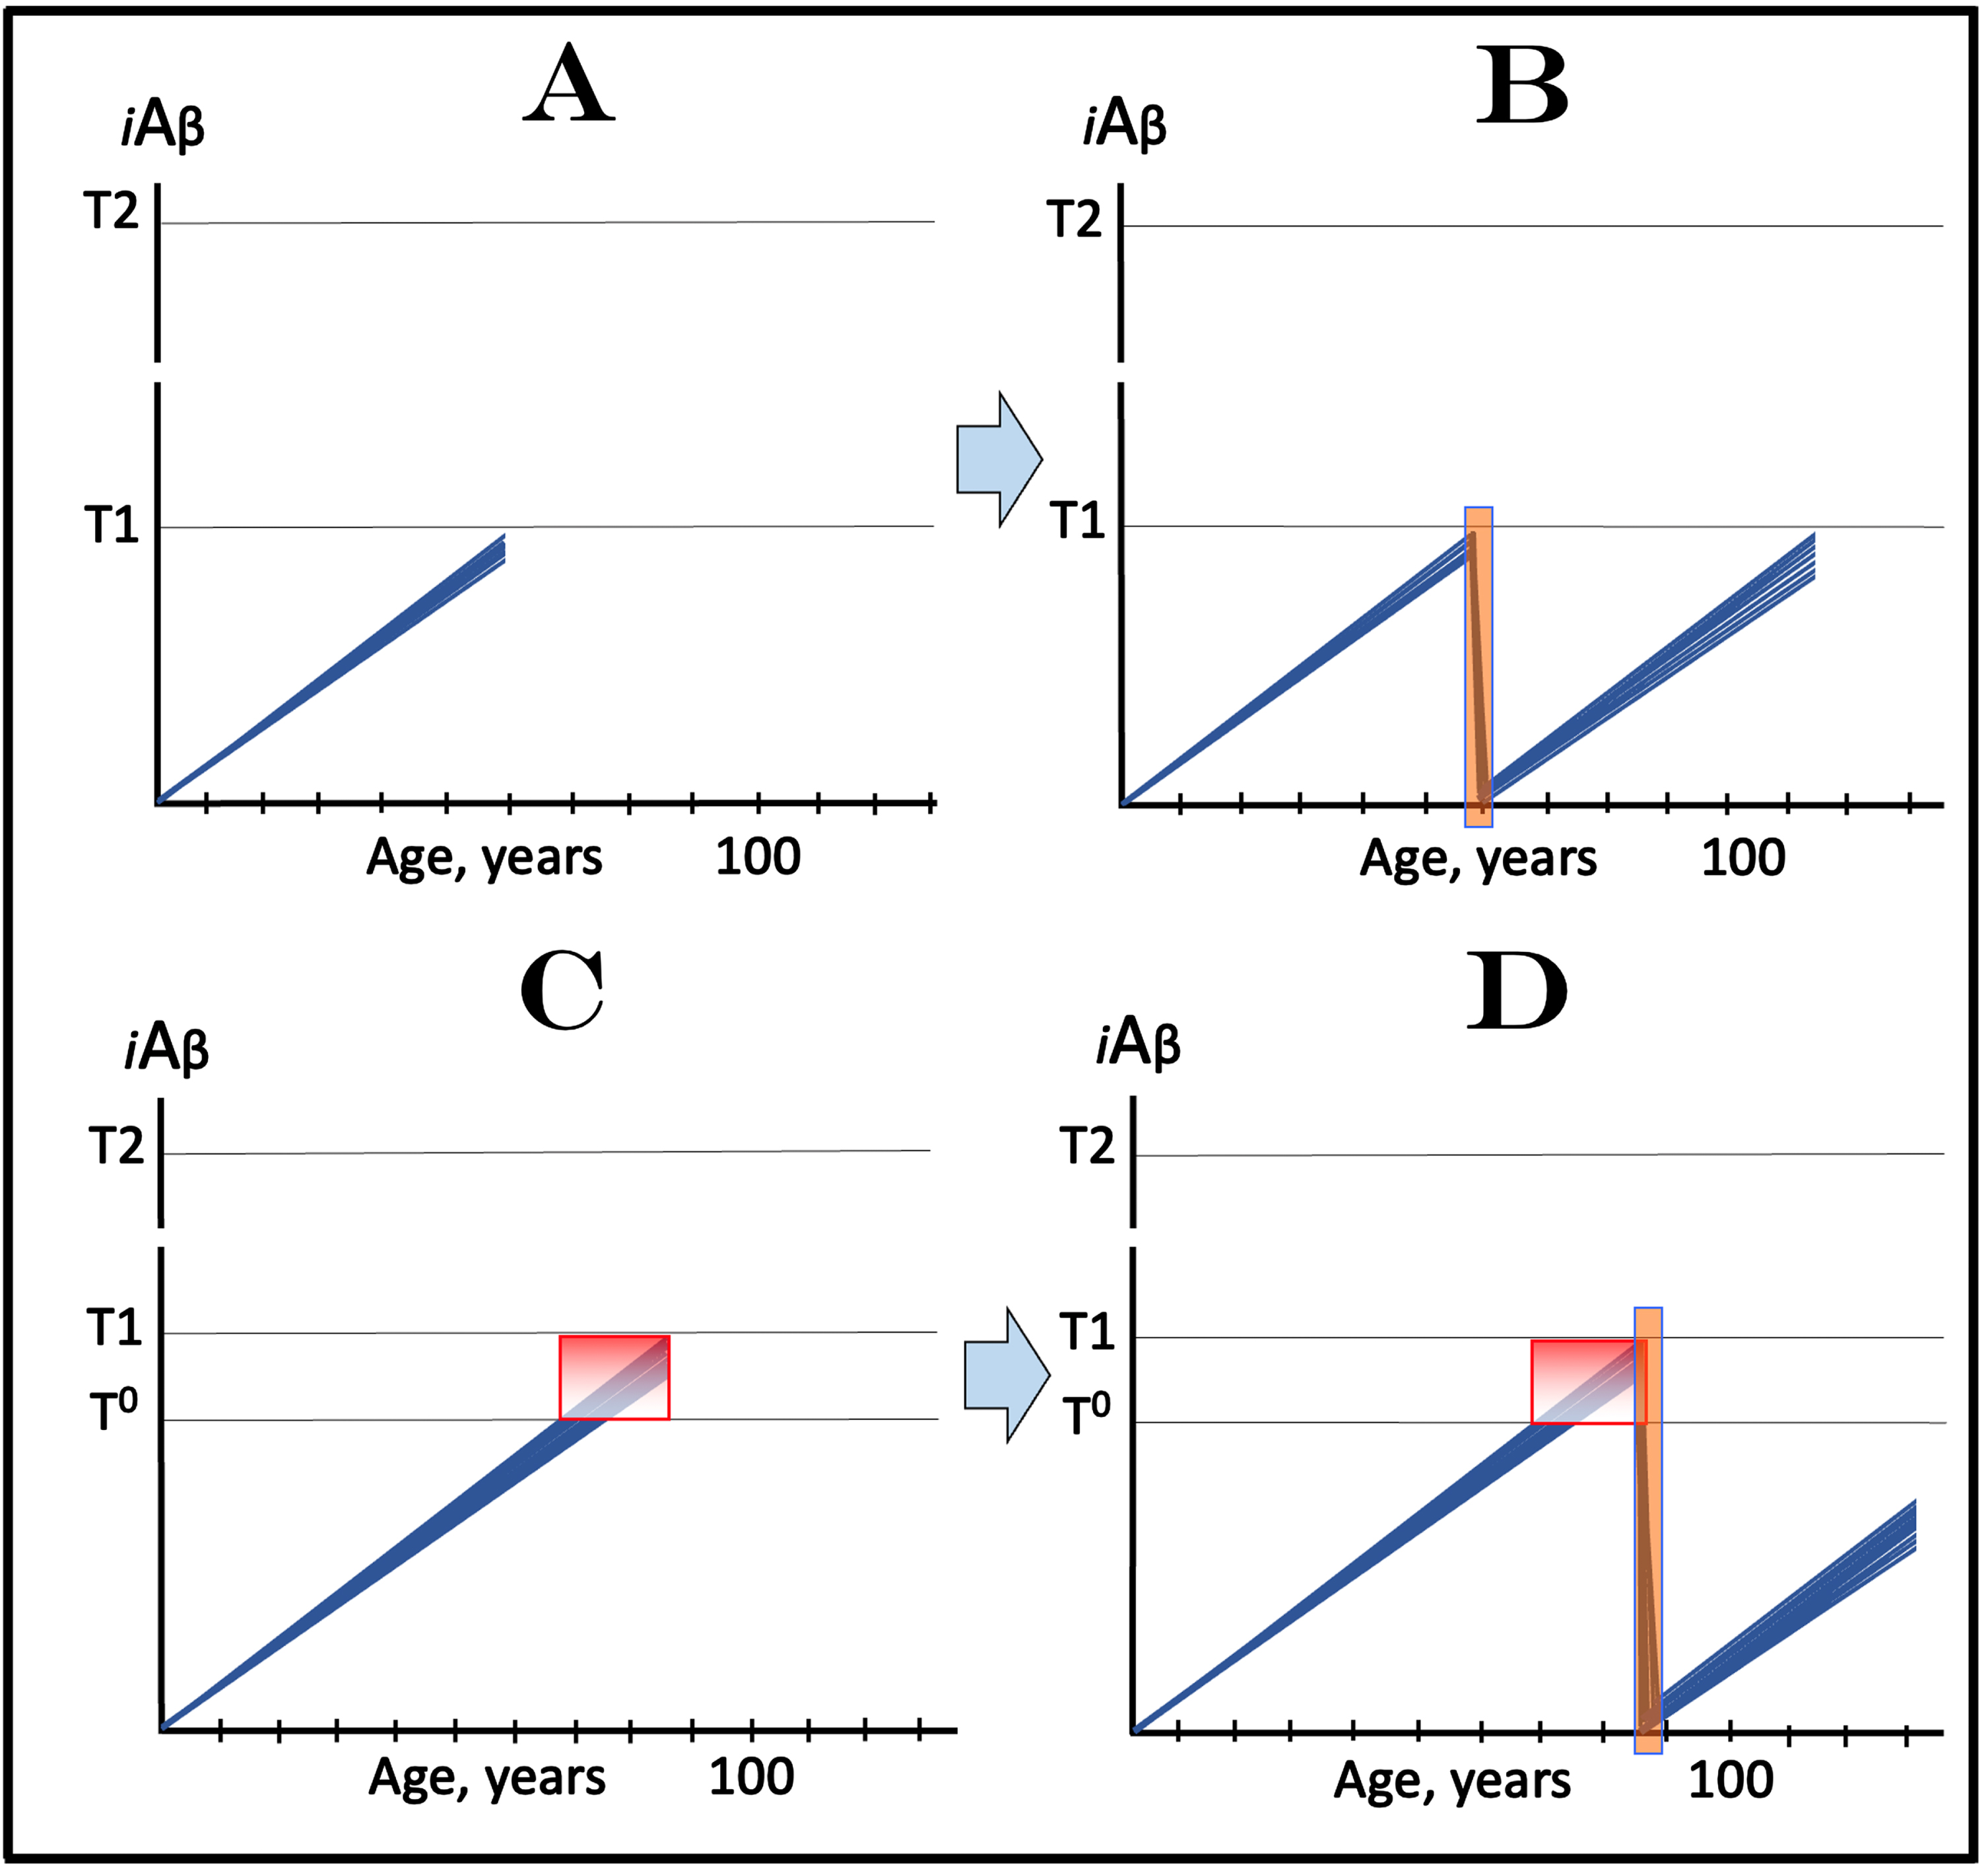
The potential outcome of the transient administration of a drug targeting the influx of AβPP-derived iAβ and capable of depleting its levels in treatment of AACD is shown in Fig. 11C and 11D. Figure 11C depicts the initial state of AβPP-derived iAβ levels in the affected neurons of an AACD patient. They all have crossed the T0 threshold and entered the AACD Zone but have not yet reached the T1 threshold. Figure 11D shows the evolution of the initial state following transient administration of the drug. AβPP-derived iAβ is substantially depleted and its accumulation resumes from a low baseline. As shown, its levels would not reach the T0 threshold within the remaining lifetime of the patient; technically, the patient would be cured. In this scenario (as shown in the figure) neither the T0 threshold would be crossed nor AACD would recur, but any degree of depletion of AβPP-derived iAβ would also be beneficial by delaying both events.
Importantly, a substantial delay and, possibly, prevention of AD and improvement in, possibly cure of, AACD could be achieved only if transient treatment results in the meaningful depletion of iAβ. If the outcome of the treatment were only the reduction, but not the reversal, of the rate of iAβ accumulation, a beneficial effect would last not much longer than the duration of the treatment. It appears that this just might be the case with lecanemab (and, probably, donanemab), since, according to [85], its beneficial effect is not retained after the withdrawal of the drug. As was discussed above, lecanemab and donanemab suppress only one of the two components of the influx of AβPP-derived iAβ: the internalization of extracellular Aβ. On the other hand, drugs inhibiting the Aβ production in the AβPP proteolytic pathway suppress both AβPP-derived iAβ influx components: its cellular uptake and intraneuronal retention. Therefore, these drugs, such as verubecestat, are more likely to reverse the rate of accumulation of AβPP-derived iAβ and to deplete it. A combination of both types of drugs, and, in addition, potential employment of drugs increasing the rate of iAβ clearance, would be more effective than a single drug in the achievement of this objective when administered transiently.
CONCEPTS OF DESIGN AND OUTCOMES OF CLINICAL TRIALS OF TRANSIENT DEPLOYMENT OF DRUGS REDUCING THE INFLUX OF AβPP-DERIVED iAβ IN PREVENTION OF AD
The application of the above concept to clinical trials of the effect of transient deployment of drugs targeting the influx of AβPP-derived iAβ in prevention of AD is illustrated in Fig. 12. Figure 12A and 12B depict the scenario where the cohorts consist exclusively of individuals with sub-T1 levels of AβPP-derived iAβ. Figure 12A shows the initial state of iAβ levels of individual participant in such a cohort. The evolution of this initial state in the absence of the drug (placebo group) is identical to that depicted in Fig. 5B and is not shown here. Briefly, a fraction of participants cross the T1 threshold, the AβPP-independent pathway of iAβ production is activated, its levels reach and cross the Ts threshold and AD symptoms manifest. The evolution of the initial state following the transient exposure to the drug or a combination of drugs targeting the influx of AβPP-derived iAβ and capable of depleting its levels (orange field) is shown in Fig. 12B. AβPP-derived iAβ levels are substantially reduced in individual participants and its accumulation resumes from low baselines. In none of the participants does AβPP-derived iAβ reach the T1 threshold within the remaining portion of his/her lifetime; neither the T1 crossings occur nor AD symptoms manifest. As discussed above, any degree of transient depletion would also be beneficent since it would delay the crossing of the T1 threshold and the entry into the second AD stage (not shown).
Fig. 12
Design and outcomes of clinical trials of transient administration of drugs targeting the influx of AβPP-derived iAβ in prevention of AD. iAβ: Level of intraneuronal Aβ. Blue lines: iAβ levels in individual trial participants. T1 threshold: Levels of iAβ triggering, plausibly via activation of PKR and HRI kinases, elicitation of the ISR and initiation of AβPP-independent production of iAβ. Ts threshold: Levels of iAβ triggering manifestation of AD symptoms. Pink fields: AD Symptomatic Zone. Orange fields: Duration of the treatment. Note that the treatment commences prior to the crossing of the T1 threshold in all participants and that the drug has no effect over the T1 threshold. Panel A: The initial state of iAβ levels in individual participants; note that all are sub-T1. Panel B: Evolution of the initial state following transient exposure to the drug targeting the influx of AβPP-derived iAβ and depleting its levels. iAβ levels are substantially reduced and its accumulation resumes from low baselines. In none of the participants does AβPP-derived iAβ reach the T1 threshold within the remaining portion of his/her lifetime; neither the T1 crossings occur nor AD symptoms manifest. Note that any any degree of transient depletion would also be beneficial. Panel C: The initial state of iAβ levels in individual participants; note that a fraction of subjects is over-T1 yet still asymptomatic. Panel D: Evolution of the initial state following transient exposure to the drug targeting the influx of AβPP-derived iAβ and depleting its levels. With the exception of the initial over-T1 fraction, the levels of AβPP-derived iAβ in individual participants are substantially depleted. Its de novo accumulation resumes from low baselines; its levels do not reach the T1 threshold and AD symptoms do not manifest within the remaining portion of the lifetime of these individuals. The initial over-T1 fraction is unresponsive to the drug targeting the influx of AβPP-derived iAβ. Levels of iAβ, generated predominantly in the AβPP-independent pathway, continue to increase, cross the Ts threshold, and AD symptoms manifest. The outcomes of such trials in the medicated and placebo cohorts would be similar for a substantial duration before diverging.
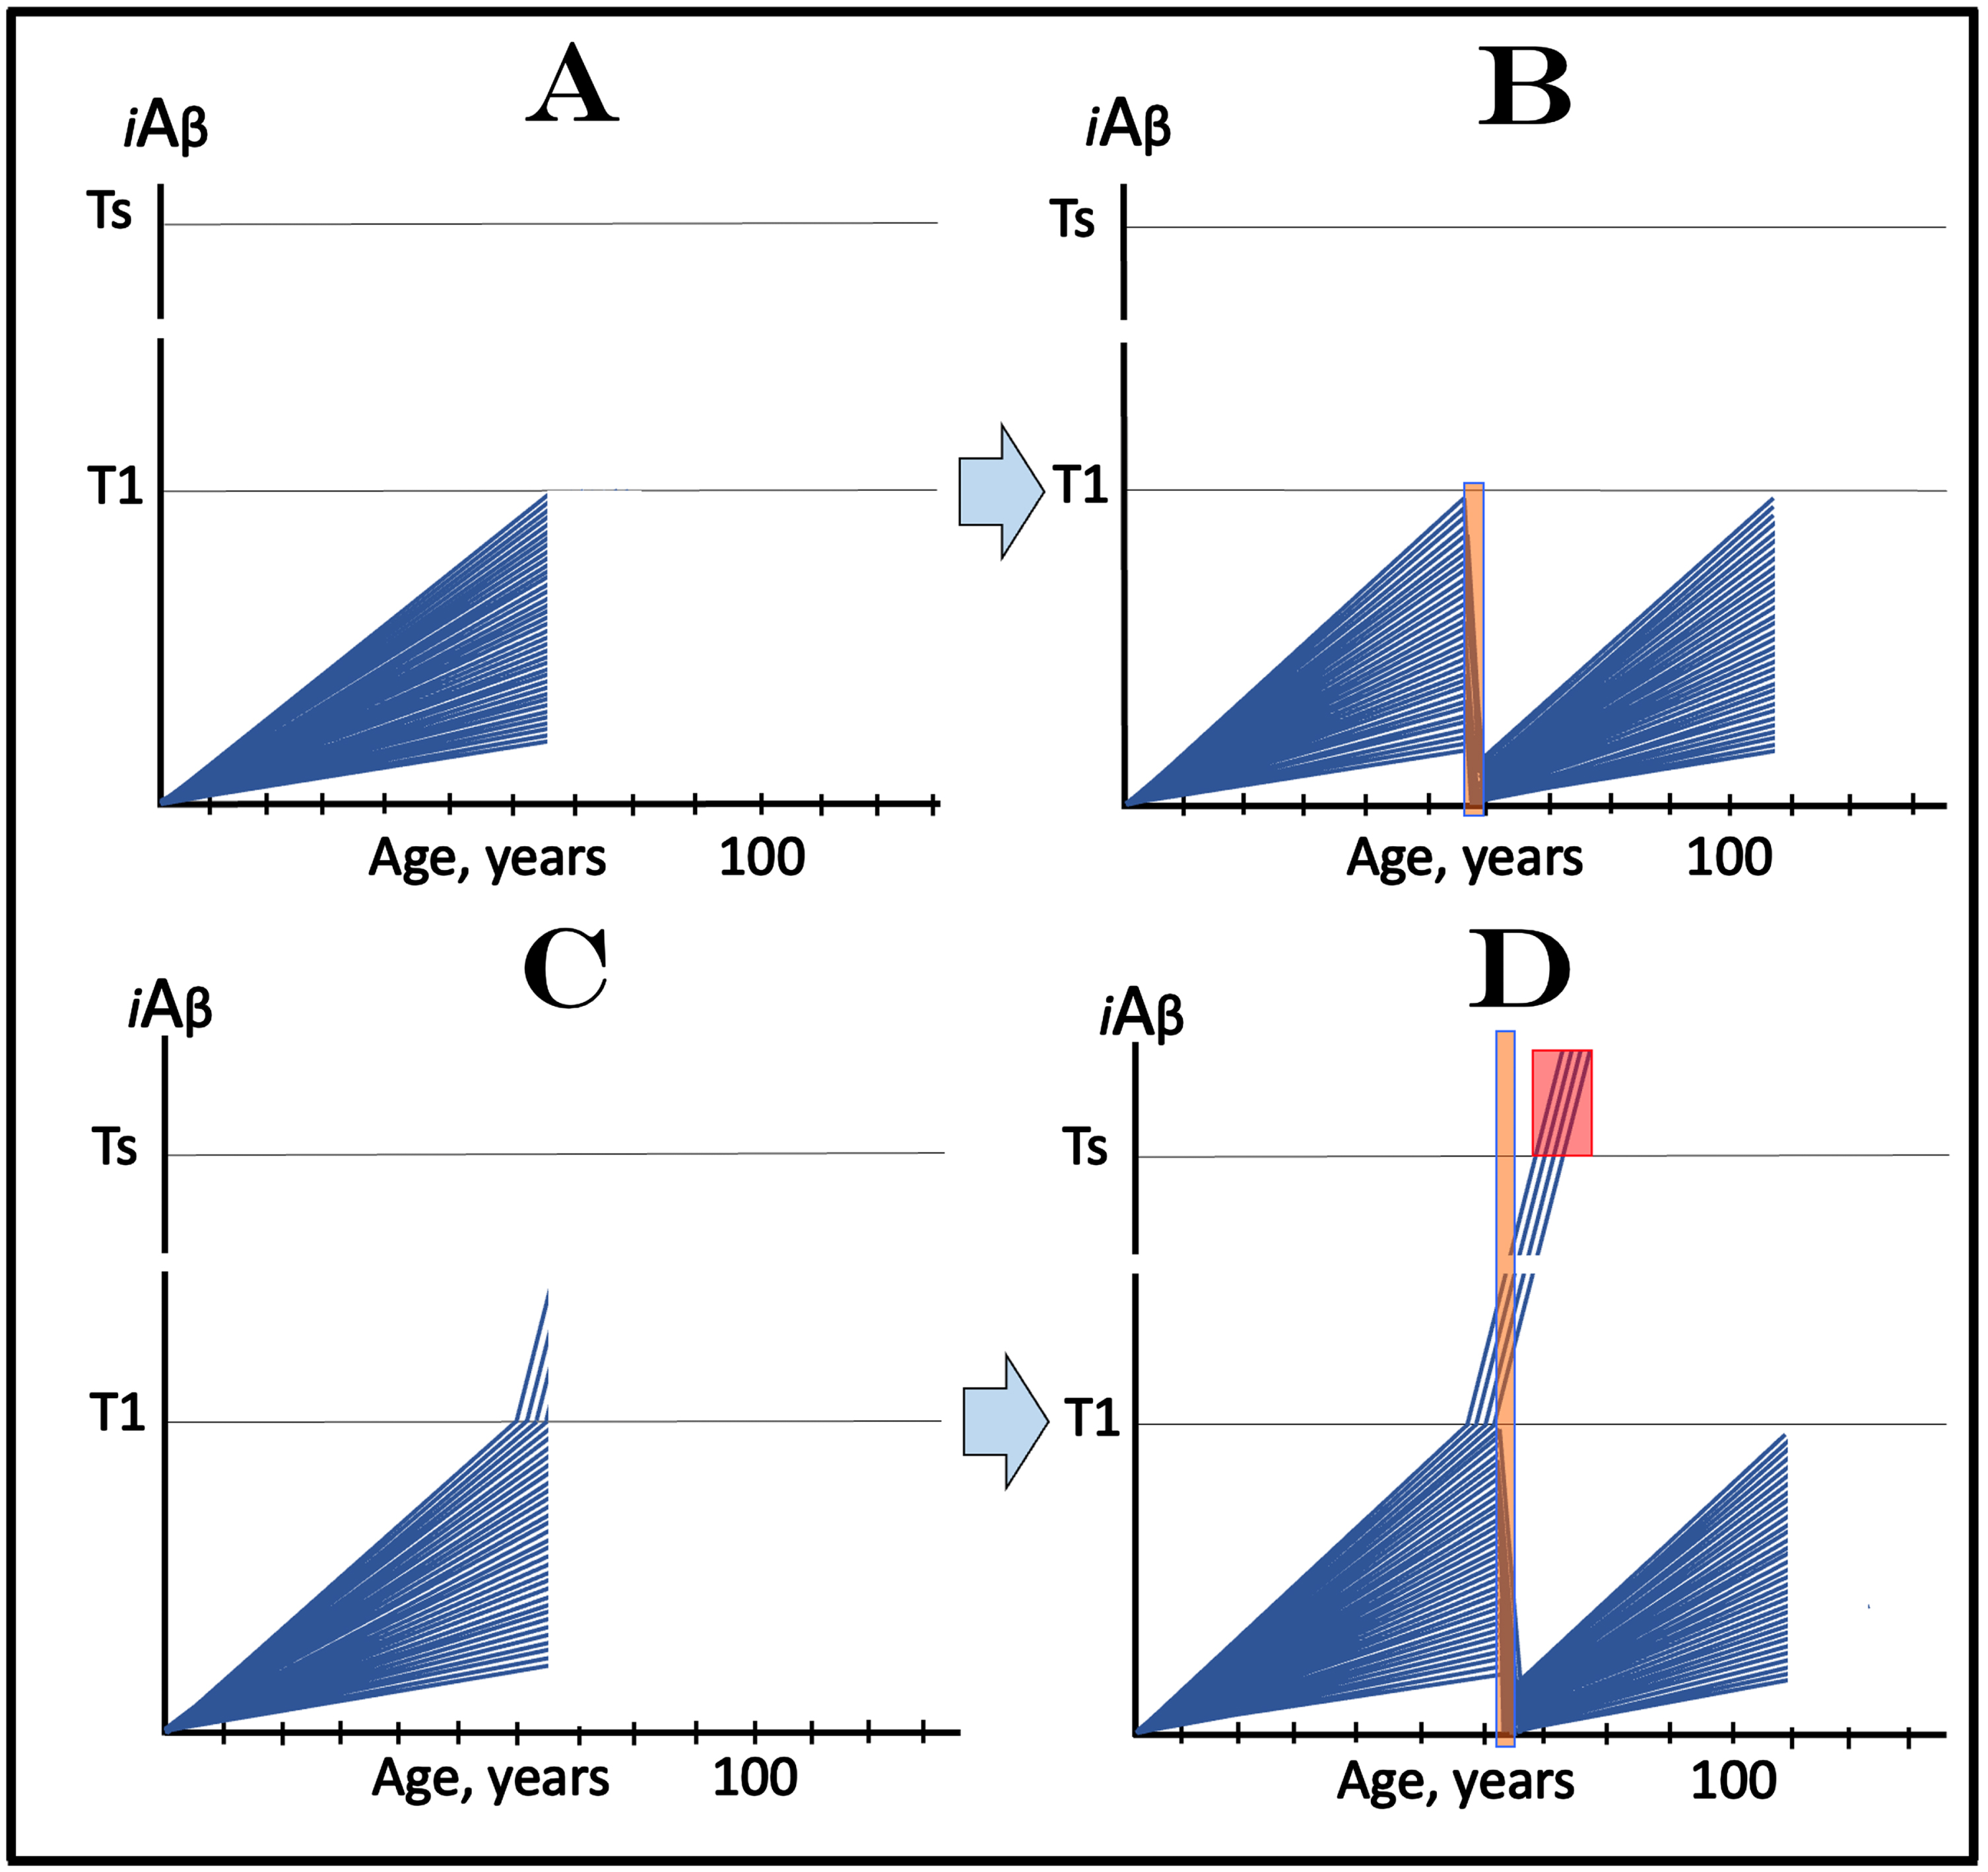
Figure 12C and 12D depict the scenario where a fraction of participants of clinical trial are still asymptomatic but have iAβ levels exceeding the T1 threshold. Figure 12C shows the initial state of iAβ levels in individual participants. With the exception of the over-T1 fraction, individual AβPP-derived iAβ levels have not yet reached the T1 threshold. In the initial over-T1 fraction, on the other hand, iAβ is predominantly produced in the AβPP-independent pathway activated following the T1 crossing. Its levels have not yet reached the Ts threshold and members of this fraction remain asymptomatic. The evolution of this initial state in the placebo group (not shown here) is identical to that shown in Fig. 6B: in addition to the initial over-T1 fraction more individuals cross the T1 threshold, levels of iAβ produced in the AβPP-independent pathway rapidly increase, cross into the Symptomatic Zone (pink field) and AD symptoms manifest. Figure 12D shows the evolution of the initial status following transient administration of the drug. With the exception of the initial over-T1 fraction, the levels of AβPP-derived iAβ in individual participants are substantially depleted. Its de novo accumulation resumes from low baselines, consequently its levels do not reach the T1 threshold, and AD symptoms do not manifest within the remaining portion of the lifetime of these individuals. In the initial over-T1 fraction the story is different. Since in these trial participants the AβPP-independent iAβ production pathway has already been activated in the initial state, they are unresponsive to the drug targeting the influx of AβPP-derived iAβ. Consequently, in these individuals, levels of iAβ, generated predominantly in the AβPP-independent pathway, continue to increase, cross into the Symptomatic Zone, and AD symptoms manifest. The outcomes of such trials in the medicated and placebo cohorts would be similar for a substantial duration before diverging, a complication discussed in more detail above.
CONCEPTS OF DESIGN AND OUTCOMES OF CLINICAL TRIALS OF TRANSIENT DEPLOYMENT OF DRUGS REDUCING THE INFLUX OF AβPP-DERIVED iAβ IN TREATMENT OF AACD
Scenarios of clinical trials assessing the effect of transient administration of drugs reducing the influx of AβPP-derived iAβ in treatment of AACD are considered in Fig. 13. Figure 13A and 13B illustrate the scenario where all participants of the trial have iAβ levels below the T1 threshold. Figure 13A depicts the initial state of such a cohort. In all participants, AβPP-derived iAβ levels have crossed the T0 threshold and entered the AACD Zone (gradient-pink box). All subjects are symptomatic for AACD, and none have crossed the T1 threshold. The evolution of this initial state in the absence of the drug (not shown here) is identical to that shown in Fig. 9B. Briefly, provided lifespans of individual participants are long enough, AβPP-derived iAβ levels in all subjects reach and cross the T1 threshold and activate the AβPP-independent pathway generating iAβ. Consequently, its levels rapidly increase, reach the Ts threshold, cross into the AD Symptomatic Zone, and AD symptoms manifest. The evolution of the above initial state following transient administration of the drug suppressing the influx of AβPP-derived iAβ and depleting its levels (orange field) is shown in Fig. 13B. AβPP-derived iAβ levels are substantially diminished in individual trial subjects. Its accumulation resumes from low baselines and proceed at slow rate. Its levels in individual trial participants do not reach the T0 threshold within the remaining portion of the lifetime. No AACD symptoms recur; the patients are technically cured. Even if the depletion of AβPP-derived iAβ were not as substantial as shown in Fig. 13B, it would still be beneficial since it would delay the T0 crossing and the recurrence of AACD symptoms.
Fig. 13
Design and outcomes of clinical trials of transient administration of drugs targeting the influx of AβPP-derived iAβ in treatment of AACD. Blue lines: Levels of iAβ in individual trial participants. Threshold T0: iAβ levels that trigger neuronal damage manifesting as AACD. Threshold T1: The level of AβPP-derived iAβ that triggers cellular processes resulting in the activation of the AβPP-independent generation of iAβ. Ts threshold: Levels of iAβ triggering the manifestation of AD symptoms. Pink fields: AD Symptomatic Zone. Gradient-pink boxes: “AACD Zone”, the continuum of AβPP-derived iAβ levels between T0 and T1 thresholds. Orange fields: The duration of the treatment. Note that the treatment commences prior to the crossing of the T1 threshold and that the drug has no effect over the T1 threshold. Panel A: The initial state of iAβ levels in trial subjects; note that all are sub-T1. Panel B: Evolution of the initial state following transient administration of the drug suppressing the influx of AβPP-derived iAβ and depleting its levels. iAβ accumulation resumes from low baselines and proceed at slow rate. Its levels do not reach the T0 threshold within the remaining portion of the lifetime. No AACD symptoms recur; the patients are technically cured. Panel C: The initial state of iAβ levels in trial subjects including a fraction of subjects that is over-T1 yet asymptomatic for AD. Panel D: Evolution of the initial state following transient deployment of the drug targeting the influx of AβPP-derived iAβ and substantially reducing its levels. With the exception of the initial over-T1 fraction, iAβ is depleted and its accumulation resumes from low baselines. Its levels do not reach the T0 threshold within trial participants’ lifespans and AACD does not recur; these individuals are technically cured. In the initial over-T1 fraction the AβPP-independent iAβ production pathway is insensitive to drugs targeting the influx of AβPP-derived iAβ. These individuals cross the Ts threshold, and AD symptoms manifest. The outcomes of such clinical trial in medicated and placebo cohorts, although eventually diverging, would be similar for a substantial duration. Note that any degree of iAβ depletion below the T0 threshold would be beneficial by delaying the re-entry into the AACD Zone.
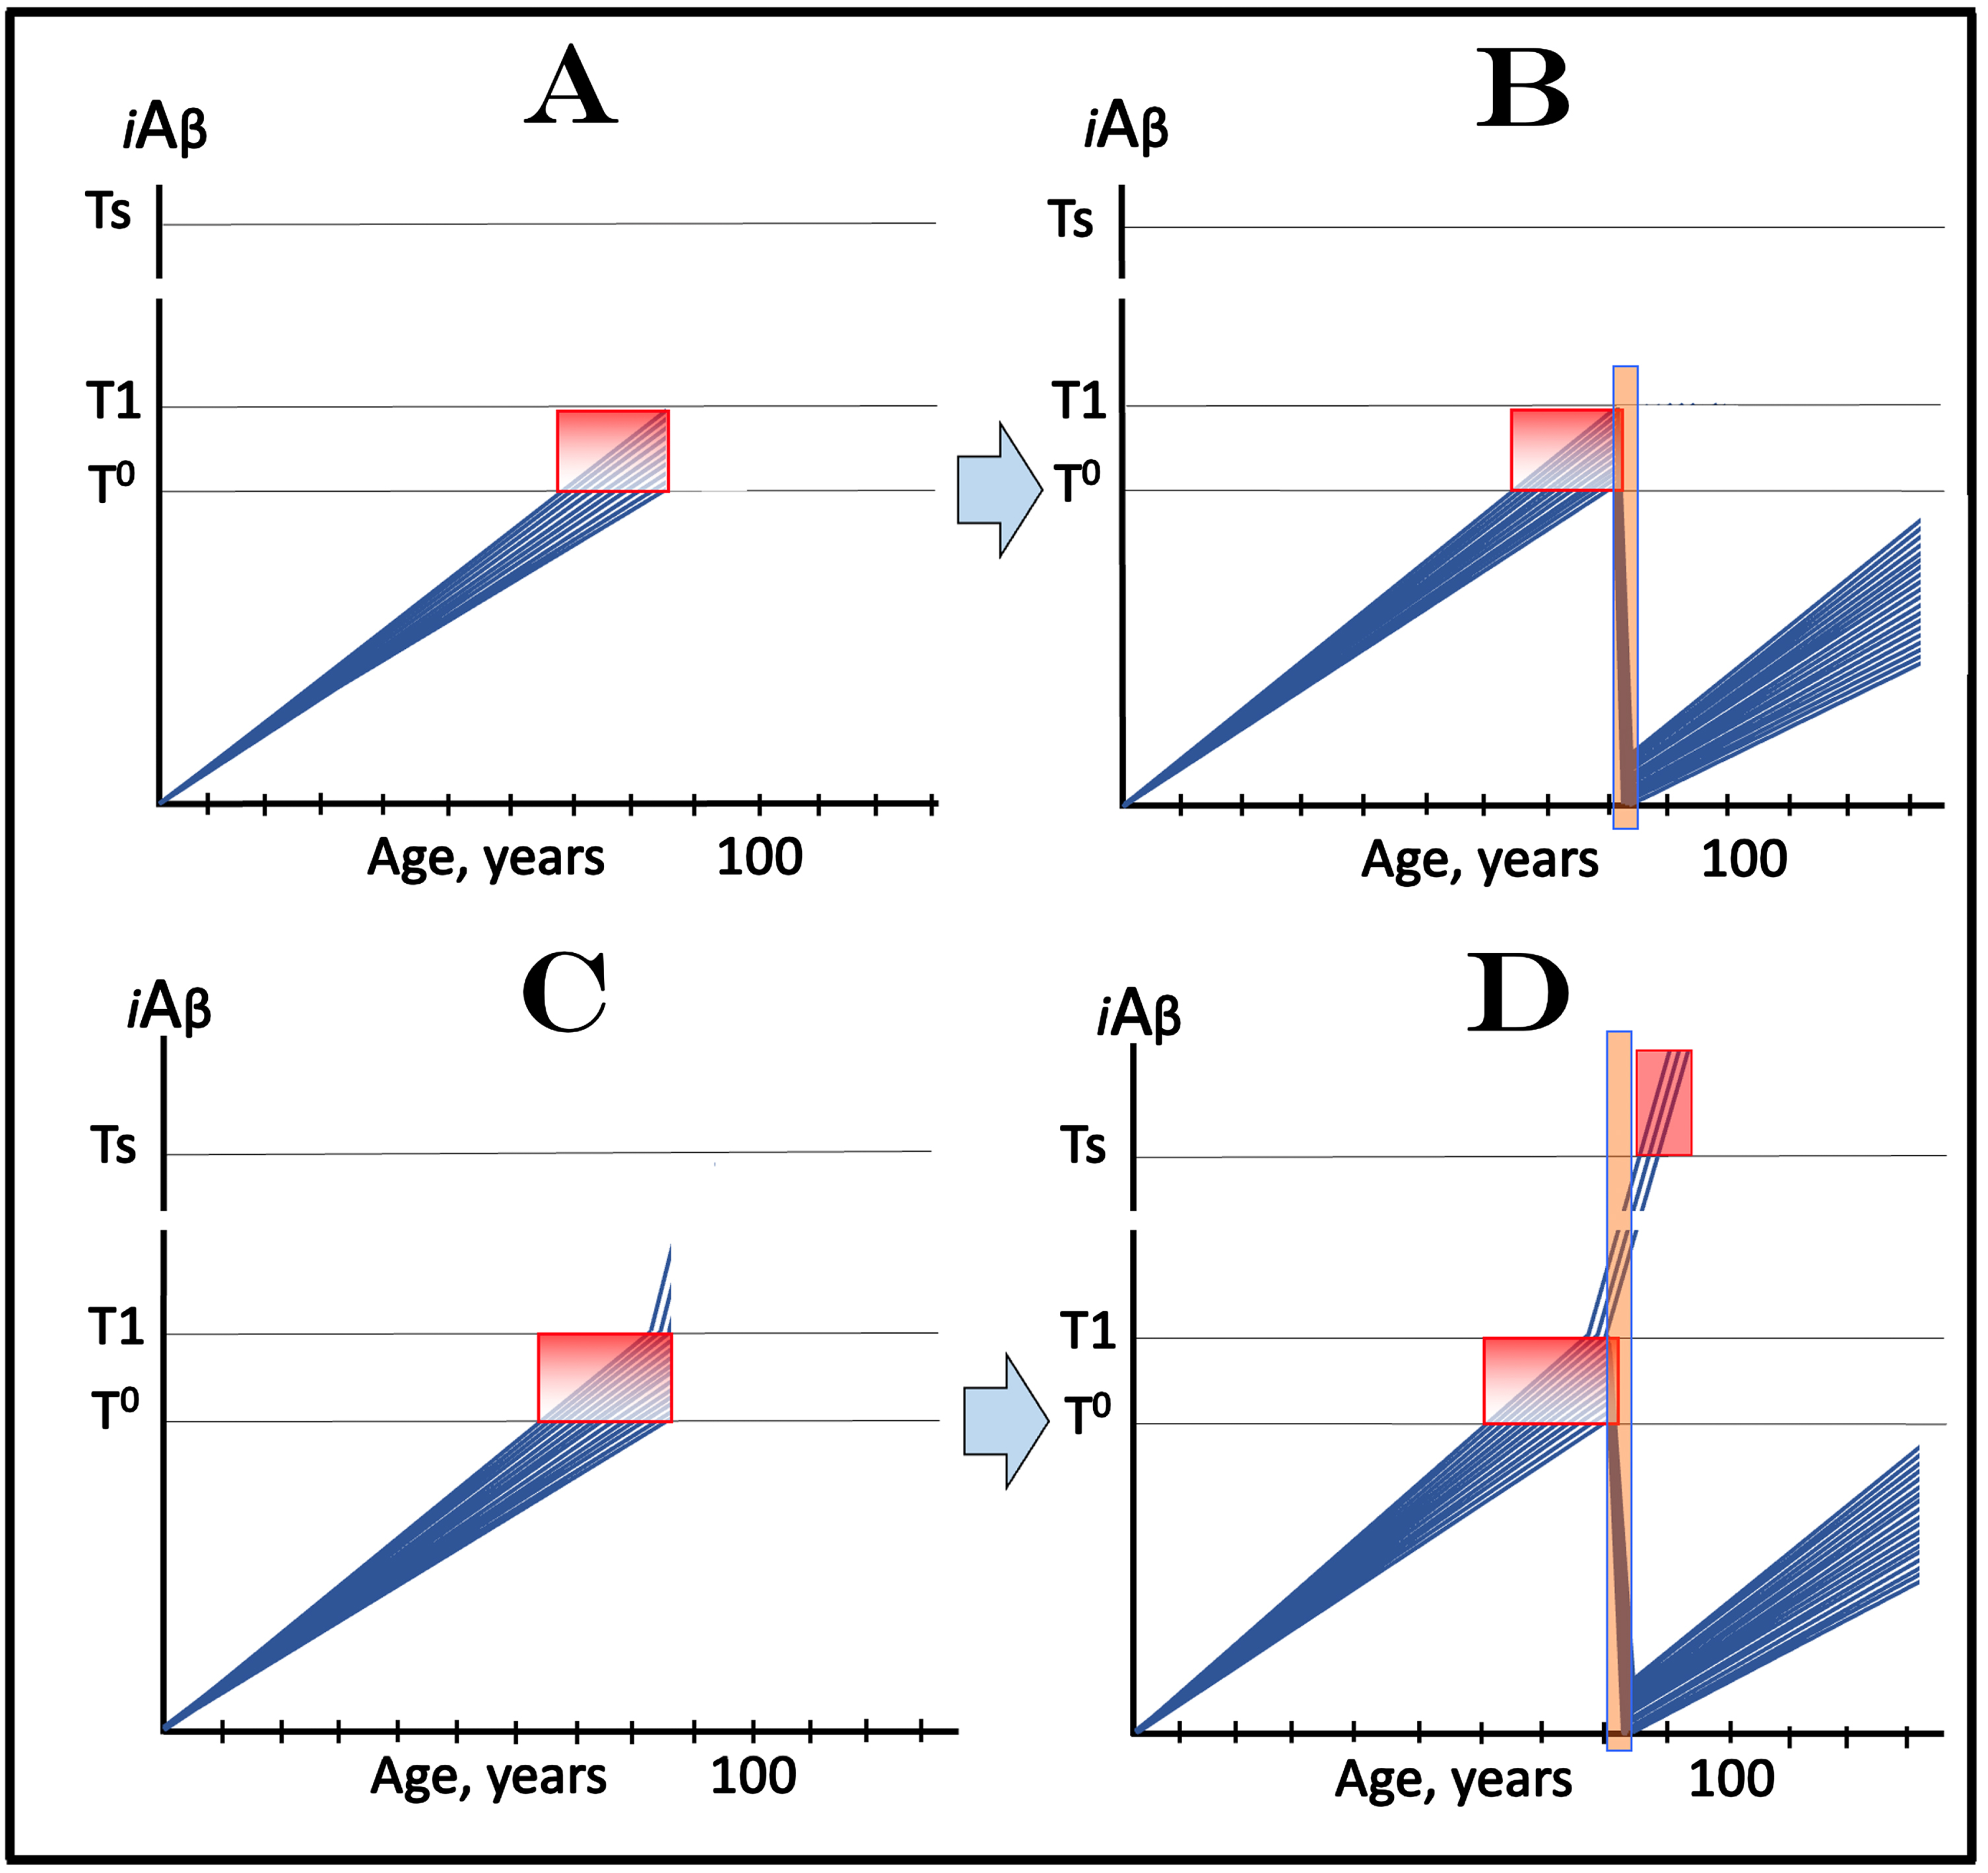
If the participants of clinical trial of transient application of drugs targeting the influx of AβPP-derived iAβ in treatment of AACD are selected only by the criteria of the occurrence of AACD symptoms and the absence of those of AD, and the late stage AACD patients are included in the trial, a fraction of the selected cohorts, although asymptomatic for AD, would inevitably have over-T1 levels of iAβ. This scenario is considered in Fig. 13C and 13D. Figure 13C depicts the initial state of iAβ levels in individual members of such a cohort. All participants have crossed the T0 threshold, entered the AACD Zone (gradient-pink box), and exhibit AACD symptoms; none are symptomatic for AD. With the exception of the initial over-T1 fraction, no members of this cohort have crossed the T1 threshold. In contrast, in the initial over-T1 fraction, AβPP-derived iAβ levels have crossed the T1 threshold and activated the AβPP-independent iAβ production pathway; its levels are rapidly increasing but have not yet reached the Ts threshold. The evolution of this initial state in the absence of the drug (placebo group; not shown) is identical to that shown in Fig. 10B. In addition to the initial over-T1 fraction, AβPP-derived iAβ levels cross the T1 threshold in all trial participants. The levels of iAβ, produced predominantly in the AβPP-independent pathway, rapidly increase, cross the Ts threshold, enter the AD Symptomatic Zone, and AD symptoms manifest. Figure 13D shows the evolution of the initial state following transient deployment of the drug (or a combination of drugs) targeting the influx of AβPP-derived iAβ and reducing its levels. As the result, with the exception of the initial over-T1 fraction, AβPP-derived iAβ levels in individual trial subjects are substantially depleted and the accumulation resumes from low baselines. The iAβ levels do not reach the T0 threshold within trial participants’ lifespans and AACD does not recur; these individuals are technically cured. In the initial over-T1 fraction, however, the AβPP-independent iAβ production pathway is insensitive to drugs targeting the influx of AβPP-derived iAβ. These individuals cross the Ts threshold, enter the AD symptomatic Zone (pink field), and AD symptoms manifest. The outcomes of such clinical trial in medicated and placebo cohorts, although eventually diverging, would be similar for a substantial duration.
TREATMENT OF AD AT ITS SYMPTOMATIC STAGES: ACTIVE (VERSUS PASSIVE) iAβ DEPLETION VIA ITS TARGETED DEGRADATION
The above discussion of therapeutic approaches and clinical trials for prevention of AD and treatment of AACD left out the proverbial Elephant in the Room, i.e., the treatment of AD at its symptomatic stages. The drugs considered in the preceding sections are those that target the influx of AβPP-derived iAβ and either reduce or reverse the rate of its accumulation. In terms of the ACH2.0, AβPP-derived iAβ drives AACD and triggers AD [1, 2, 4]. The latter is driven by iAβ produced independently of AβPP. The activation of AβPP-independent iAβ production pathway renders the contribution of AβPP proteolytic pathway to the iAβ pool insignificant and the pathway itself irrelevant for the progression of AD. To affect the course of the disease at its symptomatic stages, one must interfere with its driving force, the production of iAβ in the AβPP-independent manner.
Previously [1, 2, 4], we have analyzed various approaches to realize this objective and concluded that the most effective way to do this is to deplete total iAβ generated in both AβPP proteolytic and AβPP-independent pathways. Indeed, if the total iAβ levels were reduced below those required for the operation of the AD Engine (see Fig. 1 above), its activity would cease [1, 4]. The iAβ depletion treatment can potentially be administered transiently rather than continuously. If the transient depletion of total iAβ were substantial enough, its de novo accumulation would proceed solely via the AβPP proteolysis (since the operation of the AβPP-independent iAβ production pathway would have stopped), and its levels would not reach the T1 threshold within the remaining lifetime of an individual. In such a case, a single, once-in-a-lifetime iAβ-depleting treatment could be sufficient to treat the disease or to prevent it if administered prior to manifestation of AD symptoms [1–4] (please note: “prior to the symptomatic manifestation of the disease”, not “prior to the T1 crossing”; this aspect is further addressed below).
It should be commented that the iAβ depletion treatment is proposed to be transient only because this option is much more attractive than continuous administration of a drug. If the former were insufficient, the latter could be implemented; it would, however, be warranted only if transient deployment of the transient treatment does not result in the meaningful iAβ depletion.
In turn, the most efficient approach to accomplish such profound transient depletion of total iAβ appears to be its targeted degradation. The depletion of iAβ via its targeted degradation can be considered and is referred to henceforth as the “active” iAβ depletion. The concept of the “active” depletion of iAβ is in contrast to the “passive” iAβ depletion seen in some cases of the reduction of the influx of AβPP-derived iAβ. The “passive” iAβ depletion cannot result from the reduction in the rate of its accumulation alone. It is rather due to its ongoing degradation and clearance and, consequently, to the change of the iAβ influx/efflux balance discussed above. In short, both “active” and “passive” depletion occur due to degradation and removal of iAβ. In the former, it is physiologically ongoing (therefore “passive”) degradation and clearance assisted by the reduction in the influx of AβPP-derived iAβ, whereas in the latter it is the forced, hence “active” iAβ degradation.
Conceivably, there are, potentially, numerous agents capable of targeted degradation of iAβ. In practical terms, however, two candidates are of prime interest for this role. These two activities, both operating physiologically in neuronal cells, are actually the components of the two familiar actors in the AD play script: BACE1 and BACE2. Both activities are capable of multiple cleavages within iAβ (reviewed in [1, 4]), a capacity enhanced in BACE1 by the Icelandic AβPP mutation [86, 87] (explaining its protection from AD and AACD) and suppressed in BACE2 by the Flemish AβPP mutation [90] (explaining its causative role in FAD). Activators of physiologically occurring iAβ-cleaving capabilities of BACE1 and/or BACE2 could potentially constitute potent AD drugs [1, 4].
The effect of transient iAβ depletion treatment, either via the activation of BACE1 and/or BACE2 iAβ-cleaving activities or through the employment of any suitable iAβ-depleting agent, administered to an individual at various symptomatic stages of AD is illustrated diagrammatically in Fig. 14. In this figure, it is assumed that the transiently applied targeted iAβ degradation treatment (orange boxes) results in its nearly complete depletion and that the rate of accumulation of AβPP-derived iAβ remains linear and constant both prior to and following the active depletion treatment. Regardless of the stage of the disease, targeted degradation of iAβ results in a reset of its levels. Since these levels are now well below the T1 threshold, the operation of the AβPP-independent iAβ production pathway ceases and the de novo accumulation of iAβ resumes from low baselines, powered solely by the AβPP proteolysis and the associated iAβ influx mechanisms discussed above. Since the post-depletion treatment iAβ accumulation occurs at the same slow rate as prior to the depletion treatment, and provided the iAβ depletion is sufficiently “deep”, the AβPP-derived iAβ levels would not reach the T1 threshold and the disease would not recur within the remaining lifetime of an individual.
Fig. 14
Effect of transient active iAβ depletion via its targeted degradation implemented at various symptomatic stages of AD. Blue lines: Individual affected neurons. iAβ: Level of intraneuronal Aβ. T1 threshold: Levels of iAβ triggering, plausibly via activation of PKR and HRI kinases, elicitation of the ISR and initiation of AβPP-independent production of iAβ. T2 threshold: Levels of iAβ triggering neuronal commitment to apoptosis. Red block: Apoptotic zone. Orange boxes: Active transient iAβ depletion via its targeted degradation. Panel A: The transient iAβ depletion therapy via its targeted degradation is implemented at the early symptomatic stage of AD, when the bulk of the affected neurons are still viable. Following the reset of iAβ levels, their build-up starts de-novo supported only by the AβPP proteolytic pathway. It is anticipated that iAβ levels will not reach the T1 threshold and AD will not recur within the remaining lifetime of an SAD patient. Panels B, C, and D: The transient iAβ depletion via its targeted degradation is implemented at progressively advanced stages of AD. The results are analogous to those depicted in panel A. However, at this AD stages increasing number of affected neurons cross the T2 threshold and commit apoptosis. This leaves progressively smaller number of affected neurons that retained their viability and can be redeemed.
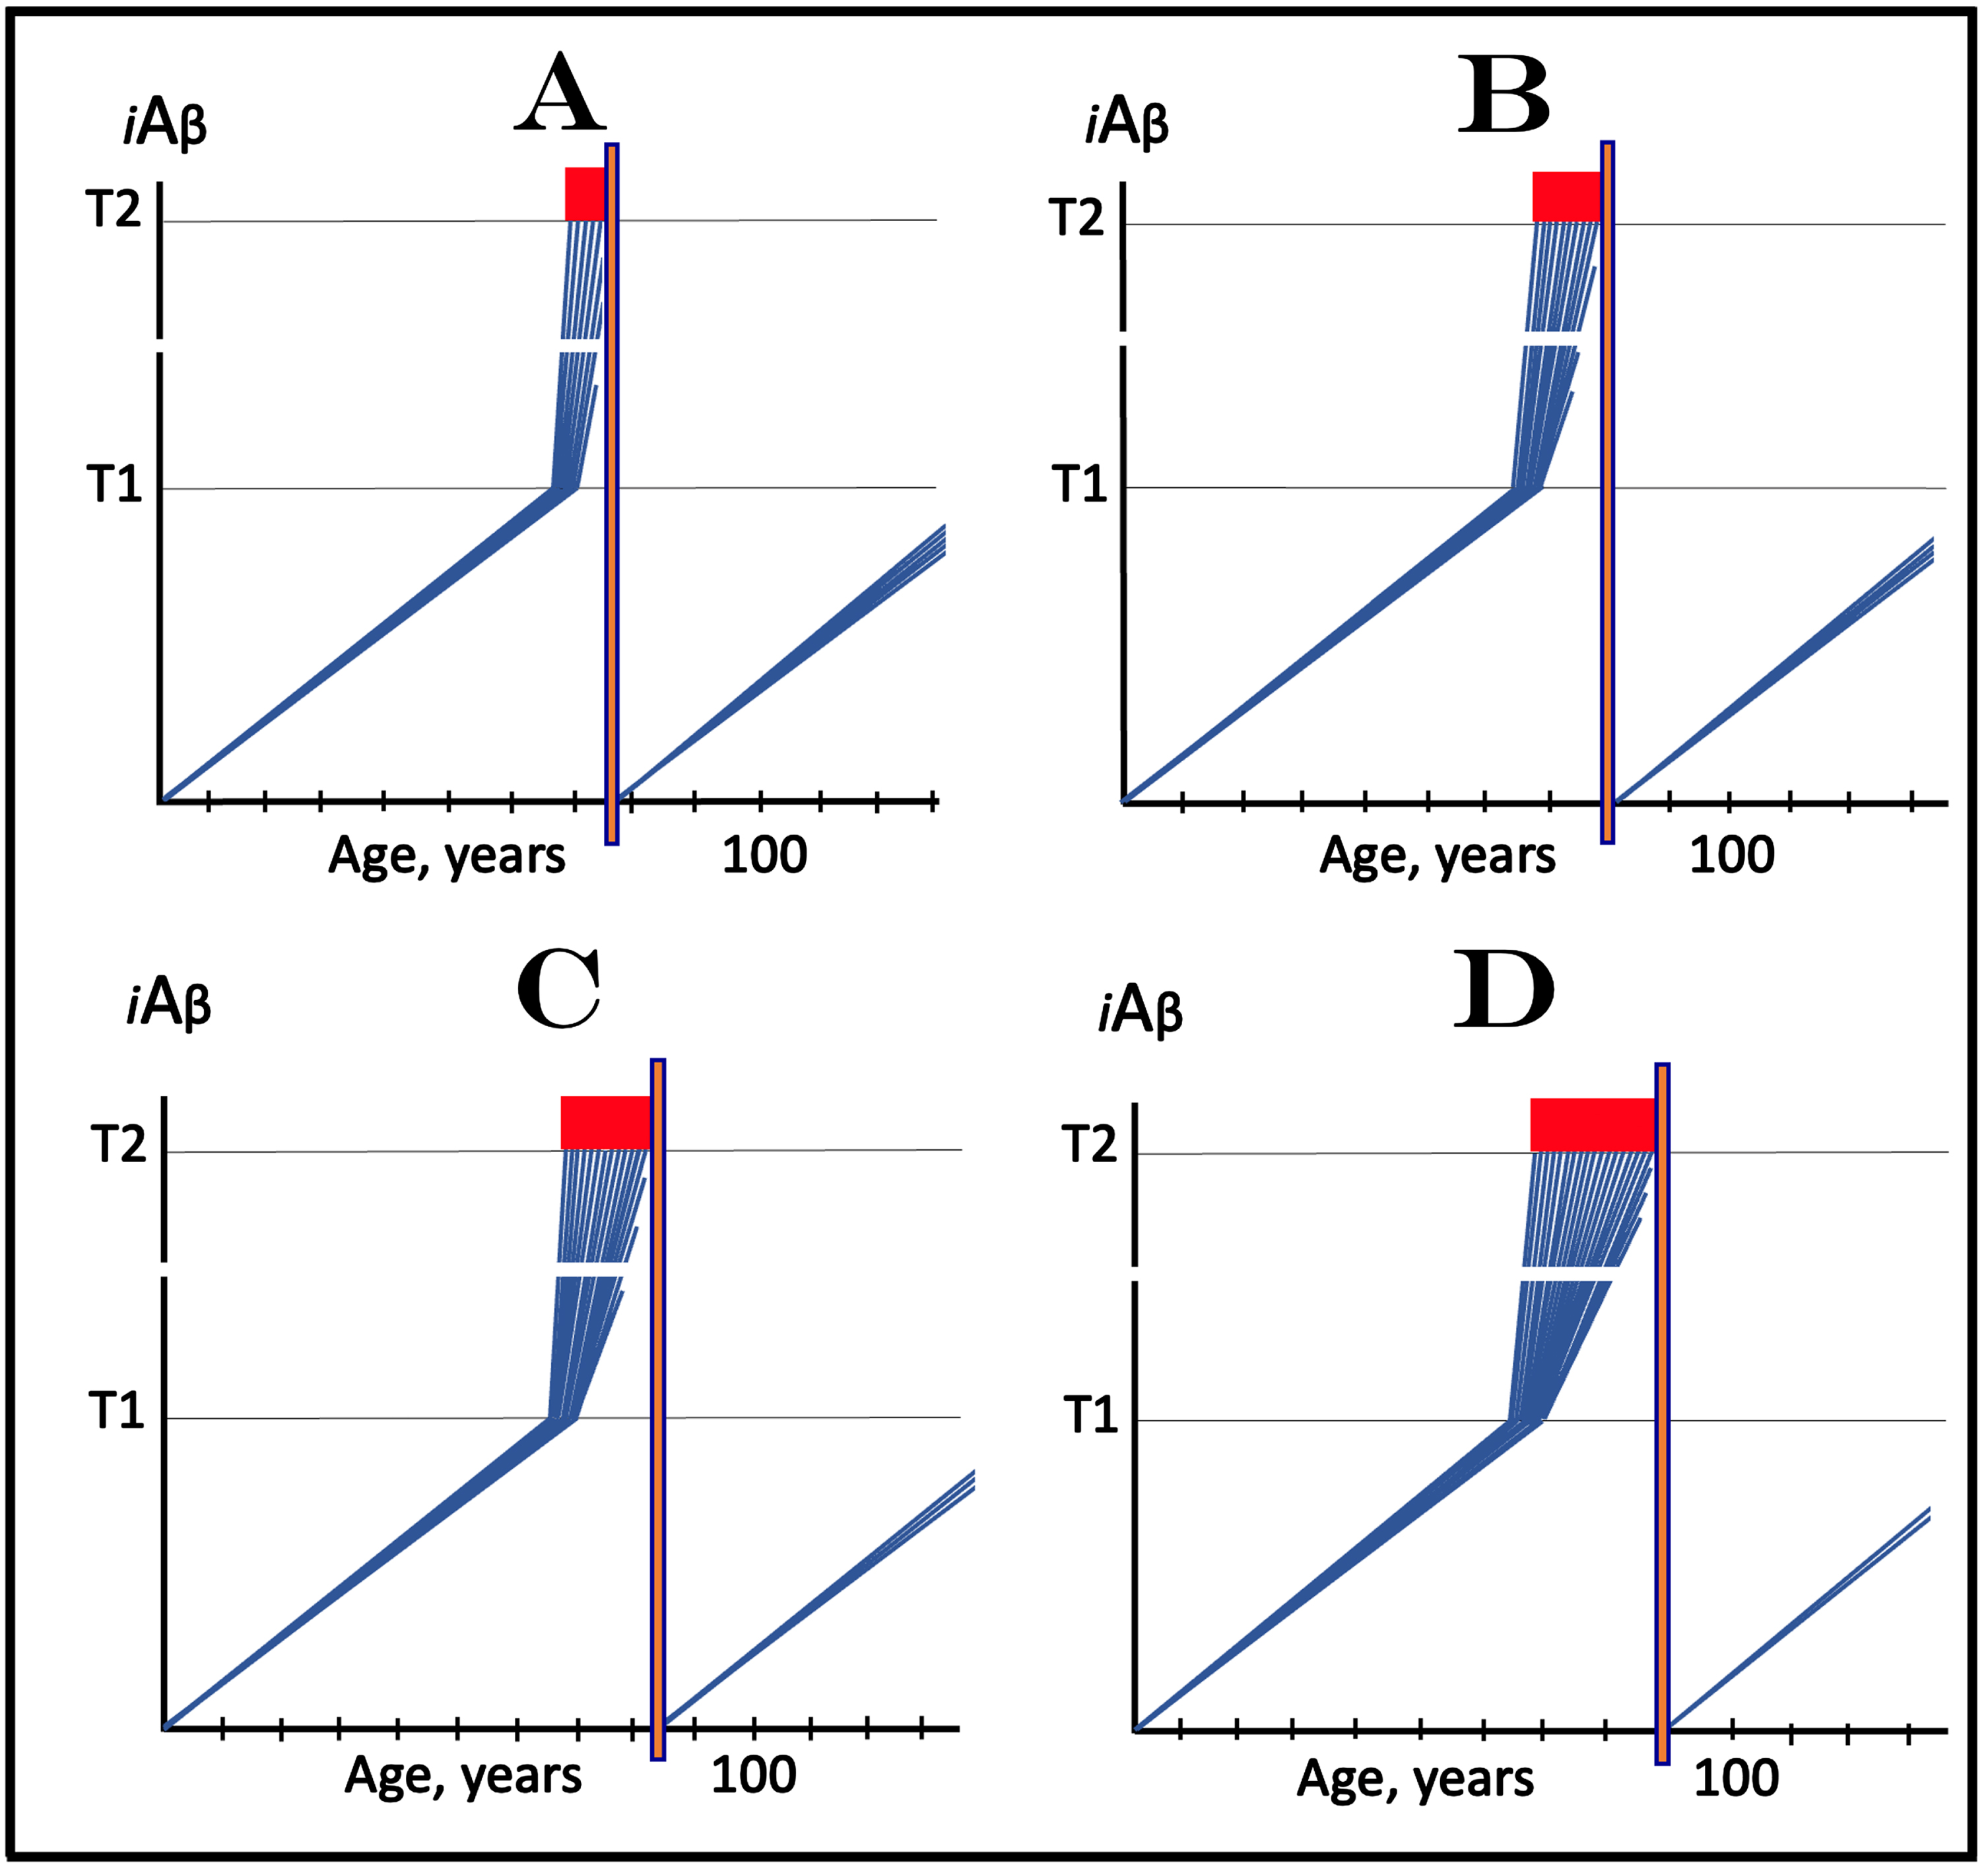
In Fig. 14A, the transient iAβ depletion treatment via its targeted degradation (orange box) is administered at the early symptomatic stage. All affected neurons of the patient have crossed the T1 threshold but only a small fraction entered the apoptotic zone (red block); the majority of affected neurons at this stage are still viable. Following the treatment, iAβ levels are reset, operation of the AβPP-independent iAβ generation pathway ceases, and the viable neurons are enabled to recover and reconnect. At this point, iAβ is generated only in the AβPP proteolytic pathway. Its accumulation resumes from a low baseline and, as shown in the figure, the duration of its buildup to the T1 threshold is likely to exceed the remaining lifetime of an individual; neither the T1 threshold would be crossed, nor AD recur. Following the treatment at the early symptomatic stage, it could be expected that the progression of AD would stop, the patient would stabilize and certain cognitive recovery would possibly occur.
As the disease progresses, more and more affected neurons cross the T2 threshold and commit apoptosis. This leaves progressively smaller numbers of still viable and redeemable neurons. This progression is shown in Fig. 14B-D. Transient active depletion of iAβ resets its levels and inactivates the operation of the AβPP-independent iAβ production pathway. However, the number of the affected neurons enabled to recover and restore their functionality is decreasing with the advancement of the disease. Following the treatment, it could be expected that the progression of the disease would be arrested but the restoration of cognitive functions would be increasingly unlikely at the advancing stages of AD.
CONCEPTS OF DESIGN AND OUTCOME OF CLINICAL TRIAL OF TRANSIENTLY APPLIED TARGETED iAβ DEGRADATION IN TREATMENT OF SYMPTOMATIC AD
Figure 15 considers the scenario of clinical trial of the transient active iAβ depletion (its targeted degradation) in treatment of symptomatic AD. The nature of a drug enacting the active iAβ depletion is not relevant for the purposes of this narrative. It could be the drug enhancing iAβ-cleaving activities of BACE1 and/or BACE2, or it could be any other agent suitable for the targeted degradation of iAβ. Figure 15A depicts the initial state of the iAβ levels in individual members of selected cohorts. In this scenario, the only selection criteria are the manifestation of AD symptoms. In all trial participants, AβPP-derived iAβ have crossed the T1 threshold. This crossing has activated the AβPP-independent iAβ production pathway; the levels of iAβ have rapidly increased, reached the Ts threshold and crossed into the Symptomatic Zone (pink field; it is shown disproportionally large in comparison with other figures because of its central role in the described process). The initial state, therefore, consists of AD patients presenting a wide spectrum of AD symptoms. The evolution of this initial state in untreated (placebo) cohort is trivial: in every patient the disease progresses toward and eventually reaches the end-stage (not shown in the figure).
Fig. 15
Design and outcome of clinical trial of transiently applied targeted iAβ degradation in treatment of symptomatic AD. iAβ: Level of intraneuronal Aβ. Blue lines: iAβ levels in individual trial participants. T1 threshold: Levels of iAβ triggering, plausibly via activation of PKR and HRI kinases, elicitation of the ISR and initiation of AβPP-independent production of iAβ. Ts threshold: Levels of iAβ triggering manifestation of AD symptoms. Pink fields: AD Symptomatic Zone. Orange box: Duration of the active transient iAβ depletion via its targeted degradation. Panel A: The initial state of the iAβ levels in individual members of selected cohorts; it consists of AD patients presenting a wide spectrum of AD symptoms. The evolution of this initial state in untreated (placebo) cohort (not shown) is trivial: in every patient the disease progresses toward the end-stage. Panel B: Evolution of the initial state following transiently implemented targeted degradation of iAβ. As the result, iAβ levels are completely or nearly completely depleted and operation of the AβPP-independent iAβ production pathway ceases. The de novo accumulation of iAβ, derived now only in the AβPP proteolytic pathway, resumes from a low baseline and proceeds at the slow rate. Its levels would not reach the T1 threshold and the disease would not recur within the remaining lifetime of individual patients. Note that any iAβ depletion below the T1 threshold would be beneficial since it would delay the re-entry into the second AD stage.
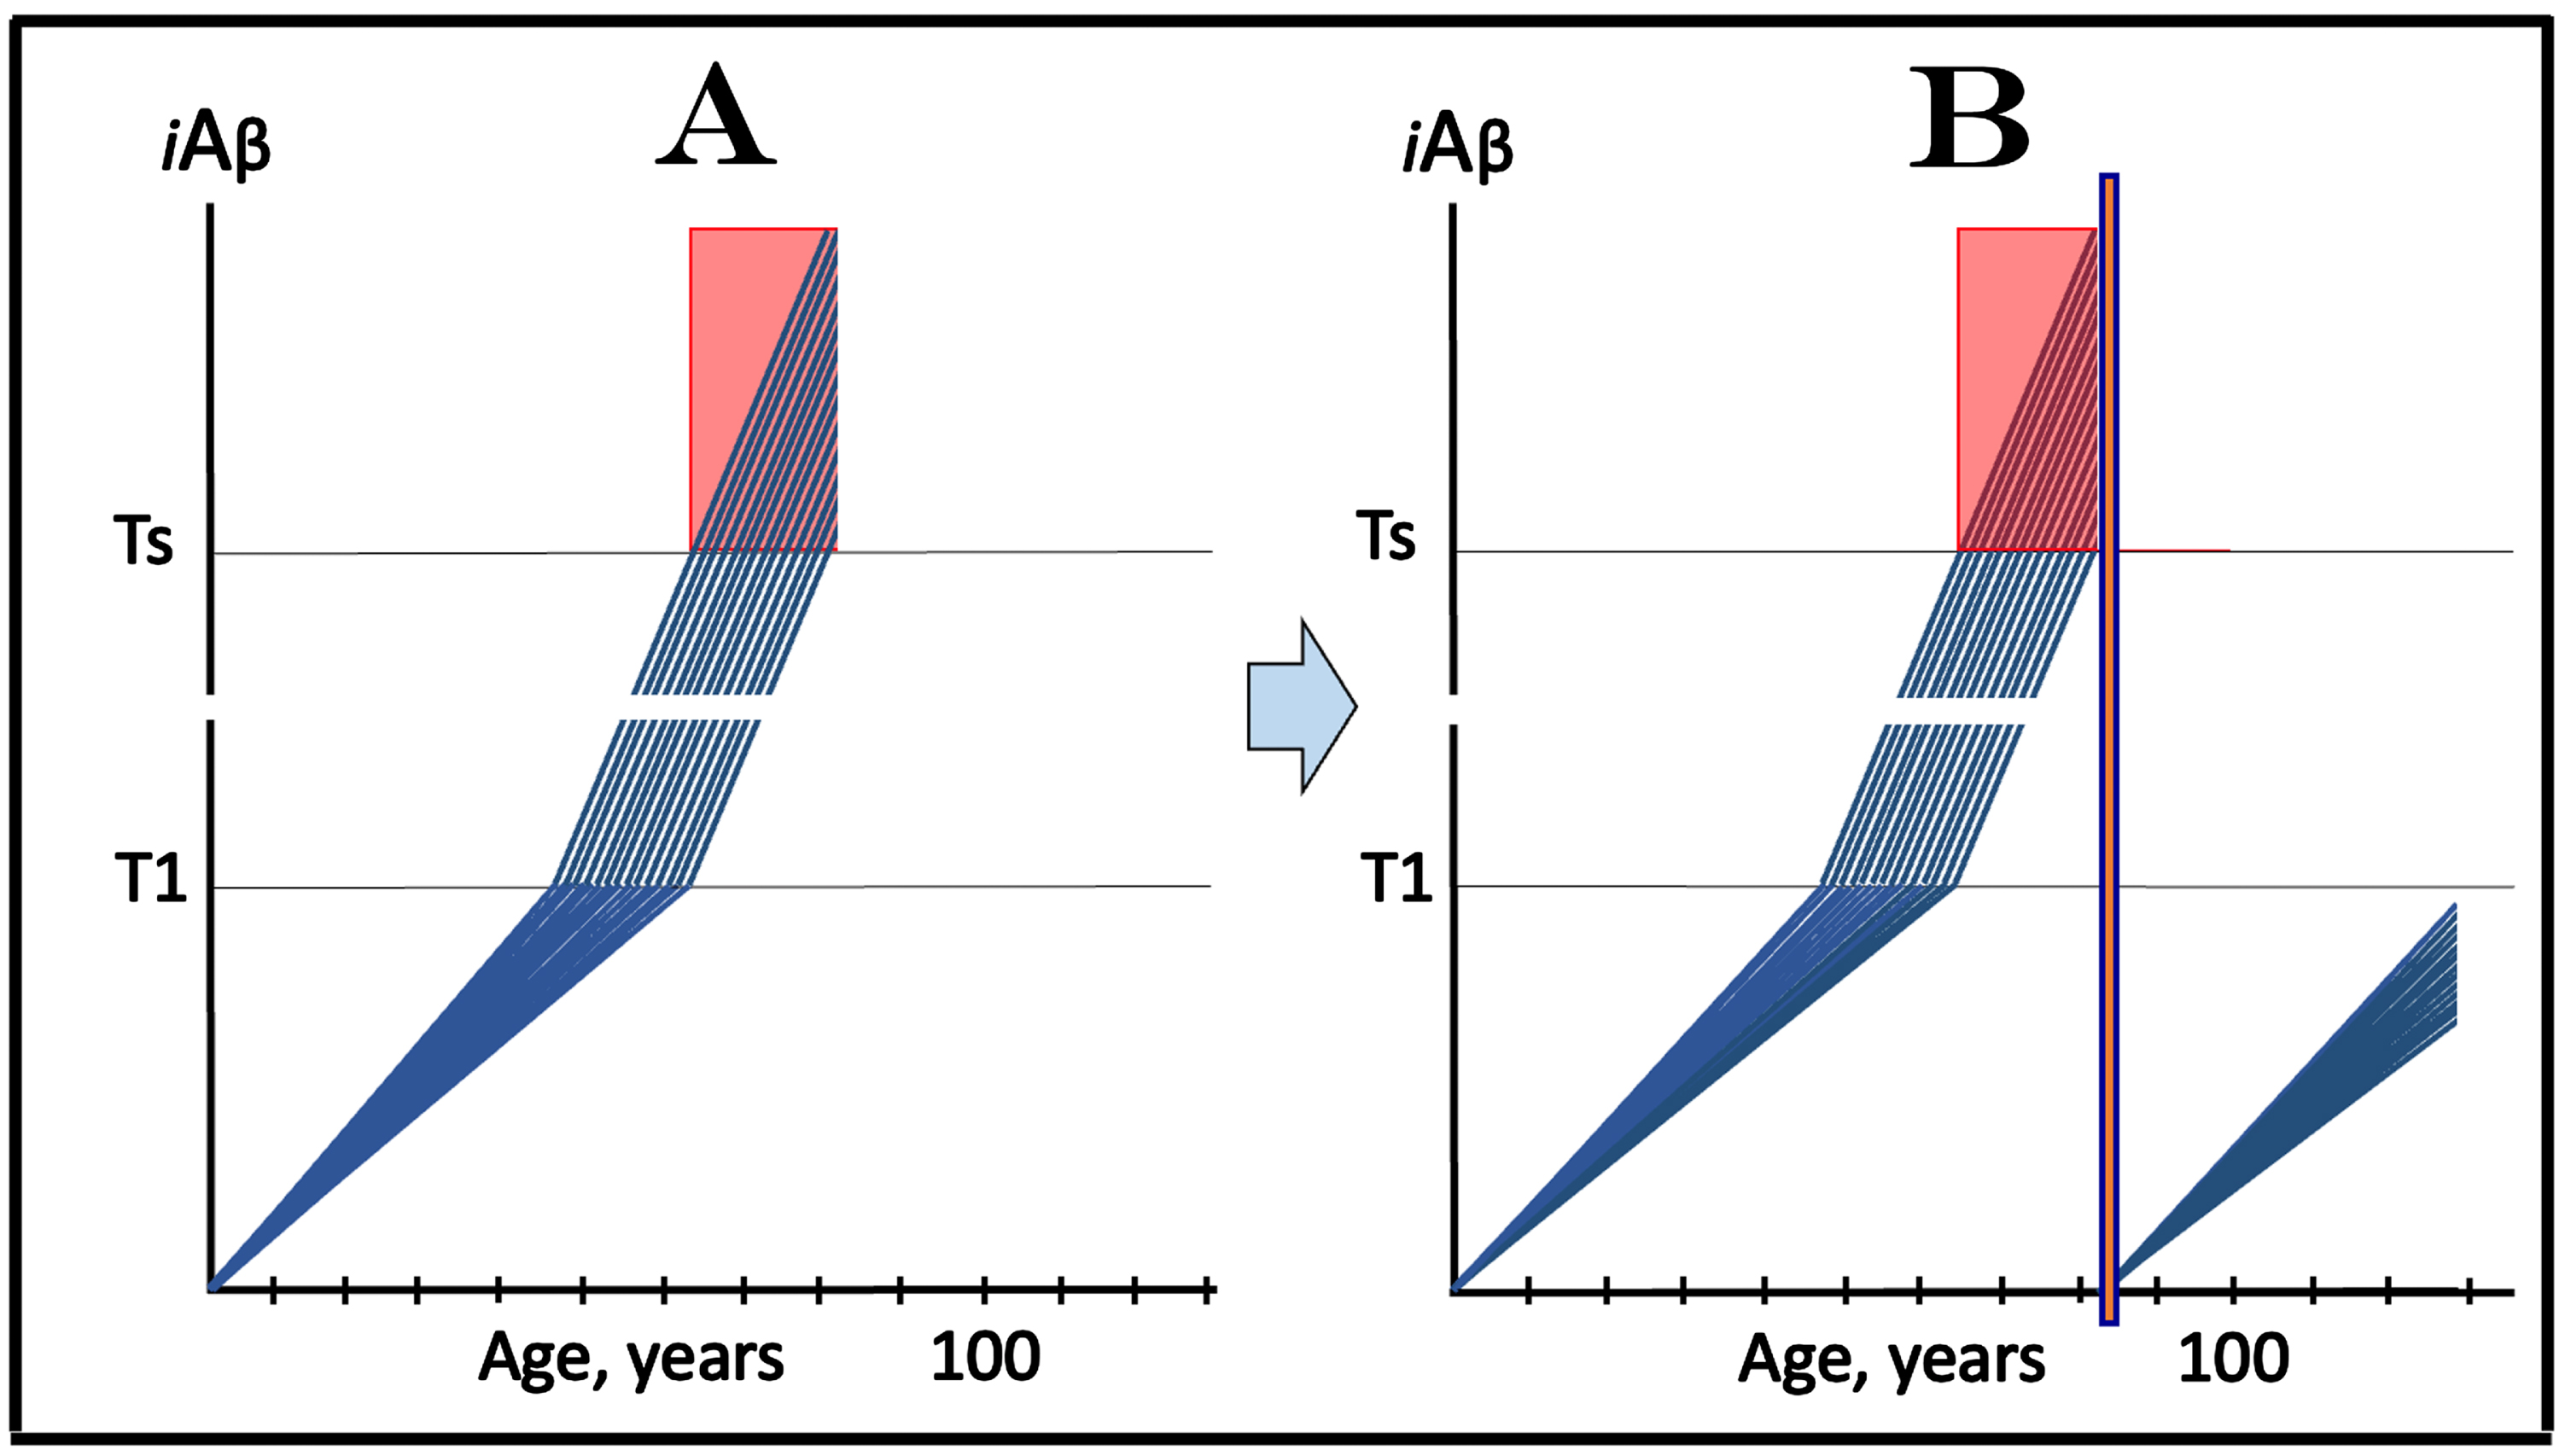
The evolution of the initial state following transiently implemented targeted degradation of iAβ (orange box) is shown in Fig. 15B. The active iAβ depletion treatment substantially reduces the iAβ levels (a complete or nearly complete iAβ depletion is shown). In every participant, the reset of iAβ levels switches off the AβPP-independent iAβ production pathway. The de novo accumulation of iAβ, derived now only in the AβPP proteolytic pathway, resumes from a low baseline and proceeds at the slow rate. Its levels would not reach the T1 threshold, and the disease would not recur within the remaining lifetime of individual patients. Individual prognoses are functions of the initial symptomatic stage when the treatment has been administered for every trial participant.
Some aspects of such trial could not be reflected in the figure and need to be commented upon. Because of the wide range of individual symptomatic stages in the initial state, the outcomes for individual trial participants would differ widely. In those in the early symptomatic stages, the majority of the affected neurons would be redeemed and enabled to recover and reconnect by the treatment. In these patients not only would the progression of the disease be arrested but also their cognitive functions are likely to improve following the active iAβ depletion treatment. In trial subjects at the advanced symptomatic stages, progressively smaller numbers of the affected neurons would remain viable and redeemable following the treatment; the progression of the disease would also be stopped but the improvement in cognitive functionality would be uncertain. It should also be mentioned that the active iAβ depletion via its targeted degradation could be a potent tool capable of very substantial iAβ depletion, sufficiently “deep” not to allow the recurrence of the disease within the lifetime of a patient. However, any depletion below the T1 threshold would be beneficial since it would delay the restoration of the AβPP-derived iAβ levels and the re-entry into the second AD stage; such scenario could require repeated rounds of the active iAβ depletion in order to prevent the recurrence of the disease.
CONCEPTS OF DESIGN AND OUTCOMES OF CLINICAL TRIALS OF TRANSIENTLY IMPLEMENTED TARGETED iAβ DEGRADATION IN PREVENTION OF AD
The great value of the active depletion of iAβ via its targeted degradation is its ability to intervene at the symptomatic stages of AD. Importantly, it is also capable of the prevention of AD. The present section discusses the utilization of the transiently applied targeted iAβ degradation in the AD-preventive capacity. As described below, conceptually it can do it in the same manner as proposed above for the transient passive depletion via the deployment of drugs targeting the influx of AβPP-derived iAβ (as shown in Fig. 12 above). But agents actively depleting iAβ through its targeted degradation can arguably do it more effectively. Significantly, they can also do it in a fashion that solves the complications with the presence of “over-T1” participants in clinical trials (described above), a feature, which is unavailable to drugs limited to the suppression of accumulation of AβPP-derived iAβ. Figure 16 illustrates both these capabilities of a drug actively depleting iAβ via its targeted degradation in clinical AD-preventive trials.
Fig. 16
Design and outcomes of clinical trials of transiently implemented targeted iAβ degradation in prevention of AD. iAβ: Level of intraneuronal Aβ. Blue lines: iAβ levels in individual trial participants. T1 threshold: Levels of iAβ triggering, plausibly via activation of PKR and HRI kinases, elicitation of the ISR and initiation of AβPP-independent production of iAβ. Ts threshold: Levels of iAβ triggering manifestation of AD symptoms. Orange boxes: Duration of the active transient iAβ depletion via its targeted degradation. Panels A and B: Effect of transient iAβ depletion via its targeted degradation in trials with all participants at sub-T1 levels of iAβ. Panel A: The initial state of iAβ levels in individual trial subjects. The evolution of this initial state (not shown) is identical to that depicted in Fig. 5B. Panel B: Evolution of the initial state following transient active depletion of iAβ via its targeted degradation. Levels of AβPP-derived iAβ in individual trial participants substantially decrease and its accumulation commences de novo from low baselines. Neither T1 threshold is crossed nor AD occurs within the lifespans of the trial participants. Panels C and D: Effect of transient iAβ depletion via its targeted degradation in trials with a fraction of participants at over-T1 levels of iAβ. Panel C: The initial state of iAβ levels in individual trial subjects. The evolution of this initial state (not shown) is identical to that depicted in Fig. 6B. Panel D: Evolution of the initial state following transient active depletion of iAβ via its targeted degradation. The levels of iAβ are substantially depleted in ALL trial participants including the initial over-T1 fraction. The operation of the AβPP-independent iAβ production pathway ceases and the de novo accumulation of iAβ, generated now solely in the AβPP proteolytic pathway, commences from low baselines in ALL trial subjects. Neither the T1 threshold is reached nor AD occurs within the remaining lifetime of individual trial subjects.
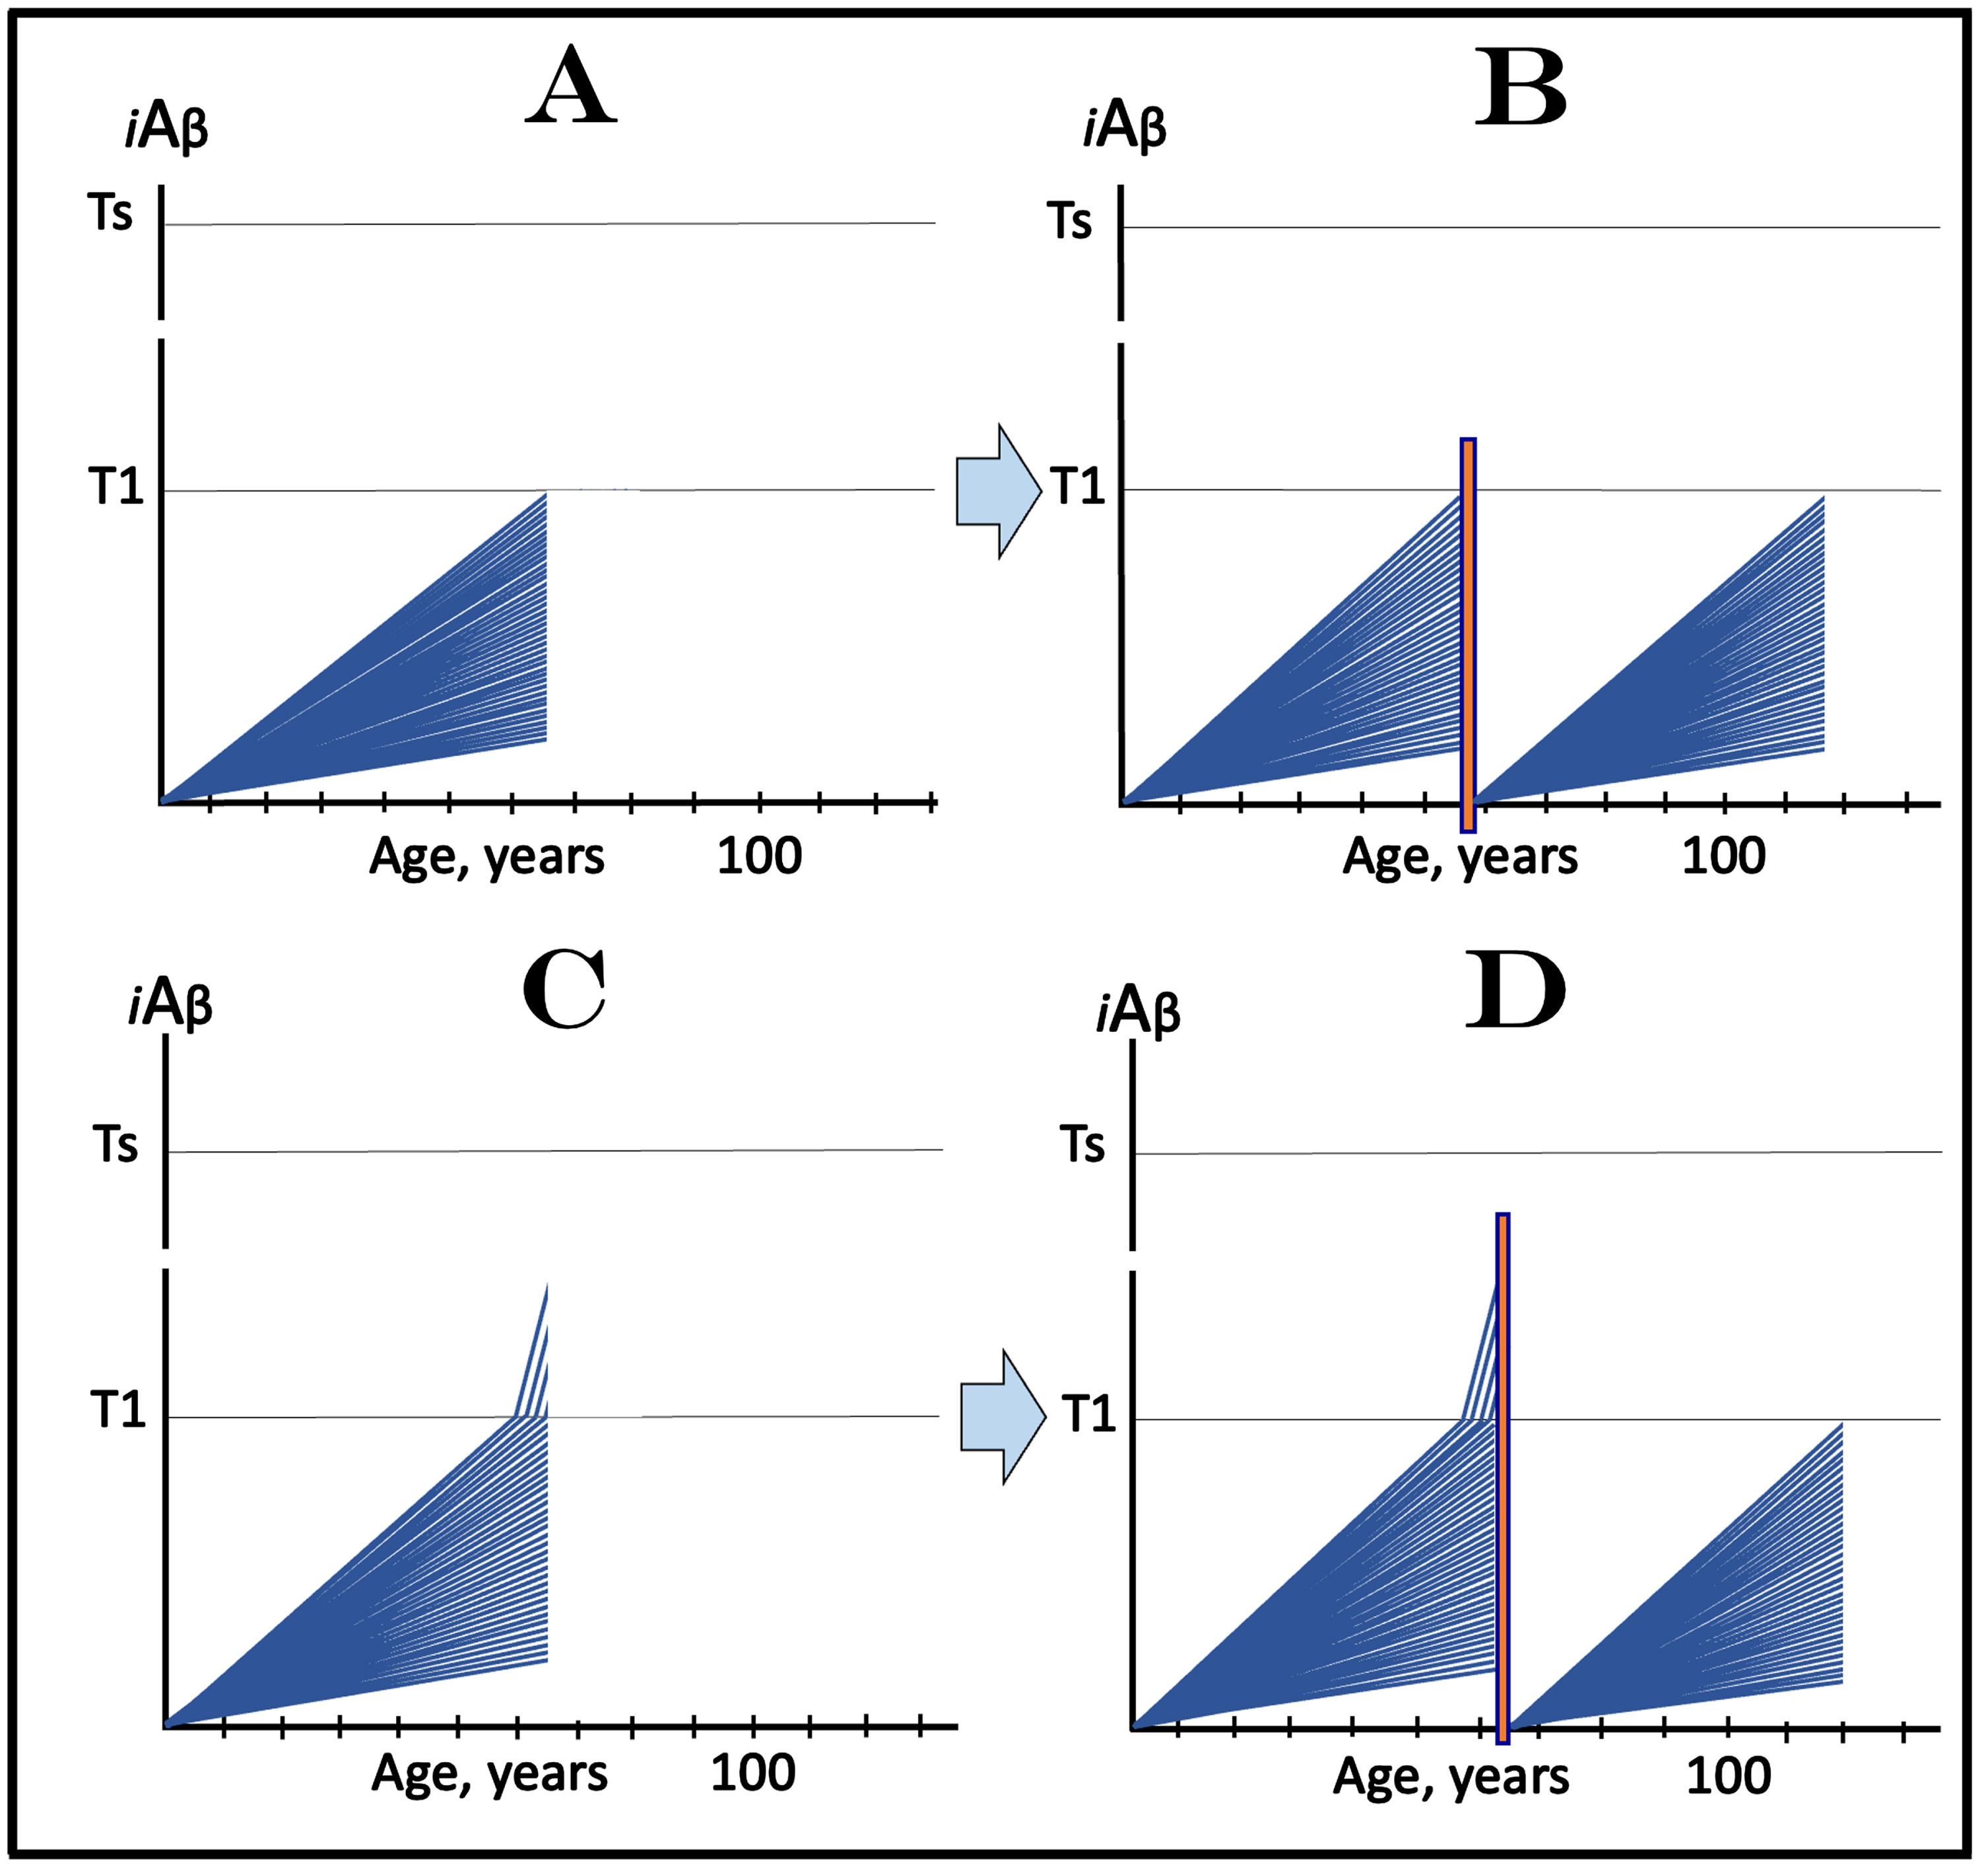
Figure 16A and 16B show the effect of a drug actively depleting iAβ in AD-preventive clinical trial with all participants at the sub-T1 levels of iAβ. Figure 16A depicts the initial state of iAβ levels in individual trial subjects. Not only are all participants asymptomatic, but their iAβ levels have not yet reached the T1 threshold. The evolution of this initial state in placebo group (not shown in this figure) is identical to that shown in Fig. 5B. Briefly, in the majority of participants, AβPP-derived iAβ levels do not cross the T1 threshold within their lifetimes. In those where this crossing occurs, the AβPP-independent pathway of iAβ production is activated, its levels rapidly increase, reach the Ts threshold, cross into the Symptomatic Zone (pink field), and AD symptoms manifest.
Figure 16B shows the evolution of the initial state following transient active depletion of iAβ via its targeted degradation (orange box). Levels of AβPP-derived iAβ in individual trial participants substantially decrease and its accumulation commences de novo from low baselines. Neither T1 threshold is crossed nor AD occurs within the lifespans of the trial participants. Essentially the same result is achieved in Fig. 12B where a drug targeting the influx of AβPP-derived iAβ was transiently deployed. The transient targeted degradation of iAβ is potentially more effective, resulting in much more substantial (“deeper”) iAβ depletion but conceptually the results with both types of drugs are identical.
The outcomes achieved with the above two types of drugs are drastically different in clinical trials of transient deployment of iAβ-depleting agents in prevention of AD, with a fraction of subjects at over-T1 iAβ levels. For drugs actively depleting iAβ via its targeted degradation, this scenario is depicted in Fig. 16C and 16D. Figure 16C shows the initial state of the iAβ levels in individual trial subjects. In the members of the initial over-T1 fraction, the iAβ levels have crossed the T1 threshold and activated the AβPP-independent iAβ production pathway. The iAβ levels have rapidly increased but have not yet reached the Ts threshold; these trial subjects remain asymptomatic for AD. In the rest of the trial participants the iAβ levels have neither reached nor crossed the T1 threshold. The evolution of this initial state in the placebo group (not shown in this figure) is identical to that shown in Fig. 6B. Members of the initial over-T1 fraction cross the Ts threshold and are thus rendered symptomatic, In a fraction of the initially sub-T1 trial subjects AβPP-derived iAβ levels cross the T1 threshold, the AβPP-independent iAβ production pathway is activated, the Ts threshold is reached and AD symptoms manifest.
The evolution of the initial state following transient active depletion of iAβ via its targeted degradation (orange box) is shown in the Fig. 16D. The levels of iAβ are substantially depleted in all trial participants. No exception is made for the initial over-T1 fraction: total iAβ is depleted there as well, and the operation of the AβPP-independent iAβ production pathway ceases. The de novo accumulation of iAβ, generated now solely in the AβPP proteolytic pathway, commences from low baselines in all trial subjects. As shown in the figure, neither the T1 threshold is reached within the remaining lifetime of individual trial subjects, nor AD occurs.
It should be emphasized that the above outcome obtained with the transient targeted degradation of iAβ (Fig. 16D) is both conceptually and practically different from that potentially achieved by transient deployment of a drug targeting the influx of AβPP-derived iAβ (Fig. 12D). To prevent symptomatic AD, the latter must be administered prior to the crossing of the T1 threshold whereas the former can be deployed any time prior to the manifestation of AD symptoms.
CONCEPTS OF DESIGN AND OUTCOMES OF CLINICAL TRIALS OF TRANSIENTLY DEPLOYED TARGETED iAβ DEGRADATION IN TREATMENT OF AACD
The same basic principle, formulated above, applies also to treatment of AACD: To successfully treat AACD, the active transient depletion of iAβ via its targeted degradation can be implemented any time prior to manifestation of AD symptoms (in contrast to drugs targeting the influx of AβPP-derived iAβ that must be deployed prior to the crossing of the T1 threshold). This notion is illustrated in Fig. 17, which depicts two versions of clinical trials evaluating the effect of transient active depletion of iAβ via its targeted degradation in treatment of AACD. Figure 17A and 17B portray the scenario where all participants of the trial have iAβ levels below the T1 threshold. Figure 17A shows the initial state of the iAβ levels in individual trial participants. In all subjects, AβPP-derived iAβ levels have reached the T0 threshold and crossed into the AACD Zone (gradient-pink box). All trial participants are symptomatic for AACD; none has AD symptoms.
Fig. 17
Design and outcomes of clinical trials of transiently implemented targeted iAβ degradation in treatment of AACD. iAβ: Level of intraneuronal Aβ. Blue lines: Levels of iAβ in individual trial participants. Threshold T0: iAβ levels that trigger neuronal damage manifesting as AACD. Threshold T1: The level of AβPP-derived iAβ that triggers cellular processes resulting in the activation of the AβPP-independent generation of iAβ and the commencement of the second AD stage. Ts threshold: Levels of iAβ triggering the manifestation of AD symptoms. Pink fields: AD Symptomatic Zone. Gradient-pink boxes: “AACD Zone”, the continuum of AβPP-derived iAβ levels between T0 and T1 thresholds. Orange boxes: Duration of the active transient iAβ depletion via its targeted degradation. Panels A and B: Effect of transient iAβ depletion via its targeted degradation in trials with all participants at sub-T1 levels of iAβ. Panel A: The initial state of iAβ levels in individual trial subjects. The evolution of this initial state (not shown) is identical to that depicted in Fig. 9B. Panel B: Evolution of the initial state following transient active depletion of iAβ via its targeted degradation. Levels of AβPP-derived iAβ in individual trial participants substantially decrease and its accumulation commences de novo from low baselines in the AβPP proteolytic pathway. Neither T0 threshold is crossed nor AACD occurs within the lifespans of the trial participants. Panels C and D: Effect of transient iAβ depletion via its targeted degradation in trials with a fraction of participants at over-T1 levels of iAβ. Panel C: The initial state of iAβ levels in individual trial subjects. The evolution of this initial state (not shown) is identical to that depicted in Fig. 10B. Panel D: Evolution of the initial state following transient active depletion of iAβ via its targeted degradation. The levels of iAβ are substantially depleted in ALL trial participants including the initial over-T1 fraction. The operation of the AβPP-independent iAβ production pathway ceases and the de novo accumulation of iAβ, generated now solely in the AβPP proteolytic pathway, commences from low baselines in ALL trial subjects. Neither the T0 threshold is reached nor AACD occurs within the remaining lifetime of individual trial subjects.
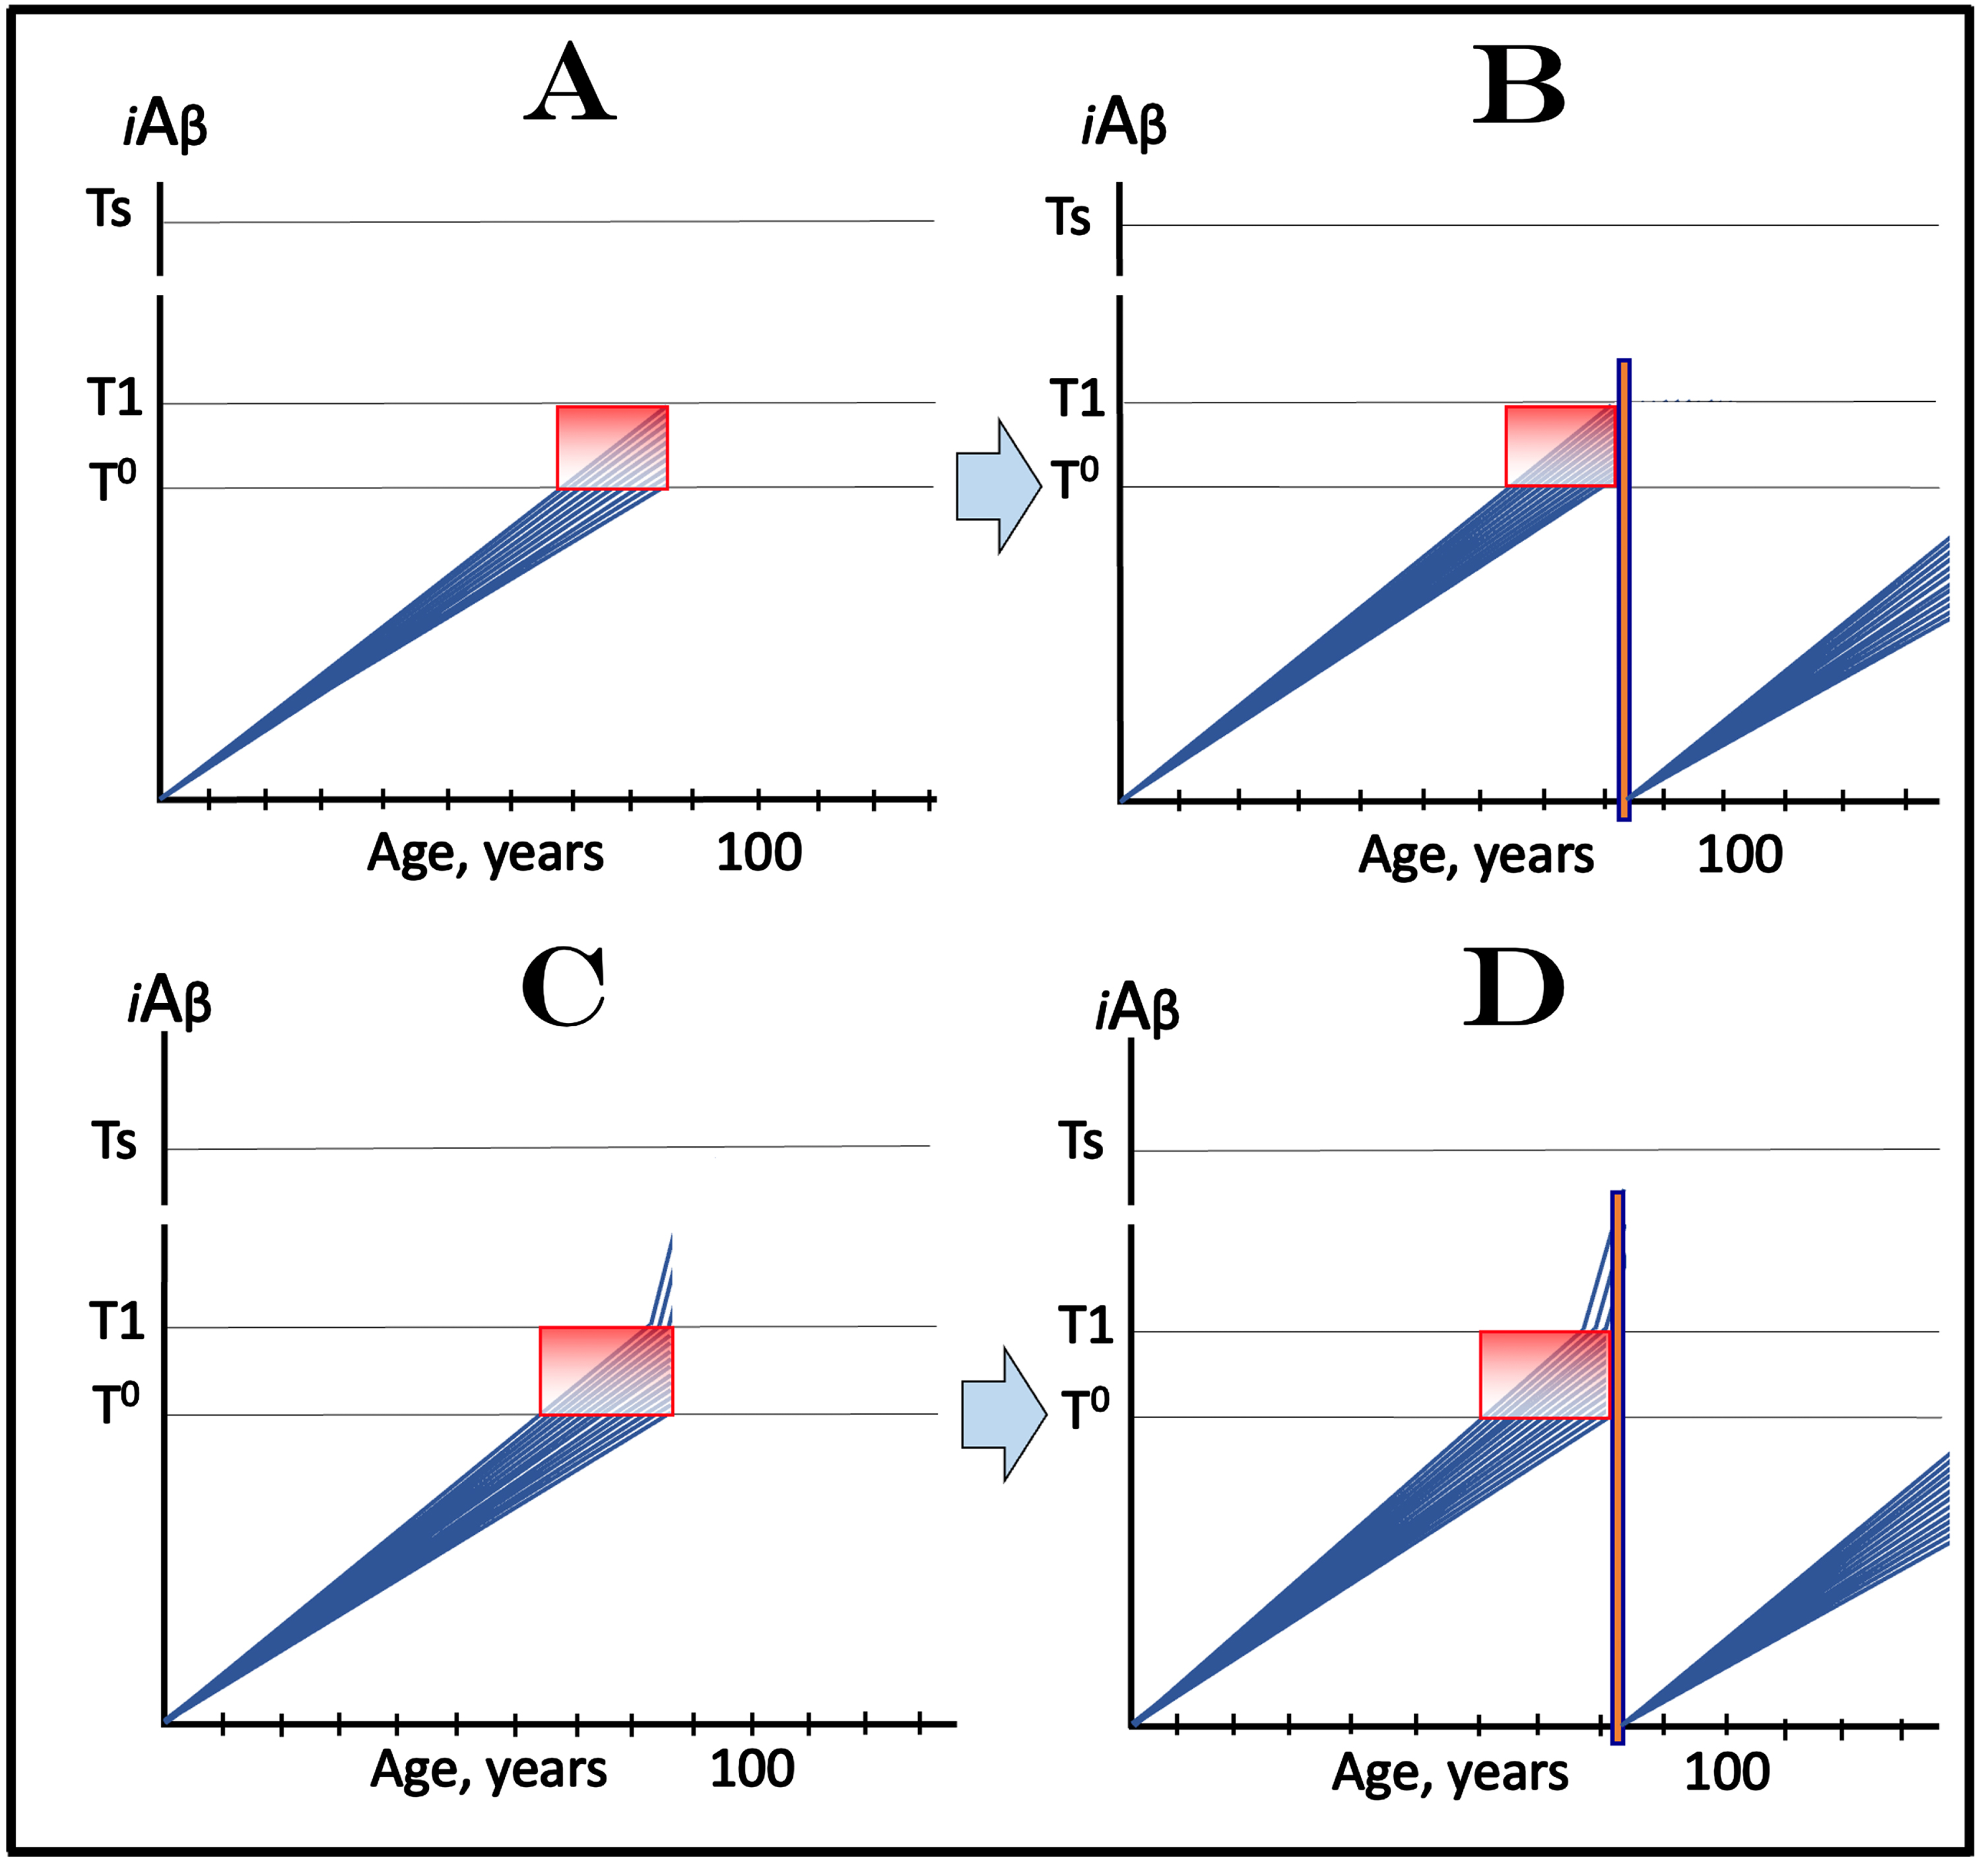
The evolution of the initial state in placebo cohort (not shown in this figure) is identical to that depicted in Fig. 9B. Levels of AβPP-derived iAβ rise in all trial subjects. Provided the lifespans of the trial subjects are sufficiently long, these levels would cross the T1 threshold, activate the AβPP-independent iAβ production pathway, increase rapidly, reach the Ts threshold, cross into the AD Symptomatic Zone, and AD symptoms would manifest. The evolution of the initial state following the transient active depletion of iAβ via its targeted degradation is shown in Fig. 17B. Levels of total iAβ are substantially depleted. Operation of the AβPP-independent iAβ generation pathway stops. The accumulation of iAβ, produced only in the AβPP proteolytic pathway, resumes from low baselines. Its levels do not reach the T1 threshold in individual trial participants within the remaining portions of their lifespans. AACD does not recur; the patients are technically cured. Conceptually this outcome is no different from that shown in Fig. 13B where drugs reducing the influx of AβPP-derived iAβ were employed.
These two types of iAβ depleting agents, however, yield distinctly different outcomes in trials involving cohorts that include participants with over-T1 iAβ levels. Such scenario of clinical trial of the effect of transiently implemented targeted degradation of iAβ in treatment of AACD is considered in Fig. 17C and 17D. Figure 17C depicts the initial state of iAβ levels in individual trial participants. In all participants these levels have crossed the T0 threshold and entered the AACD Zone (gradient-pink box). With the exception of the initial over-T1 fraction, no trial subjects have crossed the T1 threshold. On the other hand, in the initial over-T1 fraction, AβPP-derived iAβ levels have crossed the T1 threshold and activated the AβPP-independent iAβ production pathway; its levels are rapidly increasing but have not yet reached the Ts threshold. The evolution of this initial state in the placebo group (not shown in this figure) is identical to that depicted in Fig. 10B. In addition to the initial over-T1 fraction, AβPP-derived iAβ levels cross the T1 threshold in all trial subjects. Levels of iAβ, produced now predominantly in the AβPP-independent pathway, rapidly increase, cross the Ts threshold, enter the AD Symptomatic Zone, and AD symptoms manifest.
Figure 17D shows the evolution of the initial state following transient deployment of the drug capable of the targeted degradation of total iAβ. The iAβ levels are substantially depleted and the operation of the AβPP-independent iAβ production pathway ceases in all trial subjects, including members of the initial ober-T1 fraction. The de novo accumulation of iAβ, produced now only in the AβPP proteolytic pathway, resumes from low baselines. Its levels do not reach the T0 threshold within trial participants’ lifespans and AACD does not recur; these AACD patients are technically cured. Importantly, this outcome is drastically different, both conceptually and practically, from the outcome achieved with a drug targeting the influx of AβPP-derived iAβ. Whereas the latter would be effective in treatment of AACD only if administered prior to the T1 crossing, the targeted degradation of total iAβ would be efficient in treating and, possibly, curing AACD if implemented any time prior to the occurrence of symptoms of AD.
CONCLUSION
The present study considers concepts of design and potential outcomes of clinical trials of two types of AD/AACD drugs. The first type, represented by lecanemab and donanemab, includes agents that target one or both components of the influx of iAβ produced in the AβPP proteolytic pathway: its intraneuronal retention and/or internalization of extracellular Aβ. By doing this, they suppress the rate of accumulation of AβPP-derived iAβ and either delay or prevent it from reaching the T1 threshold and activating the second stage of AD. In the framework of the ACH2.0, these drugs are completely inefficient in symptomatic AD, which is driven by iAβ generated in the AβPP-independent pathway, which is insensitive to this type of drugs. Importantly, the loss of efficiency of these drugs occurs well before symptomatic manifestation of AD; they become ineffective with the activation of the AβPP-independent iAβ production pathway, which occurs when AβPP-derived iAβ reaches and crosses the T1 threshold, thus commencing the second AD stage. Although inefficient in the second stage of AD, within the framework of the ACH2.0, the type One drugs should be effective in prevention of AD and treatment of AACD. The design of AD-preventive clinical trial utilizing this type of drugs is challenging. It is given that the subjects of such clinical trial should be asymptomatic. However, if they are of age close to or over the statistical age of the SAD onset, and, moreover, if criteria, such as increased load of Aβ plaques [81] or the occurrence of phosphorylated tau in blood samples [86, 89], are employed to select high-risk trial participants close to symptomatic manifestation of AD (thus accelerating the trial), and because it is currently impossible to detect the crossing of the T1 threshold by iAβ in human subjects, the selected cohorts would inevitably include a significant, possibly major, fraction of trial subjects who are, although asymptomatic, yet with iAβ levels over the T1 threshold and thus unresponsive to the drug. As the result, outcomes in the medicated cohort, if judged by criteria that include cognitive fitness, could be grossly distorting and misleading, and similar to those seen in placebo groups for a substantial duration, possibly years, before diverging drastically. An alternative approach, with ages of participants well in advance to the statistical age of the onset of AD, is practically not feasible due to the anticipated duration (probably over a decade) of such trials.
Because AACD is driven by AβPP-derived iAβ, the type One drugs, which reduce its influx and suppress its accumulation, should be effective in the treatment of the condition. The inclusion of subjects with iAβ levels over the T1 threshold in the AACD clinical trial would be as problematic as in the AD-preventive trial. In the case of AACD (but not of AD), however, this situation is easily avoidable. AACD-susceptible individuals have, by definition, a high T1 threshold level. Therefore, if the criteria for selection of trial subjects are strictly the early stages of AACD, the presence of the over-T1 individuals in selected cohort would be highly unlikely. In such a case, AACD clinical trials are expected to yield meaningful and unequivocal results within a short duration. Therefore, the type One drugs should be first tested in clinical trials for their effect in treatment of AACD. Success of such trials would have its intrinsic value and provide much needed tools to address the condition. It would, moreover, constitute a proof of concept of and provide strong indication for potential efficiency of the drug in prevention of AD.
The, arguably, ultimate goal, namely the ability to interfere with AD at its symptomatic stages, requires the inactivation of the AD Engine that drives the second stage of the disease. This is what the type Two of AD/AACD drugs is capable of via targeted degradation of iAβ and its depletion to levels below those required for maintaining the activity of the AβPP-independent iAβ production pathway and thus for perpetuating the operation of the AD Engine; when the latter stops, the progression of the disease ceases. Moreover, the drugs of the type Two are capable of effectively treating AACD and preventing AD if deployed prior to the symptomatic manifestation of the disease. Importantly, because they deplete total iAβ rather than only AβPP-derived iAβ, they do it regardless whether or not the T1 threshold has been crossed. Furthermore, if the targeted degradation of iAβ is implemented transiently and results in its sufficiently substantial (“deep”) depletion, its accumulation resumes from a low baseline and may not reach the T1 threshold within the remaining lifetime of an individual. Thus, remarkably, a single, once in a lifetime, iAβ depletion treatment via its targeted degradation may conceivably prevent AD, cure AACD and treat AD at its symptomatic stage. The present study analyses concepts of design of clinical studies utilizing this type of drugs. In this case, the design of clinical trials for both prevention and treatment of AD and AACD is straightforward; the duration of trials is relatively short, and the expected outcomes are definitive and unambiguous. Potentially, any agent capable of targeted degradation of iAβ can serve as such drug. Of prime interest, however, are two activities, both operating physiologically in neuronal cells. One is, in fact, a component of BACE1 and another a constituent of BACE2 (reviewed in [1]). Both are capable of multiple cleavages within iAβ, a capacity enhanced in BACE1 by the Icelandic AβPP mutation [82, 83], thus explaining its protection from AD and AACD, and suppressed in BACE2 by the Flemish AβPP mutation [84], explaining its causative role in FAD. Activators of these physiologically occurring iAβ-cleaving capabilities of BACE1 and/or BACE2 could potentially constitute potent AD and AACD drugs.
ACKNOWLEDGMENTS
Authors are grateful to Bjorn R. Olsen (Harvard Medical School) for his support and to Michael J. Foley and his associates for the logistical support.
FUNDING
This work is supported by NIH R21 GM056179 and NIH R01 AR036819.
CONFLICT OF INTEREST
The authors have no conflict of interest to report.
REFERENCES
[1] | Volloch V , Rits-Volloch S ((2022) ) The Amyloid Cascade Hypothesis 2.0: On the possibility of once-in-a-lifetime-only treatment for prevention of Alzheimer’s disease and for Its potential cure at symptomatic stages. J Alzheimers Dis Reps 6: , 369–399. |
[2] | Volloch V , Rits-Volloch S ((2023) ) The Amyloid Cascade Hypothesis 2.0: Generalization of the concept. J Alzheimers Dis Rep 7: , 21–35. |
[3] | Volloch V , Rits-Volloch S ((2023) ) Effect of lecanemab and donanemab in early Alzheimer’s disease: Mechanistic interpretation in the Amyloid Cascade Hypothesis 2.0 perspective. J Alzheimers Dis 93: , 1277–1284. |
[4] | Volloch V , Rits-Volloch S ((2023) ) The Amyloid Cascade Hypothesis 2.0 for Alzheimer’s disease and aging-associated cognitive decline: From molecular basis to effective therapy. Int J Mol Sci 24: , 12246. |
[5] | Casas C , Sergeant N , Itier JM , Blanchard V , Wirths O , van der Kolk N , Vingtdeux V , van de Steeg E , Ret G , Canton T , Drobecq H , Clark A , Bonici B , Delacourte A , Benavides J , Schmitz C , Tremp G , Bayer TA , Benoit P , Pradier L ((2004) ) Massive CA1/2 neuronal loss with intraneuronal and N-terminal truncated Abeta42 accumulation in a novel Alzheimer transgenic model. Am J Pathol 165: , 1289–1300. |
[6] | Bayer TA , Wirths O ((2008) ) Review on the APP/PS1KI mouse model: Intraneuronal Abeta accumulation triggers axonopathy, neuron loss and working memory impairment. Genes Brain Behav 7: (Suppl 1), 6–11. |
[7] | Bayer TA , Breyhan H , Duan K , Rettig J , Wirths O ((2008) ) Intraneuronal beta-amyloid is a major risk factor–novel evidence from the APP/PS1KI mouse model. Neurodegener Dis 5: , 140–142. |
[8] | Wirths O , Breyhan H , Cynis H , Schilling S , Demuth HU , Bayer TA ((2009) ) Intraneuronal pyroglutamate-Aβ 3-42 triggers neurodegeneration and lethal neurological deficits in a transgenic mouse model. Acta Neuropathol 118: , 487–496. |
[9] | Christensen DZ , Bayer TA , Wirths O ((2010) ) Intracellular Aβ triggers neuron loss in the cholinergic system of the APP/PS1KI mouse model of Alzheimer’s disease. Neurobiol Aging 31: , 1153–1163. |
[10] | Christensen DZ , Schneider-Axmann T , Lucassen PJ , Bayer TA , Wirths O ((2010) ) Accumulation of intraneuronal Aβ correlates with ApoE4 genotype. Acta Neuropathol 119: , 555–566. |
[11] | Bayer TA , Wirths O ((2010) ) Intracellular accumulation of amyloid-beta - a predictor for synaptic dysfunction and neuron loss in Alzheimer’s disease. Front Aging Neurosci 2: , 8. |
[12] | Bayer TA , Wirths O ((2011) ) Intraneuronal Aβ as a trigger for neuron loss: Can this be translated into human pathology? Biochem Soc Trans 39: , 857–861. |
[13] | Wirths O , Bayer TA ((2012) ) Intraneuronal Aβ accumulation and neurodegeneration: Lessons from transgenic models. Life Sci 91: , 1148–1152. |
[14] | Kumar S , Wirths O , Theil S , Gerth J , Bayer TA , Walter J ((2013) ) Early intraneuronal accumulation and increased aggregation of phosphorylated Abeta in a mouse model of Alzheimer’s disease. Acta Neuropathol 125: , 699–709. |
[15] | Ripoli C , Cocco S , Li Puma DD , Piacentini R , Mastrodonato A , Scala F , Puzzo D , D’Ascenzo M , Grassi C ((2014) ) Intracellular accumulation of amyloid-β (Aβ) protein plays a major role in Aβ-induced alterations of glutamatergic synaptic transmission and plasticity. J Neurosci 34: , 12893–12903. |
[16] | Scala F , Fusco S , Ripoli C , Piacentini R , Li Puma DD , Spinelli M , Laezza F , Grassi C , D’Ascenzo M ((2015) ) Intraneuronal Aβ accumulation induces hippocampal neuron hyperexcitability through A-type K(+) current inhibition mediated by activation of caspases and GSK-3. Neurobiol Aging 36: , 886–900. |
[17] | Christensen DZ , Kraus SL , Flohr A , Cotel MC , Wirths O , Bayer TA ((2008) ) Transient intraneuronal Abeta rather than extracellular plaque pathology correlates with neuron loss in the frontal cortex of APP/PS1KI mice. Acta Neuropathol 116: , 647–655. |
[18] | Chafekar S , Baas F , Scheper W ((2008) ) Oligomer-specific amyloid-beta toxicity in cell models is mediated by selective uptake. Biochem Biophys Acta 9: , 523–531. |
[19] | Wesén E , Jeffries G , Dzebo M , Esbjörner M ((2017) ) Endocytic uptake of monomeric amyloid-β peptides is clathrin- and dynamin-independent and results in selective accumulation of Aβ(1–42) compared to Aβ(1–40). Sci Rep 7: , 2021. |
[20] | [20 Kumar-Singh S , Theuns J , Van Broeck B , Pirici D , Vennekens K , Corsmit E , Cruts M , Dermaut B , Wang R , Van Broeckhoven C ((2006) ) Mean age-of-onset of familial Alzheimer disease caused by presenilin mutations correlates with both increased Abeta42 and decreased Abeta40. Hum Mutat 27: , 686–695. |
[21] | Hu X , Crick SL , Bu G , Frieden C , Pappu RV , Lee JM ((2009) ) Amyloid seeds formed by cellular uptake, concentration, and aggregation of the amyloid-beta peptide. Proc Natl Acad Sci U S A 106: , 20324–20329. |
[22] | Yajima R , Tokutake T , Koyama A , Kasuga K , Tezuka T , Nishizawa M , Ikeuchi T ((2015) ) ApoE-isoform-dependent cellular uptake of amyloid-β is mediated by lipoprotein receptor LR11/SorLA. Biochem Biophys Res Comm 456: , 482–488. |
[23] | Omtri RS , Davidson MW , Arumugam B , Poduslo JF , Kandimalla KK ((2012) ) Differences in the cellular uptake and intracellular itineraries of amyloid beta proteins 40 and 42: Ramifications for the Alzheimer’s drug discovery. Mol Pharmaceutics 9: , 1887. |
[24] | Bu G , Cam J , Zerbinatti C ((2006) ) LRP in amyloid-β production and metabolism. Ann NY Acad Sci 1086: , 35–53. |
[25] | Wang HY , Lee DH , D’Andrea MR , Peterson PA , Shank RP , Reitz AB ((2000) ) β-Amyloid1–42 binds to alpha7 nicotinic acetylcholine receptor with high affinity. Implications for Alzheimer’s disease pathology. J Biol Chem 275: , 5626–5632. |
[26] | Nagele R , D’Andrea M , Anderson W , Wang H ((2002) ) Intracellular accumulation of Aβ42 in neurons is facilitated by the α7 nicotinic acetylcholine receptor in Alzheimer’s disease. Neuroscience 110: , 199–211. |
[27] | Oddo S , Caccamo A , Green KN , Liang K , Tran L , Chen Y , Leslie FM , LaFerla FM ((2005) ) Chronic nicotine administration exacerbates tau pathology in a transgenic model of Alzheimer’s disease. Proc Natl Acad Sci U S A 102: , 3046–3051. |
[28] | Yan SD , Chen X , Fu J , Chen M , Zhu H , Roher A , Slattery T , Zhao L , Nagashima M , Morser J , Migheli A , Nawroth P , Stern D , Schmidt AM ((1996) ) RAGE and amyloid-β peptide neurotoxicity in Alzheimer’s disease. Nature 382: , 685–691. |
[29] | Sasaki N , Toki S , Chowei H , Saito T , Nakano N , Hayashi Y , Takeuchi M , Makita Z ((2001) ) Immunohistochemical distribution of the receptor for advanced glycation end products in neurons and astrocytes in Alzheimer’s disease. Brain Res 888: , 256–262. |
[30] | Deane R , Du Yan S , Submamaryan RK , LaRue B , Jovanovic S , Hogg E , Welch D , Manness L , Lin C , Yu J , Zhu H , Ghiso J , Frangione B , Stern A , Schmidt AM , Armstrong DL , Arnold B , Liliensiek B , Nawroth P , Hofman F , Kindy M , Stern D , Zlokovic B ((2003) ) RAGE mediates amyloid-β peptide transport across the blood–brain barrier and accumulation in brain. Nature Med 9: , 907–913. |
[31] | Iribarren P , Zhou Y , Hu J , Le Y , Wang J ((2005) ) Role of formyl peptide receptor-like 1 (FPRL1/FPR2) in mononuclear phagocyte responses in Alzheimer disease. Immunol Res 31: , 165–176. |
[32] | Snyder EM , Nong Y , Almeida CG , Paul S , Moran T , Choi EY , Nairn AC , Salter MW , Lombroso PJ , Gouras GK , Greengard P ((2005) ) Regulation of NMDA receptor trafficking by amyloid-β. Nature Neurosci 8: , 1051–1058. |
[33] | LaFerla F , Green K , Oddo S ((2007) ) Intracellular amyloid-beta in Alzheimer’s disease. Nat Rev Neurosci 8: , 499–509. |
[34] | Kinoshita A , Fukumoto H , Shah T , Whelan CM , Irizarry MC , Hyman BT ((2003) ) Demonstration by FRET of BACE interaction with the amyloid precursor protein at the cell surface and in early endosomes. J Cell Sci 116: , 3339–3346. |
[35] | Xu H , Greengard P , Gandy S ((1995) ) Regulated formation of Golgi secretory vesicles containing Alzheimer β-amyloid precursor protein. J Biol Chem 270: , 23243–23245. |
[36] | Mizuguchi M , Ikeda K , Kim S ((1992) ) Differential distribution of cellular forms of β-amyloid precursor protein in murine glial cell cultures. Brain Res 584: , 219–225. |
[37] | Cook DG , Forman MS , Sung JC , Leight S , Kolson DL , Iwatsubo T , Lee VM , Doms RW ((1997) ) Alzheimer’s Aβ42 is generated in the endoplasmic reticulum/intermediate compartment of NT2N cells. Nature Med 3: , 1021–1023. |
[38] | Hartmann T , Bieger SC , Brühl B , Tienari PJ , Ida N , Allsop D , Roberts GW , Masters CL , Dotti CG , Unsicker K , Beyreuther K ((1997) ) Distinct sites of intracellular production for Alzheimer’s disease Aβ40/42 amyloid peptides. Nature Med 3: , 1016–1020. |
[39] | Wild-Bode C , Yamazaki T , Capell A , Leimer U , Steiner H , Ihara Y , Haass C ((1997) ) Intracellular generation and accumulation of amyloid beta-peptide terminating at amino acid 42. J Biol Chem 272: , 16085–16088. |
[40] | Lee SJ , Liyanage U , Bickel PE , Xia W , Lansbury PT Jr , Kosik KS ((1998) ) A detergent-insoluble membrane compartment contains Aβ in vivo. Nat Med 4: , 730–734. |
[41] | Skovronsky D , Doms R , Lee V ((1998) ) Detection of a novel intraneuronal pool of insoluble amyloid β protein that accumulates with time in culture. J Cell Biol 141: , 1031–1039. |
[42] | Manczak M , Anekonda TS , Henson E , Park BS , Quinn J , Reddy PH ((2006) ) Mitochondria are a direct site of Aβ accumulation in Alzheimer’s disease neurons: Implications for free radical generation and oxidative damage in disease progression. Hum Mol Genet 15: , 1437–1449. |
[43] | Martin B , Schrader-Fischer G , Busciglio J , Duke M , Paganetti P , Yankner B ((1995) ) Intracellular accumulation of beta-amyloid in cells expressing the Swedish mutant amyloid precursor protein. J Biol Chem 270: , 26727–26730. |
[44] | Sannerud R , Esselens C , Ejsmont P , Mattera R , Rochin L , Tharkeshwar AK , De Baets G , De Wever V , Habets R , Baert V , Vermeire W , Michiels C , Groot AJ , Wouters R , Dillen K , Vints K , Baatsen P , Munck S , Derua R , Waelkens E , Basi GS , Mercken M , Vooijs M , Bollen M , Schymkowitz J , Rousseau F , Bonifacino JS , Van Niel G , De Strooper B , Annaert W ((2016) ) Restricted Location of PSEN2/gamma-secretase determines substrate specificity and generates an intracellular Abeta pool. Cell 166: , 193–208. |
[45] | Pakos-Zebrucka K , Koryga I , Mnich K , Ljujic M , Samali A , Gorman AM ((2016) ) The integrated stress response. EMBO Rep 17: , 1374–1395. |
[46] | Ron D ((2002) ) Translational control in the endoplasmic reticulum stress response. J Clin Invest 110: , 1383–1388. |
[47] | Harding HP , Zhang Y , Zeng H , Novoa I , Lu PD , Calfon M , Sadri N , Yun C , Popko B , Paules R , Stojdl DF , Bell JC , Hettmann T , Leiden JM , Ron D ((2003) ) An integrated stress response regulates amino acid metabolism and resistance to oxidative stress. Mol Cell 11: , 619–633. |
[48] | Brostrom CO , Prostko CR , Kaufman RJ , Brostrom MA ((1996) ) Inhibition of translational initiation by activators of the glucose-regulated stress protein and heat shock protein stress response systems. Role of the interferon-inducible double-stranded RNA-activated eukaryotic initiation factor 2alpha kinase. J Biol Chem 271: , 24995–25002. |
[49] | Dever TE , Feng L , Wek RC , Hinnebusch AG ((1992) ) Phosphorylation of initiation factor 2 alpha by protein kinase GCN2 mediates gene-specific translational control of GCN4 in yeast. Cell 68: , 585–596. |
[50] | Wek RC , Jiang HY , Anthony TG ((2006) ) Coping with stress: eIF2 kinases and translational control. Biochem Soc Trans 34: , 7–11. |
[51] | Rzymski T , Milani M , Pike L , Buffa F , Mellor HR , Winchester L , Pires I , Hammond E , Ragoussis I , Harris AL ((2010) ) Regulation of autophagy by ATF4 in response to severe hypoxia. Oncogene 29: , 4424–4435. |
[52] | Ye J , Kumanova M , Hart LS , Sloane K , Zhang H , De Panis DN , Bobrovnikova-Marjon E , Diehl JA , Ron D , Koumenis C ((2010) ) The GCN2-ATF4 pathway is critical for tumour cell survival and proliferation in response to nutrient deprivation. EMBO J 29: , 2082–2096. |
[53] | Garcia MA , Meurs EF , Esteban M ((2007) ) The dsRNA protein kinase PKR: Virus and cell control. Biochimie 89: , 799–811. |
[54] | Harding HP , Zhang Y , Ron D ((1999) ) Protein translation and folding are coupled by an endoplasmic-reticulum-resident kinase. Nature 397: , 271–274. |
[55] | Chang RC , Suen KC , Ma CH , Elyaman W , Ng HK , Hugon J ((2002) ) Involvement of double-stranded RNA-dependent protein kinase and phosphorylation of eukaryotic initiation factor-2alpha in neuronal degeneration. J Neurochem 83: , 1215–1225. |
[56] | Peel AL ((2004) ) PKR activation in neurodegenerative disease. J Neuropathol Exp Neurol 63: , 97–105. |
[57] | Peel AL , Bredesen DE ((2003) ) Activation of the cell stress kinase PKR in Alzheimer’s disease and human amyloid precursor protein transgenic mice. Neurobiol Dis 14: , 52–62. |
[58] | Chang RC , Wong AK , Ng HK , Hugon J ((2002) ) Phosphorylation of eukaryotic initiation factor-2alpha (eIF2alpha) is associated with neuronal degeneration in Alzheimer’s disease. Neuroreport 13: , 2429–2432. |
[59] | Onuki R , Bando Y , Suyama E , Katayama T , Kawasaki H , Baba T , Tohyama M , Taira K ((2004) ) An RNA-dependent protein kinase is involved in tunicamycin-induced apoptosis and Alzheimer’s disease. EMBO J 23: , 959–968. |
[60] | Lourenco MV , Clarke JR , Frozza RL , Bomfim TR , FornyGermano L , Batista AF , Sathler LB , Brito-Moreira J , Amaral OB , Silva CA , Freitas-Correa L , Esp'irito-Santo S , Campello-Costa P , Houzel JC , Klein WL , Holscher C , Carvalheira JB , Silva AM , Velloso LA , Munoz DP , Ferreira ST , De Felice FG ((2013) ) TNF-alpha mediates PKR-dependent memory impairment and brain IRS-1 inhibition induced by Alzheimer’s beta-amyloid oligomers in mice and monkeys. Cell Metab 18: , 831–843. |
[61] | Paquet C , Mouton-Liger F , Meurs EF , Mazot P , Bouras C , Pradier L , Gray F , Hugon J ((2012) ) The PKR activator PACT is induced by Abeta: Involvement in Alzheimer’s disease. Brain Pathol 22: , 219–229. |
[62] | Guo X , Aviles G , Liu Y , Tian R , Unger BA , Lin YT , Wiita AP , Xu K , Correia MA , Kampmann M ((2020) ) Mitochondrial stress is relayed to the cytosol by an OMA1-DELE1-HRI pathway. Nature 579: , 427–432. |
[63] | Fessler E , Eckl EM , Schmitt S , Mancilla IA , MeyerBender MF , Hanf M , Philippou-Massier J , Krebs S , Zischka H , Jae LT ((2020) ) A pathway coordinated by DELE1 relays mitochondrial stress to the cytosol. Nature 579: , 433–437. |
[64] | Zhu X , Perry G , Moreira PI , Aliev G , Cash AD , Hirai K , Smith MA ((2006) ) Mitochondrial abnormalities and oxidative imbalance in Alzheimer disease. J Alzheimers Dis 9: , 147–153. |
[65] | Blass JP ((2000) ) The mitochondrial spiral. An adequate cause of dementia in the Alzheimer’s syndrome. Ann N Y Acad Sci 924: , 170183. |
[66] | Manczak M , Park BS , Jung Y , Reddy PH ((2004) ) Differential expression of oxidative phosphorylation genes in patients with Alzheimer’s disease: Implications for early mitochondrial dysfunction and oxidative damage. Neuromolecular Med 5: , 147–162. |
[67] | Qin W , Haroutunian V , Katsel P , Cardozo CP , Ho L , Buxbaum JD , Pasinetti GM ((2009) ) PGC-1alpha expression decreases in the Alzheimer disease brain as a function of dementia. Arch Neurol 66: , 352–361. |
[68] | Du H , Guo L , Yan S , Sosunov AA , McKhann GM , Yan SS ((2010) ) Early deficits in synaptic mitochondria in an Alzheimer’s disease mouse model. Proc Natl Acad Sci U S A 107: , 18670–18675. |
[69] | Lin MT , Simon DK , Ahn CH , Kim LM , Beal MF ((2002) ) High aggregate burden of somatic mtDNA point mutations in aging and Alzheimer’s disease brain. Hum Mol Genet 11: , 133–145. |
[70] | Calkins M , Manczak M , Mao P , Shirendeb U , Reddy PH ((2011) ) Impaired mitochondrial biogenesis, defective axonal transport of mitochondria, abnormal mitochondrial dynamics and synaptic degeneration in a mouse model of Alzheimer’s disease. Hum Mol Genet 20: , 4515–4529. |
[71] | Anandatheerthavarada HK , Biswas G , Robin MA , Avadhani NG ((2003) ) Mitochondrial targeting and a novel transmembrane arrest of Alzheimer’s amyloid precursor protein impairs mitochondrial function in neuronal cells. J Cell Biol 161: , 41–54. |
[72] | Caspersen C , Wang N , Yao J , Sosunov A , Chen X , Lustbader JW , Xu HW , Stern D , McKhann G , Yan SD ((2005) ) Mitochondrial Abeta: A potential focal point for neuronal metabolic dysfunction in Alzheimer’s disease. FASEB J 19: , 2040–2041. |
[73] | Chen JX , Yan SS ((2010) ) Role of mitochondrial amyloid-beta in Alzheimer’s disease. J Alzheimers Dis 20: (Suppl 2), S569–578. |
[74] | Hansson Petersen CA , Alikhani N , Behbahani H , Wiehager B , Pavlov PF , Alafuzoff I , Leinonen V , Ito A , Winblad B , Glaser E , Ankarcrona M ((2008) ) The amyloid beta-peptide is imported into mitochondria via the TOM import machinery and localized to mitochondrial cristae. Proc Natl Acad Sci U S A 105: , 13145–13150. |
[75] | de la Monte SM , Luong T , Neely TR , Robinson D , Wands JR ((2000) ) Mitochondrial DNA damage as a mechanism of cell loss in Alzheimer’s disease. Lab Invest 80: , 1323–1335. |
[76] | Brooks WM , Lynch PJ , Ingle CC , Hatton A , Emson PC , Faull RL , Starkey MP ((2007) ) Gene expression profiles of metabolic enzyme transcripts in Alzheimer’s disease. Brain Res 1127: , 127–135. |
[77] | Wang X , Perry G , Smith MA , Zhu X ((2007) ) Amyloid-beta-derived diffusible ligands cause impaired axonal transport of mitochondria in neurons. Neurodegener Dis 7: , 56–59. |
[78] | Wang X , Su B , Fujioka H , Zhu X ((2008) ) Dynamin-like protein 1 reduction underlies mitochondrial morphology and distribution abnormalities in fibroblasts from sporadic Alzheimer’s disease patients. Am J Pathol 173: , 470–482. |
[79] | Wang X , Su B , Lee HG , Li X , Perry G , Smith MA , Zhu X ((2009) ) Impaired balance of mitochondrial fission and fusion in Alzheimer’s disease. J Neurosci 29: , 9090–9103. |
[80] | Wang X , Su B , Siedlak SL , Moreira PI , Fujioka H , Wang Y , Casadesus G , Zhu X ((2008) ) Amyloid-beta overproduction causes abnormal mitochondrial dynamics via differential modulation of mitochondrial fission/fusion proteins. Proc Natl Acad Sci U S A 105: , 19318–19323. |
[81] | van Dyck CH , Swanson CJ , Aisen P , Bateman RJ , Chen C , Gee M , Kanekiyo M , Li D , Reyderman L , Cohen S , Froelich L , Katayama S , Sabbagh M , Vellas B , Watson D , Dhadda S , Irizarry M , Kramer LD , Iwatsubo T ((2023) ) Lecanemab in early Alzheimer’s disease. N Engl J Med 388: , 9–21. |
[82] | Mintun M , Lo A , Duggan-Evans C , Wessels A , Ardayfio P , Andersen S , Shcherbinin S , Sparks J , Sims J , Brys M , Apostolova L , Salloway S , Skovronsky D ((2021) ) Donanemab in early Alzheimer’s disease. N Engl J Med 384: , 1691–1704. |
[83] | Eli Lilly ((2023) ) Donanemab Significantly Slowed Cognitive and Functional Decline in Phase 3 Study of Early Alzheimer’s Disease. Press release. https://investor.lilly.com/news-releases/news-release-details/lillys-donanemab-significantly-slowed-cognitive-and-functional |
[84] | Sims JR , Zimmer JA , Evans CD , Lu M , Ardayfio P , Sparks J , Wessels AM , Shcherbinin S , Wang H , Monkul Nery ES , Collins EC , Solomon P , Salloway S , Apostolova LG , Hansson O , Ritchie C , Brooks DA , Mintun M , Skovronsky DM ; TRAILBLAZER-ALZ 2 Investigators ((2023) ) Donanemab in early symptomatic Alzheimer disease: The TRAILBLAZER-ALZ 2 Randomized Clinical Trial. JAMA 330: , 512–527. |
[85] | Abbott A ((2023) ) The next generation of Alzheimer’s treatments. Nature 616: , 26–28. |
[86] | Jonsson T , Atwal JK , Steinberg S , Snaedal J , Jonsson PV , Bjornsson S , Stefansson H , Sulem P , Gudbjartsson D , Maloney J , Hoyte K , Gustafson A , Liu Y , Lu Y , Bhangale T , Graham RR , Huttenlocher J , Bjornsdottir G , Andreassen OA , Jonsson EG , Palotie A , Behrens TW , Magnusson OT , Kong A , Thorsteinsdottir U , Watts RJ , Stefansson K ((2012) ) A mutation in APP protects against Alzheimer’s disease and age-related cognitive decline. Nature 488: , 96–99. |
[87] | Harper AR , Nayee S , Topol EJ ((2015) ) Protective alleles and modifier variants in human health and disease. Nat Rev Genet 16: , 689–701. |
[88] | Egan MF , Kost J , Tariot PN , Aisen PS , Cummings JL , Vellas B , Sur C , Mukai Y , Voss T , Furtek C , Mahoney E , Harper Mozley L , Vandenberghe R , Mo Y , Michelson D ((2018) ) Randomized trials of verubecestat for mild-to-moderate Alzheimer’s disease. N Engl J Med 378: , 1691–1703. |
[89] | Egan MF , Kost J , Voss T , Mukai Y , Aisen PS , Cummings JL , Tariot PN , Vellas B , van Dyck CH , Boada M , Zhang Y , Li W , Furtek C , Mahoney E , Harper Mozley L , Mo Y , Sur C , Michelson D ((2019) ) Randomized trial of verubecestat for prodromal Alzheimer’s disease. N Engl J Med 380: , 1408–1420. |
[90] | Farzan M , Schnitzler CE , Vasilieva N , Leung D , Choe H ((2000) ) BACE2, a β-secretase homolog, cleaves at the β site and within the amyloid-β region of the amyloid-β precursor protein. Proc Natl Acad Sci U S A 97: , 9712–9717. |


