
Plasma Biomarkers of Alzheimer’s Disease: A Review of Available Assays, Recent Developments, and Implications for Clinical Practice
Abstract
Recently, low-sensitive plasma assays have been replaced by new ultra-sensitive assays such as single molecule enzyme-linked immunosorbent assay (Simoa), the Mesoscale Discovery (MSD) platform, and immunoprecipitation-mass spectrometry (IP-MS) with higher accuracy in the determination of plasma biomarkers of Alzheimer’s disease (AD). Despite the significant variability, many studies have established in-house cut-off values for the most promising available biomarkers. We first reviewed the most used laboratory methods and assays to measure plasma AD biomarkers. Next, we review studies focused on the diagnostic performance of these biomarkers to identify AD cases, predict cognitive decline in pre-clinical AD cases, and differentiate AD cases from other dementia. We summarized data from studies published until January 2023. A combination of plasma Aβ42/40 ratio, age, and APOE status showed the best accuracy in diagnosing brain amyloidosis with a liquid chromatography–mass spectrometry (LC–MS) assay. Plasma p-tau217 has shown the best accuracy in distinguishing Aβ-PET+ from Aβ-PET–even in cognitively unimpaired individuals. We also summarized the different cut-off values for each biomarker when available. Recently developed assays for plasma biomarkers have undeniable importance in AD research, with improved analytical and diagnostic performance. Some biomarkers have been extensively used in clinical trials and are now clinically available. Nonetheless, several challenges remain to their widespread use in clinical practice.
INTRODUCTION
Plasma biomarkers of Alzheimer’s disease (AD) are less invasive and have lower costs, providing more time-efficient measurements than cerebrospinal fluid (CSF) or molecular neuroimaging biomarkers. Most studies have focused on detecting pre-clinical AD cases, aiming to improve subject selection for clinical trials testing disease-modifying drugs for AD [1, 2]. The most extensively evaluated plasma AD biomarkers are the plasma amyloid-β (Aβ), especially Aβ42 and Aβ40, and the phosphorylated tau (p-tau) protein at epitopes 181, 217, and 231 (p-tau181, p-tau217, and p-tau231), which are markers of the pathological hallmarks of AD, i.e., neuritic plaques and neurofibrillary tangles, respectively [3]. In recent years, these plasma biomarkers of AD have shown promising results to become viable surrogates for the CSF or molecular brain imaging biomarkers’ modalities [2]. Other plasma biomarkers commonly evaluated in AD include the neurofilament light protein (NfL), a marker of neuroaxonal injury and neurodegeneration, and the glial fibrillary acidic protein (GFAP), a product of astroglial activation and astrocytosis [4–6]. These biomarkers have been studied in clinical and community samples [7] and, together with other recent advances in the field, including commercially available tests [8, 9], anticipate the possibility of their use not only for research purposes but also in clinical settings.
Despite the technical advances in measuring different plasma AD biomarkers, there are still many challenges before their large-scale application, especially in clinical settings. For example, it is still unclear which is the best platform to measure these biomarkers. Also, there is no consensus on the best cut-off values for these biomarkers that can be applied in different samples to distinguish between AD versus non-AD cases. Additionally, we need a better understanding of how different variables like the blood-brain barrier permeability, the biomarkers’ metabolization dynamics, the typical brain aging, and the systemic comorbidities can affect their measurement [10–13].
This review aims to provide a critical overview of the most recent developments in the investigation of plasma AD biomarkers. We review available assays and measurement methods, their advantages, and disadvantages. When applicable, we review the available data on the biomarkers’ cut-off scores and how these biomarkers can be used in research and clinical settings. Although our focus is on plasma AD biomarkers, we acknowledge that the analyses of other biological matrices, like the CSF, and structural and molecular neuroimaging methods have been extensively used to analyze AD biomarkers.
METHODS
We searched the PubMed database in January 2023 for articles matching the following search terms: Alzheimer’s disease AND blood OR plasma OR serum biomarkers. We also checked a reference list to include other important published works on the field. We included articles published in English only. We focused on articles describing novel laboratory methods for measuring blood-based biomarkers and included information about cut-off values to discriminate AD from normal aging or other non-AD dementia syndromes.
LABORATORY METHODS AVAILABLE
Since the late 1990s, different analytical platforms have been used to measure plasma AD biomarkers. The early laboratory methods, like the enzyme-linked immunosorbent assay (ELISA), were initially developed to detect AD biomarkers, i.e., Aβ40 and Aβ42 peptides, total tau (t-tau), and p-tau protein in the CSF. However, they yielded inconsistent results for their analyses in the plasma. For example, studies using the INNOTEST® assay (Fujirebio, Europe) showed that significant reductions in the concentration of Aβ42 in the CSF were mostly related to amyloid deposition in the brain due to AD pathology [14]. However, studies using ELISA did not show significant correlations between plasma Aβ and CSF Aβ concentrations or brain Aβ burden [15–17]. In addition, different methodological issues significantly affected the performance of these ELISAs, including their low sensitivity to detect AD biomarkers at very low concentrations in the blood and the significant interference of the blood matrix composition in the assay performance.
In the past few decades, other analytical methods have been developed and evaluated to measure plasma AD biomarkers with different success rates [18]. The Multiple Analyte Profiling (xMAP) technology was one of the first technologies available as an alternative to traditional ELISA. One advantage of the xMAP is the simultaneous measurement of Aβ40, Aβ42, total tau, and p-tau isoforms, thus, reducing the amount of sample and improving the general workflow for biomarkers’ analyses [19]. Although presenting with higher sensitivity than ELISA, the results from the semi-automated Luminex xMap® assays for plasma AD biomarkers were frustrating, including the absence of significant correlations between plasma and CSF Aβ concentrations, and poor reproducibility of the assay across different laboratories [15, 18, 20].
In 2010, a single molecule enzyme-linked immunosorbent assay (digital ELISA) was developed to detect AD biomarkers. This technology uses arrays of femtoliter-sized reaction chambers named Simoa (Quanterix, Billerica, MA, USA) [21]. This platform can detect much lower protein concentrations than conventional ELISA or multiplex assays (femtogram versus picogram, respectively). The Simoa platform allowed greater plasma or serum sample dilution while providing fewer matrix interferences. The digital assay technique generates precise and exact quantifications of these biomarkers [22, 23]. The Simoa platform has become one of the most used platforms for plasma biomarkers analyses and has been recently granted the designation of Breakthrough Device from the Food and Drug Administration (FDA) in the United States for the plasma p-tau181 assay [24].
Fully automated, electrochemiluminescence (ECL)-based assays are increasingly moving forward as surrogates of traditional ELISA and xMAP technologies. These include the Elecsys immunoassay (Roche Diagnostics, Penzberg, Germany), the EUROIMMUN® ECL immunoassay (EUROIMMUN, Lüebeck, Germany), and the Mesoscale Discovery (MSD) platform (Meso Scale Diagnostics, Rockville, MD, USA) (Table 1). These platforms showed improved sensitivity to detect lower levels of biomarkers in the plasma over traditional ELISA assays [25–28]. The ECL-based assays have comparable performance with the Simoa assay for both Aβ and p-tau quantification, especially after the development of automated systems such as the MSD platform [27–30]. The recently available, fully automated Lumipulse G System® (Lumipulse, Fujirebio, Ghent, Belgium) plasma test, a chemiluminescent enzyme immunoassay, is an example of a new technique paving the way to replace the need for lumbar puncture and neuroimaging in AD diagnostic workups [1]. The FDA recently approved its version for CSF analyses for clinical use [9, 31].
Table 1
Platforms available for plasma biomarkers of AD analyses and their characteristics
| Analytic methods available | |||
| Platforms | Characteristics | Benefits | Limitations |
| Enzyme-linked immunosorbent assay (ELISA) | Non-automated. Primary tool for detecting analytes of interest in biological samples as diagnostic tools and quality control. Miscellaneous, all including i) antigen; ii) one or more antibodies; and iii) a system to quantify the antigen quantity. | More widely available. Fully and semi-automated IAs are available with improved performance. | No multiplexing ability. A large amount of samples is needed. Enzyme-mediated amplification of signals can skew results. Several steps of manual pipetting. Limitation on detection of proteins of various sizes and structures. |
| Multiple Analyte Profiling (xMAP) technology | Semi-automated. Multiplexing can be achieved because up to 100 distinct color-coded microsphere bead sets can be coated with a reagent specific. Allows simultaneous analysis of different proteins and peptides isoforms. | Rapid profiling of biomarker proteins in biological fluids. Uses less sample and labor than in a single IA. Offer high-throughput detection (up to 500 analytes) of both protein and nucleic acid targets in multiple assay chemistries. | Cross-reactivity. Covering the dynamic range of individual analytes can be challenging. The number of parameters can increase exponentially. Longer assay development time. Worse inter-assay performance than automated testing. |
| Sandwich ELISAs by Multimer detection system (MDS) | Antibody-based technique (high analytical sensitivity). Resembles a sandwich ELISA. Differentiates multimers from their cellular monomers. Originally developed for quantifying various oligomers. | Uses overlapping epitopes for the capture and detection of antibodies. Can react with a capture antibody and then also bind with a detection antibody, resulting in a detection signal. High diagnostic accuracy and repeatability. | Costly, and not widely available. As with all sandwich ELISA does not perform well for assaying small molecules. |
| Single-molecule array (Simoa) | Digital assay technique. Measurement of single-molecule immunocomplexes. Immunocapture of the protein biomarker on magnetic beads that are trapped in wells, followed by the detection by an enzyme-labeled antibody. | Greater dilution of the plasma or serum samples. Fewer matrix interferences. Digital precise and exact quantification. | Costly, not widely available. Some use sandwich ELISA technology. |
| Immunomagnetic reduction assay (IMR) | Concentration is measured by comparing changes in magnetic responses between free and conjugated magnetic nanoparticles. Magnetic nanoparticles are associated with a target biomarker. The target biomarker is then quantified as alternative-current magnetic signal attenuation. | Developed to be a high-sensitivity assay. Capable of detecting ultra-low concentrations of proteins. Low-cost, low-risk, simple procedure. | Not capable of large-scale analyses. High-sensitivity no tested in large-scale analyses, therefore still unclear. Effect of cross-reactivity can impair result interpretation. |
| Immuno-Infrared-Sensor | Technique capable of tracking aggregation and misfolded Aβ, tau, and TDP-43, suitable for early asymptomatic stages. | Capable of quantification of the whole distribution of the protein/peptide fraction, not only the concentration of a single protein/peptide or oligomer | Costly, not widely available. Less studied. Sensitivity still unclear. Effect of cross-reactivity can impair result interpretation. |
| Electrochemiluminescence (ECL)-based methods | |||
| Fully automated. Highly specific immunoreaction. Uses a combination of optical and electrochemical methods. High versatility. Wide dynamic detection range. Low background noise. | |||
| Simple optical setup. Good reproducibility. Low detection costs. Not sufficiently sensitive to detect the lowest concentrations of some proteins. | |||
| Meso Scale Discovery (MSD) | Uses ECL as a detection technique as opposed to a colorimetric reaction employed by ELISA. Uses labels that emit light upon electrochemical stimulation initiated at the electrode surfaces of MULTI-ARRAY and MULTI-SPOT microplates. | Allows for ultra-sensitive detection. Multiplex capability. Similar consistency of ELISA. Provides higher sensitivity and a broader dynamic range. | Costly, and not widely available. Great inter-assay variability. |
| Elecsys sandwich immunoassay | Antibody-based technique (high analytical sensitivity). Performed on neat plasma, without any cleanup or pre-treatment step. Low between-laboratory and lot-to-lot variability. | Fully automated. High-throughput. Highly reliable analysis methods. Facilitates implementation more broadly in clinical practice. Can be used in primary care or in screening large numbers of participants for AD clinical trials. Very high analytical reliability and precision. | As with all sandwich ELISA does not perform well for assaying small molecules. |
| Immunoprecipitation mass spectrometry (IP-MS) and liquid chromatography-mass spectrometry (LC-MS) | Combines immunoprecipitation and mass spectrometry. Desired analytes are first selectively captured prior to analysis with mass spectrometry. | MS-based methods have been showing the best accuracy results in recent head-to-head studies, outperforming all IA-based methods. Immunoprecipitation works as an enrichment tool for low-abundant protein targets. | Costly, not widely available. |
Aβ, amyloid-β; TDP-43, TAR-DNA binding protein 43; IA, immunoassay.
Another major milestone in the field was the development of an immunoprecipitation and mass spectrometry (IP-MS) test to measure different plasma biomarkers. The IP-MS methods are very reliable for protein quantification and have shown robust results for Aβ and p-tau quantification in the plasma [8, 32, 33]. Some MS-based methods can be interfaced with liquid chromatography (LC-MS), adding accuracy to this technology [32, 34, 35]. Two recent studies comparing several assays using a head-to-head design revealed the superiority of some IP-MS methods, e.g., LC-MS, compared to other assay methods, especially ELISA assays for detecting Aβ and p-tau species [27, 32]. These techniques have been extensively studied for Aβ and need further development and validation to quantify different p-tau species in the plasma [2]. Although more prospective studies are necessary to determine their diagnostic properties, some MS-based assays have been used as Laboratory Developed Tests (LDT) in the United States [27, 36, 38]. Other assays, like the PrecivityADTM test, the Quest AD-DetectTM, and the Elecsys Amyloid Plasma Panel (EAPP), are also available for clinical use (see below) [37–39].
Despite the major advances in the field, with some assays already available for clinical use, these ultra-sensitive platforms are still costly and have limited availability, restricting their widespread use in clinical settings, either as screening or diagnostic tools. However, incorporating biomarkers analyses has become the norm in clinical trials as screening tools for trial inclusion, evaluation of target engagement, and monitoring the effect of drugs or biologics on AD pathological hallmarks [40]. Table 1 summarizes the different platforms available for analyzing plasma biomarkers of AD and their characteristics.
AMYLOID AND TAU PLASMA BIOMARKERS
Plasma amyloid-β
A large bulk of literature evaluated the plasma levels of Aβ42, Aβ40, and the Aβ42/40 ratio in AD using different platforms. Most studies have found lower plasma Aβ levels in patients with AD compared to cognitively unimpaired individuals. Also, it has been able to distinguish abnormal from normal amyloid-β positron emission tomography (Aβ-PET) scans with gradually increasing accuracy [34, 35, 41–44]. Noteworthy, the use of Aβ-PET status to define the presence of AD pathology resulted in higher accuracy of plasma Aβ quantification than the clinical diagnosis [45]. The plasma Aβ quantified using both fully automated immunoassays and MS-based methods shows significant discriminative accuracy of the brain Aβ burden using the CSF Aβ42/40 levels or Aβ-PET as standards of truth [27]. Despite variations in detection sensitivity and reported biomarkers concentrations, these results are consistent across different analytical methods. However, MS-based methods usually outperformed immunoassays in most studies [27, 35, 42, 46]. In a head-to-head study including ten different assays, the LC-MS method showed the best diagnostic performance among all tested assays [27]. The plasma Aβ42/40 ratio has a stronger correlation with brain Aβ burden and better diagnostic and prediction accuracy than either Aβ42 or Aβ40 alone [27, 35, 42, 47–49]. In addition, using the ratio rather than each Aβ species alone seems to correct pre-analytical and analytical confounders [50].
Some of the initial analytical problems related to plasma Aβ detection, e.g., low assay sensitivity, narrower dynamic range to detect the lower concentration levels of Aβ in plasma than in CSF, and the need for sample dilution were mitigated after the development of ultrasensitive methods. Therefore, the ability to reliably detect and quantify lower levels of plasma Aβ would allow the use of plasma Aβ levels as surrogate measures of brain Aβ deposition.
In a study of three different cohorts using a Simoa assay, there were positive and significant associations between plasma and CSF levels of Aβ42, Aβ40, and the Aβ42/40 ratio. In addition, a higher Aβ burden measured by Aβ-PET was associated with a lower plasma Aβ42 and a lower plasma Aβ42/40 ratio [42]. Using two independent data sets from two different sites and IP-MS analyses, Nakamura et al. showed that plasma Aβ had high performance predicting brain Aβ burden when subjects were classified using Aβ-PET. Receiver operating characteristic analyses were performed for this study and revealed an area under the curve (AUC) of 0.94 and an accuracy of 90%. They also showed that the Aβ levels measured in the plasma, CSF, and PET imaging were highly correlated with each other [47]. Furthermore, the plasma Aβ42/40 ratio, in combination with age and apolipoprotein E (APOE) status, showed good accuracy in diagnosing brain amyloidosis with an LC-MS analysis [35].
However, there are several challenges to the widespread use of plasma Aβ as a surrogate measure of brain amyloid pathology. First, a large proportion of individuals included in different studies had biomarkers levels close to the cut-off points and within the limits of statistical error, increasing the chance of misinterpretation of results [51]. Different from the CSF Aβ concentration, the differences in plasma Aβ levels between Aβ-PET+ and Aβ-PET–groups is around 10% to 15% (versus 40% to 60% on CSF concentrations) [8, 27]. Finally, plasma Aβ concentrations may be influenced by peripheral production of Aβ by other tissues, including circulating platelets [52], and the presence of medical comorbidities, like cardiovascular and cerebrovascular risk factors that probably impact its diagnostic properties [53–55].
Diagnostic and prognostic performance
Studies using different analytical platforms have reported that plasma Aβ biomarkers accurately detect brain amyloidosis. In 2017, a study held by Ovod et al. showed that the plasma Aβ42/40 ratio, measured by an LC-MS assay, had good accuracy with an AUC of 0.88 to distinguish amyloid positivity in Aβ-PET or CSF [34]. In a more recent study, using EUROIMMUN® ELISA, the ability of the plasma Aβ42/40 ratio to differentiate subjects with Aβ pathology measured by CSF Aβ levels was lower with an AUC of 0.79, a result that was improved (AUC = 0.86) by a composite of plasma Aβ42/40 ratio, p-tau217, NfL, and GFAP [51]. In fact, using a combination of biomarkers usually improved the overall accuracy of Aβ measurements. Janelidze et al. also demonstrated that adding other variables such as the APOE status improved the diagnostic performance of the LC-MS-based assay when compared to using the Aβ42/40 ratio alone [27].
Understanding the impact of cohort differences, processing procedures in different analytical methods, and the role of other risk factors for AD have improved the diagnostic properties of plasma Aβ assays. Using the clinically available PrecivityADTM test [8, 37], an LC-MS-based method, a plasma Aβ42/40 ratio cut-off value of 0.0975 had an AUC of 0.81 and an accuracy of 75% [8]. When adjusting to cohort differences, the diagnostic performance improved the AUC to 0.86 and the accuracy to 81%. The AUC increased to 0.90 and the accuracy to 86% with additional adjustments for age and APOE status [8, 37]. The method had a robust diagnostic performance in diagnosing Aβ positivity when both CSF and neuroimaging methods were used as standards. The diagnostic accuracy of this method was not significantly affected by potential confounding variables like differences in plasma sample collection in different cohorts [8, 37]. Their findings were similar to other studies, indicating that the MS-based method accurately predicts brain Aβ positivity while maintaining reproducibility across different laboratories [27, 35]. The Quest AD-DetectTM test, a high-throughput LC-MS assay, showed similar performance characteristics to the MS-based plasma assays performed by other laboratories [8, 37].
Other recent studies have shown good accuracy using other analytical platforms. For example, Yamashita et al., using an ECL-based assay, reported an AUC of 0.94 in the test sample (AUC = 0.86 in the validation sample), with a sensitivity of 96% and a specificity of 83.5%, in a study with AD subjects screened for the elenbecestat Phase 3 program [30]. Another study showed that the plasma Aβ42/40 ratio cut-off value of 0.089 had an AUC of 0.79, a sensitivity of 85%, a specificity of 63%, a positive predictive value (PPV) of 81%, and a negative predictive value (NPV) of 70% [33]. Adding APOE status improved the AUC to 0.86 and the overall accuracy to 78%. In the same study, using data from an independent cohort, the plasma Aβ42/40 ratio optimum cut-off value was 0.092 with an AUC of 0.86, a sensitivity of 90%, a specificity of 71%, a PPV of 76%, and an NPV of 88%. The overall accuracy increased to 83% after age and APOE status were included in the statistical model [33]. Together these results reinforce the role of the plasma Aβ42/40 ratio as a robust biomarker for Aβ pathology.
Total tau and phosphorylated tau
Many individuals will present elevated brain Aβ burden without showing signs of cognitive decline [56, 57]. Biomarkers of neurodegeneration, e.g., tau protein accumulation, are more better markers of cognitive decline [58], have a strong association with AD diagnosis [59, 60], and improve the prediction of future dementia among individuals with mild cognitive impairment (MCI) [61, 62]. However, total tau is unspecific to different neuropsychiatric conditions, including traumatic brain injury, limiting their use for AD diagnosis [63].
The tau protein has multiple phosphorylation sites, and currently available assays are mainly focused on the tau protein phosphorylated at three different epitopes, namely the p-tau181, p-tau217, and p-tau231 [1]. The phosphorylated tau protein, the main component of the neurofibrillary tangles, is more specific to AD pathology [64]. As with Aβ measurements, the development of highly sensitive assays and MS-based technologies significantly improved the identification of p-tau species in the plasma. The plasma p-tau181, for example, was strongly correlated with the neuropathological changes observed in AD [6]. In addition, plasma p-tau181 was strongly associated with Aβ-PET and CSF p-tau181 measures and had a high specificity to discriminate AD from other tauopathies [65–67]. Furthermore, this biomarker has been capable of differentiating Aβ-PET+ from Aβ-PET–subjects and predicting progression to dementia [68, 69] and was also strongly correlated with brain tau burden and atrophy in AD-related brain areas [66].
More recently, studies have suggested that the plasma p-tau217 increases before other p-tau isoforms in earlier stages of the AD pathological continuum [29, 32]. Plasma p-tau217 has shown good accuracy in distinguishing Aβ-PET+ from Aβ-PET–cognitively unimpaired individuals [29, 65, 70], showing also higher accuracy than the p-tau181 to identify individuals at risk of AD [29, 65]. The p-tau231 has also shown promising results and may be used as a biomarker of Aβ pathology at the early stages of the disease [4, 71].
In general, plasma p-tau levels (p-tau181, p-tau217, and p-tau231) were significantly higher in patients with AD than in cognitively unimpaired individuals [72–74]. Two meta-analyses found that plasma p-tau biomarkers have better results than plasma Aβ biomarkers in discriminating patients with AD from cognitively unimpaired individuals [59, 75]. Also, plasma p-tau biomarkers, especially the p-tau217, accurately predict the evolution from subjective cognitive decline (SCD) and MCI to dementia when combined with other risk factors [28, 76]. Even a minor elevation in plasma p-tau biomarkers is related to future cognitive decline, increased atrophy rates measured by magnetic resonance imaging, and hypometabolism measured by 18F-fluorodeoxyglucose PET (18F-FDG-PET) in the AD continuum [60, 61]. Interestingly, this relationship seems independent of elevated brain Aβ [60].
As the field moves forward in determining the prospective validity of these plasma p-tau assays, the Elecsys Amyloid Plasma Panel received, from the FDA, the Breakthrough Device Designation, becoming the first qualitative test combining the levels of the plasma p-tau181 and the APOE status to detect early AD available in clinical settings, similarly to the Simoa assay for p-tau181 as previously mentioned [39].
Diagnostic and prognostic performance
Using a Simoa assay, Lantero Rodriguez et al. showed that plasma p-tau181 had very high accuracy in discriminating AD from non-AD pathologies with an AUC = 0.97 prior to neuropathological assessment [77]. Likewise, Karikari et al. showed that the p-tau181 (Simoa assay) could distinguish AD from cognitively unimpaired individuals with low brain amyloidosis with an AUC higher than 0.90 [67].
The plasma p-tau217 has shown better diagnostic accuracy than p-tau181 levels in the CSF and plasma [29, 70, 78]. A head-to-head comparison of plasma p-tau217 and p-tau181 showed that the p-tau217 had higher diagnostic accuracy than plasma p-tau181 for AD diagnosis (p-tau217: AUC = 0.91 versus p-tau181: AUC = 0.89) using ECL-based assays [44]. Brickman et al., using the MSD platform, showed that plasma p-tau217 also had a high accuracy in identifying individuals with high brain amyloid burden based on Aβ-PET scans (AUC = 0.84) [70]. Janelidze et al., using the same platform, showed that plasma p-tau217 was elevated before tau-PET became positive in cognitively unimpaired, Aβ-PET+ older adults [79]. In addition, a study using the BioFINDER cohort reported that the plasma p-tau217 could predict the progression from MCI to AD within four years with significant accuracy (AUC = 0.83) [28]. The diagnostic performance significantly increased when the plasma p-tau217 was combined with cognitive performance and APOE genotype (AUC = 0.91).
Previous studies showed a strong correlation between the earliest AD pathological changes and CSF p-tau231 levels [80, 81]. Using a Simoa-based assay, Ashton et al. showed that plasma p-tau231, similarly to CSF p-tau231, discriminated patients with and without AD pathology at post-mortem assessment with an AUC of 0.99 [4]. A cut-off value of 17.652 pg/mL for plasma p-tau231, measured using in-house Simoa assay, showed a sensitivity of 81.2%, and a specificity of 93.3%, with an AUC of 0.94 to diagnose patients with AD [82].
These recent results demonstrate the plasma p-tau assays’ ability to accurately diagnose AD (based on clinical and pathological criteria), to identify individuals at the earliest stages of the AD pathological continuum, and to identify older adults at the highest risk of cognitive decline. Nonetheless, the large variability in biomarkers’ measurement across different assays and platforms and the lack of universally accepted biomarkers cut-off levels preclude its widespread use, especially in clinical settings. This is a particularly pressing issue since the emergence of FDA-approved interventions with disease-modifying properties (e.g., aducanumab and lecanemab) [83, 84] might be more effective if individuals are identified in the earliest stages of the AD pathological continuum and at the lowest cost possible. Table 2 summarizes recent studies that reported cut-off values using different analytical platforms.
Table 2
Summary of studies that reported cut-off values of different plasma biomarkers of AD
| Plasma Aβ only | ||||
| Author | Population, sample size, and design | Proxies of diagnosis, the standard of truth, or outcome | Biomarker and analytical platform | Cut-off/Threshold |
| Yamashita et al., 2022 [30] | Participants with early AD identified during screening for the elenbecestat Phase 3 program (MissionAD1 NCT02956486, MissionAD2 NCT03036280) Discovery study: 197 participants (mean age 71.1 years, 112 females) Validation study: 200 participants (mean age 70.8 years, 99 females) | Aβ-PET SUVr | Biomarker: plasma Aβ40 and Aβ42 Analytical platform: ECL (HISCL series, Sysmex Corporation®, Kobe, Japan) | Plasma Aβ42/40 ratio of 0.102 predicted Aβ-PET+: discovery study (AUC 0.94, SS 96%, SP 83.5%); validation study (AUC of 0.86, SS 88%, SP 72%) |
| Hu et al., 2022 [33] | 253 participants from 2 independent cross-sectional cohort studies PARIS discovery cohort and 437 from the MissionAD cohort Mean age 73.2 years, 53.6% male, 45.4% had an APOE ɛ4 allele | Aβ-PET SUVr | Biomarker: plasma Aβ40 and Aβ42 Analytical platform: LC-MS (Thermo Scientific Fusion Lumos Tribrid MS, Thermo Fisher Scientific®, Waltham, MA) | PARIS cohort: Plasma Aβ42/40 ratio: ≥0.089 (AUC 0.79, SS 85%, SP 63%, PPV 81%, and NPV 70%) APOE status added to the statistical model improved AUC to 0.86 and overall accuracy to 78% MissionAD cohort: Plasma Aβ42/40 ratio: ≥0.092 (AUC 0.86, SS 90%, SP 71%, PPV 76%, and NPV 88%) Age and APOE status added to statistical model improved AUC to 0.89 and an overall accuracy of 83% |
| West et al., 2021 [8] | 414 plasma samples of six independent US cohorts Mean age 70.0 years, 41.3% male, 43.7% had an APOE ɛ4 allele | CSF Aβ42/40 and Aβ-PET SUVr | Biomarker: plasma Aβ40 and Aβ42 Analytical platform: LC-MS (Thermo Scientific Fusion Lumos Tribrid MS, Thermo Fisher Scientific®, Waltham, MA) | Plasma Aβ42/40 ratio: ≥0.0975 (AUC 0.81 and accuracy 75%) When adjusting to cohort differences: AUC 0.86, accuracy 81%; When adjusting to age and APOE status: AUC 0.90, accuracy 86% |
| Plasma p-tau only | ||||
| Author | Population, sample size, and design | Proxies of diagnosis, the standard of truth, or outcome | Biomarker and analytical platform | Cutoff/threshold |
| Wilson et al., 2022 [117] | Longitudinal Stanford University Iqbal Farrukh and Asad Jamal Alzheimer’s Disease Research Center (ADRC) (271 CU, 107 MCI, 78 AD dementia) and the Stanford Aging and Memory Study (SAMS) (192 CU) cohorts Mean age: CU 69.9 years, 40% male; MCI 73.0 years, 58% male; AD 70.1 years, 47.4% male. 100 CU, 29 MCI, and 34 AD dementia had at least one APOE ɛ4 allele | Clinical diagnosis, Aβ-PET SUVr, CSF Aβ and p-tau181 levels, prediction of longitudinal cognitive decline | Biomarker: plasma p-tau181 Analytical platform: Lumipulse G p-tau181 Immunoreaction Cartridges (Fujirebio Diagnostics, Malvern, PA) on the fully automated Lumipulse G1200 instrument (Fujirebio) | Distinguishing Aβ+ AD cases from Aβ–CU: Plasma p-tau181: 2.35 pg/mL (AUC 0.96, SS 70.6%, SP 93.3%, accuracy 91.1%, PPV 54.5%, NPV 96.5%) |
| Tissot et al., 2022 [82] | TRIAD cohort: 284 individuals (30 CUY, 162 CU, 60 MCI, and 32 AD) Mean age: CUY 22.7 years, CU 72.3 years, CUY male 37%, CU male 43%, CUY 27% had an APOE ɛ4 allele, CU 37% had an APOE ɛ4 allele | Clinical diagnosis, Aβ-PET and tau-PET SUVr, hippocampal volume, and CSF p-tau181 level | Biomarker: plasma p-tau181 and p-tau231 Analytical platform: Simoa (Quanterix®, Billerica, MA, USA) | CUY as the healthy group: Plasma p-tau181: 15.085 pg/mL (AUC 0.96, SS 87.5%, SP 93.3%) Plasma p-tau231: 17.652 pg/mL (AUC 0.94, SS 81.2%, SP 93.3%) |
| Mielke et al., 2022 [7] | Community-based prospective MCSA, 1,329 participants (1,161 CU, 153 MCI; 15 dementia) Median age 72.3, 54.9% male, 26.6% had an APOE ɛ4 allele | Aβ-PET and tau-PET SUVr | Biomarker: plasma p-tau181 and p-tau217 Analytical platform: ECL + MSD (Eli Lilly Research Laboratory®, Indianapolis, IN) | 1.96 SD above the mean among participants who were CU and Aβ-PET –: Plasma p-tau181 (all participants):≥1.75 pg/mL–1 (≥1.57 pg/mL–1 after excluding participants with any of the three comorbidities) (AUC 0.80) Plasma p-tau217 (all participants):≥0.26 pg/mL–1 (≥0.25 pg/mL–1 when excluding participants with any of the three comorbidities) (AUC 0.85) Comorbidities: stroke, myocardial infarction, and chronic kidney disease |
| Groot et al., 2022 [118] | Cohort-1: a cross-sectional cohort of CU, MCI due to AD, selected from the Swedish BioFINDER study (27 CU and 25 MCI) Cohort-2: a longitudinal cohort selected at the Memory Clinic at Skåne University Hospital in Malmö, Sweden, MCI only Mean age 72.3, 52% male, 48.0% had an APOE ɛ4 allele | CSF p-tau217, CSF Aβ40 and Aβ42 levels, Aβ-PET SUVr | Biomarker: plasma p-tau217 Analytical platform: Simoa (Janssen Research and Development®) and ECL + MSD (Eli Lilly Research Laboratory®, Indianapolis, IN) | Aβ positivity: Plasma p-tau217 (Janssen): ≥0.07 (0.05–0.08) pg/mL (AUC 0.85, SS 75%, SP 85%, accuracy 80%) Plasma p-tau217 (Lilly): ≥0.26 (0.20–0.31) pg/mL (AUC 0.88, SS 81%, SP 85%, accuracy 83%) Progression to AD dementia: Plasma p-tau217 (Janssen): ≥0.08 (0.05–0.10) pg/mL (AUC 0.88, SS 84%, SP 81%, accuracy 82%) Plasma p-tau217 (Lilly): ≥0.31 (0.25–0.39) pg/mL (AUC 0.89, SS 85%, SP 84%, accuracy 84%) |
| Doré et al., 2022 [119] | AIBL and ADNeT cohorts: 397 participants (56% CU, 22% MCI, 21% dementia) Mean age 75.2, 59.0% male, 55.4% had an APOE ɛ4 allele | Aβ-PET SUVr (NAV4694 Aβ-PET), tau-PET SUVr (F-MK6240 tau-PET) | Biomarker: plasma p-tau217 Analytical platform: Simoa (Quanterix®, Billerica, MA, USA). | Discriminating Aβ-PET+ from Aβ-PET–in the entire cohort: Plasma p-tau217: ≥126.7 fg/mL (accuracy 85%, SS 79%, SP 89%, PPV 84%, and NPV 85%) |
| Cognitively impaired: Plasma p-tau217: ≥126.7 fg/mL (SS 82%, SP 82%, PPV 92%, and NPV 65%) | ||||
| Cognitively unimpaired: Plasma p-tau217: ≥100.3 fg/mL (SS 80%, SP 83%, PPV 49%, and NPV 95%) Applying Plasma p-tau217: ≥126.7 fg/mL to CU sample: SS 72%, SP 90%, PPV 66%, and NPV 92% | ||||
| Palmqvist et al., 2021 [28] | 340 participants from BioFINDER (164 SCD, 176 MCI) Mean age 70.7 years, 51% male 543 participants from ADNI (106 SCD, 437 MCI) Mean ages 73.2 (converted to AD dementia) and 71.2 (not converted to AD dementia), 47.8% male | CSF Aβ42/40 and 18F-florbetapir PET | Biomarker: plasma p-tau217 and p-tau181 Analytical platform: ECL + MSD (Eli Lilly Research Laboratory®, Indianapolis, IN) | 2 SD above the mean for each sample: Plasma p-tau181: 38.2 pg/mL–1 Plasma p-tau217: 0.387 pg/mL–1 |
| Plasma Aβ only | ||||
| Author | Population, sample size, and design | Proxies of diagnosis, the standard of truth, or outcome | Biomarker and analytical platform | Cut-off/Threshold |
| Ossenkoppele et al., 2021 [120] | 400 participants from the Swedish BioFINDER-2 at Lund University (219 CU, 181 MCI/dementia) Mean age 67.7 years, 51% male, 53.0% had an APOE ɛ4 allele 371 participants from ADNI (242 CU, 129 MCI/dementia) Mean age 73.2 years, 44% male, 39.0% had an APOE ɛ4 allele | CSF tau levels and tau-PET SUVr | Biomarker: plasma p-tau181 Analytical platform: Simoa (Quanterix®, Billerica, MA, USA) Biomarker: plasma p-tau217 Analytical platform: ECL + MSD (Eli Lilly Research Laboratory®, Indianapolis, IN) Plasma p-tau181 and plasma/CSF p-tau217 were available in BioFINDER-2 only | 2 SD above the mean in 224 tau-PET- CU: Plasma p-tau181: 11.9 pg/ml Plasma p-tau217: 2.5 pg/ml |
| Shen et al., 2021 [121] | 1189 participants from ADNI Aggregated demographics of all sample not available | Aβ-PET SUVr, tau-PET SUVr, FDG-PET, and clinical diagnosis | Biomarker: plasma p-tau181 Analytical platform: Simoa (Quanterix®, Billerica, MA, USA) | Plasma p-tau181: ≥18.85 pg/mL at baseline (AUC 0.84, SS 81.1%, SP 81.6%) After adjusting for age, gender, years of education and APOE genotype: AUC 0.85, NPV 86.4% |
| Thijssen et al., 2020 [66] | Retrospective study, 404 participants from 3 independent cohorts: Primary cohort - total 362:301 from UCSF Memory and Aging Center; 61 from ARTFL consortium Secondary cohort - baseline data, total 42, Eli Lilly sponsored research study Mean age 64.3 years, 48.6% male, 28% had an APOE ɛ4 allele | Neuropathological examination at autopsy or by the presence of autosomal dominant mutations that lead to specific types of FTLD pathology Aβ-PET SUVr and CSF p-tau181 level, plasma NfL level, plasma Aβ42 and Aβ40 levels, FTP-PET, and brain atrophy measured with MRI | Biomarker: plasma p-tau181 Analytical platform: ECL + MSD (Eli Lilly Research Laboratory®, Indianapolis, IN) | AD (clinical diagnosis) from FTLD (clinical diagnosis) (age adjusted): Plasma p-tau181: ≥8.7 pg/mL (AUC 0.89, SS 98.2% SP 71.1%) Participants CU and Aβ-PET –(age adjusted): Plasma p-tau181: ≥8.0 pg/mL (AUC 0.91, SS 88,9%, SP 85,3%) Participants CU and Aβ-PET –: Plasma p-tau181: ≥7.1 pg/mL (AUC 0.86, SS 81,8%, SP 82,8%) |
| Plasma Aβ and p-tau combined (and other biomarkers) | ||||
| Author | Population, sample size, and design | Proxies of diagnosis, the standard of truth, or outcome | Biomarker and analytical platform | Cutoff/threshold |
| Gerards et al., 2022 [90] | 144 patients with SCD (n = 33), MCI (n = 57), or DAT (n = 54) at the Centre for Memory Disorders (ZfG) at the University Hospital of Cologne Mean age: 69.7 years with 31% of the patients being under the age of 65 (55% of SCD, 32% of MCI, and 15% of DAT patients) Male, n (%): SCD, 12 (36.4); MCI, 33 (57.9); DAT, 24 (44.4) | CSF Aβ42, p-tau, and t-tau levels, and CSF Aβ42/40 | Biomarker: plasma Aβ42, Aβ40, p-tau181, t-tau, and NfL Analytical platform: Simoa(Quanterix®, Billerica, MA, USA) | SCD versus MCI: Plasma p-tau181: ≥8.4 pg/mL (AUC 0.72, SS 80%, SP 55%) Plasma Aβ42/40:≤0.048 pg/mL (AUC 0.64, SS 80%, SP 47%) Plasma p-tau181/Aβ42: ≥0.58 (AUC 0.72, SS 80%, SP 50%) SCD versus DAT: Plasma Aβ40: ≥273.6 pg/mL (AUC 0.64, SS 80%, SP 42%) Plasma p-tau181: ≥12.2 pg/mL (AUC 0.85, SS 80%, SP 79%) Plasma NfL: ≥12.7 pg/mL (AUC 0.81, SS 80%, SP 67%) Plasma Aβ42/40: ≤0.048 (AUC 0.67, SS 80%, SP 47%) Plasma p-tau181/Aβ42: ≥0.77 (AUC 0.81, SS 80%, SP 75%) |
| Pereira et al., 2021 [122] | 317 individuals from the Swedish BioFINDER-2 cohort. Non-demented (n = 159) (52 CN, 40 SCD, 67 MCI), mean age 69.2 years, 54.7% male, 54.7% had an APOE ɛ4 allele Non-AD dementia (n = 35), mean age, 73.0 years, 68.6% male, 25.7% had an APOE ɛ4 allele AD dementia (n = 123), mean age 73.9 years, 45.5% male, 72.4% had an APOE ɛ4 allele Cohort-1: CU; 45–65 years old (subcohort 1) or 66–100 years old (subcohort 2); 50% APOE ɛ4 carriers Cohort-2: SCD or MCI; 40–100 years old Cohort-3: AD dementia; 40–100 years old Cohort-4: non-AD dementias and neurodegenerative disorders; (frontotemporal dementia, Parkinson’s disease with dementia, 22 subcortical vascular dementia, 22 Parkinson’s disease, 23 progressive supranuclear palsy, 24 multiple system atrophy, 25 corticobasal syndrome, or 26 semantic variant primary progressive aphasia); 40–100 years | CSF Aβ42 and Aβ40, CSF p-tau181 and p-tau217, cortical thickness, hippocampal volumes, tau-PET, and Aβ-PET SUVr, and global cognition | Biomarker: plasma Aβ42/40, plasma p-tau181, plasma p-tau217, and plasma NfL Analytical platform: EUROIMMUN immunoassays (EUROIMMUN AG) for plasma Aβ42 and Aβ40, MSD immunoassays for CSF Aβ42 and Aβ40; CSF and plasma p-tau181 and CSF and plasma p-tau217 immunoassays developed at Lilly Research Laboratories; and Simoa assay for CSF and plasma NfL (Quanterix) | Cut-offs that differentiated Aβ -negative CU from Aβ-positive patients with AD dementia Plasma Aβ42/40:0.16 pg/ml Plasma p-tau181:7.48 pg/ml Plasma p-tau217:3.04 pg/ml Plasma NfL: 17.58 pg/ml Data on the accuracy, sensitivity, and specificity not available |
| Plasma Aβ only | ||||
| Author | Population, sample size, and design | Proxies of diagnosis, the standard of truth, or outcome | Biomarker and analytical platform | Cut-off/Threshold |
| Palmqvist et al., 2020 [29] | Arizona-based neuropathology cohort (cohort-1), BioFINDER-2 cohort (cohort-2), and Colombia kindred registry of autosomal-dominant AD (cohort-3) Cohort-1:68 participants, 32 (47.1%) intermediate-to-high likelihood of AD; 36 (52.9%) non-AD cases Cohort-2:509 participants, 194 CU (38.1%), 123 MCI (24.2%), 121 AD (23.8%) and other neurodegenerative diseases, 71 (13.9%) Cohort-3:237 non-carriers, 359 mutation carriers (253 unimpaired carriers and 106 impaired carriers) Aggregated demographics of all samples not available | AD signature cortical thickness, hippocampal volumes, tau-PET, and Aβ-PET SUVr | Biomarker: plasma p-tau217 Analytical platform: ECL + MSD (Eli Lilly Research Laboratory®, Indianapolis, IN) Biomarker: plasma t-tau, plasma p-tau181, and NfL Analytical platform: Simoa (Quanterix®, Billerica, MA, USA) Biomarker: plasma Aβ42 and Aβ40 Analytical platform: Euroimmun ELISAs (Euroimmun®, Lubeck, Germany) | Cohort-1 cutoffs AD intermediate-to-high likelihood (high likelihood): Plasma p-tau217: 2.36 (4.21) pg/mL (SS 94%, SP 79% [SS 94%, SP 94% ]) Plasma p-tau217/Aβ42: 0.083 (0.085) (SS 88%, SP 89% [SS 94%, SP 89% ]) Plasma p-tau217/t-tau: 1.48 (2.40) (SS 82%, SP 85% [SS 88%, SP 96% ]) Plasma p-tau181: 2.66 (2.66) pg/mL (SS 71%, SP 77% [SS 94%, SP 77% ]) Plasma NfL: 41.9 (46.1) pg/mL (SS 82%, SP 32% [SS 88%, SP 23% ]) Cohort-2 cutoffs: Plasma p-tau217: 2.50 pg/mL (SS 93%, SP 88%) Plasma p-tau217/Aβ42: 0.095 (SS 82%, SP 92%) Plasma p-tau217/t-tau: 0.11 (SS 91%, SP 85%) Plasma p-tau181: 11.9 pg/mL (SS 50%, SP 89%) Plasma NfL: 26.5 pg/mL (SS 67%, SP 38%) Cohort-3 cutoffs not available |
Studies were published from 2020 to 2022 and selected based on novelty and importance. Only studies that reported cut-off values were included in the table. TRIAD, Translational Biomarkers in Aging and Dementia; MCSA, Mayo Clinic Study of Aging; BioFINDER, Biomarkers For Identifying Neurodegenerative Disorders Early and Reliably; AIBL, Australian Imaging, Biomarkers and Lifestyle study of aging; ADNeT, Australian Dementia Network; PARIS discovery, discovery cohort of the Plasma Test for Amyloidosis Risk Screening study; MissionAD, dataset of 437 biobanked patient samples; ADNI, Alzheimer’s disease neuroimaging initiative; UCSF, University of California San Francisco; ARTFL, Advancing Research and Treatment for Frontotemporal Lobar Degeneration; IA, immunoassay; ELISA, enzyme-linked immunosorbent assay; MSD, meso scale discovery; Simoa, single-molecule array; LC-MS/MS, liquid chromatography-tandem mass spectrometry; CU, cognitively unimpaired; SCD, subjective cognitive decline; MCI, mild cognitive impairment; AD, Alzheimer’s disease; DAT, dementia of Alzheimer type; Aβ+, amyloid-β positive; Aβ–, amyloid-β negative; FTLD, frontotemporal lobar degeneration; FTP-PET, Flortaucipir positron emission tomography; Aβ-PET, amyloid-β positron emission tomography; tau-PET positron emission tomography; SUVr, standardized update value ratio; APOE, apolipoprotein E; FDG-PET, 18F-fluorodeoxyglucose positron emission tomography; NfL, neurofilament light; t-tau, total tau; p-tau181 and p-tau217, phosphorylated tau at residues 181 and 217; CSF, cerebrospinal fluid; SD, standard deviation; AUC, area under the curve; PPV, positive predicted value; NPV, negative predictive value; CI, confidence interval; SS, sensitivity; SP, specificity; CUY, cognitively unimpaired young.
OTHER PROMISING BIOMARKERS OF ALZHEIMER’S DISEASE
In addition to the biomarkers that reflect the core pathological changes in AD, i.e., Aβ accumulation and tau protein phosphorylation, several other biomarkers—plasma-based or not—reflecting AD risk factors (e.g., APOE genotype, platelets) or downstream pathophysiological processes (e.g., axonal degeneration, astrocytosis) have been evaluated in AD. The NfL is a component of the neural cytoskeleton released after axonal damage. For many years, NfL was used as a neuroaxonal injury marker for its higher elevated levels in neurological conditions such as traumatic brain injury, amyotrophic lateral sclerosis, atypical parkinsonian disorders, multiple sclerosis, and neurocognitive dysfunction secondary to HIV infection [85]. An important characteristic of NfL in the plasma is a strong correlation to CSF NfL levels with demonstrated ability to differentiate frontotemporal dementia (FTD) from primary psychiatric disorders and Parkinson’s disease from atypical parkinsonian disorders [85–87]. This biomarker has shown consistently increased levels in patients with MCI and patients with AD dementia compared to cognitively unimpaired individuals [88, 89], and this is particularly true in patients with Aβ pathology. However, NfL performs better when separating AD dementia from patients with FTD (clinically diagnosed, AUC of 0.82) and AD from FTD-tau and FTD-TDP cases (neuropathologically confirmed, AUCs of 0.97 and 0.96) [44].
Ultrasensitive immunological assays and IP-MS methods in AD studies have demonstrated the ability to quantify concentrations of NfL even in cognitively unimpaired individuals with no age restrictions [87]. Gerards et al. reported an AUC of 0.81, a sensitivity of 80%, and a specificity of 67% using a Simoa-based assay comparing individuals with subjective cognitive decline and AD dementia [90]. Palmqvist et al., using the same analytical platform, showed that the plasma NfL could discriminate concentrations capable of differentiating subjects with and without Aβ pathology in two cohorts [29]. In the Arizona-based neuropathology cohort (cohort-1), a cut-off of 41.9 pg/mL had a sensitivity of 82% and specificity of 32% to discriminate between AD from non-AD cases. In the BioFINDER-2 cohort (cohort-2), the best cut-off for plasma NfL was 26.5 pg/mL (AUC of 0.51, sensitivity of 67%, and specificity of 38%) [29]. The findings from this study highlight the difficulty of generating a universally accepted cut-off value for different biomarkers in AD, probably due to the heterogeneity of the AD pathological continuum and the dissociation between AD pathology and cognitive decline, especially in the earliest stages of the AD pathological continuum.
Astroglial activation and astrocytosis may represent a link between amyloid pathology and tau pathology [91]. Oeckl et al. first reported an increase in plasma GFAP levels in AD patients compared to CU individuals and these levels were significantly correlated with cognitive decline [90]. Since then, studies have revealed important results conferring GFAP an essential role in AD biomarkers studies [91–97], albeit with significant variability. Pereira et al., for example, demonstrated that GFAP showed increased levels in subjects with amyloid pathology, predicting the positivity of Aβ-PET with an AUC of 0.76, superior performance to CSF GFAP, and other glial markers [89]. Interestingly, the association of plasma GFAP levels with Aβ pathology seems to be higher than the CSF GFAP levels [91]. Furthermore, higher plasma GFAP has been associated with brain amyloid pathology (Aβ-PET+), independent of the stage of cognitive decline (cognitively unimpaired, MCI, or clinical dementia) [96]. Finally, higher plasma GFAP has been associated with faster cognitive decline [95].
The association of plasma GFAP with other AD-related biomarkers can significantly improve the diagnostic performance of individual biomarkers. For example, one study showed that plasma GFAP levels were significantly higher in subjects with amyloid pathology with an AUC of 0.78 [98]. However, in a model including plasma GFAP and plasma Aβ42/40 ratio, the AUC was significantly increased to 0.92 [98]. Moreover, a biomarker panel including plasma GFAP and NfL with other known AD risk factors, e.g., age, sex, APOE genotype, showed an AUC of 0.91 in differentiating CU from AD dementia subjects, an AUC of 0.81 in differentiating CU from MCI subjects, and an AUC of 0.87 in predicting Aβ positivity [99].
Improvements have been made in developing more sensitive and specific assays that measure β-synuclein levels in blood [100]. This synaptic biomarker has its levels increased as an early sign of synaptic degeneration in AD [101, 102]. It has also been linked to plasma levels of p-tau181 and Aβ, suggesting an association with amyloid pathology. Additionally, no altered levels of β-synuclein were found in other tauopathies, and the underlying structural brain changes associated with β-synuclein levels are different from those related to plasma NfL and p-tau181 [103–105]. Taken together, these findings put this biomarker as an important tool in the early diagnosis of AD.
The APOE polymorphism can also be considered a biological marker since the presence of the allele ɛ4 of the apolipoprotein E represents the strongest genetic risk factor for the development of sporadic AD [106]. However, the APOE status alone is not sufficient to act as a biomarker for the diagnosis of AD [107, 108]. The primary applicability of the APOE status would be in combination with one or more biomarkers, as is the case of the PrecivityADTM test, which combines the plasma Aβ42/40 ratio with the APOE status and the individual’s age to provide a score that estimates the probability of the presence of amyloid plaques [37].
Platelets have been postulated as an important peripheral source of biomarkers for the presence of neurodegeneration associated with AD [52, 109, 110]. They carry virtually almost all circulating amyloid-β protein precursor (AβPP), and the ratio of the levels of two different forms of AβPP (130/110 kDa) has been correlated with the clinical diagnosis of AD, independently of age, and related to the degree of cognitive impairment [111–113]. In addition, platelet tau has been linked to AD-related brain atrophy and a clinical outcome measured by the Clinical Dementia Rating (CDR) scale [114]. In their pioneer work, Guzmán-Martínez et al. reported a higher ratio of heavy tau (HMWtau) and low molecular weight tau (LMWtau) in human platelets correlating with the decrease in the brain volume as measured by structural magnetic resonance imaging as being a reliable biomarker of AD, which the authors named Alz-tau® [115]. This biomarker adds to other different available approaches in the diagnostic workup of AD. However, studies that compare the accuracy of Alz-tau® with other well-established biomarkers of AD, e.g., Aβ-PET and CSF, are lacking, and there are only a few studies available in the literature focused on this biomarker. In addition, the role of tau platelet as a biomarker of AD has been questioned [116].
IMPORTANT QUESTIONS TO BE ADDRESSED BEFORE CLINICAL IMPLEMENTATION
Despite the rapid advances in the development of plasma AD biomarkers, many challenges and open questions still need to be addressed before its widespread implementation in clinical settings.
Table 3
Estimated costs of different biomarkers modalities in the diagnostic workup of Alzheimer’s disease
| Cost of biomarker assessment | Additional cost for the technical procedure (e.g., lumbar puncture) | Additional cost for expert consultation | Primary care routine use, interpretation, and triage possible*** | Comments | |
| PET (Reference: Aβ-PET) | $3,000–$8,000* | No** | Yes | No | PET scan interpretation depends heavily on the clinical judgment of dementia experts. |
| Not fully supported by the Centers for Medicare and Medicaid Services (CMS) and commercial insurance coverage varies. | |||||
| Covered by Medicare in Coverage with Evidence Development (CED) programs | |||||
| CSFa (Reference: Aβ + p-tau assay) | $200–$1,000b | Yes | Yes | Yes | An increase in the number of spinal taps would represent a concurrent increase in adverse events (post-lumbar puncture headache, back discomfort/pain, bleeding, and brainstem herniation) |
| Blooda (Reference: Aβ IP-MS assay) | $100–$500c | No** | Yes | Yes | Significant potential increase in the number of people seeking out an evaluation by a dementia expert after the assessment |
*Great variability in costs due to availability and different costs of PET ligands. **Venipuncture is included in the cost of biomarker assessment. ***Considering the feasibility of inclusion in the primary care routine assessment of cognitive decline. acosts of equipment implementation not shown; bcost of liquid chromatography with tandem mass spectrometry (LC-MS/MS)-based assay; an approved Lumipulse assay is believed to cost under $500; cprojected costs; the PrecivityADTM test from C2N Diagnostics, for example, still costs $1,250 per analysis. PET, positron emission tomography; Aβ, amyloid-beta; CSF, cerebrospinal fluid; IP-MS, immunoprecipitation mass spectrometry [132, 138–143].
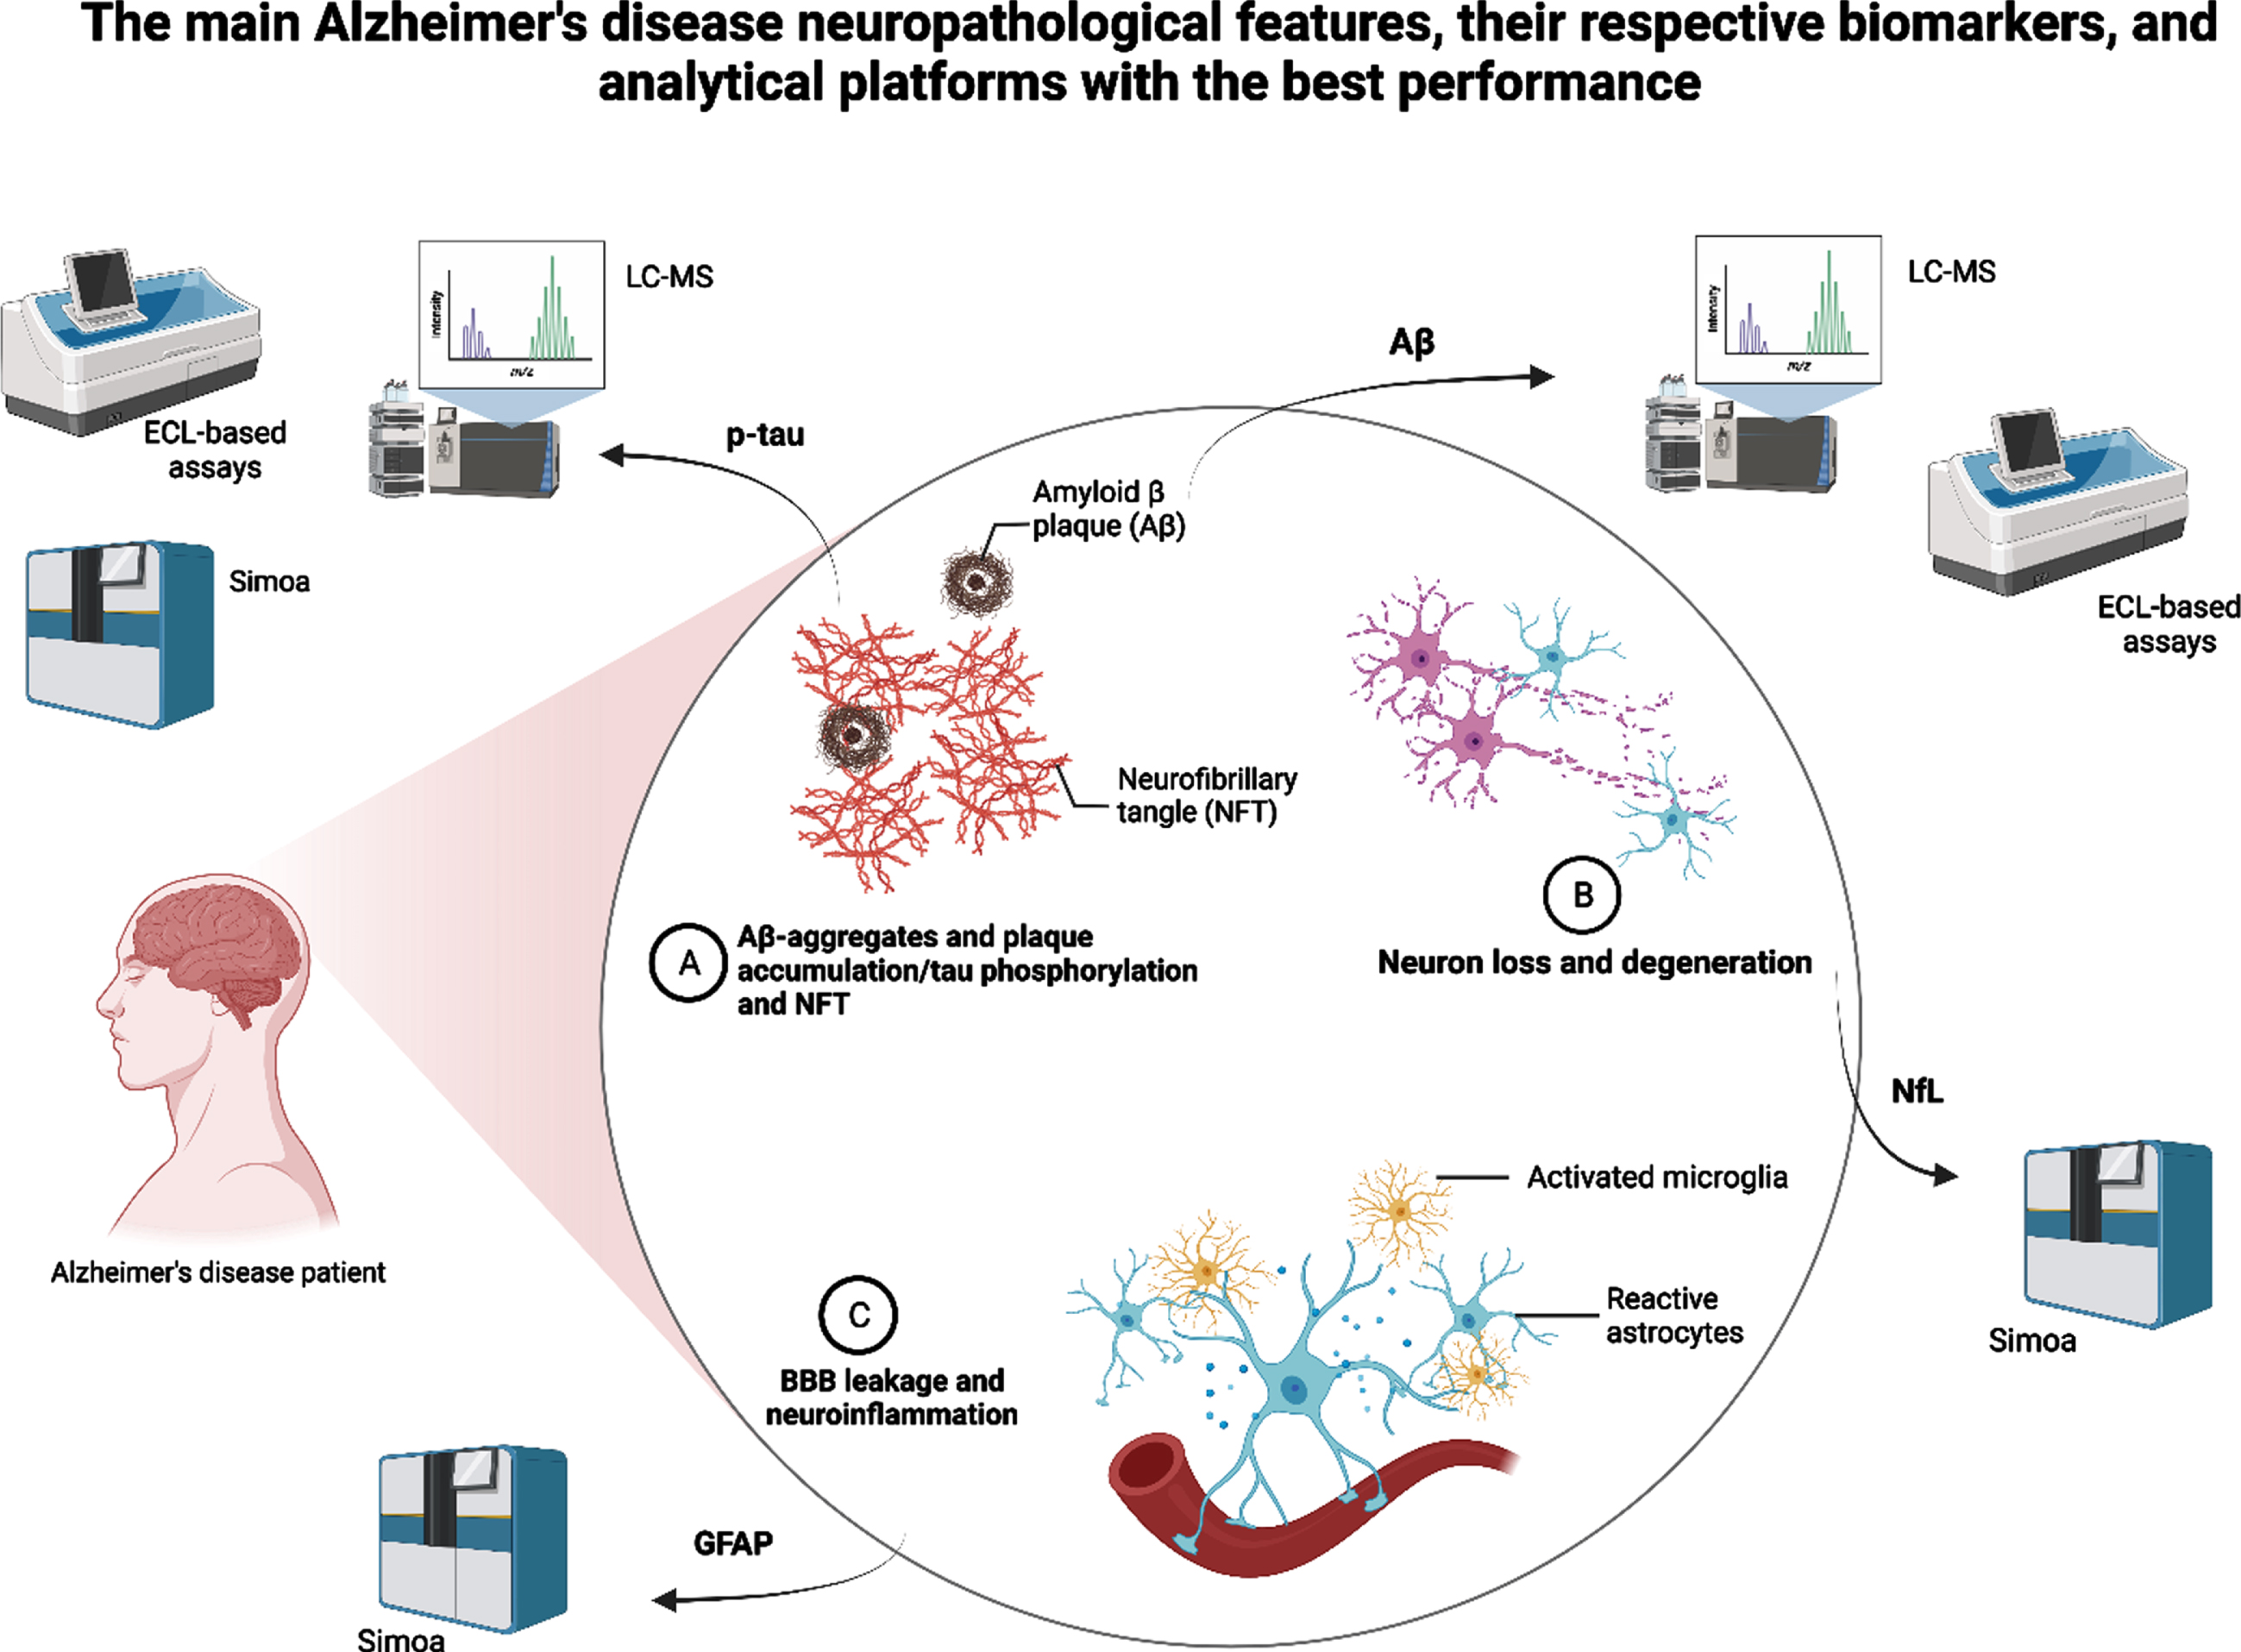
Fig. 1
Summary of the main Alzheimer’s disease neuropathological features, their respective and most promising biomarkers, and the analytical platforms that showed the best performance in recent studies. LC-MS, liquid chromatography-mass spectrometry; ECL, electrochemiluminescence; Simoa, single-molecule array; p-tau, plasma phosphorylated tau; Aβ, amyloid-beta; GFAP, glial fibrillary acidic protein.
Which is the best analytical platform for plasma biomarkers of AD?
Since blood is a more complex biological matrix than CSF, there are many challenges in studying plasma biomarkers. Pre-analytical, analytical, and post-analytical factors can impact the accuracy of the results. These confounding factors include the handling of samples, the aging process and the presence of comorbidities, the reduced plasma concentration of brain proteins, the presence of blood proteases, and the metabolization and elimination dynamics of different proteins [2, 9–12, 120]. The plasma NfL, for example, is highly affected by age and by renal function [123]. Chronic kidney disease significantly interfered with determining a reference value for plasma p-tau levels in a study using a community sample [6]. Furthermore, the intra- and inter-assay variability and differences across methods preclude the determination of a unified cut-off for most of these biomarkers. However, Cullen et al. further investigated test-retest variability of plasma biomarkers of AD, and the authors reported that this effect can be surpassed by combining different biomarkers in a panel [50].
In the face of a multiplicity of platforms and techniques available for plasma biomarker analysis, it is difficult to determine, solely based on the reported results, which is the best platform available. Two recent head-to-head studies attempted to address this issue. Janelidze et al. compared plasma Aβ42/40 ratio measurements from eight different assays [26] and of p-tau181, p-tau217, and p-tau231 measured by ten different assays [31] to detect abnormal brain Aβ deposition and future progression to AD dementia. MS-based methods performed better than immunoassays to measure plasma Aβ40 and Aβ42 across all studied cohorts and for different outcome measures [26]. Both IP-MS-based methods from Washington University, St. Louis, US [34] and Shimadzu, Kyoto, Japan [46] showed the highest accuracy [26]. One significant result was the differences in accuracy between results from the head-to-head study and the original studies (AUCs range 0.82–0.87 versus 0.88–0.97, respectively), underpinning the impact of confounding factors such as cohort characteristics, matrix interferences, and assay procedures on the analytical results [26].
Another study focusing on p-tau biomarkers showed that MS-based methods had the best analytical performance, especially for the plasma p-tau217 [31]. The findings from head-to-head studies show that the MS-based methods may show, to date, the most accurate and reliable platforms to analyze plasma biomarkers of AD. Nonetheless, these methods still need further validation studies, especially for p-tau biomarkers, and lower costs before implementation as a preferred tool for future clinical use.
How to use the reported cut-off values of the most promising biomarkers?
A recent meta-analysis showed that the diagnostic effectiveness of plasma Aβ42 was not influenced by different cut-off values, with a pooled sensitivity of 88% and a specificity of 81%. This was also true for studies that defined different cut-off values for plasma tau biomarkers [68]. Therefore, studies that define cut-off values should clearly explain their applied methods, allowing better use of the results portrayed. Furthermore, these studies should elucidate confounding factors while developing methods to predict their impact in deriving statistical models and interpreting results [124].
Although studies report similar methods and platforms, current recommendations are that cut-off values should be defined internally for different populations. Currently, most multicenter studies still use the same analytical site to perform analyses of samples from different populations [27, 46]. However, this reality could change as researchers run worldwide trials using different analytical sites when plasma biomarkers become broadly used and universally accepted cut-off values are available.
On the other hand, these findings point to possible large-scale implementation issues since the biomarkers’ cut-offs will depend on the analytical method and reference cohort and may hinder the interpretability of the biomarkers’ results in clinical settings. Therefore, current recommendations are that cut-off values should be defined internally for different populations. In this context, studies must provide clear information about the analytical methods, cohort characteristics, the present thresholds for positive and negative results, sensitivity and specificity values, and positive and negative predictive values, standard accuracy metrics for proper clinical implementation [125].
What to do with “mismatches” and “gray zones” frequently found in studies?
Clinicians are often challenged with unexpectedly dubious results, “mismatches,” and “gray zones” in biomarkers analyses. As previously reported, many biomarkers still present overlapping results between positive and negative cases mainly because the prediction of outcomes is not possible in a certain range of biomarker values [50]. In addition, studies have shown high misdiagnosis rates when judgment is based solely on clinical criteria. For example, a study showed that in a non-neglectable part of the cases, the etiologic diagnoses were changed after patients underwent neuroimaging biomarker assessments [126]. Interestingly, many clinically diagnosed AD patients will present with no evidence of AD neuropathological changes at postmortem assessments [127]. The high number of “mismatches” between biomarker levels and outcome measures, when added to other analytical factors and random errors, can be major obstacles in setting a universal cut-off value and preclude their widespread use [50, 106, 128]. In the face of such challenges, we recommend using these biomarkers in clinical practice to be parsimonious and aligned with sound clinical judgment [50]. In addition, using biomarkers’ ratios, such as the plasma Aβ42/40 ratio, seems to improve accuracy and minimize analytical and methodological issues and should be included in the diagnostic workup [48, 129]. Finally, due to the dynamic aspect of the neuropathology of AD, combining biomarker changes with longitudinal follow-up would help improve diagnostic capabilities [27].
Which is the best plasma biomarker to reflect AD pathology?
Evidence has been mounting as plasma biomarkers present consistent results providing useful prognostic information in the AD continuum. Recent advances in the development of plasma Aβ and plasma p-tau assays may profoundly impact the field in the next few years [26, 31, 118]. These biomarkers already outperform clinical evaluation in predicting outcomes of subjects with SCD and MCI [50]. However, studies need to answer a pressing question: which is the best plasma biomarker of AD pathology? Recent studies have been showing the best results for plasma p-tau231 and p-tau217 using Simoa, MSD, or MS-based methods. When compared to other plasma biomarkers, these plasma p-tau biomarkers have the strongest correlation with early Aβ pathology and longitudinal accumulation [2, 130]. However, confounding factors deserve further investigation since they make interpreting of results not straightforward. In addition, an ideal biomarker would be not invasive, cost-effective, and readily available for clinical use. This ideal biomarker should also be scalable and available for serial measures. Mass spectrometry-based methods are still costly and not widely available.
In another direction, combining biomarkers in a panel could represent a way to improve the screening possibilities for clinical use. A combination of biomarkers showed very high accuracy in many studies [7, 32, 36, 46, 94], reaching approximately 90% when using Aβ-PET as a standard for comparison [46]. Palmqvist et al. showed that a model combining plasma Aβ42/40, plasma p-tau181, and the APOE status accurately predicted Aβ positivity and progression to AD dementia in 6 years (AUCs from 0.88 to 0.93). The techniques used were Elecsys-based fully automated assays [131]. Although a panel of biomarkers would still maintain costs very high, precluding clinical dissemination, using plasma biomarkers in different combinations could represent the best screening tool for distinguishing patients in the AD continuum. Nonetheless, further investigation would still be needed to establish a diagnosis.
FUTURE DIRECTIONS
The dynamic field of plasma biomarkers of AD has been advancing at high speed in the last few years. As a result, much research has been dedicated to improving the analytical methods and laboratory platforms. The ultimate goal is to find a clinically accessible tool to help with the timely diagnosis of AD, especially in its pre-clinical stages. However, many challenges still exist. These include the lack of universally accepted reference values for fluid biomarkers of AD, although many studies have consistently presented accurate results. In addition, the multiple analytical methods still present significant variability in their results, preventing further use and reproducibility.
To overcome these challenges, future studies should address important questions. First, studies should include head-to-head comparisons of different analytical methods. In head-to-head analyses, the performance of different assays, platforms, and protein species can be investigated together, resulting in more robust evidence. Second, studies should follow standard operating procedures to control for pre-analytical and analytical biases, investigating test re-test variability of different laboratory methods. Also, studies need long follow-up periods for better prediction of desired outcomes, e.g., progression from normal cognitive performance to dementia or from low to high brain amyloid burden. Finally, studies need to investigate sex differences and include diverse populations [132], focusing on underrepresented minority groups, such as Black and Hispanics, and socioeconomically disadvantaged groups. For example, a recent study investigated the impact of race on the predictive ability of biomarkers algorithms and found inconsistent results with the use of cut-offs across different racial groups [133].
Furthermore, the results reported by most studies underpin the idea that all analyses have improved accuracy when other biomarkers or risk factors are added to the plasma biomarker under evaluation. The combination of biomarkers in a composite panel seems to improve outcome prediction in most studies. Different from other reported panels of potential biomarkers [134], studies reporting such improvements have selected patients based on established AD biomarkers making it easier to interpret results. The high costs of the most promising methods have been addressed with investments in fully automated assays with comparable performance to most advanced techniques and are easier to implement. Thus, many groups have established highly accurate in-house reference values. Nevertheless, a consensus is still needed to achieve substantial advancements in the field. The EU/US CTAD Task Force meeting held in May 2022 [135] was a step in this direction, with discussions about the scientific progress, the current barriers and limitations, and future steps in the pathway to implementing these biomarkers in clinical practice.
Novel biomarkers are still under investigation with studies showing significant results with new PET tracers, e.g., the novel 18F MAO-B PET tracer (S)-(2-methylpyrid-5-yl)-6-[(3-18F-fluoro-2-hydroxy)propoxy] quinoline (18F-SMBT-1), binding significantly higher in the brain of Aβ+ compared with Aβ–healthy controls [136], and the combination of different genetic loci such as the coat protein complex I G2 (COPG2) and the WW domain-containing oxidoreductase (WWOX) genes with known biomarkers to develop better predictive models to diagnose AD [137].
CONCLUSION
The first identification of plasma biomarkers of AD was a breakthrough in the field. Incorporating new ultra-highly sensitive techniques played an important role in advancing studies with plasma AD biomarkers. Many studies have also provided an overview of the recommendations and most promising biomarkers available and are shedding new light on technical aspects that need clarification before widespread implementation. Furthermore, although the costs of such assays are still high, the recent advances allowed for the development of a blood test now available for clinical use based on plasma Aβ. Other biomarkers must soon follow. Recently, research has been focusing on real-world scenarios and aspects that may affect the interpretation of the results of plasma biomarkers studies in different populations. These steps anticipate the widespread use of plasma biomarkers of AD.
ACKNOWLEDGMENTS
The authors have no acknowledgments to report.
FUNDING
The Laboratory of Neuroscience (LIM-27) receives financial support from Fundação de Amparo à Pesquisa do Estado de São Paulo (FAPESP, Project 14/50873-3) and Associação Beneficente Alzira Denise Hertzog da Silva (ABADHS). Dr. Diniz is supported by the NIH (National Institute of Health; grants R01MH115953 and R01MH118311).
CONFLICT OF INTEREST
The authors have no conflict of interest to report.
REFERENCES
[1] | Teunissen CE , Verberk IMW , Thijssen EH , Vermunt L , Hansson O , Zetterberg H , van der Flier WM , Mielke MM , Del Campo M ((2022) ) Blood-based biomarkers for Alzheimer’s disease: Towards clinical implementation. Lancet Neurol 21: , 66–77. |
[2] | Hansson O , Edelmayer RM , Boxer AL , Carrillo MC , Mielke MM , Rabinovici GD , Salloway S , Sperling R , Zetterberg H , Teunissen CE ((2022) ) The Alzheimer’s Association appropriate use recommendations for blood biomarkers in Alzheimer’s disease. Alzheimers Dement 18: , 2669–2686. |
[3] | Hardy JA , Higgins GA ((1992) ) Alzheimer’s disease: The amyloid cascade hypothesis. Science 256: , 184–185. |
[4] | Ashton NJ , Pascoal TA , Karikari TK , Benedet AL , Lantero-Rodriguez J , Brinkmalm G , Snellman A , Schöll M , Troakes C , Hye A , Gauthier S , Vanmechelen E , Zetterberg H , Rosa-Neto P , Blennow K ((2021) ) Plasma p-tau231: A new biomarker for incipient Alzheimer’s disease pathology. Acta Neuropathol 141: , 709–724. |
[5] | Schindler SE , Bateman RJ ((2021) ) Combining blood-based biomarkers to predict risk for Alzheimer’s disease dementia. Nat Aging 1: , 26–28. |
[6] | Simrén J , Leuzy A , Karikari TK , Hye A , Benedet AL , Lantero-Rodriguez J , Mattsson-Carlgren N , Schöll M , Mecocci P , Vellas B , Tsolaki M , Kloszewska I , Soininen H , Lovestone S , Aarsland D ;AddNeuroMed consortium, Hansson O , Rosa-Neto P , Westman E , Blennow K , Zetterberg H , Ashton NJ ((2021) ) The diagnostic and prognostic capabilities of plasma biomarkers in Alzheimer’s disease. Alzheimers Dement 17: , 1145–1156. |
[7] | Mielke MM , Dage JL , Frank RD , Algeciras-Schimnich A , Knopman DS , Lowe VJ , Bu G , Vemuri P , Graff-Radford J , Jack CR Jr, Petersen RC ((2022) ) Performance of plasma phosphorylated tau 181 and 217 in the community. Nat Med 28: , 1398–1405. |
[8] | West T , Kirmess KM , Meyer MR , Holubasch MS , Knapik SS , Hu Y , Contois JH , Jackson EN , Harpstrite SE , Bateman RJ , Holtzman DM , Verghese PB , Fogelman I , Braunstein JB , Yarasheski KE ((2021) ) A blood-based diagnostic test incorporating plasma Aβ42/40 ratio, ApoE proteotype, and age accurately identifies brain amyloid status: Findings from a multi cohort validity analysis. Mol Neurodegener 16: , 30. |
[9] | Kaplow J , Vandijck M , Gray J , Kanekiyo M , Huyck E , Traynham CJ , Esquivel R , Fagan AM , Luthman J ((2020) ) Concordance of Lumipulse cerebrospinal fluid t-tau/Aβ42 ratio with amyloid PET status. Alzheimers Dement 16: , 144–152. |
[10] | Hampel H , Hardy J , Blennow K , Chen C , Perry G , Kim SH , Villemagne VL , Aisen P , Vendruscolo M , Iwatsubo T , Masters CL , Cho M , Lannfelt L , Cummings JL , Vergallo A ((2021) ) The amyloid-β pathway in Alzheimer’s disease. Mol Psychiatry 26: , 5481–5503. |
[11] | Wren MC , Lashley T , Årstad E , Sander K ((2018) ) Large inter and intracase variability of first-generation tau PET ligand binding in neurodegenerative dementias. Acta Neuropathol Commun 6: , 34. |
[12] | O’Bryant SE , Mielke MM , Rissman RA , Lista S , Vanderstichele H , Zetterberg H , Lewczuk P , Posner H , Hall J , Johnson L , Fong YL , Luthman J , Jeromin A , Batrla-Utermann R , Villarreal A , Britton G , Snyder PJ , Henriksen K , Grammas P , Gupta V , Martins R , Hampel H ; Biofluid Based Biomarker Professional Interest Area ((2017) ) Blood-based biomarkers in Alzheimer disease: Current state of the science and a novel collaborative paradigm for advancing from discovery to clinic. Alzheimers Dement 13: , 45–58. |
[13] | Blennow K , Hampel H , Zetterberg H ((2014) ) Biomarkers in amyloid-beta immunotherapy trials in Alzheimer’s disease. Neuropsychopharmacology 39: , 189–201. |
[14] | Strozyk D , Blennow K , White LR , Launer LJ ((2003) ) CSF Abeta 42 levels correlate with amyloid-neuropathology in a population-based autopsy study. Neurology 60: , 652–656. |
[15] | Mehta PD , Pirttila T , Patrick BA , Barshatzky M , Mehta SP ((2001) ) Amyloid beta protein 1-40 and 1-42 levels in matched cerebrospinal fluid and plasma from patients with Alzheimer disease. Neurosci Lett 304: , 102–106. |
[16] | Fagan AM , Mintun MA , Mach RH , Lee SY , Dence CS , Shah AR , LaRossa GN , Spinner ML , Klunk WE , Mathis CA , DeKosky ST , Morris JC , Holtzman DM ((2006) ) Inverse relation between in vivo amyloid imaging load andcerebrospinal fluid Abeta42 in humans. Ann Neurol 59: , 512–519. |
[17] | Freeman SH , Raju S , Hyman BT , Frosch MP , Irizarry MC ((2007) ) Plasma Abeta levels do not reflect brain Abeta levels. J Neuropathol Exp Neurol 66: , 264–271. |
[18] | Hansson O , Zetterberg H , Vanmechelen E , Vanderstichele H , Andreasson U , Londos E , Wallin A , Minthon L , Blennow K ((2010) ) Evaluation of plasma Abeta(40) and Abeta(42) as predictors of conversion to Alzheimer’s disease in patients with mild cognitive impairment. Neurobiol Aging 31: , 357–367. |
[19] | Herskovits AZ , Locascio JJ , Peskind ER , Li G , Hyman BT ((2013) ) A Luminex assay detects amyloid β oligomers in Alzheimer’s disease cerebrospinal fluid. PLoS One 8: , e67898. |
[20] | Song F , Poljak A , Valenzuela M , Mayeux R , Smythe GA , Sachdev PS ((2011) ) Meta-analysis of plasma amyloid-β levels in Alzheimer’s disease. J Alzheimers Dis 26: , 365–375. |
[21] | Rissin DM , Kan CW , Campbell TG , Howes SC , Fournier DR , Song L , Piech T , Patel PP , Chang L , Rivnak AJ , Ferrell EP , Randall JD , Provuncher GK , Walt DR , Duffy DC ((2010) ) Single-molecule enzyme-linked immunosorbent assay detects serum proteins at subfemtomolar concentrations. Nat Biotechnol 28: , 595–599. |
[22] | Wilson DH , Rissin DM , Kan CW , Fournier DR , Piech T , Campbell TG , Meyer RE , Fishburn MW , Cabrera C , Patel PP , Frew E , Chen Y , Chang L , Ferrell EP , von Einem V , McGuigan W , Reinhardt M , Sayer H , Vielsack C , Duffy DC ((2016) ) The Simoa HD-1 Analyzer: A novel fully automated digital immunoassay analyzer with single-molecule sensitivity and multiplexing. J Lab Autom 21: , 533–547. |
[23] | Kuhle J , Barro C , Andreasson U , Derfuss T , Lindberg R , Sandelius AA , Liman V , Norgren N , Blennow K , Zetterberg H ((2016) ) Comparison of three analytical platforms for quantification of the neurofilament light chain in blood samples: ELISA, electrochemiluminescence immunoassay and Simoa. Clin Chem Lab Med 54: , 1655–1661. |
[24] | Selectscience.net. Quanterix granted Breakthrough Device for pTau-181 assay. [online] Available at: https://www.selectscience.net/product-news/quanterix-granted-breakthrough-device-designation-from-u-s-fda-for-blood-based-ptau-181-assay-for-alzheimers-disease/?&compID=8859&artID=58156. Accessed on October 10, 2022. |
[25] | Mielke MM , Hagen CE , Xu J , Chai X , Vemuri P , Lowe VJ , Airey DC , Knopman DS , Roberts RO , Machulda MM , Jack CR Jr, Petersen RC , Dage JL ((2018) ) Plasma phospho-tau181 increases with Alzheimer’s disease clinical severity and is associated with tau- and amyloid-positron emission tomography. Alzheimers Dement 14: , 989–997. |
[26] | Lue LF , Kuo YM , Sabbagh M ((2019) ) Advance in plasma AD core biomarker development: Current findings from immunomagnetic reduction-based SQUID technology. Neurol Ther 8: , 95–111. |
[27] | Janelidze S , Teunissen CE , Zetterberg H , Allué JA , Sarasa L , Eichenlaub U , Bittner T , Ovod V , Verberk IMW , Toba K , Nakamura A , Bateman RJ , Blennow K , Hansson O ((2021) ) Head-to-head comparison of 8plasma amyloid-β 42/40 assays in Alzheimer disease. JAMA Neurol 78: , 1375–1382. |
[28] | Palmqvist S , Tideman P , Cullen N , Zetterberg H , Blennow K ; Alzheimer’s Disease Neuroimaging Initiative, Dage JL , Stomrud E , Janelidze S , Mattsson-Carlgren N , Hansson O ((2021) ) Prediction of future Alzheimer’s disease dementia using plasma phospho-tau combined with other accessible measures. Nat Med 27: , 1034–1042. |
[29] | Palmqvist S , Janelidze S , Quiroz YT , Zetterberg H , Lopera F , Stomrud E , Su Y , Chen Y , Serrano GE , Leuzy A , Mattsson-Carlgren N , Strandberg O , Smith R , Villegas A , Sepulveda-Falla D , Chai X , Proctor NK , Beach TG , Blennow K , Dage JL , Reiman EM , Hansson O ((2020) ) Discriminative accuracy of plasma phospho-tau217 for Alzheimer disease vs other neurodegenerative disorders. JAMA 324: , 772–781. |
[30] | Yamashita K , Miura M , Watanabe S , Ishiki K , Arimatsu Y , Kawahira J , Kubo T , Sasaki K , Arai T , Hagino K , Irino Y , Nagai K , Verbel D , Koyama A , Dhadda S , Niiro H , Iwanaga S , Sato T , Yoshida T , Iwata A ((2022) ) Fully automated and highly specific plasma β-amyloid immunoassays predict β-amyloid status defined by amyloid positron emission tomography with high accuracy. Alzheimers Res Ther 14: , 86. |
[31] | Rogers MB , Alzheimer Research Forum, News. [online]. Available at: https://www.alzforum.org/news/community-news/fda-approves-fujirebios-csf-test-ad-quest-diagnostic-offers-plasma-test. Accessed on October 10, 2022. |
[32] | Janelidze S , Bali D , Ashton NJ , Barthélemy NR , Vanbrabant J , Stoops E , Vanmechelen E , He Y , Dolado AO , Triana-Baltzer G , Pontecorvo MJ , Zetterberg H , Kolb H , Vandijck M , Blennow K , Bateman RJ , Hansson O (2022) Head-to-head comparison of 10 plasma phospho-tau assays in prodromal Alzheimer’s disease. Brain. doi: 10.1093/brain/awac333. |
[33] | Hu Y , Kirmess KM , Meyer MR , Rabinovici GD , Gatsonis C , Siegel BA , Whitmer RA , Apgar C , Hanna L , Kanekiyo M , Kaplow J , Koyama A , Verbel D , Holubasch MS , Knapik SS , Connor J , Contois JH , Jackson EN , Harpstrite SE , Bateman RJ , Holtzman DM , Verghese PB , Fogelman I , Braunstein JB , Yarasheski KE , West T ((2022) ) Assessment of a plasma amyloid probability score to estimate amyloid positron emission tomography findings among adults with cognitive impairment. JAMA Netw Open 5: , e228392. |
[34] | Ovod V , Ramsey KN , Mawuenyega KG , Bollinger JG , Hicks T , Schneider T , Sullivan M , Paumier K , Holtzman DM , Morris JC , Benzinger T , Fagan AM , Patterson BW , Bateman RJ ((2017) ) Amyloid β concentrations and stable isotope labeling kinetics of human plasma specific to central nervous system amyloidosis. Alzheimers Dement 13: , 841–849. Erratum in: Alzheimers Dement 13, 1185. |
[35] | Schindler SE , Bollinger JG , Ovod V , Mawuenyega KG , Li Y , Gordon BA , Holtzman DM , Morris JC , Benzinger TLS , Xiong C , Fagan AM , Bateman RJ ((2019) ) High-precision plasma β-amyloid 42/40 predicts current and future brain amyloidosis. Neurology 93: , 1647–1659. |
[36] | Fda.gov. [online]. Available at: https://www.fda.gov/medical-devices/in-vitro-diagnostics/laboratory-developed-tests. Accessed on October 10, 2022. |
[37] | Kirmess KM , Meyer MR , Holubasch MS , Knapik SS , Hu Y , Jackson EN , Harpstrite SE , Verghese PB , West T , Fogelman I , Braunstein JB , Yarasheski KE , Contois JH ((2021) ) The Precivity AD™ test:Accurate and reliable LC-MS/MS assays for quantifying plasma amyloidbeta 40 and 42 and apolipoprotein E proteotype for the assessment ofbrain amyloidosis. Clin Chim Acta 519: , 267–275. |
[38] | Quest Diagnostics. [online] Available at: https://testdirectory.questdiagnostics.com/test/test-guides/TS_AD_Detect_BetaRatioPlasma/quest-ad-detect-beta-amyloid-4240-ratio-plasma?p=td. Accessed on December 12, 2022. |
[39] | Roche Diagnostics. [online] Available at: https://diagnostics.roche.com/us/en/news-listing/2022/elecsys-amyloid-plasma-panel-fda-breakthrough-device-designation-alzheimers.html. Accessed on December 12, 2022. |
[40] | Cummings J ((2019) ) The role of biomarkers in Alzheimer’s disease drug development. Adv Exp Med Biol 1118: , 29–61. |
[41] | Pannee J , Törnqvist U , Westerlund A , Ingelsson M , Lannfelt L , Brinkmalm G , Persson R , Gobom J , Svensson J , Johansson P , Zetterberg H , Blennow K , Portelius E ((2014) ) The amyloid-β degradation pattern in plasma–a possible tool for clinical trials in Alzheimer’s disease. Neurosci Lett 573: , , 7–12. Erratum in: Neurosci Lett 599, 67-68. |
[42] | Janelidze S , Stomrud E , Palmqvist S , Zetterberg H , van Westen D , Jeromin A , Song L , Hanlon D , Tan Hehir CA , Baker D , Blennow K , Hansson O ((2016) ) Plasma β-amyloid in Alzheimer’s disease and vascular disease. Sci Rep 6: , 26801. |
[43] | Verberk IMW , Hendriksen HMA , van Harten AC , Wesselman LMP , Verfaillie SCJ , van den Bosch KA , Slot RER , Prins ND , Scheltens P , Teunissen CE , Van der Flier WM ((2020) ) Plasma amyloid is associated with the rate of cognitive decline in cognitively normal elderly: The SCIENCe project. Neurobiol Aging 89: , 99–107. |
[44] | Thijssen EH , La Joie R , Strom A , Fonseca C , Iaccarino L , Wolf A , Spina S , Allen IE , Cobigo Y , Heuer H , VandeVrede L , Proctor NK , Lago AL , Baker S , Sivasankaran R , Kieloch A , Kinhikar A , Yu L , Valentin MA , Jeromin A , Zetterberg H , Hansson O , Mattsson-Carlgren N , Graham D , Blennow K , Kramer JH , Grinberg LT , Seeley WW , Rosen H , Boeve BF , Miller BL , Teunissen CE , Rabinovici GD , Rojas JC , Dage JL , Boxer AL ; Advancing Research and Treatment for Frontotemporal Lobar Degeneration investigators ((2021) ) Plasma phosphorylated tau 217 and phosphorylated tau 181 as biomarkers in Alzheimer’s disease and frontotemporal lobar degeneration: A retrospective diagnostic performance study. Lancet Neurol 20: , 739–752. Erratum in: Lancet Neurol 20, 6. |
[45] | Leuzy A , Mattsson-Carlgren N , Palmqvist S , Janelidze S , Dage JL , Hansson O ((2022) ) Blood-based biomarkers for Alzheimer’s disease. EMBO Mol Med 14: , 14408. |
[46] | Nakamura A , Kaneko N , Villemagne VL , Kato T , Doecke J , Doré V , Fowler C , Li QX , Martins R , Rowe C , Tomita T , Matsuzaki K , Ishii K , Ishii K , Arahata Y , Iwamoto S , Ito K , Tanaka K , Masters CL , Yanagisawa K ((2018) ) High performance plasma amyloid-βbiomarkers for Alzheimer’s disease. Nature 554: , 249–254. |
[47] | Koyama A , Okereke OI , Yang T , Blacker D , Selkoe DJ , Grodstein F ((2012) ) Plasma amyloid-beta as a predictor of dementia and cognitive decline: A systematic review and meta-analysis. Arch Neurol 69: , 824–831. |
[48] | Palmqvist S , Janelidze S , Stomrud E , Zetterberg H , Karl J , Zink K , Bittner T , Mattsson N , Eichenlaub U , Blennow K , Hansson O ((2019) ) Performance of fully automated plasma assays as screening tests for Alzheimer disease-related β-amyloid status. JAMA Neurol 76: , 1060–1069. |
[49] | Li Y , Schindler SE , Bollinger JG , Ovod V , Mawuenyega KG , Weiner MW , Shaw LM , Masters CL , Fowler CJ , Trojanowski JQ , Korecka M , Martins RN , Janelidze S , Hansson O , Bateman RJ ((2022) ) Validation of plasma amyloid-β 42/40 for detecting Alzheimer disease amyloid plaques. Neurology 98: , 688–699. |
[50] | Hansson O , Lehmann S , Otto M , Zetterberg H , Lewczuk P ((2019) ) Advantages and disadvantages of the use of the CSF Amyloid β (Aβ) 42/40 ratio in the diagnosis of Alzheimer’s Disease. Alzheimers Res Ther 11: , 34. |
[51] | Cullen NC , Janelidze S , Mattsson-Carlgren N , Palmqvist S , Bittner T , Suridjan I , Jethwa A , Kollmorgen G , Brum WS , Zetterberg H , Blennow K , Stomrud E , Hansson O ((2023) ) Test-retest variability of plasma biomarkers in Alzheimer’s disease and its effects on clinical prediction models. Alzheimers Dement 19: , 797–806. |
[52] | Zainaghi IA , Talib LL , Diniz BS , Gattaz WF , Forlenza OV ((2012) ) Reduced platelet amyloid precursor protein ratio (APP ratio) predicts conversion from mild cognitive impairment to Alzheimer’s disease, J Neural Transm (Vienna) 119: , 815–819. |
[53] | Roeben B , Maetzler W , Vanmechelen E , Schulte C , Heinzel S , Stellos K , Godau J , Huber H , Brockmann K , Wurster I , Gaenslen A , Grüner E , Niebler R , Eschweiler GW , Berg D ; TREND study team ((2016) ) Association of plasma Aβ40 peptides, but not Aβ42, with coronary artery disease and diabetes mellitus. J Alzheimers Dis 52: , 161–169. |
[54] | Hilal S , Akoudad S , van Duijn CM , Niessen WJ , Verbeek MM , Vanderstichele H , Stoops E , Ikram MA , Vernooij MW ((2017) ) Plasma amyloid-β levels, cerebral small vessel disease, and cognition: The Rotterdam Study. J Alzheimers Dis 60: , 977–987. |
[55] | Lopez OL , Kuller LH , Mehta PD , Becker JT , Gach HM , Sweet RA , Chang YF , Tracy R , DeKosky ST ((2008) ) Plasma amyloid levels and the risk of AD in normal subjects in the Cardiovascular Health Study. Neurology 70: , 1664–1671. |
[56] | Burnham SC , Bourgeat P , Doré V , Savage G , Brown B , Laws S , Maruff P , Salvado O , Ames D , Martins RN , Masters CL , Rowe CC , Villemagne VL ; AIBL Research Group ((2016) ) Clinical and cognitivetrajectories in cognitively healthy elderly individuals withsuspected non-Alzheimer’s disease pathophysiology (SNAP) orAlzheimer’s disease pathology: A longitudinal study. Lancet Neurol 15: , 1044–1053. |
[57] | Petersen RC , Wiste HJ , Weigand SD , Rocca WA , Roberts RO , Mielke MM , Lowe VJ , Knopman DS , Pankratz VS , Machulda MM , Geda YE , Jack CR Jr ((2016) ) Association of elevated amyloid levels with cognition andbiomarkers in cognitively normal people from the community. JAMANeurol 73: , 85–92. Erratum in: JAMA Neurol 73, 481. |
[58] | Dage JL , Wennberg AMV , Airey DC , Hagen CE , Knopman DS , Machulda MM , Roberts RO , Jack CR Jr, Petersen RC , Mielke MM ((2016) ) Levels of tau protein in plasma are associated with neurodegeneration and cognitive function in a population-based elderly cohort. Alzheimers Dement 12: , 1226–1234. |
[59] | Olsson B , Lautner R , Andreasson U , Öhrfelt A , Portelius E , Bjerke M , Hölttä M , Rosén C , Olsson C , Strobel G , Wu E , Dakin K , Petzold M , Blennow K , Zetterberg H ((2016) ) CSF and bloodbiomarkers for the diagnosis of Alzheimer’s disease: A systematicreview and meta-analysis. Lancet Neurol 15: , 673–684. |
[60] | Mielke MM , Hagen CE , Wennberg AMV , Airey DC , Savica R , Knopman DS , Machulda MM , Roberts RO , Jack CR Jr, Petersen RC , Dage JL ((2017) ) Association of plasma total tau level with cognitive decline and risk of mild cognitive impairment or dementia in the Mayo Clinic Study on Aging. JAMA Neurol 74: , 1073–1080. |
[61] | Mattsson N , Zetterberg H , Janelidze S , Insel PS , Andreasson U , Stomrud E , Palmqvist S , Baker D , Tan Hehir CA , Jeromin A , Hanlon D , Song L , Shaw LM , Trojanowski JQ , Weiner MW , Hansson O , Blennow K ; ADNI Investigators ((2016) ) Plasma tau in Alzheimer disease. Neurology 87: , 1827–1835. |
[62] | Pase MP , Beiser AS , Himali JJ , Satizabal CL , Aparicio HJ , DeCarli C , Chêne G , Dufouil C , Seshadri S ((2019) ) Assessment of plasma total tau level as a predictive biomarker for dementia and related endophenotypes. JAMA Neurol 76: , 598–606. |
[63] | Maccioni RB , Farías G , Morales I , Navarrete L ((2010) ) Therevitalized tau hypothesis on Alzheimer’s disease. Arch MedRes 41: , 226–231. |
[64] | Hardy J , Selkoe DJ ((2002) ) The amyloid hypothesis of Alzheimer’s disease: Progress and problems on the road to therapeutics. Science 297: , 353–356. |
[65] | Janelidze S , Mattsson N , Palmqvist S , Smith R , Beach TG , Serrano GE , Chai X , Proctor NK , Eichenlaub U , Zetterberg H , Blennow K , Reiman EM , Stomrud E , Dage JL , Hansson O ((2020) ) Plasma P-tau181 in Alzheimer’s disease: Relationship to other biomarkers, differential diagnosis, neuropathology and longitudinal progression to Alzheimer’s dementia. Nat Med 26: , 379–386. |
[66] | Thijssen EH , La Joie R , Wolf A , Strom A , Wang P , Iaccarino L , Bourakova V , Cobigo Y , Heuer H , Spina S , VandeVrede L , Chai X , Proctor NK , Airey DC , Shcherbinin S , Duggan Evans C , Sims JR , Zetterberg H , Blennow K , Karydas AM , Teunissen CE , Kramer JH , Grinberg LT , Seeley WW , Rosen H , Boeve BF , Miller BL , Rabinovici GD , Dage JL , Rojas JC , Boxer AL ; Advancing Research and Treatment for Frontotemporal Lobar Degeneration (ARTFL) investigators ((2020) ) Diagnostic value of plasma phosphorylated tau181 in Alzheimer’s disease and frontotemporal lobar degeneration. Nat Med 26: , 387–397. |
[67] | Karikari TK , Pascoal TA , Ashton NJ , Janelidze S , Benedet AL , Rodriguez JL , Chamoun M , Savard M , Kang MS , Therriault J , Schöll M , Massarweh G , Soucy JP , Höglund K , Brinkmalm G , Mattsson N , Palmqvist S , Gauthier S , Stomrud E , Zetterberg H , Hansson O , Rosa-Neto P , Blennow K ((2020) ) Blood phosphorylated tau 181 as a biomarker for Alzheimer’s disease: A diagnostic performance and prediction modelling study using data from four prospective cohorts. Lancet Neurol 19: , 422–433. |
[68] | Moscoso A , Grothe MJ , Ashton NJ , Karikari TK , Rodriguez JL , Snellman A , Suárez-Calvet M , Zetterberg H , Blennow K , Schöll M ; Alzheimer’s Disease Neuroimaging Initiative ((2021) ) Time course ofphosphorylated-tau181 in blood across the Alzheimer’s disease spectrum. Brain 144: , 325–339. |
[69] | Karikari TK , Benedet AL , Ashton NJ , Lantero Rodriguez J , Snellman A , Suárez-Calvet M , Saha-Chaudhuri P , Lussier F , Kvartsberg H , Rial AM , Pascoal TA , Andreasson U , Schöll M , Weiner MW , Rosa-Neto P , Trojanowski JQ , Shaw LM , Blennow K , Zetterberg H ; Alzheimer’s Disease Neuroimaging Initiative ((2021) ) Diagnostic performance andprediction of clinical progression of plasma phospho-tau181 in theAlzheimer’s Disease Neuroimaging Initiative. Mol Psychiatry 26: , 429–442. |
[70] | Brickman AM , Manly JJ , Honig LS , Sanchez D , Reyes-Dumeyer D , Lantigua RA , Lao PJ , Stern Y , Vonsattel JP , Teich AF , Airey DC , Proctor NK , Dage JL , Mayeux R ((2021) ) Plasma p-tau181, p-tau217, and other blood-based Alzheimer’s disease biomarkers in a multi-ethnic, community study. Alzheimers Dement 17: , 1353–1364. |
[71] | Palmqvist S , Insel PS , Stomrud E , Janelidze S , Zetterberg H , Brix B , Eichenlaub U , Dage JL , Chai X , Blennow K , Mattsson N , Hansson O ((2019) ) Cerebrospinal fluid and plasma biomarker trajectories with increasing amyloid deposition in Alzheimer’s disease. EMBO Mol Med 11: , e11170. |
[72] | Fossati S , Ramos Cejudo J , Debure L , Pirraglia E , Sone JY , Li Y , Chen J , Butler T , Zetterberg H , Blennow K , de Leon MJ ((2019) ) Plasma tau complements CSF tau and P-tau in the diagnosis of Alzheimer’s disease. Alzheimers Dement (Amst) 11: , 483–492. |
[73] | Tzen KY , Yang SY , Chen TF , Cheng TW , Horng HE , Wen HP , Huang YY , Shiue CY , Chiu MJ ((2014) ) Plasma Aβ but not tau is related to brain PiB retention in early Alzheimer’s disease. ACS Chem Neurosci 5: , 830–836. |
[74] | Zetterberg H , Wilson D , Andreasson U , Minthon L , Blennow K , Randall J , Hansson O ((2013) ) Plasma tau levels in Alzheimer’s disease. Alzheimers Res Ther 5: , 9. |
[75] | Chen YR , Liang CS , Chu H , Voss J , Kang XL , O’Connell G , Jen HJ , Liu D , Shen Hsiao ST , Chou KR ((2021) ) Diagnostic accuracy of blood biomarkers for Alzheimer’s disease and amnestic mild cognitive impairment: A meta-analysis. Ageing Res Rev 71: , 101446. |
[76] | Barthélemy NR , Horie K , Sato C , Bateman RJ ((2020) ) Blood plasmaphosphorylated-tau isoforms track CNS change in Alzheimer’s disease. J Exp Med 217: , e20200861. |
[77] | Lantero Rodriguez J , Karikari TK , Suárez-Calvet M , Troakes C , King A , Emersic A , Aarsland D , Hye A , Zetterberg H , Blennow K , Ashton NJ ((2020) ) Plasma p-tau181 accurately predicts Alzheimer’sdisease pathology at least 8 years prior to post-mortem and improvesthe clinical characterisation of cognitive decline. Acta Neuropathol 140: , 267–278. |
[78] | Janelidze S , Stomrud E , Smith R , Palmqvist S , Mattsson N , Airey DC , Proctor NK , Chai X , Shcherbinin S , Sims JR , Triana-Baltzer G , Theunis C , Slemmon R , Mercken M , Kolb H , Dage JL , Hansson O ((2020) ) Cerebrospinal fluid p-tau217 performs better than p-tau181 as a biomarker of Alzheimer’s disease. Nat Commun 11: , 1683. |
[79] | Janelidze S , Berron D , Smith R , Strandberg O , Proctor NK , Dage JL , Stomrud E , Palmqvist S , Mattsson-Carlgren N , Hansson O ((2021) ) Associations of plasma phospho-Tau217 levels with tau positronemission tomography in early Alzheimer disease. JAMA Neurol 78: , 149–156. |
[80] | Suárez-Calvet M , Karikari TK , Ashton NJ , Lantero Rodríguez J , Milà-Alomà M , Gispert JD , Salvadó G , Minguillon C , Fauria K , Shekari M , Grau-Rivera O , Arenaza-Urquijo EM , Sala-Vila A , Sánchez-Benavides G , González-de-Echávarri JM , Kollmorgen G , Stoops E , Vanmechelen E , Zetterberg H , Blennow K , Molinuevo JL ; ALFA Study ((2020) ) Novel tau biomarkers phosphorylatedat T181, T217 or T231 rise in the initial stages of the pre-clinicalAlzheimer’s continuum when only subtle changes in Aβpathology are detected. EMBO Mol Med 12: , e12921. |
[81] | Ashton NJ , Benedet AL , Pascoal TA , Karikari TK , Lantero-Rodriguez J , Brum WS , Mathotaarachchi S , Therriault J , Savard M , Chamoun M , Stoops E , Francois C , Vanmechelen E , Gauthier S , Zimmer ER , Zetterberg H , Blennow K , Rosa-Neto P ((2022) ) Cerebrospinal fluid p-tau231 as an early indicator of emerging pathology in Alzheimer’s disease. EBioMedicine 76: , 103836. |
[82] | Tissot C , Therriault J , Kunach P , L Benedet A , Pascoal TA , Ashton NJ , Karikari TK , Servaes S , Lussier FZ , Chamoun M , Tudorascu DL , Stevenson J , Rahmouni N , Poltronetti NM , Pallen V , Bezgin G , Kang MS , Mathotaarachchi SS , Wang YT , Fernandez Arias J , Ferreira PCL , Ferrari-Souza JP , Vanmechelen E , Blennow K , Zetterberg H , Gauthier S , Rosa-Neto P ((2022) ) Comparing tau status determined via plasma pTau181, pTau231 and [18F]MK6240 tau-PET. EBioMedicine 76: , 103837. |
[83] | Dhillon S ((2021) ) Aducanumab: First approval. Drugs 81: , 1437–1443. |
[84] | van Dyck CH , Swanson CJ , Aisen P , Bateman RJ , Chen C , Gee M , Kanekiyo M , Li D , Reyderman L , Cohen S , Froelich L , Katayama S , Sabbagh M , Vellas B , Watson D , Dhadda S , Irizarry M , Kramer LD , Iwatsubo T ((2023) ) Lecanemab in early Alzheimer’s disease. N Engl J Med 388: , 9–21. |
[85] | Ashton NJ , Janelidze S , Al Khleifat A , Leuzy A , van der Ende EL , Karikari TK , Benedet AL , Pascoal TA , Lleó A , Parnetti L , Galimberti D , Bonanni L , Pilotto A , Padovani A , Lycke J , Novakova L , Axelsson M , Velayudhan L , Rabinovici GD , Miller B , Pariante C , Nikkheslat N , Resnick SM , Thambisetty M , Schöll M , Fernández-Eulate G , Gil-Bea FJ , López de Munain A , Al-Chalabi A , Rosa-Neto P , Strydom A , Svenningsson P , Stomrud E , Santillo A , Aarsland D , van Swieten JC , Palmqvist S , Zetterberg H , Blennow K , Hye A , Hansson O ((2021) ) A multicentre validation study ofthe diagnostic value of plasma neurofilament light. NatCommun 12: , 3400. |
[86] | Hansson O , Janelidze S , Hall S , Magdalinou N , Lees AJ , Andreasson U , Norgren N , Linder J , Forsgren L , Constantinescu R , Zetterberg H , Blennow K ; Swedish BioFINDER study ((2017) ) Blood-based NfL: A biomarker for differential diagnosis of the parkinsonian disorder. Neurology 88: , 930–937. |
[87] | Rohrer JD , Woollacott IO , Dick KM , Brotherhood E , Gordon E , Fellows A , Toombs J , Druyeh R , Cardoso MJ , Ourselin S , Nicholas JM , Norgren N , Mead S , Andreasson U , Blennow K , Schott JM , Fox NC , Warren JD , Zetterberg H ((2016) ) Serum neurofilament light chain protein is a measure of disease intensity in frontotemporal dementia. Neurology 87: , 1329–1336. |
[88] | Preische O , Schultz SA , Apel A , Kuhle J , Kaeser SA , Barro C , Gräber S , Kuder-Buletta E , LaFougere C , Laske C , Vöglein J , Levin J , Masters CL , Martins R , Schofield PR , Rossor MN , Graff-Radford NR , Salloway S , Ghetti B , Ringman JM , Noble JM , Chhatwal J , Goate AM , Benzinger TLS , Morris JC , Bateman RJ , Wang G , Fagan AM , McDade EM , Gordon BA , Jucker M ; Dominantly Inherited Alzheimer Network ((2019) ) Serum neurofilament dynamics predicts neurodegeneration and clinical progression in presymptomatic Alzheimer’s disease. Nat Med 25: , 277–283. |
[89] | Mattsson N , Andreasson U , Zetterberg H , Blennow K ; Alzheimer’s Disease Neuroimaging Initiative ((2017) ) Association of plasma neurofilament light with neurodegeneration in patients with Alzheimer disease. JAMA Neurol 74: , 557–566. |
[90] | Gerards M , Schild AK , Meiberth D , Rostamzadeh A , Vehreschild JJ , Wingen-Heimann S , Johannis W , Martino Adami P , Onur OA , Ramirez A , Karikari TK , Ashton NJ , Zetterberg H , Blennow K , Maier F , Jessen F ((2022) ) Alzheimer’s disease plasma biomarkers distinguish clinical diagnostic groups in memory clinic patients. Dement Geriatr Cogn Disord 51: , 182–192. |
[91] | Pereira JB , Janelidze S , Smith R , Mattsson-Carlgren N , Palmqvist S , Teunissen CE , Zetterberg H , Stomrud E , Ashton NJ , Blennow K , Hansson O ((2021) ) Plasma GFAP is an early marker of amyloid-β but not tau pathology in Alzheimer’s disease. Brain 144: , 3505–3516. |
[92] | Oeckl P , Halbgebauer S , Anderl-Straub S , Steinacker P , Huss AM , Neugebauer H , von Arnim CAF , Diehl-Schmid J , Grimmer T , Kornhuber J , Lewczuk P , Danek A ; Consortium for Frontotemporal Lobar Degeneration German, Ludolph AC , Otto M ((2019) ) Glial fibrillary acidic protein in serum is increased in Alzheimer’s disease and correlates with cognitive impairment. J Alzheimers Dis 67: , 481–488. |
[93] | Elahi FM , Casaletto KB , La Joie R , Walters SM , Harvey D , Wolf A , Edwards L , Rivera-Contreras W , Karydas A , Cobigo Y , Rosen HJ , DeCarli C , Miller BL , Rabinovici GD , Kramer JH ((2020) ) Plasma biomarkers of astrocytic and neuronal dysfunction in early- and late-onset Alzheimer’s disease. Alzheimers Dement 16: , 681–695. |
[94] | Benedet AL , Milà-Alomà M , Vrillon A , Ashton NJ , Pascoal TA , Lussier F , Karikari TK , Hourregue C , Cognat E , Dumurgier J , Stevenson J , Rahmouni N , Pallen V , Poltronetti NM , Salvadó G , Shekari M , Operto G , Gispert JD , Minguillon C , Fauria K , Kollmorgen G , Suridjan I , Zimmer ER , Zetterberg H , Molinuevo JL , Paquet C , Rosa-Neto P , Blennow K , Suárez-Calvet M ; Translational Biomarkers in Aging and Dementia (TRIAD) study, Alzheimer’s and Families (ALFA) study, and BioCogBank Paris Lariboisière cohort ((2021) ) Differences between plasma and cerebrospinal fluid glialfibrillary acidic protein levels across the Alzheimer diseasecontinuum. JAMA Neurol 78: , 1471–1483. |
[95] | Mayo S , Benito-León J , Peña-Bautista C , Baquero M , Cháfer-Pericás C ((2021) ) Recent evidence in epigenomics andproteomics biomarkers for early and minimally invasive diagnosis ofAlzheimer’s and Parkinson’s diseases. Curr Neuropharmacol 19: , 1273–1303. |
[96] | Chatterjee P , Pedrini S , Ashton NJ , Tegg M , Goozee K , Singh AK , Karikari TK , Simrén J , Vanmechelen E , Armstrong NJ , Hone E , Asih PR , Taddei K , Doré V , Villemagne VL , Sohrabi HR , Zetterberg H , Masters CL , Blennow K , Martins RN ((2022) ) Diagnostic and prognosticplasma biomarkers for pre-clinical Alzheimer’s disease. Alzheimers Dement 18: , 1141–1154. |
[97] | Bellaver B , Ferrari-Souza JP , Uglione da Ros L , Carter SF , Rodriguez-Vieitez E , Nordberg A , Pellerin L , Rosa-Neto P , Leffa DT , Zimmer ER ((2021) ) Astrocyte biomarkers in Alzheimer disease: A systematic review and meta-analysis. Neurology 96: , e2944–e2955. |
[98] | Oeckl P , Anderl-Straub S , Von Arnim CAF , Baldeiras I , Diehl-Schmid J , Grimmer T , Halbgebauer S , Kort AM , Lima M , Marques TM , Ortner M , Santana I , Steinacker P , Verbeek MM , Volk AE , Ludolph AC , Otto M ((2022) ) Serum GFAP differentiates Alzheimer’s disease from frontotemporal dementia and predicts MCI-to-dementia conversion. J Neurol Neurosurg Psychiatry 93: , 659–667. |
[99] | Chatterjee P , Pedrini S , Stoops E , Goozee K , Villemagne VL , Asih PR , Verberk IMW , Dave P , Taddei K , Sohrabi HR , Zetterberg H , Blennow K , Teunissen CE , Vanderstichele HM , Martins RN ((2021) ) Plasma glial fibrillary acidic protein is elevated in cognitively normal older adults at risk of Alzheimer’s disease. Transl Psychiatry 11: , 27. |
[100] | Verberk IM , Laarhuis MB , van den Bosch KA , Jarith L , Ebenau MD , Leeuwenstijn M , Prins ND , Scheltens P , Teunissen CE , Flier WM ((2021) ) Serum markers glial fibrillary acidic protein and neurofilament light for prognosis and monitoring in cognitively normal older people: A prospective memory clinic-based cohort study. Lancet Healthy Long 2: , e87–e95. |
[101] | Parvizi T , König T , Wurm R , Silvaieh S , Altmann P , Klotz S , Rommer PS , Furtner J , Regelsberger G , Lehrner J , Traub-Weidinger T , Gelpi E , Stögmann E ((2022) ) Real-world applicability of glial fibrillary acidic protein and neurofilament light chain in Alzheimer’s disease. Front Aging Neurosci 14: , 887498. |
[102] | Oeckl P , Halbgebauer S , Anderl-Straub S , von Arnim CAF , Diehl-Schmid J , Froelich L , Grimmer T , Hausner L , Denk J , Jahn H , Steinacker P , Weishaupt JH , Ludolph AC , Otto M ((2020) ) Targeted mass spectrometry suggests beta-synuclein as synaptic blood marker in Alzheimer’s disease. J Proteome Res 19: , 1310–1318. |
[103] | de Wilde MC , Overk CR , Sijben JW , Masliah E ((2016) ) Meta-analysis of synaptic pathology in Alzheimer’s disease reveals selective molecular vesicular machinery vulnerability. Alzheimers Dement 12: , 633–644. |
[104] | Oeckl P , Anderl-Straub S , Danek A , Diehl-Schmid J , Fassbender K , Fliessbach K , Halbgebauer S , Huppertz HJ , Jahn H , Kassubek J , Kornhuber J , Landwehrmeyer B , Lauer M , Prudlo J , Schneider A , Schroeter ML , Steinacker P , Volk AE , Wagner M , Winkelmann J , Wiltfang J , Ludolph AC , Otto M ; FTLD Consortium ((2023) ) Relationship of serum beta-synuclein with blood biomarkers and brain atrophy. Alzheimers Dement 19: , 1358–1371. |
[105] | Oeckl P , Wagemann O , Halbgebauer S , Anderl-Straub S , Nuebling G , Prix C , Loosli SV , Wlasich E , Danek A , Steinacker P , Ludolph AC , Levin J , Otto M ((2022) ) Serum beta-synuclein is higher in Down syndrome and precedes rise of pTau181. Ann Neurol 92: , 6–10. |
[106] | Roses A , Saunders A , Corder EH , Risch N , Haines J , Pericak-Vance M , Han SH , Einstein G , Hulette C , Schmechel D , Goedert M , Weisgraber K , Huang D , Strittmatter W ((1995) ) Apolipoprotein E4 and E2 are susceptibility genes that affect the rate of Alzheimer disease expressivity. J Cell Biochem 21: , 86. |
[107] | Lavados M , Farías G , Rothhammer F , Guillon M , Mujica MC , Maccioni C , Maccioni RB ((2005) ) ApoE alleles and tau markers inpatients with different levels of cognitive impairment. ArchMed Res 36: , 474–479. |
[108] | Vogelgsang J , Vukovich R , Wedekind D , Wiltfang J ((2019) ) Higher level of mismatch in APOEɛ4 carriers for amyloid-beta peptide Alzheimer’s disease biomarkers in cerebrospinal fluid. ASN Neuro 11: , 1759091419845524. |
[109] | Neumann K , Farías G , Slachevsky A , Perez P , Maccioni RB ((2011) ) Human platelets tau: A potential peripheral marker for Alzheimer’sdisease. J Alzheimers Dis 25: , 103–109. |
[110] | Veitinger M , Varga B , Guterres SB , Zellner M ((2014) ) Platelets, a reliable source for peripheral Alzheimer’s disease biomarkers? Acta Neuropathol Commun 2: , 65. |
[111] | Farías G , Pérez P , Slachevsky A , Maccioni RB ((2012) ) Platelet tau pattern correlates with cognitive status in Alzheimer’sdisease. J Alzheimers Dis 31: , 65–69. |
[112] | Farías GA , Arata L , Guzmán-Martínez L , Morales I , Tapia JP , Maccioni RB ((2015) ) Biochemical markers for Alzheimer’s andParkinson’s disease. Austin J Clin Neurol 2: , 1059. |
[113] | Talib LL , Joaquim HP , Forlenza OV ((2012) ) Platelet biomarkers in Alzheimer’s disease. World J Psychiatry 2: , 95–101. |
[114] | Slatchevsky A , Guzman-Martinez L , Delgado C , Reyes P , Farias GA , Munoz-Neira C , Bravo E , Farias M , Flores P , Garrido C , Becker JT , Lopez OL , Maccioni RB ((2017) ) Tau platelets correlate with regional brain atrophy in patients with Alzheimer’s disease. J Alzheimers Dis 55: , 1595–1603. |
[115] | Guzmán-Martínez L , Farías GA , Maccioni RB ((2012) ) Emerging noninvasive biomarkers for early detection of Alzheimer’sdisease. Arch Med Res 43: , 663–666. |
[116] | Sarg B , Korde DS , Marksteiner J , Humpel C ((2022) ) Platelet tau is associated with changes in depression and Alzheimer’s disease. Front Biosci (Landmark Ed) 27: , 153. |
[117] | Wilson EN , Young CB , Ramos Benitez J , Swarovski MS , Feinstein I , Vandijck M , Le Guen Y , Kasireddy NM , Shahid M , Corso NK , Wang Q , Kennedy G , Trelle AN , Lind B , Channappa D , Belnap M , Ramirez V , Skylar-Scott I , Younes K , Yutsis MV , Le Bastard N , Quinn JF , van Dyck CH , Nairn A , Fredericks CA , Tian L , Kerchner GA , Montine TJ , Sha SJ , Davidzon G , Henderson VW , Longo FM , Greicius MD , Wagner AD , Wyss-Coray T , Poston KL , Mormino EC , Andreasson KI ((2022) ) Performance of a fully automated Lumipulse plasma phospho-tau181 assay for Alzheimer’s disease. Alzheimers Res Ther 14: , 172. |
[118] | Groot C , Smith R , Stomrud E , Binette AP , Leuzy A , Wuestefeld A , Wisse LEM , Palmqvist S , Mattsson-Carlgren N , Janelidze S , Strandberg O , Ossenkoppele R , Hansson O (2022) Phospho-tau with subthreshold tau-PET predicts increased tau accumulation rates in amyloid positive individuals. Brain. doi: 10.1093/brain/awac329. |
[119] | Doré V , Doecke JD , Saad ZS , Triana-Baltzer G , Slemmon R , Krishnadas N , Bourgeat P , Huang K , Burnham S , Fowler C , Rainey-Smith SR , Bush AI , Ward L , Robertson J , Martins RN , Masters CL , Villemagne VL , Fripp J , Kolb HC , Rowe CC ((2022) ) Plasma p217+ tau versus NAV4694amyloid and MK6240 tau PET across the Alzheimer’s continuum. Alzheimers Dement (Amst) 14: , e12307. |
[120] | Ossenkoppele R , van der Kant R , Hansson O ((2022) ) Tau biomarkers in Alzheimer’s disease: Towards implementation in clinical practice and trials. Lancet Neurol 21: , 726–734. |
[121] | Shen XN , Huang YY , Chen SD , Guo Y , Tan L , Dong Q , Yu JT ; Alzheimer’s Disease Neuroimaging Initiative ((2021) ) Plasma phosphorylated-tau181 as a predictive biomarker for Alzheimer’s amyloid, tau and FDG PET status. Transl Psychiatry 11: , 585. |
[122] | Pereira JB , Janelidze S , Stomrud E , Palmqvist S , van Westen D , Dage JL , Mattsson-Carlgren N , Hansson O ((2021) ) Plasma markers predict changes in amyloid, tau, atrophy, and cognition in non-demented subjects. Brain 144: , 2826–2836. |
[123] | Akamine S , Marutani N , Kanayama D , Gotoh S , Maruyama R , Yanagida K , Sakagami Y , Mori K , Adachi H , Kozawa J , Maeda N , Otsuki M , Matsuoka T , Iwahashi H , Shimomura I , Ikeda M , Kudo T ((2020) ) Renal function is associated with blood neurofilament light chain level in older adults. Sci Rep 10: , 20350. |
[124] | Schindler SE , Karikari TK ((2022) ) Comorbidities confound Alzheimer’s blood tests. Nat Med 28: , 1349–1351. |
[125] | Hansson O , Mikulskis A , Fagan AM , Teunissen C , Zetterberg H , Vanderstichele H , Molinuevo JL , Shaw LM , Vandijck M , Verbeek MM , Savage M , Mattsson N , Lewczuk P , Batrla R , Rutz S , Dean RA , Blennow K ((2018) ) The impact of pre-analytical variables on measuring cerebrospinal fluid biomarkers for Alzheimer’s disease diagnosis: A review. Alzheimers Dement 14: , 1313–1333. |
[126] | Rabinovici GD , Gatsonis C , Apgar C , Chaudhary K , Gareen I , Hanna L , Hendrix J , Hillner BE , Olson C , Lesman-Segev OH , Romanoff J , Siegel BA , Whitmer RA , Carrillo MC ((2019) ) Association of amyloid positron emission tomography with subsequent change in clinical management among Medicare beneficiaries with mild cognitive impairment or dementia. JAMA 321: , 1286–1294. |
[127] | Suemoto CK , Ferretti-Rebustini RE , Rodriguez RD , Leite RE , Soterio L , Brucki SM , Spera RR , Cippiciani TM , Farfel JM , Chiavegatto Filho A , Naslavsky MS , Zatz M , Pasqualucci CA , Jacob-Filho W , Nitrini R , Grinberg LT ((2017) ) Neuropathological diagnoses and clinical correlates in older adults in Brazil: A cross-sectional study. PLoS Med 14: , e1002267. |
[128] | Coutinho AM , Busatto GF , de Gobbi Porto FH , de Paula Faria D , Ono CR , Garcez AT , Squarzoni P , de Souza Duran FL , de Oliveira MO , Tres ES , Brucki SMD , Forlenza OV , Nitrini R , Buchpiguel CA ((2020) ) Brain PET amyloid and neurodegeneration biomarkers in the context of the 2018 NIA-AA research framework: An individual approach exploring clinical-biomarker mismatches and sociodemographic parameters. Eur J Nucl Med Mol Imaging 47: , 2666–2680. Erratum in: Eur J Nucl Med Mol Imaging 47, 2715-2716. |
[129] | Mattsson-Carlgren N , Andersson E , Janelidze S , Ossenkoppele R , Insel P , Strandberg O , Zetterberg H , Rosen HJ , Rabinovici G , Chai X , Blennow K , Dage JL , Stomrud E , Smith R , Palmqvist S , Hansson O ((2020) ) Aβ deposition is associated with increases in soluble and phosphorylated tau that precede a positive Tau PET in Alzheimer’s disease. Sci Adv 6: , eaaz2387. |
[130] | Milà-Alomà M , Ashton NJ , Shekari M , Salvadó G , Ortiz-Romero P , Montoliu-Gaya L , Benedet AL , Karikari TK , Lantero-Rodriguez J , Vanmechelen E , Day TA , González-Escalante A , Sánchez-Benavides G , Minguillon C , Fauria K , Molinuevo JL , Dage JL , Zetterberg H , Gispert JD , Suárez-Calvet M , Blennow K ((2022) ) Plasma p-tau231 and p-tau217 as state markers ofamyloid-β pathology in pre-clinical Alzheimer’s disease. Nat Med 28: , 1797–1801. Erratum in: Nat Med 28, 1965. |
[131] | Palmqvist S , Stomrud E , Cullen N , Janelidze S , Manuilova E , Jethwa A , Bittner T , Eichenlaub U , Suridjan I , Kollmorgen G , Riepe M , von Arnim CAF , Tumani H , Hager K , Heidenreich F , Mattsson-Carlgren N , Zetterberg H , Blennow K , Hansson O ((2023) ) An accurate fully automated panel of plasma biomarkers for Alzheimer’s disease. Alzheimers Dement 19: , 1204–1215. |
[132] | Balogun WG , Zetterberg H , Blennow K , Karikari TK ((2023) ) Plasma biomarkers for neurodegenerative disorders: Ready for prime time? Curr Opin Psychiatry 36: , 112–118. |
[133] | Schindler SE , Karikari TK , Ashton NJ , Henson RL , Yarasheski KE , West T , Meyer MR , Kirmess KM , Li Y , Saef B , Moulder KL , Bradford D , Fagan AM , Gordon BA , Benzinger TLS , Balls-Berry J , Bateman RJ , Xiong C , Zetterberg H , Blennow K , Morris JC ((2022) ) Effect of race on prediction of brain amyloidosis by plasma Aβ42/Aβ40, phosphorylated tau, and neurofilament light. Neurology 99: , e245–e257. |
[134] | Tsiknia AA , Edland SD , Sundermann EE , Reas ET , Brewer JB , Galasko D , Banks SJ ; Alzheimer’s Disease Neuroimaging Initiative ((2022) ) Sexdifferences in plasma p-tau181 associationswith Alzheimer’s disease biomarkers, cognitive decline, and clinicalprogression. Mol Psychiatry 27: , 4314–4322. |
[135] | Angioni D , Delrieu J , Hansson O , Fillit H , Aisen P , Cummings J , Sims JR , Braunstein JB , Sabbagh M , Bittner T , Pontecorvo M , Bozeat S , Dage JL , Largent E , Mattke S , Correa O , Gutierrez Robledo LM , Baldivieso V , Willis DR , Atri A , Bateman RJ , Ousset PJ , Vellas B , Weiner M ((2022) ) Blood biomarkers from research use to clinical practice: What must be done? A report from the EU/US CTAD Task Force. J Prev Alzheimers Dis 9: , 569–579. |
[136] | Chatterjee P , Doré V , Pedrini S , Krishnadas N , Thota R , Bourgeat P , Ikonomovic MD , Rainey-Smith SR , Burnham SC , Fowler C , Taddei K , Mulligan R , Ames D , Masters CL , Fripp J , Rowe CC , Martins RN , Villemagne VL ; and for the AIBL Research Group ((2023) ) Plasma glialfibrillary acidic protein is associated with 18F-SMBT-1 PET: Twoputative astrocyte reactivity biomarkers for Alzheimer’s disease. J Alzheimers Dis 92: , 615–628. |
[137] | Stevenson-Hoare J , Heslegrave A , Leonenko G , Fathalla D , Bellou E , Luckcuck L , Marshall R , Sims R , Morgan BP , Hardy J , de Strooper B , Williams J , Zetterberg H , Escott-Price V ((2023) ) Plasma biomarkers and genetics in the diagnosis and prediction of Alzheimer’s disease. Brain 146: , 690–699. |
[138] | Alzheimer’s Association. Available online at: https://www.alz.org/media/documents/health-care-pros-faqs-beta-amyloid-imaging.pdf. Accessed on March 15, 2023. |
[139] | Johnson KA , Minoshima S , Bohnen NI , Donohoe KJ , Foster NL , Herscovitch P , Karlawish JH , Rowe CC , Carrillo MC , Hartley DM , Hedrick S , Pappas V , Thies WH ((2013) ) Appropriate use criteria for amyloid PET: A report of the Amyloid Imaging Task Force, the Society of Nuclear Medicine and Molecular Imaging, and the Alzheimer’s Association. J Nucl Med 54: , 476–90. |
[140] | Cure Alzheimer’s Fund. Available at: https://curealz.org. Accessed on March 15, 2023. |
[141] | Mayo Clinic Patient Care & Health Information, Tests & Procedures, Lumbar puncture (spinal tap). Available at: https://www.mayoclinic.org/tests-procedures/lumbar-puncture/about/pac-20394631. Accessed on March 15, 2023. |
[142] | Mattke S , Cho SK , Bittner T , Hlávka J , Hanson M ((2020) ) Blood-based biomarkers for Alzheimer’s pathology and the diagnosticprocess for a disease-modifying treatment: Projecting the impact onthe cost and wait times. Alzheimers Dement (Amst) 12: , e12081. |
[143] | Weber DM , Tran D , Goldman SM , Taylor SW , Ginns EI , Lagier RJ , Rissman RA , Brewer JB , Clarke NJ ((2019) ) High-throughput mass spectrometry assay for quantifying β-amyloid 40 and 42 in cerebrospinal fluid. Clin Chem 65: , 1572–1580. |


