
A Candidate microRNA Profile for Early Diagnosis of Sporadic Alzheimer’s Disease
Abstract
Background:
Late-onset or sporadic Alzheimer’s disease (sAD) is a neurodegenerative disease leading to cognitive impairment and memory loss. The underlying pathological changes take place several years prior to the appearance of the first clinical symptoms, however, the early diagnosis of sAD remains obscure.
Objective:
To identify changes in circulating microRNA (miR) expression in an effort to detect early biomarkers of underlying sAD pathology.
Methods:
A set of candidate miRs, earlier detected in biofluids from subjects at early stage of sAD, was linked to the proposed tau-driven adverse outcome pathway for memory loss. The relative expression of the selected miRs in serum of 12 cases (mild cognitive impairment, MCI) and 27 cognitively normal subjects, recruited within the ongoing Aiginition Longitudinal Biomarker Investigation Of Neurodegeneration (ALBION) study, was measured by RT-qPCR. Data on the protein levels of amyloid-β (Aβ42) and total/phosphorylated tau (t-tau/p-tau), in cerebrospinal fluid (CSF), and the cognitive z-scores of the participants were also retrieved.
Results:
Each doubling in relative expression of 13 miRs in serum changed the odds of either having MCI (versus control), or having pathological Aβ42 or pathological Aβ42 and tau (versus normal) proteins in their CSF, or was associated with the global composite z-score.
Conclusion:
These candidate human circulating miRs may be of great importance in early diagnosis of sAD. There is an urgent need for confirming these proposed early predictive biomarkers for sAD, contributing not only to societal but also to economic benefits.
INTRODUCTION
Alzheimer’s disease (AD) is the most common form of dementia, affecting around 5–8% of the general population, above the age of 65 years, worldwide [1]. Late-onset or sporadic AD (sAD), accounting for >95% of AD cases, is a progressive neurodegenerative and multifactorial disease, characterized by irreversible brain damage leading to deterioration of cognitive function and memory loss, as the main first symptoms. Memory deficits can cause behavioral changes and difficulty in carrying out daily functions in affected individuals. The rate of cognitive decline has been strongly associated with mortality in AD patients [2]. Four stages of AD’s cognitive decline, preclinical, mild, moderate, and late stage, have been already described [3]. Two specific brain regions of the medial temporal lobe, hippocampus, and entorhinal cortex, responsible for memory and learning processing, are the main targets for assessing the early signs of sAD pathology [4]. There is evidence that the risk for developing mild cognitive impairment (MCI) and dementia is greater in individuals with subjective cognitive decline [5]. The early phase of the AD development is asymptomatic (silent) and takes several years (>10 years) before the manifestation of cognitive impairment and the appearance of the first clinical symptoms [6]. Although many efforts have been made for developing efficient approaches to understand the initiation and/or progression of sAD pathology, the current prognosis and diagnosis of sAD at early stage remain poor. The existing methods for the detection of the early stage of sAD are inaccurate and the available treatment for the disease is ineffective. Therefore, there is an urgent need for identification of biomarkers used for the detection of early sAD.
Compiling evidence supports the great importance of studying microRNAs (miRs), non-coding RNAs, approximately 22 nucleotides in length, known as master regulators of gene expression at post-transcriptional level, in a wide range of physiological and pathological processes, from development to diseases [7, 8]. In particular, circulating miRs can serve promising molecular biomarkers for many diseases, not only due to their easy and non-invasive detection, but also for their extreme stability in biofluids (e.g., blood, serum, plasma) [9]. Several altered miRs have been shown to be associated with AD pathology, but most of them have been detected in blood or brain tissue of subjects at late stage of AD [10]. Only limited data on the changes of circulating miRs at early phase of AD are available. Apparently, the collection of blood samples of subjects at the early phase of cognitive impairment seems very challenging due to the lack of clinical signs of the cognitive decline as at this stage.
In the current clinical practice, AD diagnosis is based on the combination of different types of examinations, including clinical examinations, brain imaging (e.g., magnetic resonance imaging, MRI), different neuropsychological tests (e.g., the Mini-Mental State Examination, MMSE), and biochemical measurements of total and phosphorylated tau protein (t- and p-tau), and of 42-amino acid peptide (amyloid-β, Aβ42) in cerebrospinal fluid (CSF), using invasive and/or non-invasive methods [11, 12]. Although the measurement of proteins in CSF and imaging techniques could be considered promising diagnostic approaches, they are not appropriate for primary screening or monitoring purposes due to their invasiveness and high costs [13].
Remarkably, in the existing studies in literature, of which the focus is on the investigation of the potential implication of miRs in the early stage of sAD pathogenesis, the classification for the cognitive state of the study participants is often imprecise and vague. In addition, there is no consensus on the applied methods for the characterization of the cognitive state of patients in clinical trials. This may lead to false conclusions with regards to the implication of miRs in the early stage of AD.
In the present study, we evaluated detectable changes in human circulating miRs referring to early phase of sAD pathology from publicly available human studies. A set of miRs involved in processes linked to memory loss, as proposed by the recently constructed tau-driven adverse outcome pathway (AOP) [14], was first selected, and further, their miR expression in serum collected from MCI and cognitively normal subjects, within the ongoing Aiginition Longitudinal Biomarker Investigation Of Neurodegeneration (ALBION) cohort study, was measured. The potentially observed changes in circulating miR expression can definitely help to fill in the gap in the identification of biomarkers for the early detection and/or diagnosis of sAD, and additionally may contribute to the development of therapeutic treatments for alleviating the symptoms of people with sAD at early phase.
MATERIALS AND METHODS
Selection of candidate miRs
First, we reviewed 14 publicly available human studies (Supplementary Table 1) on circulating miRs, detected in blood, serum, plasma and/or CSF, with sufficient evidence for their involvement in early stage of AD. In these selected studies, miR profiles of study populations comprised of cases (i.e., early AD, or MCI subjects) and controls (i.e., healthy subjects) with known MMSE scores, were compiled. Next, we selected a list of miRs, which were linked to the molecular processes related to memory loss, as earlier described in the proposed tau-driven AOP for memory loss [14, 15]. These miRs were also confirmed by both functional analysis and literature search to be linked to the proposed hypothetical starting point and/or key events of this suggested tau-driven AOP. A list of 36 miRs was initially selected for this study (Supplementary Table 2).
Study participants
Participants were recruited from the ongoing ALBION study, which was approved (approval number: ΨΘ6K46Ψ8N2-8HΩ) by the Institutional Review Board of the Aiginition University Hospital of Athens, in Greece [16]. All participants provide written informed consent when they are enrolled. The study participants aged 40 years or older, who are either referred by other specialists or self-referred to the cognitive disorders’ outpatient clinic of a tertiary university Aiginition hospital, due to their possible subjective memory complaints or positive family history, or as a self-commitment to contributing to medical science. The clinical diagnosis is always performed by a specialist neurologist after an extensively standardized neurological assessment. Only individuals diagnosed as cognitively normal or with MCI, based on established diagnostic criteria, are included in the study, as elsewhere referred [17]. The diagnosis of the cognitive status is based on DSM-IV-TR criteria, the diagnosis of probable or possible AD is based on the National Institute of Neurological and Communicative Disorders and Stroke/Alzheimer Disease and Related Disorders Association (NINCDS/ADRDA) criteria, and the diagnosis of MCI (and MCI subtypes) is based on the subjective memory complaint and objective impairment in at least one cognitive domain (memory, executive-speed, visual-spatial, language, and combinations) [16]. The same criteria for the diagnosis of MCI have been used in previous published papers from the HELIAD study, an epidemiological study conducted in Greece [18, 19]. Based on the study’s inclusion criteria, a MCI diagnosis is considered when the participant experiences cognitive complaints with a measurable decline in cognitive function with a standard deviation (SD) below 1.5 in at least on one cognitive domain, in the absence of dementia or impairment in daily functioning [20].
A global neuropsychological composite z-score derived from the outcomes of individual cognitive domain scores (memory, language, attention-speed, executive and visuospatial functioning) was calculated, as previously described [21]. The scores of each cognitive test were converted into z-scores, using the mean and standard deviation values of the participants who did not have dementia or MCI.
Our study population, consisted of 12 MCI and 27 cognitively normal subjects, was recruited between December 2018 and March 2022. The study participants were followed-up almost every year, where their cognitive state was re-assessed. Based on the last obtained cognitive re-assessment data, which varied among the participants from 1 to 4 years follow-up, three of the cognitively normal were diagnosed with cognitive impairment (mild or dementia), while two of the subjects with a diagnosis of MCI were shown to be cognitively normal.
In addition, CSF biomarker data were also gathered for the study participants. CSF was collected by lumber puncture during the 1st visit. The protein levels of amyloid-β 1–42 (Aβ42), phosphorylated tau at threonine 181 (p-tau), and total tau (t-tau) in CSF were measured by ELISA and automated Elecsys® assays (Roche Diagnostics) [20]. A classification method based on the absence or the presence of pathological levels of only Aβ42, or Aβ42 and p-tau and/or t-tau, using the reference ranges (abnormal values: Aβ42 <480 pg/ml, t-tau>195 pg/ml, and p-tau >61 pg/ml, performed by Aristoteleio, and Aβ42 <1000 pg/ml, t-tau >300 pg/ml, and p-tau >27 pg/ml, p-tau/Aβ42 >0.024 and t-tau/ Aβ42 >0.28, performed by EPAD-Lasira), elsewhere described [20], was considered for this study.
Serum sample collection
During the 1st visit at the memory clinic, 35 ml blood were drawn from the participants, without fasting. Serum was collected in tubes with gel, followed by centrifugation in 2000 g for 10 min. After centrifugation, the serum was aliquoted and stored at –80°C.
RNA isolation
Total RNA and miR were extracted from the serum samples using the miRNeasy Serum/Plasma Kit (Qiagen, Venlo, Netherlands) according to the manufacturer’s protocol. RNA quality control was assessed using Agilent 2100 Bioanalyzer (Agilent Technologies, Amstelveen, Netherlands). Extracted RNA was stored at –80°C until further applications.
Reverse transcription and relative miR expression analysis
Two μL of the total RNA were reverse transcribed with TaqMan Advanced miRNA cDNA synthesis kit (ThermoFisher Scientific, MA, USA) based on the manufacturer’s instructions. The cDNA was synthetized by 3’poly(A)tailing and 5’ligation of an adaptor sequence to extend the mature miRNAs present in the sample at each end prior to reverse transcription. A pre-amplification step, using universal miR-Amp primer and miR-Amp master mix, followed by reverse transcriptase (RT) in order to uniformly increase the amount of cDNA for each target, maintaining the relative differential expression levels. Taqman Advanced miRNA assays (ThermoFisher Scientific, MA, USA) were used to measure each target by RT-qPCR, using CFX384 Bio-Rad. Reactions were performed in 384-well plates, with a total volume of 10μL per reaction well, with the following cycling conditions: 95°C for 20 s (enzyme activation), 40 cycles of 95°C for 3 s (denaturation), and 60°C for 30 s (annealing/extension). An exogenous spike-in control (cel-miR-39-3p) and an endogenous control (hsa-miR-24-3p) were used for normalization as recommended by the manufacturer. Initially, hsa-miR-484 was also selected as endogenous control, but due to its strong association with the outcome in our analysis, was eventually considered as target of interest. Inter-run calibrators (IRCs) were applied for different runs of the same miR assay. Information of the measured mature miR assays are provided in Supplementary Table 3. The obtained raw cycles of quantification (Cq) values of the measured target miRs were normalized against the geometric mean of the Cq of the control miRs. The relative miR expression was calculated by 2–ΔΔCq method. All samples were analyzed in triplicates, using a cut-off of ΔCq smaller than 0.5. When one of the replicates did not meet the criteria, then only two replicates were taken into account. Out of the 36 initially selected miRs, only 23 miRs assays were included in our study (Supplementary Table 4), while 13 miR assays were excluded from our selection because of their amplification inefficiency or due to the inconsistent Cq values among their replicates.
Re-measurement of relative miR expression
Using a different RNA isolation kit, the miRNeasy Mini Kit (Qiagen, Germany), total RNA was extracted from the same serum samples (n = 39) following the manufacturer’s protocol. A synthetic RNA oligonucleotide mix obtained from the miRCURY Spike-In kit (Qiagen, Germany) was added to each sample at equimolar amounts prior to RNA extraction. These spike-ins were subsequently used to monitor RNA extraction efficiency. The extracted total RNA and miR were stored at –80°C until further analysis.
Further, from total RNA samples, cDNA was synthesized using the miRCURY RT Kit (Qiagen, Germany). Reaction conditions were set according to recommendations by the manufacturer and 2μL of total RNA was used as input in a 10μL reaction. Quantitative RT-PCR reactions were set up using miRCURY SYBR ® green master mix with a 1:50 diluted cDNA and commercial LNA-enhanced primer assay. Reactions were performed in a 384-well primer spotted plates in a Roche LC480 II instrument (Roche, Germany), with the following temperature settings: 95°C for 10 min, 45 cycles of 95°C for 10 s, and 60°C for 60 s. Using the obtained Cq values, the relative miR expression was calculated, as aforementioned, normalizing against the geometric mean of an exogenous spike-in control (cel-miR-39-3p) and an endogenous control (hsa-miR-24-3p), as followed: ΔCq = Averaged Cq - geomean –Average Cq - miR.
Statistical analysis
The relative expression of the miRs was expressed as log2-transformed. Using SAS program (v. 9.4), logistic regression models were performed, considering relative miR expression as the predictor variable and the odds of having MCI versus Control, as dichotomous outcome variable. For each doubling in the predictor (relative miR expression), the log odds of the outcome (MCI versus Control) changed by a factor corresponded to the obtained estimates (β, regression coefficient). Linear regression analysis was used for the associations between the composite z-scores (at the 1st visit) and the relative miR expression in serum, per each 1-unit increase in relative miR expression in serum. Lastly, multinomial logistic regression analysis was performed to explore the changes in the odds of having only pathological Aβ42 or having pathological Aβ42 and tau versus normal protein levels in CSF, per each doubling in the relative miR expression. All models were adjusted for potential covariates including age, sex, and years of education. Statistical significance (p-value) was set at 0.05. However, findings with a less stringent cut-off (p-values <0.2), are also discussed, considering the small sample size, which may lead to clinically insignificant findings. Receiver operating characteristic (ROC) analysis was used to determine the diagnostic accuracy of miRs as obtained by the area under the curve (AUC) for distinguishing subjects with a diagnosis of MCI from cognitively normal subjects.
RESULTS
Study population
In this study, 12 MCI and 27 cognitively normal subjects (Control), were included. As it is shown in Table 1, the average age (±SD) for the MCI subjects was 69.00 (±6.40) years and for the cognitively normal subjects 63.37 (±7.95) years. In Control group, most (81.48%) of the participants were women, while in MCI group, the 58.33%. The averaged years of education were 11.25 (±3.85) and 14.04 (±3.83) for the MCI and Control group, respectively. The MMSE scores were within the range of 28.12–30.18 for the Control group, whereas 25.55–29.15 for the MCI group.
Table 1
Demographic characteristics of the study population (n = 39). Data are presented either as mean (±SD) or as frequency (%). The calculated z-scores in individual cognitive domains, including memory (ZME), language (ZLA), executive functioning (ZEX), visuospatial (ZVS) and attention-speed (ZAS) processing, and the composite z-score (ZCO) for the study participants, during the 1st visit of the participants (at baseline), and the measured relative miR expression (log2) in serum, are also provided
| Characteristics | MCI (n = 12) | Control (n = 27) | p $ |
| Age, y | 69.00±6.40 | 63.37±7.95 | 0.042 |
| Sex, women | 58.33% | 81.48% | 0.126 |
| Duration of education, y | 11.25±3.85 | 14.04±3.83a | 0.05 |
| MMSE, score | 27.30±1.85b | 29.15±1.03a | 0.015 |
| Cognitive z-score | |||
| Memory (ZME) | –1.86±0.79b | 0.08±0.60a | < 0.0001 |
| Language (ZLA) | –1.17±1.05c | 0.22±0.69a | 0.004 |
| Executive (ZEX) | –1.01±1.64d | 0.07±1.17b | 0.17 |
| Visuospatial (ZVS) | –0.33±0.89b | –0.24±1.05a | 0.82 |
| Attention-speed (ZAS) | –1.83±1.92b | 0.08±0.93b | 0.012 |
| Composite (ZCO) | –1.39±0.81b | 0.04±0.60a | 0.0002 |
| Relative miR expression | |||
| let-7d-5p | –0.51±1.56 | –0.42±1.95 | 0.89 |
| let-7g-5p | –1.04±0.95 | –0.65±1.32 | 0.37 |
| miR-15a-5p | 0.18±1.74 | –0.26±1.17 | 0.36 |
| miR-26a-5p | –0.73±0.64a | –0.42±1.02 | 0.36 |
| miR-26b-5p | –0.27±0.84a | 0.04±1.05 | 0.39 |
| miR-29a-3p | –0.34±2.14 | –0.43±1.54a | 0.87 |
| miR-30b-5p | –0.60±0.99a | –0.55±1.25 | 0.90 |
| miR-93-5p | 0.40±1.18 | –0.05±1.35 | 0.32 |
| miR-101-3p | –0.39±2.14 | –0.32±1.20 | 0.92 |
| miR-103a-3p | 0.81±1.56 | 0.23±1.62 | 0.30 |
| miR-125b-5p | –0.18±1.16 | –0.10±0.81 | 0.80 |
| miR-128-3p | 0.12±0.57a | –0.16±1.07 | 0.31 |
| miR-132-3p | –0.57±1.80 | 0.22±1.88 | 0.23 |
| miR-143-3p | –0.62±1.91 | –0.16±1.28 | 0.38 |
| miR-146a-5p | 0.17±1.08 | 0.47±1.17 | 0.46 |
| miR-148a-3p | –0.10±1.33a | –0.02±1.18 | 0.86 |
| miR-151a-5p | –0.29±0.80a | –0.64±0.87a | 0.26 |
| miR-181c-5p | –0.20±0.80a | 0.14±1.27 | 0.42 |
| miR-191-5p | 0.49±1.33a | –0.33±2.16 | 0.26 |
| miR-210-3p | –0.12±1.24b | 0.59±1.51e | 0.20 |
| miR-335-5p | –0.55±1.14 | –0.78±2.21 | 0.66 |
| miR-484 | 0.52±0.79a | –0.18±1.49 | 0.068 |
| miR-486-5p | 0.49±1.89 | 0.39±1.42 | 0.86 |
aMissing value for 1 subject; bMissing values for 2 subjects; cMissing values for 3 subjects; dMissing values for 6 subjects; eMissing values for 5 subjects. $p-values are determined by either two samples t-test (for the continuous variables) or Chi-square test (for the categorical variables), between MCI and Control groups.
Among the described characteristics of the participants, age [69.00 (6.40) versus 63.37 (7.95); p = 0.042], duration of education (in years) [11.25 (3.85) versus 14.04 (3.83); p = 0.05], and MMSE scores [27.30 (1.85) versus 29.15 (1.03); p = 0.015], were shown to be statistically significant different between MCI and Control group. With regards to the cognitive z-scores, there was statistically strong difference between the MCI and Control group, in memory z-score [–1.86 (0.79) versus 0.08 (0.60); p < 0.0001], language z-score [–1.17 (1.05) versus 0.22 (0.69); p = 0.004], attention-speed functioning z-score [–1.83 (1.92) versus 0.08 (0.93); p = 0.012] and composite z-score [–1.39 (0.81) versus 0.04 (0.60); p = 0.0002]. As for the difference in the measured relative miR expression, a p-value very close to significance (p = 0.068) in the relative miR-484 expression between the MCI and control group, was observed.
Based on the most updated re-assessment data obtained during the yearly follow-up of the study participants, 10 subjects had a diagnosis with cognitive impairment (either mild or dementia), while 20 subjects were cognitively normal. No follow-up data were available for 9 of the study participants.
Regarding the CSF biomarker data, using the classification method, based on the absence, or presence of CSF pathological proteins, Aβ42 and/or tau, as elsewhere mentioned [20], 13 subjects had normal levels of Aβ42 and/or tau, 7 subjects had only pathological levels of Aβ42, and 6 subjects had pathological levels of Aβ42 and tau, in their CSF. No CSF data for 13 subjects were available.
miR expression as predictor for having MCI
In Table 2, the changes in odds ratio (OR) of having MCI for each doubling in relative miR expression in serum are provided. In more detail, based on these findings, per each doubling in the relative expression of miR-132-3p and miR-143-3p in serum, the odds of having MCI would decrease by a factor of 0.62 (95% CI: 0.40 to 0.96, p = 0.033) and 0.73 (95% CI: 0.47 to 1.11, p = 0.14), respectively. While, for every doubling in the relative expression of miR-151a-5p, miR-191-5p, and miR-484 in serum, the odds of having MCI would increase by a factor of 1.80 (95% CI: 0.80 to 4.05, p = 0.16), 1.27 (95% CI: 0.90 to 1.79, p = 0.17), and 1.65 (95% CI: 0.96 to 2.81, p = 0.067), respectively. Also, a doubling in relative expression of miR-181c-5p and miR-210-3p would decrease the odds of having MCI by a factor 0.70 (95% CI: 0.40 to 1.21, p = 0.20) and 0.71 (95% CI: 0.42 to 1.20, p = 0.20), respectively.
Table 2
Changes (%) in odds of having MCI (versus Control), per each doubling in relative miR expression in serum. Models were corrected for sex, age, and years of education. Odds ratios (OR), 95% confidence intervals (95% CI; lower to upper limit) and p-values are provided. When p-value <0.2, the miRs are indicated in bold and underlined
| miRs | OR (95% CI) | p |
| let-7d-5p | 0.90 (0.67 to 1.22) | 0.51 |
| let-7g-5p | 0.76 (0.45 to 1.29) | 0.31 |
| miR-15a-5p | 1.13 (0.73 to 1.76) | 0.58 |
| miR-26a-5p | 0.75 (0.39 to 1.43) | 0.38 |
| miR-26b-5p | 0.84 (0.50 to 1.43) | 0.53 |
| miR-29a-3p | 0.87 (0.63 to 1.20) | 0.40 |
| miR-30b-5p | 0.88 (0.55 to 1.40) | 0.59 |
| miR-93-5p | 1.32 (0.83 to 2.08) | 0.24 |
| miR-101-3p | 0.94 (0.67 to 1.31) | 0.72 |
| miR-103a-3p | 1.13 (0.80 to 1.60) | 0.49 |
| miR-125b-5p | 0.89 (0.49 to 1.60) | 0.70 |
| miR-128-3p | 1.24 (0.59 to 2.60) | 0.56 |
| miR-132-3p | 0.62 (0.40 to 0.96) | 0.033 |
| miR-143-3p | 0.73 (0.47 to 1.11) | 0.142 |
| miR-146a-5p | 0.76 (0.44 to 1.30) | 0.31 |
| miR-148a-3p | 0.99 (0.62 to 1.57) | 0.97 |
| miR-151a-5p | 1.80 (0.80 to 4.05) | 0.157 |
| miR-181c-5p | 0.70 (0.40 to 1.21) | 0.20 |
| miR-191-5p | 1.27 (0.90 to 1.79) | 0.174 |
| miR-210-3p | 0.71 (0.42 to 1.20) | 0.20 |
| miR-335-5p | 0.98 (0.75 to 1.28) | 0.89 |
| miR-484 | 1.65 (0.96 to 2.81) | 0.067 |
| miR-486-5p | 1.02 (0.71 to 1.45) | 0.92 |
Associations between cognitive composite z-score and relative expression of miRs
We also explored the associations of the global neuropsychological composite z-score (ZCO), as continuous variable, during the 1st visit of the study participants (at baseline), with the relative miR expression in serum, adjusting for age, sex, and years of education (Table 3). Based on these findings, fairly significant (p < 0.11) (positive) associations of the z-scores at baseline with the relative miR expression of miR-151α-5p (β= –0.25, 95% CI: –0.56 to 0.06, p = 0.111) and miR-191-5p (β= –0.13, 95% CI: –0.26 to 0.01, p = 0.06) in serum, for each 1-unit increase in relative miR expression in serum, were found. In other words, a decrease of –15.83% (95% CI: –31.46 to 3.36) and –8.45% (95% CI: –16.19 to 0.00) in z-scores was associated with a doubling in relative expression of miR-151α-5p and miR-191-5p in serum, respectively.
Table 3
Associations between the global composite z-score (at baseline) and the relative miR expression in serum. Estimates (β) with 95% confidence intervals (CI) and their p-value, for each one unit increase in the relative miR expression in serum, are provided. The model was adjusted for age, sex, and years of education. MiRs with p-value <0.2 are indicated in bold and underlined
| MiRs | β (95% CI) | p |
| let-7d-5p | 0.03 (–0.12 to 0.19) | 0.66 |
| let-7g-5p | 0.05 (–0.18 to 0.29) | 0.65 |
| miR-15a-5p | –0.03 (–0.25 to 0.20) | 0.81 |
| miR-26a-5p | 0.04 (–0.17 to 0.26) | 0.69 |
| miR-26b-5p | 0.06 (–0.21 to 0.32) | 0.67 |
| miR-29a-3p | 0.06 (–0.11 to 0.23) | 0.49 |
| miR-30b-5p | 0.02 (–0.25 to 0.28) | 0.90 |
| miR-93-5p | –0.06 (–0.32 to 0.21) | 0.66 |
| miR-101-3p | 0.05 (–0.13 to 0.23) | 0.61 |
| miR-103a-3p | –0.02 (–0.21 to 0.17) | 0.81 |
| miR-125b-5p | –0.03 (–0.36 to 0.30) | 0.85 |
| miR-128-3p | –0.16 (–0.55 to 0.23) | 0.41 |
| miR-132-3p | 0.08 (–0.08 to 0.25) | 0.30 |
| miR-143-3p | 0.09 (–0.09 to 0.27) | 0.30 |
| miR-146a-5p | –0.09 (–0.34 to 0.17) | 0.48 |
| miR-148a-3p | –0.07 (–0.35 to 0.20) | 0.59 |
| miR-151a-5p | –0.25 (–0.56 to 0.06) | 0.111 |
| miR-181c-5p | 0.10 (–0.15 to 0.35) | 0.43 |
| miR-191-5p | –0.13 (–0.26 to 0.01) | 0.060 |
| miR-210-3p | 0.10 (–0.14 to 0.34) | 0.40 |
| miR-335-5p | –0.05 (–0.19 to 0.09) | 0.48 |
| miR-484 | –0.14 (–0.36 to 0.08) | 0.21 |
| miR-486-5p | 0.01 (–0.18 to 0.20) | 0.90 |
Relative miR expression as predictor for having pathological CSF proteins
As shown in Table 4, the changes in odds of having only pathological Aβ42 (versus normal protein levels) or having pathological Aβ42 and tau proteins in CSF, for each doubling in relative miR expression in serum, are provided. The odds of having only pathological Aβ42 proteins (versus normal protein levels) in CSF would decrease by a factor of 0.63 (let-7d-5p; 95% CI: 0.33 to 1.20, p = 0.163), 0.26 (miR-29a-3p; 95% CI: 0.05 to 1.32, p = 0.103), 0.28 (miR-30b-5p; 95% CI: 0.07 to 1.17, p = 0.082), 0.49 (miR-103a-3p; 95% CI: 0.19 to 1.26, p = 0.138), and 0.20 (miR-335-5p; 95% CI: 0.03 to 1.17, p = 0.074), per each doubling in the relative miR expression. On the other hand, an increase by a factor of 3.75 (95% CI: 0.97 to 14.52, p = 0.056) or 2.83 (95% CI: 0.69 to 11.64, p = 0.15) in odds of having only pathological Aβ42 or having pathological Aβ42 and tau proteins (versus normal protein levels) in CSF, respectively, was associated with each doubling in relative miR-125b-5p expression in serum. Also, for each doubling in relative expression of miR-486-5p in serum, the odds of having only pathological Aβ42 proteins (versus normal protein levels) in CSF would increase by a factor of 1.39 (95% CI: 0.75 to 2.59, p = 0.132).
Table 4
Changes (%) in odds of having only pathological Aβ42 proteins or pathological Aβ42 and tau proteins (versus normal protein levels) in CSF, per each doubling in the relative miR expression in serum. Models were corrected for sex, age, and years of education. Odds ratios (OR), 95% confidence intervals (95% CI; lower to upper limit) and p-values are provided. When p-value<0.2, the miRs are indicated in bold and underlined
| Odds of having only pathological | Odds of having pathological | |||
| A β42 (versus normal) | A β42 and tau (versus normal) | |||
| MiRs | OR (95% CI) | p | OR (95% CI) | p |
| let-7d-5p | 0.63 (0.33 to 1.20) | 0.163 | 1.02 (0.59 to 1.74) | 0.95 |
| let-7g-5p | 0.87 (0.47 to 1.60) | 0.65 | 1.18 (0.54 to 2.57) | 0.68 |
| miR-15a-5p | 1.14 (0.47 to 2.74) | 0.76 | 1.31 (0.59 to 2.89) | 0.51 |
| miR-26a-5p | 0.69 (0.26 to 1.86) | 0.46 | 0.69 (0.21 to 2.30) | 0.55 |
| miR-26b-5p | 1.10 (0.39 to 3.08) | 0.85 | 0.62 (0.22 to 1.76) | 0.37 |
| miR-29a-3p | 0.26 (0.05 to 1.32) | 0.103 | 1.69 (0.62 to 4.62) | 0.30 |
| miR-30b-5p | 0.28 (0.07 to 1.17) | 0.082 | 2.37 (0.54 to 10.32) | 0.25 |
| miR-93-5p | 1.13 (0.57 to 2.25) | 0.72 | 1.47 (0.71 to 3.05) | 0.30 |
| miR-101-3p | 0.70 (0.36 to 1.37) | 0.30 | 1.17 (0.57 to 2.39) | 0.67 |
| miR-103a-3p | 0.49 (0.19 to 1.26) | 0.138 | 1.49 (0.64 to 3.43) | 0.35 |
| miR-125b-5p | 3.75 (0.97 to 14.52) | 0.056 | 2.83 (0.69 to 11.64) | 0.150 |
| miR-128-3p | 0.90 (0.40 to 2.06) | 0.81 | 1.22 (0.49 to 3.03) | 0.66 |
| miR-132-3p | 0.89 (0.58 to 1.35) | 0.22 | 0.78 (0.49 to 1.25) | 0.31 |
| miR-143-3p | 0.68 (0.30 to 1.51) | 0.34 | 0.91 (0.41 to 2.03) | 0.82 |
| miR-146a-5p | 0.84 (0.39 to 1.80) | 0.65 | 1.23 (0.55 to 2.75) | 0.61 |
| miR-148a-3p | 1.04 (0.55 to 1.98) | 0.90 | 1.19 (0.56 to 2.50) | 0.65 |
| miR-151a-5p | 0.88 (0.32 to 2.40) | 0.80 | 0.67 (0.21 to 2.13) | 0.49 |
| miR-181c-5p | 1.23 (0.63 to 2.38) | 0.66 | 1.22 (0.51 to 2.89) | 0.66 |
| miR-191-5p | 1.33 (0.63 to 2.82) | 0.45 | 0.93 (0.63 to 1.39) | 0.74 |
| miR-210-3p | 1.27 (0.69 to 2.35) | 0.44 | 1.29 (0.71 to 2.35) | 0.40 |
| miR-335-5p | 0.20 (0.03 to 1.17) | 0.074 | 1.60 (0.44 to 5.77) | 0.47 |
| miR-484 | 0.82 (0.44 to 1.52) | 0.53 | 1.16 (0.56 to 2.39) | 0.68 |
| miR-486-5p | 1.39 (0.75 to 2.59) | 0.132 | 1.76 (0.84 to 3.68) | 0.47 |
miRs as predictor of having cognitive impairment based on the follow-up data
Based on the most updated re-assessment data about the cognitive state of the study participants, obtained during the annually follow-up, the possible changes in odds of having cognitive impairment, per each doubling in relative miR expression in serum, were also explored (Supplementary Table 5). The odds of having cognitive impairment (either mild or severe) would decrease by a factor of 0.52 (95% CI: 0.24 to 1.12, p = 0.094), 0.63 (95% CI: 0.35 to 1.13, p = 0.12), 0.36 (95% CI: 0.12 to 1.08, p = 0.068) and 0.48 (95% CI: 0.21 to 1.11, p = 0.088), for each doubling in relative expression of miR-30b-5p, miR-103a-3p, miR-128-3p, and miR-484, respectively.
Re-measurement of miRs in the same serum samples by different PCR technology
Using a different qPCR technology, the 23 miRs were remeasured in the same set of serum samples (n = 39), of which total RNA and miR were extracted by a different RNA isolation procedure, as well. In order to assess the reproducibility of these miR changes in serum collected from the same subjects, we applied the same normalization method, classification of the study participants and statistical models.
Our findings (Table 5) revealed an increase in the odds of having MCI, for each doubling in the relative expression of miR-26a-5p (OR = 4.60, 95% CI: 1.18 to 17.94, p = 0.028), miR-30b-5p (OR = 3.24, 95% CI: 0.93 to 11.26, p = 0.064), miR-146a-5p (OR = 5.29, 95% CI: 1.47 to 19.02, p = 0.011), miR-148a-3p (OR = 2.01, 95% CI: 0.75 to 5.34, p = 0.16), and miR-191-5p (OR = 2.23, 95% CI: 0.69 to 7.27, p = 0.18), in serum. When, the follow-up data were taken into account, the odds of having cognitive impairment, close to significance (p < 0.13), would increase by a factor of 3.04 (95% CI: 0.74 to 12.52, p = 0.12), 2.54 (95% CI: 0.75 to 8.56, p = 0.13), 3.02 (95% CI: 0.79 to 11.48, p = 0.11) and 6.14 (95% CI: 1.18 to 32.00, p = 0.031), per each doubling in relative expression of let-7d-5p, miR-26b-5p, miR-125b-5p, and miR-143-3p in serum, respectively (Supplementary Table 5).
Table 5
Changes (%) in odds ratio of having MCI (versus Control), per each doubling in the relative miR expression in serum, after remeasuring the same set of miRs in the same serum samples, as in the main analysis, using a different RNA isolation kit and qPCR platform. Models were adjusted for sex, age, and years of education. Odds ratios (OR), 95% confidence intervals (95% CI; lower to upper limit) and p-values are provided. When p-value <0.2, the miRs are indicated in bold and underlined
| MiRs | OR (95% CI) | p |
| let-7d-5p | 1.05 (0.39 to 2.87) | 0.92 |
| let-7g-5p | 1.25 (0.39 to 4.00) | 0.71 |
| miR-15a-5p | 1.15 (0.58 to 2.30) | 0.69 |
| miR-26a-5p | 4.60 (1.18 to 17.94) | 0.028 |
| miR-26b-5p | 0.89 (0.35 to 2.29) | 0.81 |
| miR-29a-3p | 1.88 (0.64 to 5.50) | 0.25 |
| miR-30b-5p | 3.24 (0.93 to 11.26) | 0.064 |
| miR-93-5p | 0.89 (0.41 to 1.94) | 0.77 |
| miR-101-3p | 0.85 (0.39 to 1.86) | 0.68 |
| miR-103a-3p | 1.50 (0.59 to 3.77) | 0.39 |
| miR-125b-5p | 0.90 (0.36 to 2.21) | 0.81 |
| miR-128-3p | 1.06 (0.51 to 2.18) | 0.87 |
| miR-132-3p | 0.84 (0.36 to 1.96) | 0.68 |
| miR-143-3p | 1.11 (0.40 to 3.08) | 0.84 |
| miR-146a-5p | 5.29 (1.47 to 19.02) | 0.011 |
| miR-148a-3p | 2.01 (0.75 to 5.34) | 0.163 |
| miR-151a-5p | 1.75 (0.61 to 4.99) | 0.29 |
| miR-181c-5p | 0.82 (0.55 to 1.23) | 0.34 |
| miR-191-5p | 2.23 (0.69 to 7.27) | 0.181 |
| miR-210-3p | 0.95 (0.46 to 1.94) | 0.89 |
| miR-335-5p | 1.50 (0.64 to 3.52) | 0.35 |
| miR-484 | 1.24 (0.54 to 2.84) | 0.61 |
| miR-486-5p | 1.06 (0.64 to 1.74) | 0.82 |
Further, we also checked the associated changes in cognitive composite z-score (at baseline) with a doubling in relative expression of miRs in serum (Table 6). The analysis showed that higher relative expression of let-7d-5p, miR-26b-5p, miR-101-3p, miR-132-3p, and miR-210-3p, while lower relative expression of miR-146a-5p in serum, were associated with higher composite z-scores, per each 1-unit increase in relative miR expression. In more detail, an increase of 27.90% (let-7d-5p; 95% CI: –7.94 to 77.69, p = 0.15), 51.20% (miR-26b-5p; 95% CI: 15.04 to 98.73, p = 0.006), 29.16% (miR-101-3p; 95% CI: 0.37 to 66.21, p = 0.056), 27.82% (miR-132-3p; 95% CI: –3.32 to 68.98, p = 0.095), and 20.79% (miR-210-3p; 95% CI: –6.58 to 56.18, p = 0.16), and a decrease of –21.90% (miR-146a-5p; 95% CI: –44.13 to 9.18, p = 0.16) in the composite z-scores were associated with a doubling in the relative miR expression in serum.
Table 6
Associations between the global composite z-score (as continuous variable) and the relative miR expression in serum, in an additional study, using the same samples but different RNA isolation and qPCR kits. Estimates (β) with 95% confidence intervals (CI) and their p-value, for each one unit increase in the relative miR expression in serum, are provided. The model was adjusted for age, sex, and years of education. MiRs with p-value <0.2 are indicated in bold and underlined
| MiRs | β (95% CI) | p |
| let-7d-5p | 0.35 (–0.14 to 0.85) | 0.153 |
| let-7g-5p | 0.36 (–0.21 to 0.93) | 0.21 |
| miR-15a-5p | 0.10 (–0.25 to 0.45) | 0.55 |
| miR-26a-5p | –0.17 (–0.71 to 0.37) | 0.52 |
| miR-26b-5p | 0.60 (0.19 to 1.00) | 0.006 |
| miR-29a-3p | 0.10 (–0.45 to 0.65) | 0.72 |
| miR-30b-5p | 0.13 (–0.47 to 0.72) | 0.66 |
| miR-93-5p | 0.18 (–0.22 to 0.58) | 0.37 |
| miR-101-3p | 0.37 (–0.01 to 0.75) | 0.056 |
| miR-103a-3p | 0.19 (–0.26 to 0.64) | 0.39 |
| miR-125b-5p | 0.25 (–0.20 to 0.70) | 0.26 |
| miR-128-3p | 0.03 (–0.34 to 0.40) | 0.87 |
| miR-132-3p | 0.35 (–0.07 to 0.77) | 0.095 |
| miR-143-3p | 0.26 (–0.23 to 0.74) | 0.29 |
| miR-146a-5p | –0.36 (–0.86 to 0.15) | 0.159 |
| miR-148a-3p | 0.09 (–0.37 to 0.56) | 0.69 |
| miR-151a-5p | 0.06 (–0.44 to 0.55) | 0.82 |
| miR-181c-5p | 0.08 (–0.13 to 0.29) | 0.45 |
| miR-191-5p | 0.15 (–0.39 to 0.70) | 0.57 |
| miR-210-3p | 0.27 (–0.11 to 0.66) | 0.160 |
| miR-335-5p | 0.20 (–0.23 to 0.63) | 0.36 |
| miR-484 | –0.02 (–0.48 to 0.44) | 0.92 |
| miR-486-5p | 0.05 (–0.22 to 0.31) | 0.73 |
Lastly, the changes in odds of having only pathological Aβ42 (versus normal protein levels) or having pathological Aβ42 and tau proteins in CSF, for each doubling in relative miR expression in serum, were also assessed (Table 7). Per each doubling in relative expression of let-7d-5p, miR-26b-5p, miR-143-3p, and miR-181c-5p in serum, the odds of having pathological Aβ42 and tau proteins (versus normal protein levels) in CSF would decrease by a factor of 0.18 (95% CI: 0.02 to 1.28, p = 0.087), 0.40 (95% CI: 0.10 to 1.56, p = 0.19), 0.23 (95% CI: 0.05 to 1.09, p = 0.065), and 0.06 (95% CI: 0.00 to 1.06, p = 0.055), respectively. A doubling in the relative miR-486-5p expression in serum was associated with an increase of 1.63 (95% CI: 0.80 to 3.33, p = 0.18) in odds of having pathological Aβ42 and tau proteins (versus normal protein levels) in CSF. While the odds of having only pathological Aβ42 (versus normal) proteins in CSF would increase by 3.28 (miR-26b-5p; 95% CI: 0.68 to 15.90, p = 0.14), 6.91 (miR-125b-5p; 95% CI: 1.12 to 45.56, p = 0.037), 3.10 (miR-148a-3p; 95% CI: 0.68 to 14.16, p = 0.14), and 3.27 (miR-335-5p; 95% CI: 0.79 to 13.51, p = 0.102), per each doubling in the relative miR expression in serum. An increase of in odds of having only pathological Aβ42 (versus normal) proteins in CSF per each doubling in the relative miR-128-3p (OR = 1.95, 95% CI: 0.70 to 5.44, p = 0.20) expression in serum, was also identified.
Table 7
After remeasuring the relative expression of miRs in serum by using different RNA isolation and qPCR method, the changes (%) in odds of having only pathological Aβ42 proteins or pathological Aβ42 and tau proteins (versus normal protein levels) in CSF, per each doubling in the relative miR expression in serum, are given. Models were corrected for sex, age, and years of education. Odds ratios (OR), 95% confidence intervals (95% CI; lower to upper limit) and p-values are provided. When p-value<0.2, the miRs are indicated in bold and underlined
| Odds of having only pathological | Odds of having pathological | |||
| A β42 (versus normal) | A β42 and tau (versus normal) | |||
| MiRs | OR (95% CI) | p | OR (95% CI) | p |
| let-7d-5p | 1.11 (0.28 to 4.46) | 0.88 | 0.18 (0.02 to 1.28) | 0.087 |
| let-7g-5p | 2.08 (0.32 to 13.55) | 0.44 | 0.53 (0.12 to 2.38) | 0.41 |
| miR-15a-5p | 1.29 (0.55 to 3.03) | 0.55 | 0.85 (0.36 to 2.03) | 0.72 |
| miR-26a-5p | 2.34 (0.56 to 9.73) | 0.24 | 0.65 (0.15 to 2.78) | 0.56 |
| miR-26b-5p | 3.28 (0.68 to 15.90) | 0.139 | 0.40 (0.10 to 1.56) | 0.187 |
| miR-29a-3p | 1.64 (0.40 to 6.75) | 0.87 | 1.13 (0.26 to 4.87) | 0.87 |
| miR-30b-5p | 2.56 (0.47 to 13.78) | 0.27 | 0.50 (0.06 to 3.78) | 0.50 |
| miR-93-5p | 1.28 (0.53 to 3.09) | 0.58 | 1.41 (0.55 to 3.60) | 0.48 |
| miR-101-3p | 1.27 (0.50 to 3.20) | 0.61 | 0.78 (0.28 to 2.14) | 0.63 |
| miR-103a-3p | 1.86 (0.57 to 6.11) | 0.30 | 0.74 (0.22 to 2.47) | 0.62 |
| miR-125b-5p | 6.91 (1.12 to 42.56) | 0.037 | 1.45 (0.33 to 6.34) | 0.62 |
| miR-128-3p | 1.95 (0.70 to 5.44) | 0.20 | 1.12 (0.42 to 2.96) | 0.82 |
| miR-132-3p | 1.82 (0.63 to 5.27) | 0.27 | 1.75 (0.50 to 6.13) | 0.38 |
| miR-143-3p | 1.11 (0.29 to 4.24) | 0.87 | 0.23 (0.05 to 1.09) | 0.065 |
| miR-146a-5p | 1.30 (0.33 to 5.14) | 0.71 | 0.69 (0.16 to 2.91) | 0.61 |
| miR-148a-3p | 3.10 (0.68 to 14.16) | 0.145 | 1.38 (0.40 to 4.74) | 0.61 |
| miR-151a-5p | 2.13 (0.52 to 8.73) | 0.29 | 0.69 (0.13 to 3.55) | 0.65 |
| miR-181c-5p | 0.68 (0.22 to 2.09) | 0.51 | 0.06 (0.00 to 1.06) | 0.055 |
| miR-191-5p | 2.08 (0.31 to 13.95) | 0.45 | 0.39 (0.06 to 2.44) | 0.32 |
| miR-210-3p | 1.22 (0.57 to 2.67) | 0.62 | 1.47 (0.61 to 3.49) | 0.39 |
| miR-335-5p | 3.27 (0.79 to 13.51) | 0.102 | 0.82 (0.25 to 2.67) | 0.74 |
| miR-484 | 0.99 (0.34 to 2.88) | 0.98 | 1.94 (0.55 to 6.82) | 0.30 |
| miR-486-5p | 1.30 (0.69 to 2.45) | 0.42 | 1.63 (0.80 to 3.33) | 0.182 |
Receiver operating curve analysis
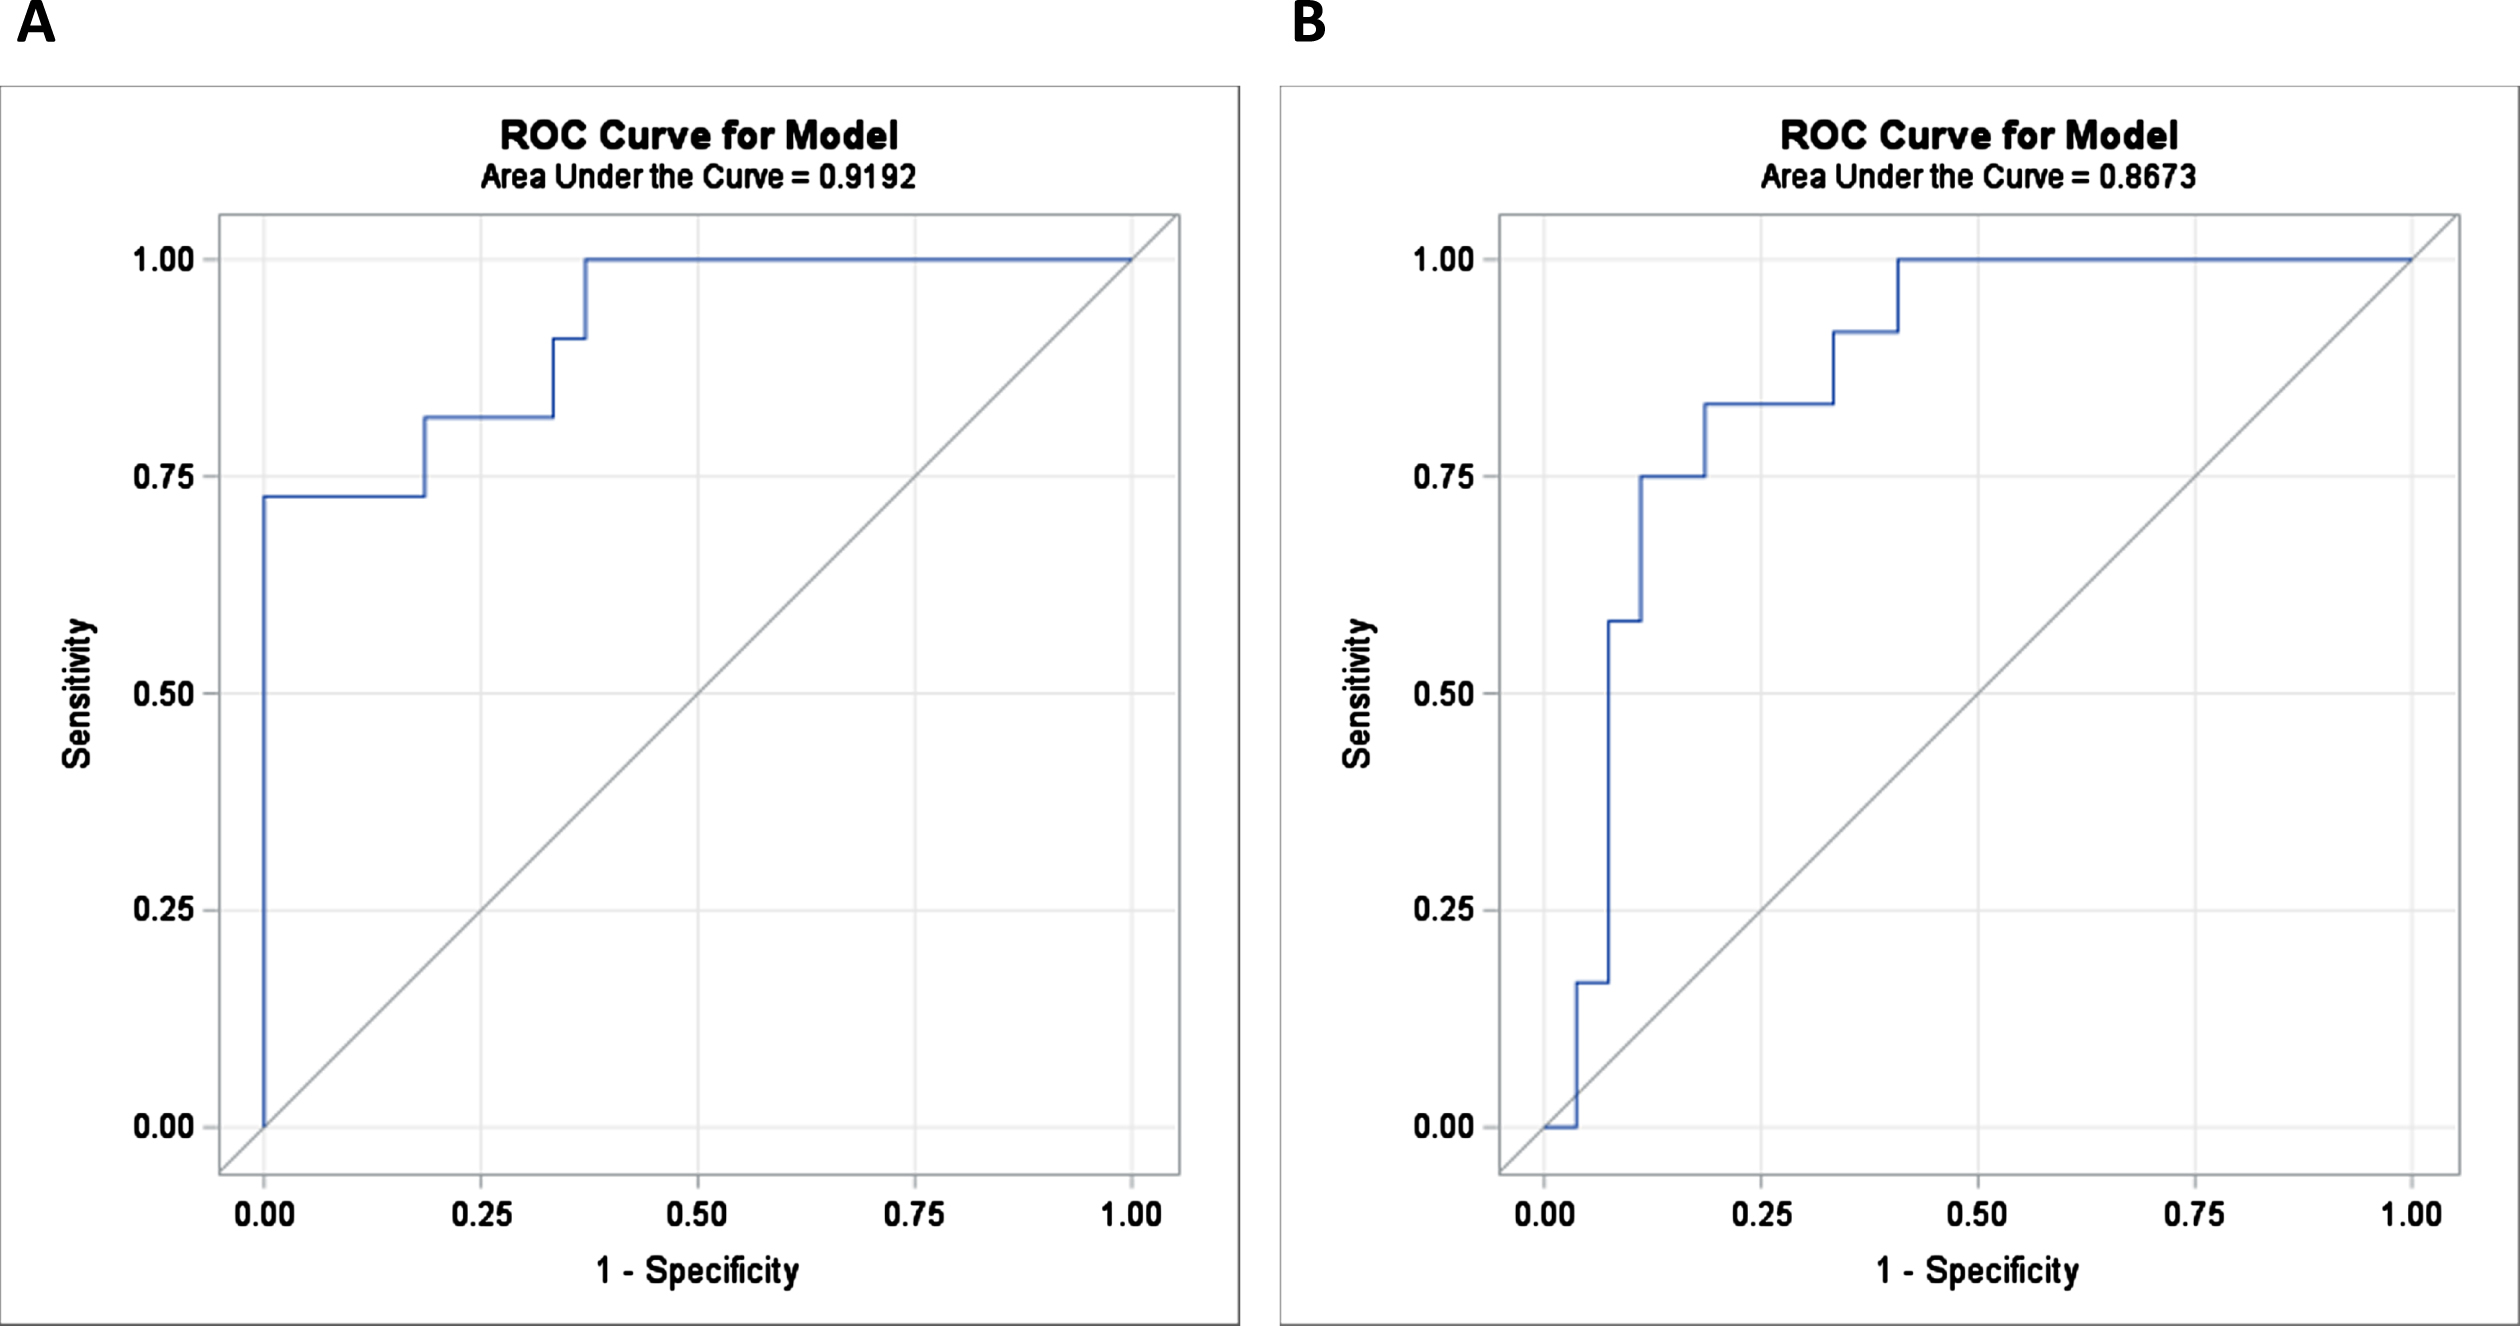
The diagnostic value of the interesting miRs, obtained by both Experiment 1 and Experiment 2, was determined by the areas under receiver operating characteristic curves (ROC), using individual (data not shown) or combinations of the interesting miRs (Table 8). A diagnostic accuracy of a set of 9 miRs (Model 1) showed an AUC value of 0.92 and 0.87 (p < 0.0001) (Fig. 1A, B), using the relative expression of miRs measured by Experiment 1 and Experiment 2, respectively, to distinguish MCI subjects from cognitively normal subjects. In case of the Model 4, representing a combination of 5 miRs, an AUC value >0.83 (p < 0.05) was obtained either by Experiment 1 or by Experiment 2.
Table 8
ROC curve analysis of different combinations of miRs measured by both Experiment 1 and Experiment 2
| Models (# miRs) | Area | 95% CI | p | Area | 95% CI | p |
| Experiment 1 | Experiment 2 | |||||
| Model 1 (9 miRs) | 0.92 | 0.82–1.00 | <0.0001 | 0.87 | 0.75–0.98 | <0.0001 |
| Model 2 (9 miRs) | 0.89 | 0.76–1.00 | <0.0001 | 0.91 | 0.82–1.00 | <0.0001 |
| Model 3 (9 miRs) | 1.00 | 1.00–1.00 | <0.0001 | 0.84 | 0.71–0.97 | 0.001 |
| Model 4 (5 miRs) | 0.83 | 0.70–0.97 | 0.008 | 0.84 | 0.71–0.96 | 0.001 |
Fig. 1
Using ROC analysis, the area under AUC values of the combination of 9 miRs (Model 1) in predicting MCI from cognitively normal subjects. In panel A and B, the ROC curves produced an AUC value of 0.92 (p < 0.0001) and 0.87 (p < 0.0001) corresponding to Experiment 1 and Experiment 2, respectively.
DISCUSSION
According to a recently published study by the Institute for Health Metrics and Evaluation, the global prevalence of dementia is forecasted to triple by 2050, anticipating that the number of people with AD will rise to 153 million people [22]. Due to the complexity of the disease’s biology, the underlying pathological mechanisms of sAD still remain elusive. Given the currently inefficient screening for early stage of sAD and the ineffective pharmaceutical therapies for the treatment of AD, there is an urgent need for reliable biomarker for early detection of the disease at pre-clinical stage. An ideal diagnostic biomarker should detect this prodromal stage of sAD in individuals, aged within 50–65 years, by means of a routine screening, which would be inexpensive, sensitive, specific, and broadly accessible [23].
Strong evidence from numerous studies shows that miRs have a key role in neurodegenerative diseases such as sAD, affecting several processes involved in the disease pathology [15, 24]. miRs may serve as new mechanistic insight into AD pathogenesis by improving the understanding of disease initiation and progression [15]. Remarkably, the focus on the use of miRs as potential diagnostic markers for detecting the early stage of sAD is currently being increased [25]. Alteration in miR expression can be easily and non-invasively measured in biofluids such as blood, and thereby, may be promising biomarkers for detecting the sAD initiation. The measurement of miRs by qPCR in blood is simple and more sensitive compared to the measurement of Aβ42 peptides and t- and p-tau proteins in CSF [26], which is collected by an invasive procedure that requires experienced personnel with advanced surgical skills. Moreover, the miR quantification is more cost-effective than the measurement of the other established AD biomarkers, including structural MRI and molecular neuroimaging with positron emission tomography [25]. Therefore, the identification of candidate miRs in biofluids such as blood for the early detection of sAD pathology can deliver profound benefits not only to public health but also to social costs.
In the present study, using existing data, a set of candidate miRs, already detected in human biofluids, was defined based on their linkage to early stage of sAD. As aforementioned, these miRs have previously been related to early processes linked to a recently proposed tau-driven AOP toward memory loss [15]. In this small-scale study, 23 selected miRs were measured in serum samples of subjects with MCI and cognitively normal subjects. Our main analysis revealed 13 miRs, namely, let-7d-5p, miR-29a-3p, miR-30b-5p, miR-103a-3p, miR-125b-5p, miR-128-3p, miR-132-3p, miR-143-3p, miR-151a-5p, miR-191-5p, miR-335-5p, miR-484, and miR-486-5p, as predictor either for having MCI (versus cognitively normal) or for having only pathological Aβ42 or pathological Aβ42 and tau proteins in CSF, or to be associated with the global composite z-scores.
Furthermore, in order to evaluate possible technological issues and to check the reproducibility of our findings, the same set of 23 miRs was remeasured in the same serum samples, after applying a different RNA isolation and RT-qPCR method, as aforementioned. Across all performed analyses in this second experiment, 15 miRs, including let-7d-5p, miR-26a-5p, miR-26b-5p, miR-30b-5p, miR-101-3p, miR-125b-5p, miR-132-3p, miR-143-3p, miR-146a-5p, miR-148a-3p, miR-181c-5p, miR-191-5p, miR-210-3p, miR-335-5p, and miR-486-5p, were identified to be associated with cognitive impairment or pathological CSF biomarkers. It was confirmed by both experiments that for each doubling in the relative expression of miR-191-5p, the odds of having MCI (versus normal) would increase by a factor of either 1.27 or 2.23 (p < 0.18). In addition, a doubling in the relative expression of miR-125b-5p in serum was (marginally) significantly (p < 0.056) associated with an increase of either 3.75 or 6.91 in odds of having only pathological Aβ42 proteins (versus normal protein levels) in CSF, by both experiments. This may support the reproducibility and measurability of these two miRs across different qPCR platforms using different RNA extraction kits, as well. Whereas, for a doubling in the relative miR-335-5p expression in serum, the odds of having only pathological Aβ42 proteins (versus normal protein levels) in CSF borderline significantly (p < 0.1) decrease or increase by 0.20 or 3.27, in the first or the second experiment, respectively. The observed overall discrepancies in the miR expression between these two experiments could be attributed to possible pre-analytical, analytical, and post-analytical factors which may affect the measurement and reproducibility. Obviously, these interesting miRs seem to be important in our hypothesis, despite the fact that we did not confirm the statistically significant findings in all different performed analyses. Verification of these findings in a larger study population is further needed.
Moreover, the ROC analysis showed that the combination of 9 miRs (Fig. 1A, B) measured either in Experiment 1 or in Experiment 2 resulted in a high diagnostic accuracy with an AUC value >0.87 (p < 0.0001) in detecting MCI subjects from cognitively normal subjects. The findings of the performed ROC analyses were confirmed by both experiments, supporting the importance on remeasuring the same set of miRs in the same set of serum samples, when evaluating diagnostic tools which can be carried out by different technologies.
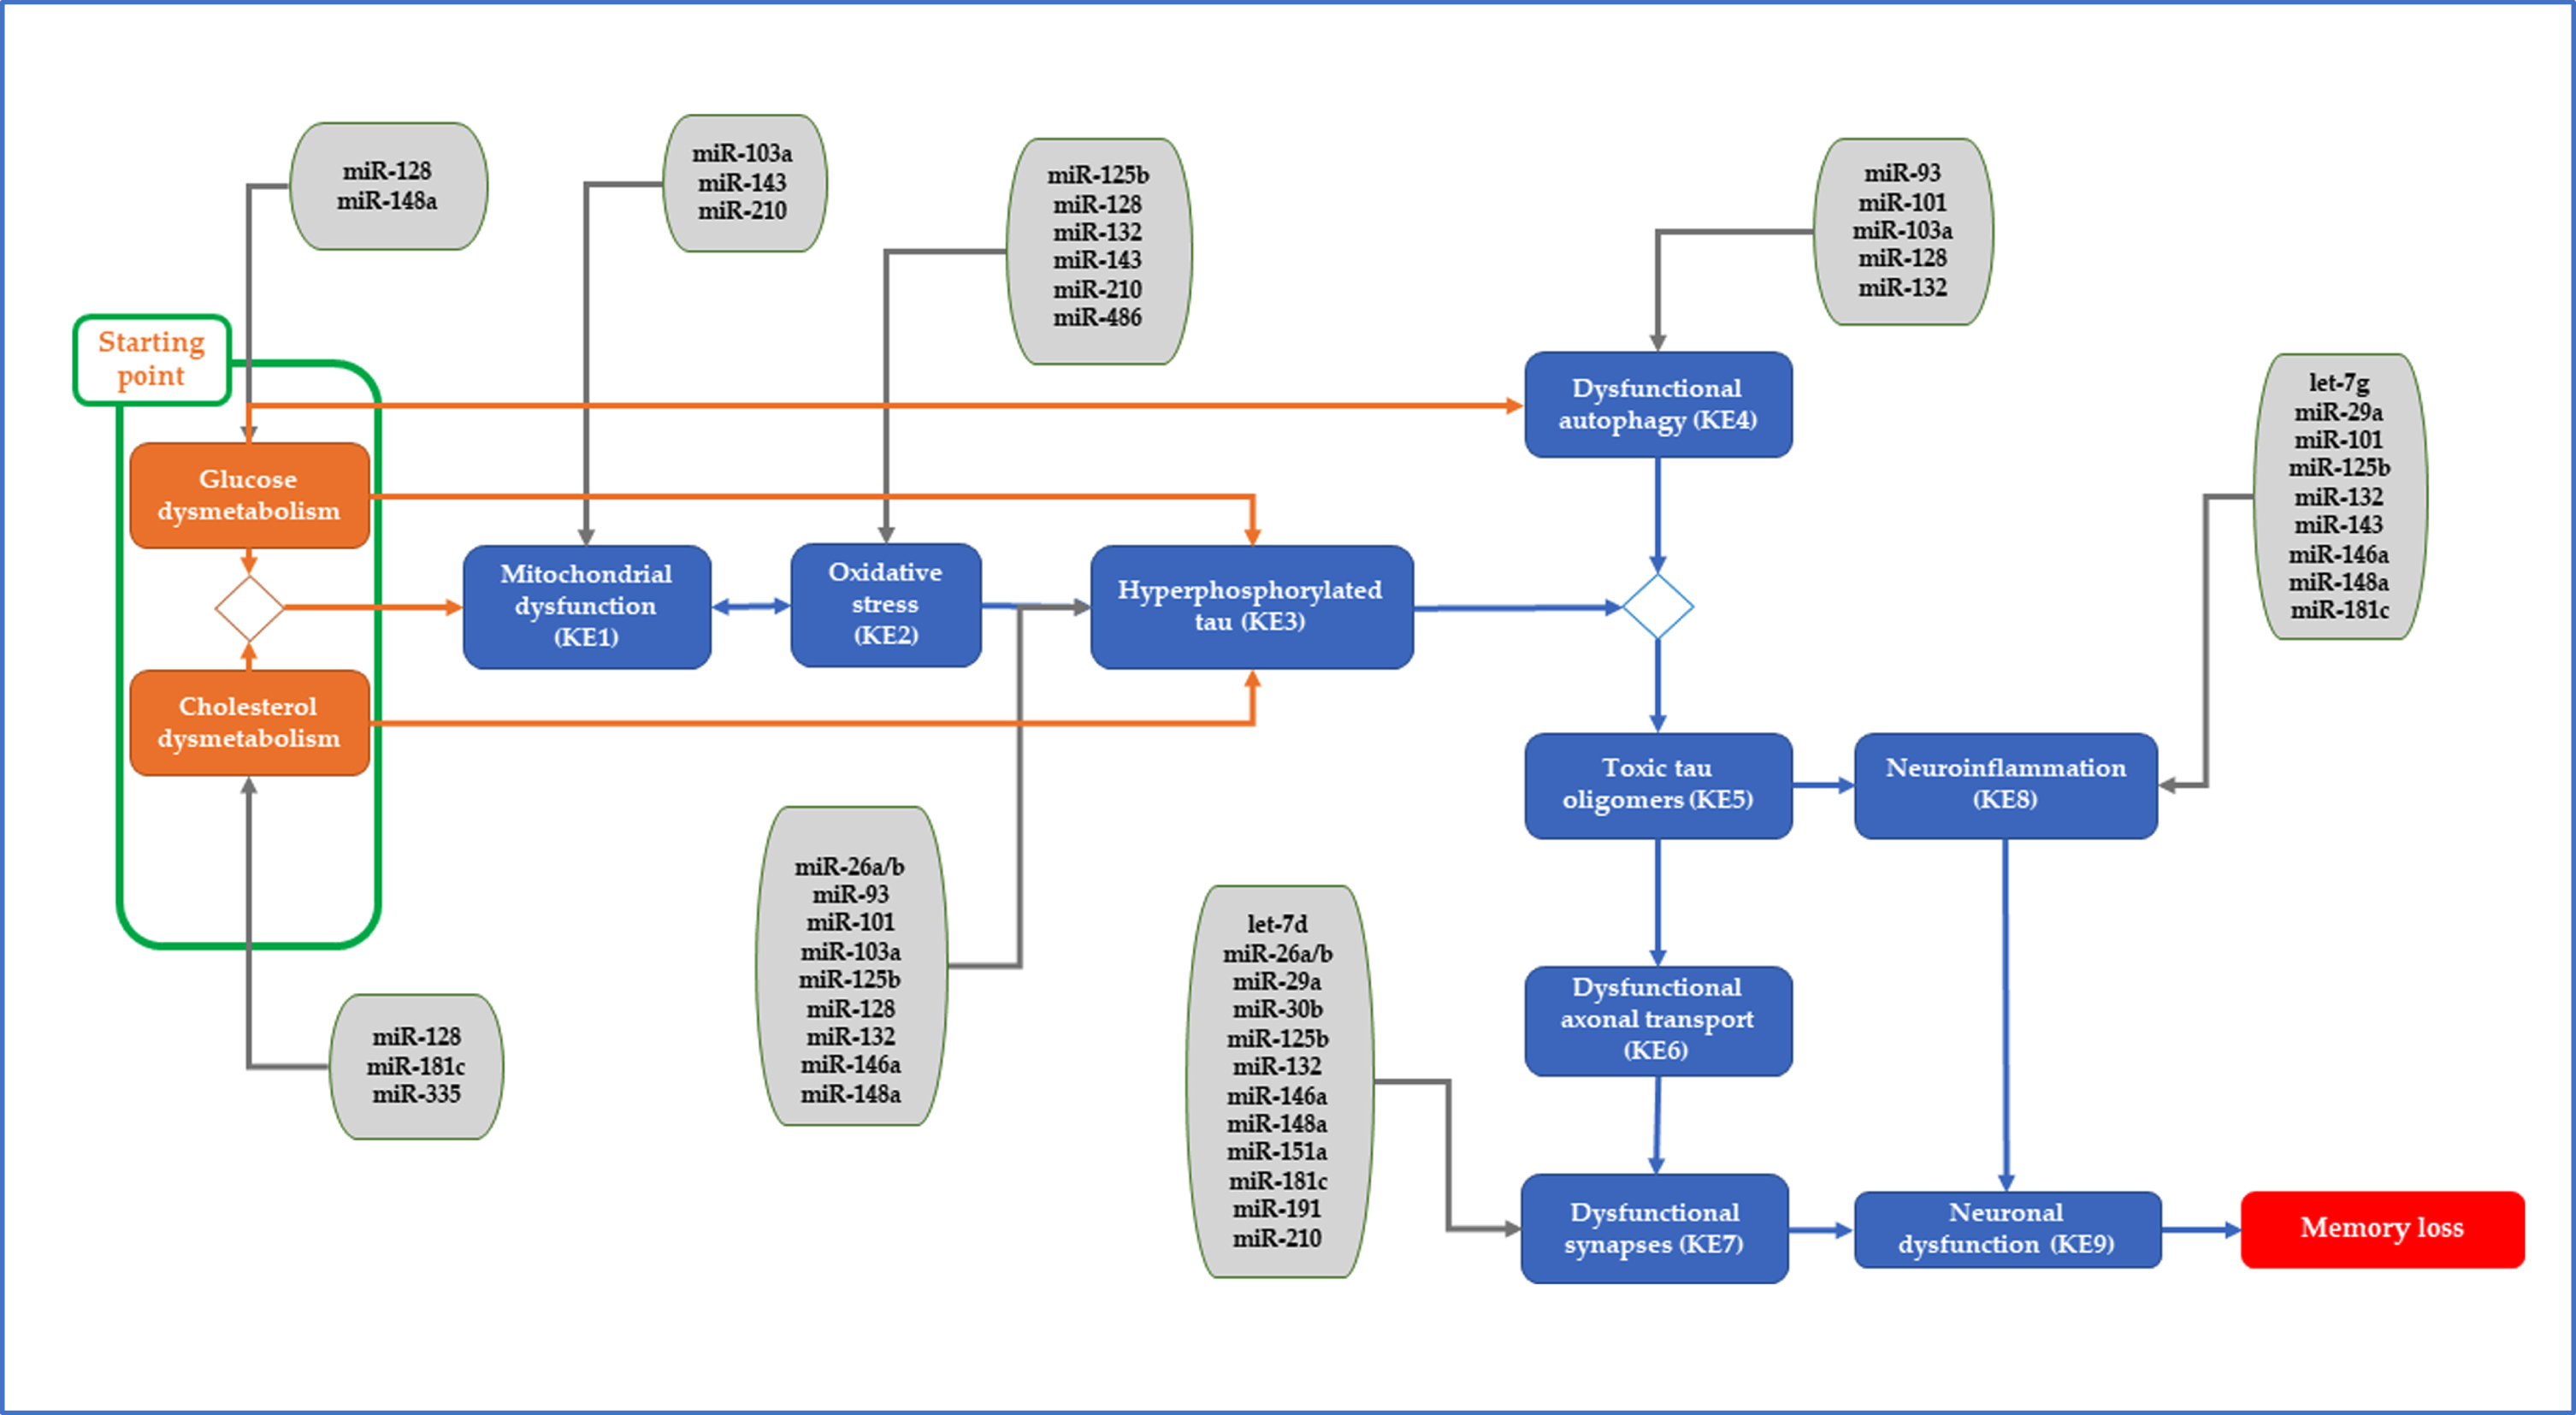
Interestingly, these identified miRs (by both experiments) can be plugged into the recently proposed tau-driven AOP for memory loss (Fig. 2). Considering the suggested hypothetical starting point and the downstream intermediate key events of the tau-driven AOP [14, 15], miR-128-3p, miR-181c-5p, and miR-335-5p have been plugged into cholesterol dysmetabolism; miR-29a-3p, miR-128-3p, and miR-148a-3p into glucose dysmetabolism; miR-103a-3p, miR-143-3p, and miR-210-3p into mitochondrial dysfunction; miR-125b-5p, miR-128-3p, miR-132-3p, miR-143-3p, miR-210-3p, and miR-486-5p into oxidative stress; miR-26a-5p, miR-26b-5p, miR-93-5p, miR-101-3p, miR-103a-3p, miR-125b-5p, miR-128-3p, miR-132-3p, miR-146a-5p, and miR-148-3p into hyperphosphorylated tau; miR-93-5p, miR-101-3p, miR-128-3p, and miR-132-3p into dysfunctional autophagy; let-7d-5p, miR-26a-5p, miR-26b-5p, miR-29a-3p, miR-30b-5p, miR-125b-5p, miR-132-3p, miR-146a-5p, miR-148-3p, miR-151a-5p, miR-181c-5p, miR-191-5p, and miR-210-3p into synaptic dysfunction; and let-7g-5p, miR-29a-3p, miR-101-3p, miR-125b-5p, miR-132-3p, miR-143-3p, miR-146a-5p, miR-148-3p, and miR-181c-5p into neuroinflammation. The aberrant expression of these miRs in serum may affect these early processes leading eventually to the adverse outcome, memory loss. Among these miRs, miR-125b-5p, miR-128-3p, and miR-132-3p have an impact in more than three processes, while other miRs, such as miR-30b-5p, miR-191-5p, miR-335-5p, and miR-486-5p seem to be more specific to one pathological process.
Fig. 2
Identified miRs of interest were plugged into the starting point and/or key events of the proposed tau-driven AOP toward memory loss.
As aforementioned, in clinical practice, among the neuropsychological tests, MMSE scoring (ranging from 0–30) is often used for a quick assessment of the cognitive function of the individuals [27]. These MMSE scores are obtained by questionnaires addressing possible problems in attention, orientation, memory, or language of the participants. In our study, based on the obtained MMSE scores during the 1st visit of the participants, there was a statistically significant difference in the scores from those subjects with MCI (25.55–29.15) and cognitively normal subjects (28.12–30.18). However, we did not consider the MMSE scores as an objective or accurate assessment of the cognitive status of the participants, thereby, the associations of miR expression in serum with the obtained MMSE scores were not explored in this study. Instead, the use of the global composite z-score, derived from the outcomes of individual cognitive domain scores (memory, language, visuospatial, attention-speed, executive), has earlier been supported for its accuracy of the cognitive function [16].
It is worth noticing that there is often misclassification of the study participants, grouping MCI as AD patients, resulting in false conclusions, especially for studies in which molecular biomarkers, i.e., miRs, in brain or biological fluids are associated with the early signs of cognitive decline in the study participants. Therefore, the availability of clinical measurements, such as CSF measurements of the pathological Aβ and tau proteins, is considered of great importance in reflecting possible cognitive decline in the study participants. In addition, the re-assessment data collected during the follow-up of the participants are also very valuable for the proper assignment of the study participants in the correct groups by confirming whether the groups based on baseline data remain the same as those based on the follow-up data. This might contribute to a better understanding of the obtained findings.
To our knowledge this the first study which investigates the potential associations of circulating miRs, known to be involved in early AD, with the odds of having MCI, or with clinical measurements such as pathological Aβ and tau proteins in CSF, or with cognitive function using the composite z-scores. However, the size of this study is relatively small, and in addition to another limitation on the availability of the protein measurements in CSF of only 26 subjects of the study population, further weakens the statistical power our study. Taking into account this limitation of the small study size, we reported findings based on a less conservative than the usual cut-off (p < 0.2), in order to avoid discarding biologically significant and relevant findings by only based on the p-value and not on other aspects as sample or effect size [28–30]. Lastly, despite the fact that our statistical models were corrected for a potential set of covariates, such as sex, age, and years of education, we cannot rule out the possibility of other unknown or unmeasured variables to critically impact our outcomes.
In clinical research, the ability to reproduce important findings in the same study population using same methods and data, performed by different investigators in different laboratories and instruments is considered as fundamental for the supporting scientific evidence [31]. Hence, the evaluation of potential technical biases should be addressed. Our identified miRs among the different approaches performed by the two experimental sets up may increase their candidacy in promising molecular biomarkers for detecting early signs of memory loss accompanied by cognitive impairment. Moreover, the consideration of combined approaches for the classification of the study participants, based on the data retrieved either from baseline/follow-up or from clinical measurements, may be more beneficial than using only one approach. By applying combination of different approaches, information gaps in the collected data by missing values can be bridged, avoiding exclusions of subjects from the analysis. Particularly, in this type of clinical research, where the availability of blood samples collected from individuals at this age window (<65 years), who are recruited for the assessment of their cognitive state, and also further followed-up, is very scarce.
In conclusion, in this small-scale study, a set of circulating miRs, previously shown to be relevant to early stage of sAD, was measured in serum samples of subjects who were cognitively normal and had a diagnosis of MCI. Alteration in the relative expression of miRs was identified to be linked either to pathological Aβ and tau proteins measured in CSF or to cognitive impairment. The identification of promising circulating miRs may serve a new biomedical approach for filling in the gap in the currently inefficient detection of the preclinical and prodromal stage of the sAD.
ACKNOWLEDGMENTS
We would like to thank the department of Toxicogenomics (TGX), at Maastricht University (UM) for allowing us to use their laboratories for performing the first experimental part of this study.
FUNDING
This work was supported by EUROSTARS funding [115456 PROAD, 2021]; ToxGenSolutions BV (https://toxgensolutions.eu); and 3Rs Management and Consulting ApS (https://3rsmc-aps.com).
CONFLICT OF INTEREST
The authors have no conflict of interest to report.
SUPPLEMENTARY MATERIAL
[1] The supplementary material is available in the electronic version of this article: https://dx.doi.org/10.3233/JAD-230001.
REFERENCES
[1] | World Health Organization (2017) Global action plan on the public health response to dementia 2017 - 2025.WHO. |
[2] | Hui JS , Wilson RS , Bennett DA , Bienias JL , Gilley DW , Evans DA ((2003) ) Rate of cognitive decline and mortality in Alzheimer’s disease. Neurology 61: , 1356–1361. |
[3] | Calabrò M , Rinaldi C , Santoro G , Crisafulli C ((2020) ) The biological pathways of Alzheimer disease: A review. AIMS Neurosci 8: , 86–132. |
[4] | Leandrou S , Mamais I , Petroudi S , Kyriacou PA , Reyes-Aldasoro CC , Pattichis CS (2018) Hippocampal and entorhinal cortex volume changes in Alzheimer’s disease patients and mild cognitive impairment subjects. BHI, 235-238. |
[5] | Jessen F , Amariglio RE , Buckley RF , van der Flier WM , Han Y , Molinuevo JL , Rabin L , Rentz DM , Rodriguez-Gomez O , Saykin AJ , Sikkes SAM , Smart CM , Wolfsgruber S , Wagner M ((2020) ) The characterisation of subjective cognitive decline. Lancet Neurol 19: , 271–278. |
[6] | Beason-Held LL , Goh JO , An Y , Kraut MA , O’Brien RJ , Ferrucci L , Resnick SM ((2013) ) Changes in brain function occur years before the onset of cognitive impairment. J Neurosci 33: , 18008–18014. |
[7] | Ivey KN , Srivastava D ((2015) ) microRNAs as developmental regulators. Cold Spring Harb Perspect Biol 7: , a008144–a008144. |
[8] | Li Y , Kowdley KV ((2012) ) microRNAs in common human diseases. Genomics Proteomics Bioinformatics 10: , 246–253. |
[9] | Blondal T , Jensby Nielsen S , Baker A , Andreasen D , Mouritzen P , Wrang Teilum M , Dahlsveen IK ((2013) ) Assessing sample and miRNA profile quality in serum and plasma or other biofluids. Methods 59: , S1–S6. |
[10] | Basavaraju M , de Lencastre A ((2016) ) Alzheimer’s disease: Presence and role of microRNAs. Biomol Concepts 7: , 241–252. |
[11] | Bier J-C , Verschraegen J , Vandenberghe R , Guillaume B , Picard G , Otte G , Mormont E , Gilles C , Segers K , Sieben A , Thiery E , Ventura M , De Deyn P , Deryck O , Versijpt J , Salmon E , Engelborghs S , Ivanoiu A ((2015) ) Clinical utility and applicability of biomarker-based diagnostic criteria for Alzheimer’s disease: A BeDeCo survey. Acta Neurol Belg 115: , 547–555. |
[12] | Bjerke M , Engelborghs S ((2018) ) Cerebrospinal fluid biomarkers for early and differential Alzheimer’s disease diagnosis. J Alzheimers Dis 62: , 1199–1209. |
[13] | Sheinerman KS , Toledo JB , Tsivinsky VG , Irwin D , Grossman M , Weintraub D , Hurtig HI , Chen-Plotkin A , Wolk DA , McCluskey LF , Elman LB , Trojanowski JQ , Umansky SR ((2017) ) Circulating brain-enriched microRNAs as novel biomarkers for detection and differentiation of neurodegenerative diseases. Alzheimers Res Ther 9: , 89. |
[14] | Tsamou M , Pistollato F , Roggen EL ((2021) ) A tau-driven adverse outcome pathway blueprint toward memory loss in sporadic (late-onset) Alzheimer’s disease with plausible molecular initiating event plug-ins for environmental neurotoxicants. J Alzheimers Dis 81: , 459–485. |
[15] | Tsamou M , Carpi D , Pistollato F , Roggen EL ((2022) ) Sporadic Alzheimer’s disease- and neurotoxicity-related microRNAs affecting key events of tau-driven adverse outcome pathway toward memory loss. J Alzheimers Dis 86: , 1427–1457. |
[16] | Kalligerou F , Ntanasi E , Voskou P , Velonakis G , Karavasilis E , Mamalaki E , Kyrozis A , Sigala E , Economou NT , Patas K , Yannakoulia M , Scarmeas N ((2019) ) Aiginition Longitudinal Biomarker Investigation Of Neurodegeneration (ALBION): Study design, cohort description, and preliminary data. Postgrad Med 131: , 501–508. |
[17] | Petersen RC , Doody R , Kurz A , Mohs RC , Morris JC , Rabins PV , Ritchie K , Rossor M , Thal L , Winblad B ((2001) ) Current concepts in mild cognitive impairment. Arch Neurol 58: , 1985–1992. |
[18] | Vlachos GS , Kosmidis MH , Yannakoulia M , Dardiotis E , Hadjigeorgiou G , Sakka P , Ntanasi E , Stefanis L , Scarmeas N ((2020) ) Prevalence of mild cognitive impairment in the elderly population in Greece: Results from the HELIAD Study. Alzheimer Dis Assoc Disord 34: , 156–162. |
[19] | Vlachos GS , Kosmidis MH , Yannakoulia M , Dardiotis E , Hadjigeorgiou G , Tzoulaki I , Georgiou AN , Sakka P , Anastasiou CA , Stefanis L , Scarmeas N ((2021) ) Incidence of mild cognitive impairment in the elderly population in Greece: Results from the HELIAD study. Aging Clin Exp Res 33: , 2679–2688. |
[20] | Scarmeas N , Daskalaki A , Kalligerou F , Ntanasi E , Mamalaki E , Gargalionis AN , Patas K , Chatzipanagiotou S , Yannakoulia M , Constantinides VC ((2022) ) Initial data and a clinical diagnosis transition for the Aiginition Longitudinal Biomarker Investigation of Neurodegeneration (ALBION) Study. Medicina 58: , 1179. |
[21] | Anastasiou CA , Yannakoulia M , Kosmidis MH , Dardiotis E , Hadjigeorgiou GM , Sakka P , Arampatzi X , Bougea A , Labropoulos I , Scarmeas N ((2017) ) Mediterranean diet and cognitive health: Initial results from the Hellenic Longitudinal Investigation of Ageing and Diet. PLoS One 12: , e0182048. |
[22] | Nichols E , Steinmetz JD , Vollset SE , Fukutaki K , Chalek J , Abd-Allah F , Abdoli A , Abualhasan A , Abu-Gharbieh E , Akram TT , et al. ((2022) ) Estimation of the global prevalence of dementia in 2019 and forecasted prevalence in 2050: An analysis for the Global Burden of Disease Study 2019. Lancet Public Health 7: , e105–e125. |
[23] | Consensus report of the Working Group on: “Molecular and Biochemical Markers of Alzheimer’s Disease”. The Ronald and Nancy Reagan Research Institute of the Alzheimer’s Association and the National Institute on Aging Working Group. ((1998) ) Neurobiol Aging 19: , 109–116. |
[24] | Tan L , Yu J-T , Hu N , Tan L ((2013) ) Non-coding RNAs in Alzheimer’s disease. Mol Neurobiol 47: , 382–393. |
[25] | Angelucci F , Cechova K , Valis M , Kuca K , Zhang B , Hort J ((2019) ) microRNAs in Alzheimer’s disease: Diagnostic markers or therapeutic agents? Front Pharmacol 10: , 665. |
[26] | Kumar S , Vijayan M , Bhatti JS , Reddy PH ((2017) ) MicroRNAs as peripheral biomarkers in aging and age-related diseases. Prog Mol Biol Transl Sci 146: , 47–94. |
[27] | Pezzotti P , Scalmana S , Mastromattei A , Di Lallo D , Progetto Alzheimer Working Group ((2008) ) The accuracy of the MMSE in detecting cognitive impairment when administered by general practitioners: A prospective observational study. BMC Fam Pract 9: , 29–29. |
[28] | Tanha K , Mohammadi N , Janani L ((2017) ) P-value: What is and what is not. Med J Islam Repub Iran 31: , 65. |
[29] | Thiese MS , Ronna B , Ott U ((2016) ) P value interpretations and considerations. J Thorac Dis 8: , E928–E931. |
[30] | Greenland S , Senn SJ , Rothman KJ , Carlin JB , Poole C , Goodman SN , Altman DG ((2016) ) Statistical tests, P values, confidence intervals, and power: A guide to misinterpretations. Eur J Epidemiol 31: , 337–350. |
[31] | Niven DJ , McCormick TJ , Straus SE , Hemmelgarn BR , Jeffs L , Barnes TRM , Stelfox HT ((2018) ) Reproducibility of clinical research in critical care: A scoping review. BMC Med 16: , 26–26. |


