
A Preliminary Comparison of the Methylome and Transcriptome from the Prefrontal Cortex Across Alzheimer’s Disease and Lewy Body Dementia
Abstract
Background:
Pathological amyloid-β and α-synuclein are associated with a spectrum of related dementias, ranging from Alzheimer’s disease (AD) and dementia with Lewy bodies (DLB) to Parkinson disease dementia (PDD). While these diseases share clinical and pathological features, they also have unique patterns of pathology. However, epigenetic factors that contribute to these pathological differences remain unknown.
Objective:
In this preliminary study, we explore differences in DNA methylation and transcription in five neuropathologically defined groups: cognitively unimpaired controls, AD, pure DLB, DLB with concomitant AD (DLBAD), and PDD.
Methods:
We employed an Illumina Infinium 850k array and RNA-seq to quantify these differences in DNA methylation and transcription, respectively. We then used Weighted Gene Co-Network Expression Analysis (WGCNA) to determine transcriptional modules and correlated these with DNA methylation.
Results:
We found that PDD was transcriptionally unique and correlated with an unexpected hypomethylation pattern compared to the other dementias and controls. Surprisingly, differences between PDD and DLB were especially notable with 197 differentially methylated regions. WGCNA yielded numerous modules associated with controls and the four dementias: one module was associated with transcriptional differences between controls and all the dementias as well as having significant overlap with differentially methylated probes. Functional enrichment demonstrated that this module was associated with responses to oxidative stress.
Conclusion:
Future work that extends these joint DNA methylation and transcription analyses will be critical to better understanding of differences that contribute to varying clinical presentation across dementias.
INTRODUCTION
With the exception of vascular dementia, nearly all of the neurodegenerative dementias are characterized by the effects of a few neurotoxic proteins, most notably amyloid-β (Aβ), hyperphosphorylated tau (p-tau), α-synuclein (α-syn), and TAR DNA-binding protein 43 (TDP-43) [1, 2]. Aβ aggregation into amyloid plaques is pathognomonic for Alzheimer’s disease (AD) [3, 4], while α-syn aggregation into Lewy bodies (LBs) is similarly characteristic for dementia with Lewy bodies (DLB) and Parkinson’s disease dementia (PDD) [5], representing the two most frequent neurodegenerative processes resulting in dementia [6]. While AD is the most common neurodegenerative disease, LB disorders are the next most common [6], and DLB in particular has higher costs, faster mortality from disease onset, and greater burden of neuropsychiatric symptoms than AD [7–9].
Despite the strong concordance of these pathological motifs with characteristic clinical syndromes, there is significant neuropathological overlap that makes it difficult to singly classify each clinical case [10–14]. The most striking example of this is the strong neuropathological overlap between DLB and PDD [12–15]. Though PDD is distinguished clinically from DLB by the presence of motor symptoms preceding psychiatric and cognitive changes by at least 1 year [5, 16], postmortem analyses focusing on LB deposition without clinical data are notoriously poor at differentiating the two syndromes, even when the pattern of LB spread is considered [13, 17, 18]. This has led many to posit that these two disorders are pathogenically similar and exist on the same spectrum, though some evidence to the contrary also exists [12, 19]. For instance, despite the shared pathological hallmark and similar core symptoms, there are differences in duration of illness and frequency of non-cognitive, neuropsychiatric symptoms between the two disorders [9, 15, 20–22]. Furthermore, while neuropsychiatric symptoms are frequently observed in DLB, they are much less commonly present in PDD [9].
In addition to the neuropathological similarities between DLB and PDD, similar ambiguities exist within the neuropathological classification of DLB and AD based on the presence or absence of amyloid plaques [10, 12, 19, 23]. Some patients with DLB have considerable amyloid plaques and neurofibrillary tangles that meet neuropathological criteria for AD— hereafter referred to as DLB with AD (DLBAD)— while others express substantial LB pathology with low or no Aβ burden— hereafter referred to as DLB. It remains unclear as to whether DLBAD represents two neurodegenerative processes, a single process whereby α-syn promotes pathogenic changes in p-tau and Aβ, or a novel mechanism where an upstream factor promotes formation of both aggregates independently [7, 14, 15].
Many researchers have begun to embrace a “multi-hit” model of neurodegeneration, whereby genetic background combines with earlier life events, promoting epigenetic changes that ultimately lead to the expression and aggregation of these pathogenic proteins over a long latency period before clinically apparent symptoms [24]. Processes like histone modification and chromatin reorganization, prion-like protein structure changes, DNA oxidation, and DNA methylation are some of the epigenetic processes that may lead to molecular conditions that facilitate the latent period and subsequent conversion to disease [25]. For instance, a general trend toward DNA hypomethylation has been shown to be strongly tied to aging [25, 26], the most consistent risk factor for all neurodegenerative diseases.
The analyses of postmortem samples in individuals with dementia cannot necessarily fully elucidate the process of disease conversion or of a ten-to-twenty-year disease progression, yet the strong influence of these epigenetic mechanisms and the ambiguities in overlap between pathogenic molecules suggests a clear need for methylation studies in dementia. And while individual studies of both AD and LB spectrum dementias have been completed, very few have investigated the overlap among Aβ- and LB-associated diseases in terms of transcription and DNA methylation [27]. In this preliminary study, we characterized both the transcriptome and DNA methylome in the prefrontal cortex (PFC) of multiple dementias including AD, DLB, DLBAD, and PDD, comparing these dementias to each other and to otherwise healthy, age-matched controls. We employed the most advanced iteration of DNA methylation microarrays, the MethylationEPIC BeadChip Infinium 850K, which captures a priori loci selected for commercial purposes other than dementia but nearly doubles the number of differentially methylated sites used to evaluate these dementias compared to previous studies [28]. In doing so, we uncovered striking patterns of mRNA expression and DNA methylation that either unite or differentiate these four diseases.
MATERIALS AND METHODS
Subjects and diagnostic classifications
Subjects with dementia or cognitively unimpaired controls, hereafter referred to as controls, were enrolled in one of six AD centers (ADCs): Rush University Medical Center (12 controls, 19 AD, 12 DLB, 19 DLBAD); University of Pennsylvania (2 controls, 2 DLB, 18 PDD); Oregon Health and Science University (3 controls, 1 DLB); University of Kentucky (1 control, 2 DLB); University of Washington (1 control, 1 DLB, 1 PDD); and University of Pittsburgh (1 DLB). In addition, cases were also drawn from the Rush Memory and Aging Project (MAP). Expert diagnosticians at the research centers reviewed subject clinical history, physical examinations, and neuropsychological tests at a consensus diagnosis conference. All individuals included in the dementia group received a clinical diagnosis of “probable AD,” “possible AD,” or “dementia, type unknown” according to the National Institute of Neurological and Communicative Disorders and Stroke and the AD and Related Disorders Association criteria [29].
Subjects with PDD were enrolled in studies at the University of Washington, Oregon Health Science University, University of Pennsylvania, or Northwest or Philadelphia Parkinson Disease Research, Education, and Clinical Centers. All patients satisfied UK PD Society Brain Bank Clinical diagnostic criteria for PD [30], met criteria proposed by a Movement Disorders Society Task Force for probable dementia associated with PD [31], and had onset of parkinsonism more than one year before the diagnosis of dementia.
Controls were elderly adults who were enrolled in longitudinal studies of normal aging (Rush’s Religious Orders Study/Memory and Aging Project) and were cognitively normal at study entry, as determined by a clinical consensus that considered both clinical history and neuropsychological testing. Controls remained free of cognitive impairment, defined as Mini-Mental State Examination score >26 within three years of death and a Clinical Dementia Rating score <1.
All autopsied cases underwent a standard histologic evaluation using hematoxylin & eosin, modified Bielschowsky, and thioflavin S methods. Immunostaining for LB neuropathological changes was also performed on all autopsied cases using alpha-synuclein immunohistochemistry with antibody LB509 (1:50 to 1:400; Zymed, San Francisco, CA), as previously described [32]. Cases with questionable LB509 immunoreactivity were evaluated with a second antibody to nitrated alpha-synuclein (syn 303, 1:1,000) [33]. A section from each of the following 5 regions was assessed for LBD neuropathological changes: medulla, substantia nigra, amygdala, cingulate gyrus, and frontal cortex. The only exception was that 3 regions (substantia nigra, cingulate gyrus, and frontal cortex) rather than 5 regions were assessed for LBD neuropathological changes in cases and controls from Rush University Medical Center. Braak staging [34] for neurofibrillary tangles and Consortium to Establish a Registry for AD (CERAD) plaque score [35] were determined using modified Bielschowsky-stained sections, tau immunohistochemistry (AT8, Endogen, 1:250), or both. We did not have sufficient resources to systematically assess other pathologies (e.g., TDP-43).
All subjects with dementia underwent autopsy and were neuropathologically classified as DLB, DLBAD, AD, or PDD (n = 19 in each diagnosis group) based on AD and LBD neuropathological changes, as previously described [36, 37]. Briefly, AD was defined by Braak stage IV, V, or VI and a CERAD plaque score of “moderate” or “frequent” but no LBD neuropathological changes. DLBAD was defined by the presence of both high-level AD neuropathological changes and limbic or neocortical stage LBD neuropathological changes. DLB and PDD groups were defined by the presence of limbic or neocortical stage LBD and no or low levels of AD neuropathological changes, and the two diagnoses were differentiated further by clinical characteristics. The autopsied control group showed no evidence of LBs or high-level AD neuropathological changes. All included subjects were of European ancestry, as tissue samples from other backgrounds were not available.
Given that we required frozen tissue to extract sufficient DNA and RNA for the study procedures, we limited inclusion to study subjects who had sufficient brain tissue extracted from the frontal cortex using standard methods. Further, we required subjects to have APOE genotyping, and due to a low number of APOE ɛ4/ɛ4 controls, we did not include this genotype in our final analysis.
Standard protocol approvals, registrations, and patient consents were obtained. All study procedures were approved by the institutional review boards at each participating site. This study was done in accord with the ethical standards of the Helsinki Declaration of 1975.
APOE genotyping and nucleic acid purification
Qiagen AllPrep DNA/RNA Mini Kit (cat no 80284) was used to extract RNA and DNA according to the manufacturer’s instructions; the tissue was prepared from ∼30 mg of fresh frozen tissue. Nucleic acid concentrations were measured by NanoPhotometer (Implen). The presence of APOE alleles was determined by genotyping rs429358 and rs7412 by TaqMan Assay (Applied Biosystems). In addition, given that we had previously found methylation differences by APOE genotypes [38], we limited the study sample to those with APOE ɛ3/ɛ3 orɛ3/ɛ4.
Methylated DNA assay
DNA was sent to the UW Northwest Genomics Center, where the dsDNA concentration was confirmed with Quant-iT PicoGreen dsDNA kit (Invitrogen). Sex was confirmed using an ABI TaqMan assay specific for X/Y regions. After quality control, assessment of methylated DNA was performed using the Illumina Infinium MethylationEPIC array, detecting the total methylation level of over 850,000 methylation sites throughout the human genome at single nucleotide resolution. Briefly, upon bisulfite treatment, unmethylated cytosines are converted to uracils, while methylated cytosines (both 5mC and 5hmC) remain unchanged. Infinium HD array technology interrogates these differentiated loci using site-specific probes, designed for the methylated and unmethylated sites respectively. The level of total methylation for the interrogated locus can be determined by calculating the ratio of the fluorescent signals from the methylated versus unmethylated sites.
Differentially methylated DNA analysis
IDAT files was loaded into R and underwent initial quality control using the package Minfi (v1.22.1) [39]. Two outliers (1 control and 1 DLB) were identified using MDS plots and were removed from analysis, leaving n = 18–19 for each of the 5 groups. Detection P (detP) values via Minfi were <0.05. Sex prediction was performed, and all samples were in accordance with predictions. A scatter plot of median methylated and unmethylated intensities showed no outliers. Data were normalized for dye intensity bias with ssNoob. Probes with detP >0.01 in one or more samples, probes on sex chromosomes, probes with SNPs at CpG sites, or probes that were identified previously as cross-reactive were removed from analysis, yielding 764,186 probes for downstream analysis.
To increase the chances of detecting differences in methylation, each group was compared to each other without correction for multiple comparisons, as each group comparison was pairwise and independent statistically. However, each individual methylation site was appropriately tested with statistical approaches to reduce false positive rates from multiple testing. To increase chances of detecting differences in methylation, each group was compared to each other without correction for multiple group comparisons, as each group comparison was pairwise and independent statistically. However, each individual methylation site was appropriately tested with statistical approaches to reduce false positive rates from multiple testing.
Variation in the data was inspected with MDS plots before differential methylation analysis was performed with limma [40]. Beta-values were converted to M-values before analysis. As a covariate in the linear model, the number of NeuN-positive and NeuN-negative cells was estimated with R package FlowSorted.DLPFC.450K [41]. The experimental design was modeled as 0 + diagnosis + age + sex + NeuN-positive + NeuN-negative. 10 pairwise data comparisons between the 5 diagnoses were performed: control versus AD, control versus DLB, control versus DLBAD, control versus PDD, AD versus DLB, AD versus DLBAD, AD versus PDD, DLB versus DLBAD, DLB versus PDD, and DLBAD versus PDD. Differentially methylated probes (DMPs) were defined as p < 0.001 and logFC >0.2. The gometh function from package missMethyl [42] was used to perform functional enrichment analysis from DMPs using a hypergeometric test that takes into account the number of CpGs for each gene. The Gene Ontology (GO) and Kyoto Encyclopedia of Genes and Genomes (KEGG) databases were used for functional enrichment analysis. Further identification of differentially methylated regions (DMRs) was completed via DMRcate [43].
RNA sequencing
RNA was sent to the UW Northwest Genomics Center, who undertook multiple quality control steps including RNA quantification with Qubit RNA assay (Invitrogen) and RNA integrity number (RIN) analysis using a fragment analyzer (Advanced Analytical). Sixty-eight of the 95 potential samples had a RIN >5 and were further processed. Total RNA was normalized to 10 ng/μl in a total volume of 50μl on the Perkin Elmer Janus Workstation (Perkin Elmer, Janus II). Poly-A selection and cDNA synthesis were performed using the TruSeq Stranded mRNA kit as outlined by the manufacturer (Illumina; cat no RS-122-2103). All steps were automated on the Perkin Elmer Sciclone NGSx Workstation to reduce batch to batch variability and to increase sample throughput. Final RNASeq libraries were quantified using the Quant-it dsDNA high sensitivity assay, and library insert size distribution was checked using a fragment analyzer (Advanced Analytical; kit ID DNF474). Technical controls (K562, Thermo Fisher Scientific, cat# AM7832) were compared to expected results to ensure that batch-to-batch variability is minimized. Successful libraries are normalized to 10 nM for submission to sequencing. Barcoded libraries were pooled using liquid handling robotics prior to loading. Massively parallel sequencing-by-synthesis with fluorescently labeled, reversibly terminating nucleotides was carried out on the NovaSeq6000 sequencer (RTA 3.1.5)
Differentially expressed gene (DEG) analysis
Demultiplexed, unaligned BAM files produced by Picard ExtractIlluminaBarcodes and IlluminaBasecallsToSam were converted to FASTQ format using SamTools bam2fq (v1.4). The FAST-X toolkit was used to determine sequence quality. Sixty-seven of 95 samples passed quality assurance and were included in later transcriptome analysis. Further, samples with library sizes <15M were excluded, as these samples were identified as outliers on PCA. This led to removal of another 4 samples. Final number of samples per group were as follows: NControl = 16, NAD = 13, NDLB = 12, NDLBAD = 10, NPDD = 8. STAR [44] was used to align and annotate reads based on the reference transcriptome GENCODE v26 (GRCH38.p10). RSEM [45] (v1.3.0) was used to quantify reads. EdgeR [46] was used for data-integrated meta-data and count data for later pre-processing and data exploration. Only read fragments that corresponded to protein-coding genes were quantified. Library size normalization was achieved by converting raw data to counts per million (CPM) while composition bias normalization was achieved by trimmed mean of M-values (TMM). Genes that were expressed at very low levels were filtered out using a threshold of <1 CPM in more than 10 samples; 13,212 genes were identified for analysis.
Limma was used to create linear models and determine differential expression among 10 pairwise comparisons: control versus AD, control versus DLB, control versus DLBAD, control versus PDD, AD versus DLB, AD versus DLBAD, AD versus PDD, DLB versus DLBAD, DLB versus PDD, and DLBAD versus PDD. First, as variance is not independent of mean, raw counts were transformed and normalized using voom. Models were adjusted for gender and RIN. DEGs were identified using stringent and liberal criteria of Benjamini-Hochberg-adjusted p-value < 0.05 and unadjusted p-value < 0.05.
To reduce concerns of major differences in cell populations, BRETIGEA [47] was used to estimate relative cell abundance across 6 cell types: astrocytes, endothelial cells, microglia, neurons, oligodendrocytes, and oligodendrocyte precursors. Fifty marker genes per cell type were used for deconvolution. One-way ANOVAs were completed for all six cell types across the five diagnosis groups. To increase detection of potential differences in cell composition, we did not correct for multiple comparisons and defined significance as p < 0.05.
Weighted gene co-expression network analysis (WGCNA)
The WGCNA package in R [48] was used to analyze the top 30% most variably expressed genes and cluster these genes into individual transcriptional modules based on high correlations in expression between genes in a given module. Soft thresholding based on scale-free topology criteria and a “signed” analysis design was used to determine optimal β (Supplementary Figure 1A), and visual inspection suggested an optimal β= 14. The blockwiseModules() function was used to create a topological matrix (TOM) and then a subsequent dissimilarity matrix (1-TOM), followed by hierarchical clustering where highly interconnected genes were assigned to the same transcriptional modules. Parameters for this function were DeepSplit = 4, TOMType = “signed”, minModuleSize = 20, and mergeCutHeight = 0.25. This analysis led to 14 modules and 1 unsorted module (grey); and subsequent cluster dendrogram showing gene similarity and module membership was created using function plotDendroAndColors() (Supplementary Figure 1B). Modules noted in the text were given a short name based on their predominant functional enrichment, while module color was randomly assigned.
For clinical comparisons, a similar pairwise design to DEG analysis were correlated with each module’s eigengene. APOE status was also included as a clinical trait. A significant correlation between eigengene and clinical trait (p < 0.05) prompted calculation of “gene significance” (GS) and “module membership” (MM) for each gene, where MM is defined as the degree of correlation between a given gene and the module, and GS is defined as the correlation between the individual gene expression and the clinical trait. For both values, a score of 0 suggests no correlation while a score of –1 or 1 suggests perfect correlation. A hub gene for a particular module and clinical trait was defined as genes with |GS| >0.2 and |MM| >0.8. When a module was correlated with more than one clinical trait (for instance, the black module was correlated with all 4 control comparisons, control versus AD, control versus DLB, control versus DLBAD, and control versus PDD), a gene was considered as a potential hub gene only when all GS >0.2 across significant comparisons.
Functional enrichment analyses
The functional enrichment analyses in this paper determines whether DMPs, DMRs, or DEGs that are associated with certain genes are associated with pathways from curated databases at a higher rate than would be expected by chance. With the exception of DNA methylation enrichment analyses (see Differentially Methylated DNA Analysis for details), gProfiler2 [49] was used to determine functional enrichments and g:GOSt was utilized, which applies an overrepresentation analysis based on hypergeometric tests, accounting for corrections for multiple comparisons through the set counts and size (g:SCS) method. Parameters were set as “homo sapiens” and g:SCS significance threshold of adjusted p-value<0.1. Enrichment analysis queried numerous databases including GO, KEGG, Reactome, miRTarBase, TRANSFAC, Human Protein Atlas (HPA), CORUM, and Human Phenotype Ontology(HPO).
DMP and DEG overlap analysis
Overrepresentation of DMPs among DEGs or genes in each WGCNA module was used to suggest significant overlaps between methylation and transcription data. The R package GeneOverlap [50], which relies on a hypergeometric test similar to other enrichment analyses, was used to detect significant overlap, which was defined as a p < 0.05. Corresponding odds ratios were also calculated and a heatmap of results was created via GeneOverlap.
Statistics
For determining differences in demographic features where the variable was continuous, a one-way ANOVA with Tukey’s post-hoc test was employed. For categorical variables, such as gender, chi-squared tests were employed. Distributions of variables were reviewed for normality by visually inspecting histograms. Statistical computations were conducted in R version 3.6.3. Statistics for most bioinformatic methods are stated within their individual subheading above.
Data availability
All raw data generated from this project are available at the Parkinson’s Disease Biomarkers Program’s website: https://pdbp.ninds.nih.gov.
RESULTS
Demographics
Demographics for the AD, DLB, DLBAD, PDD, and control groups are shown in Table 1, including APOE status. Though there were fewer APOE ɛ3/ɛ4 heterozygotes in the control group, there were identical numbers across each dementia group (53%). There was a significant difference in age at death among the groups (one-way ANOVA, F4,90 = 5.155, p < 0.0001), where those with PDD were significantly younger than those with AD (Tukey’s post-hoc, p < 0.01) and DLBAD (Tukey’s post-hoc, p < 0.001). Differences in other demographic variables were similar (p > 0.05).
Table 1
Demographics. Each dementia group and cognitively unimpaired controls with mean age with standard deviation, number of participants by gender, and frequency of APOE ɛ3/ɛ3 and ɛ3/ɛ4 genotypes
| Total | Control | DLB | AD | DLBAD | PDD | |
| Sample size | 94 | 18 | 19 | 19 | 19 | 19 |
| Age at death: mean (SD) | 84.9 (7.3) | 84 (9.1) | 84.9 (7.8) | 87.1 (3.6) | 88.8 (4.4) | 79.4 (7.3) |
| Gender: N male (% male) | 48 (51%) | 11 (61%) | 9 (47%) | 5 (26%) | 7 (37%) | 16 (84%) |
| APOE: N ɛ3/ɛ4 (% total) | 47 (50%) | 7 (39%) | 10 (53%) | 10 (53%) | 10 (53%) | 10 (53%) |
| RNAseq available: N | 62 | 15 | 12 | 13 | 14 | 8 |
Methylomic patterns across dementias
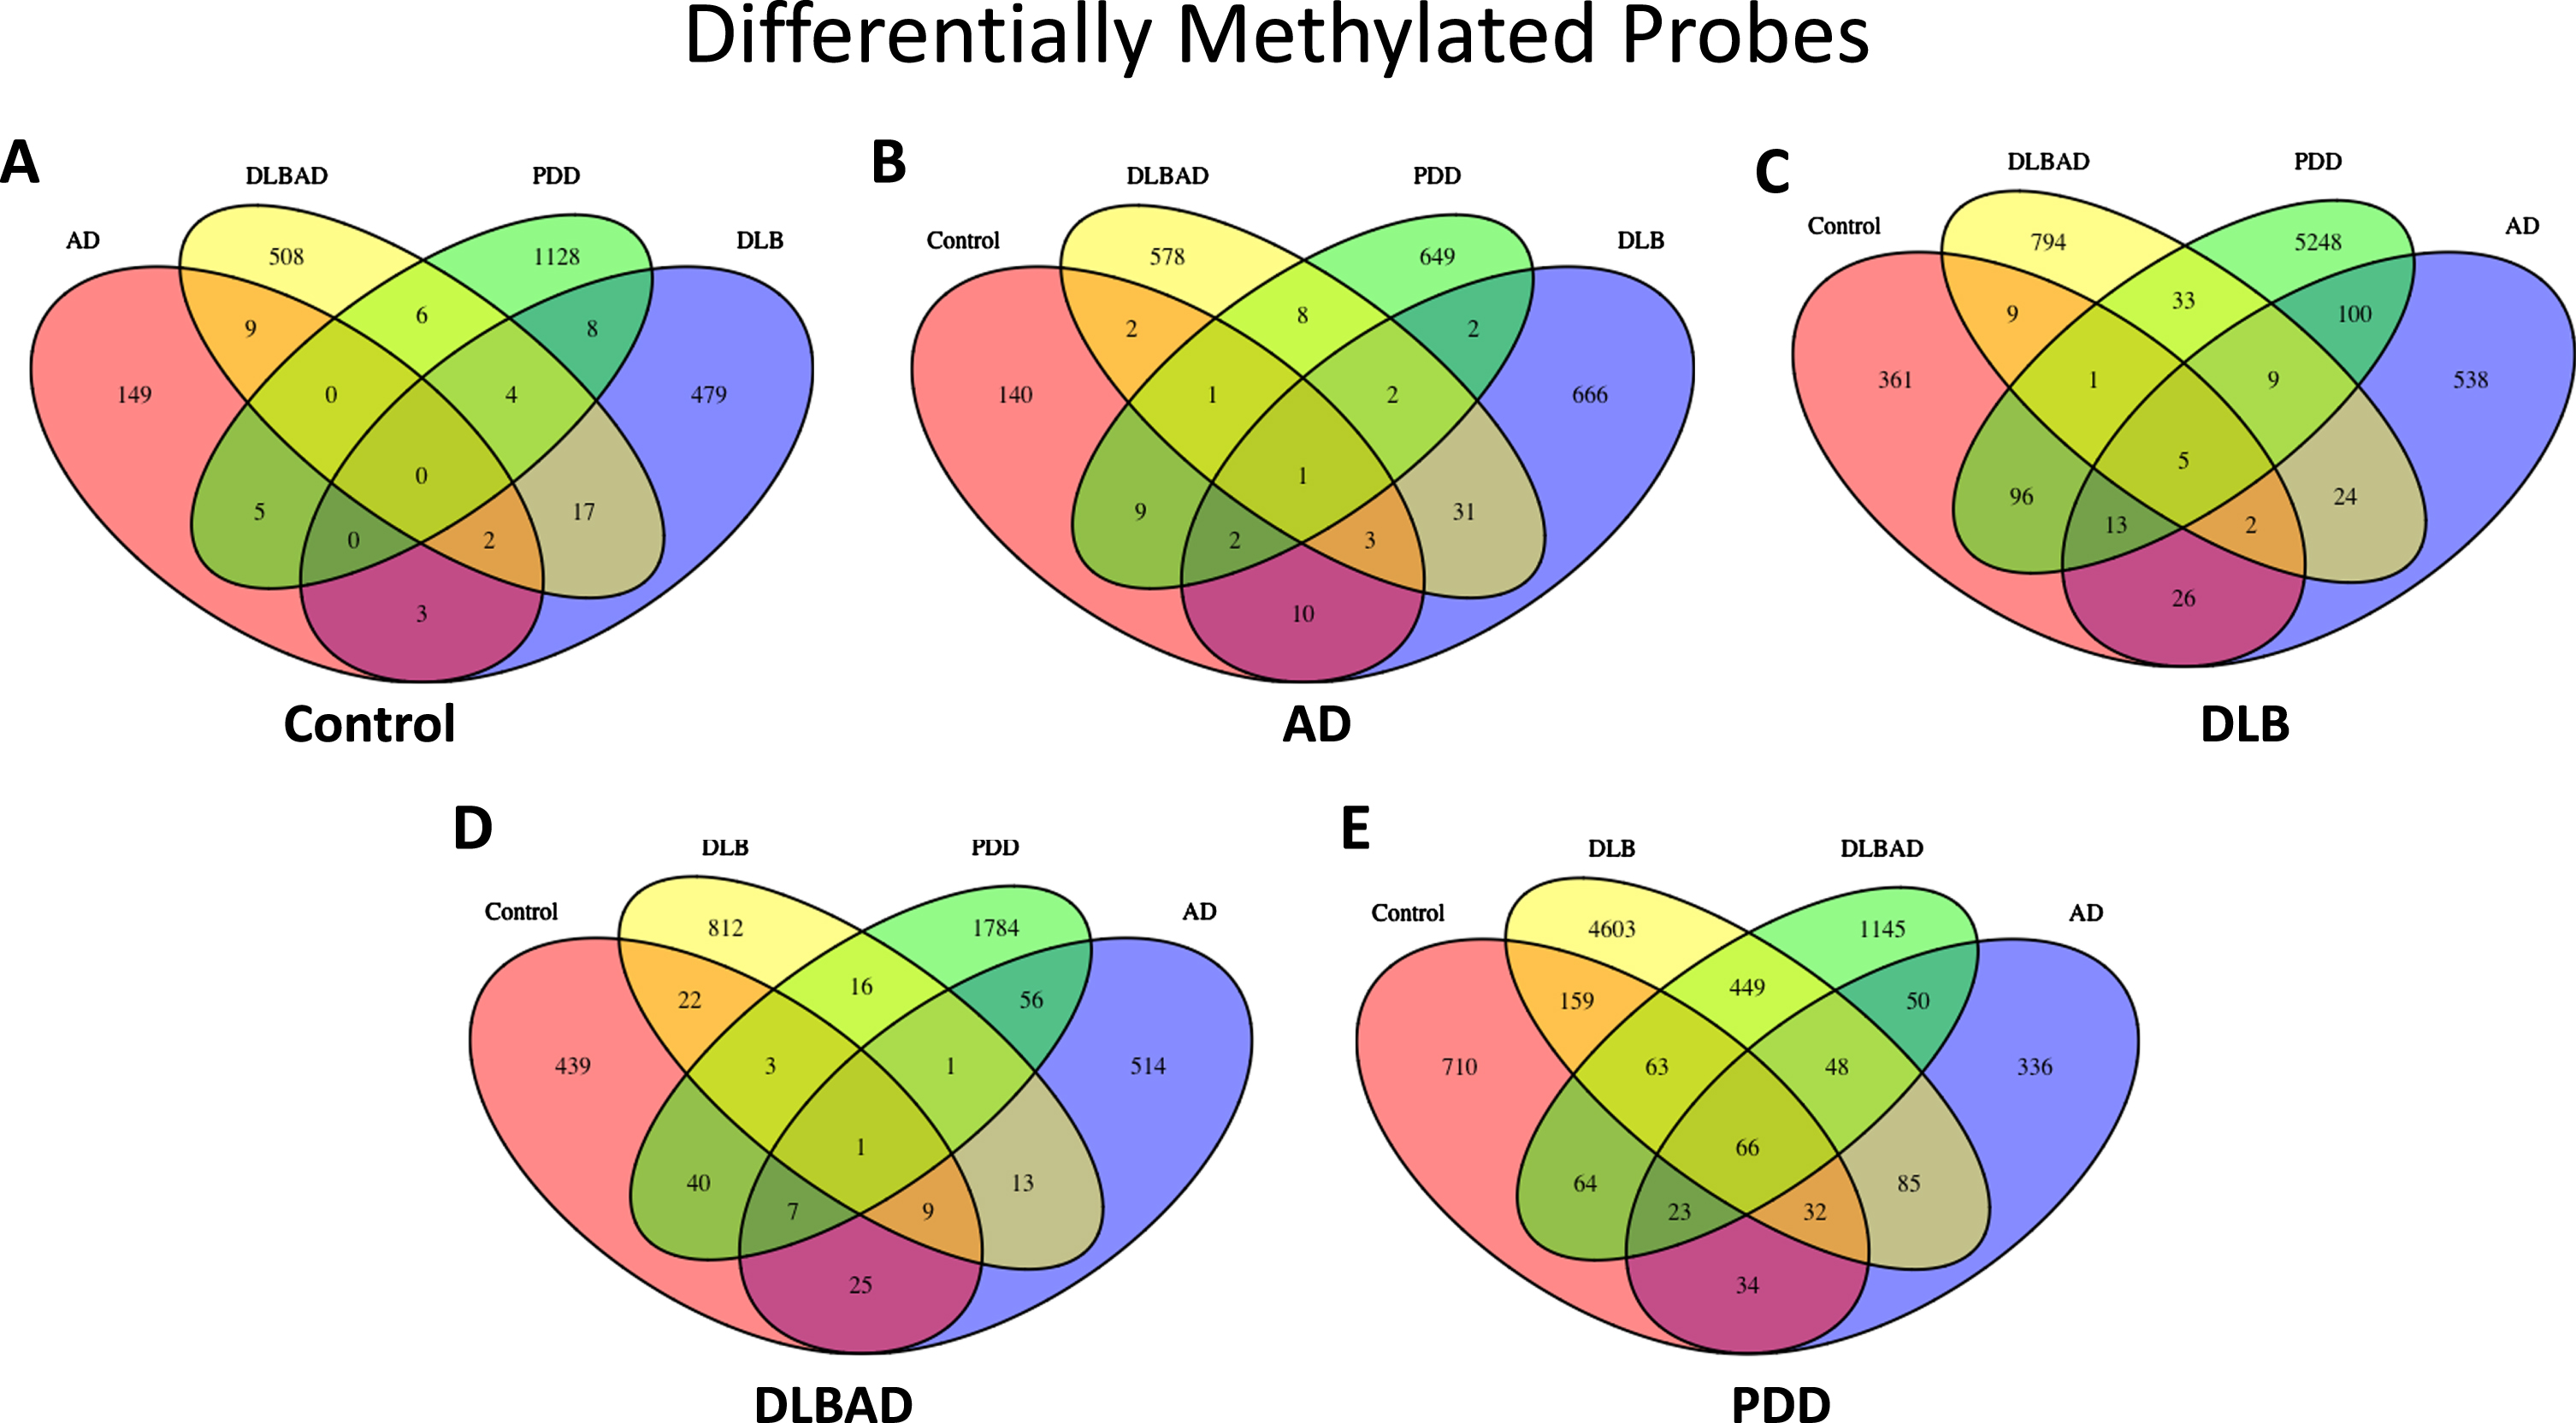
To understand changes in the DNA methylome associated with the four dementias and cognitively unimpaired controls, we used the MethylationEPIC BeadChip Infinium 850K array to determine the CpG methylation status at ∼760,000 individual sites along the genome from the postmortem PFC tissue of 95 different patients. Using a significance threshold of p < 0.001 and fold change >0.20 to define DMPs, we found 168 DMPs when comparing controls versus AD, 513 for controls versus DLB, 546 for controls versus DLBAD, 1151 for controls versus PDD, 717 for AD versus DLB, 626 for AD versus DLBAD, 674 for AD versus PDD, 877 for DLB versus DLBAD, 5,505 for DLB versus PDD, and 1,908 for DLBAD versus PDD (Fig. 1, Supplementary Table 1, Supplementary Data 1). It is particularly notable that the highest number of DMPs were found when comparing PDD to the other two Lewy body diseases, DLBAD and DLB, and controls, as these were the only instances where there were >1000 DMPs. In addition, while more modest balances of hyper- to hypo-methylation were seen for the other dementia comparisons, ranging from 30–70% of total DMPs being hypomethylated, there was a strong pattern of hypomethylation when comparing PDD to the other dementias and controls, ranging from 62–83%. For instance, when comparing PDD to controls, 82% of DMPs were hypomethylated, while the other dementias compared to controls yielded 31–58% hypomethylated DMPs. While there were very few shared DMPs when comparing the other dementias to each other, yielding 0.1–2.0% shared DMPs, there was a comparatively greater number of DMPs in common for PDD versus the other dementias at 2.1–16.9%, despite the greater number of DMPs identified (Supplementary Table 1).
Fig. 1
Differentially methylated probes (DMPs). A) Total DMPs when comparing Control to all dementia types. B) Total DMPs when comparing AD to Control and all dementia types. C) Total DMPs when comparing DLB to Control and all dementia types. D) Total DMPs when comparing DLBAD to Control and all dementia types. E) Total DMPs when comparing PDD to Control and all dementia types
A cluster of DMPs among a single genetic feature is known as a differentially methylated region (DMR). Similar to the dramatic changes detected for the DMPs in PDD comparisons, only two comparisons yielded DMRs: 197 DMRs for PDD versus DLB and 1 DMR for PDD versus controls (Supplementary Data 2). Interestingly, the single DMR in the PDD versus controls analysis falls within one of the DMRs in the DLB versus PDD comparison, representing 3 CpGs and 10 CpGs in the promoter region for OTX2 in the DLB and controls comparisons, respectively.
Functional enrichment analysis was performed for the DMPs using the GO and KEGG databases, though the number of enriched terms were generally low for most comparisons, and 5 out of 10 comparisons had no enriched terms (Supplementary Data 3). Specifically, the AD versus PDD, DLBAD versus control, DLB versus PDD, and PDD versus control comparisons all shared pathways suggesting differences in cell-cell adhesion. While other comparisons had less than 5 enrichment terms, the DLB versus PDD comparisons yielded noticeably more, likely a reflection of the increased number of DMPs discovered for this comparison. Many of these further enriched terms centered around immune function, actin, and the synapse.
Transcriptomic patterns across dementias
To better characterize the unique transcriptomic changes associated with Aβ- and LB-driven diseases, we analyzed patterns of mRNA expression in 66 of the 95 postmortem PFC samples used for our methylation experiments. For transcriptional analysis using the more stringent criteria of p-adjusted<0.05, when compared to controls, there were 1,197 DEGs for AD, 163 for DLB, and 2,279 for DLBAD. There were no DEGs detected at p-adjusted <0.05 for the remaining comparisons (Supplementary Data 4). When using the more liberal criteria of unadjusted p < 0.05, there were 3,680 DEGs for controls versus AD, 2,360 for controls versus DLB, 4,397 for controls versus DLBAD, 1,059 for controls versus PDD, 97 for AD versus DLB, 88 for AD versus DLBAD, 641 for AD versus PDD, 432 for DLB versus DLBAD, 541 for DLB versus PDD, and 793 for DLBAD versus PDD. Notably, when each dementia was compared to controls, there were 1000 s of DEGs that were identified compared with tens or hundreds of DEGs when the dementias were compared to each other, suggesting greater changes in transcription when comparing controls to those with cognitive impairment in contrast to fewer differences in transcription depending on dementia diagnosis. Similar to the DMP patterns, we also saw greater numbers of DEGs when comparing PDD to other dementias than when we compared those dementias to each other (Fig. 2, Supplementary Table 2, Supplementary Data 4).
Fig. 2
Differentially expressed genes (DEGs). A) Total DEGs when comparing Control to all dementia types. B) Total DEGs when comparing AD to Control and all dementia types. C) Total DEGs when comparing DLB to Control and all dementia types. D) Total DEGs when comparing DLBAD to Control and all dementia types. E) Total DEGs when comparing PDD to Control and all dementia types
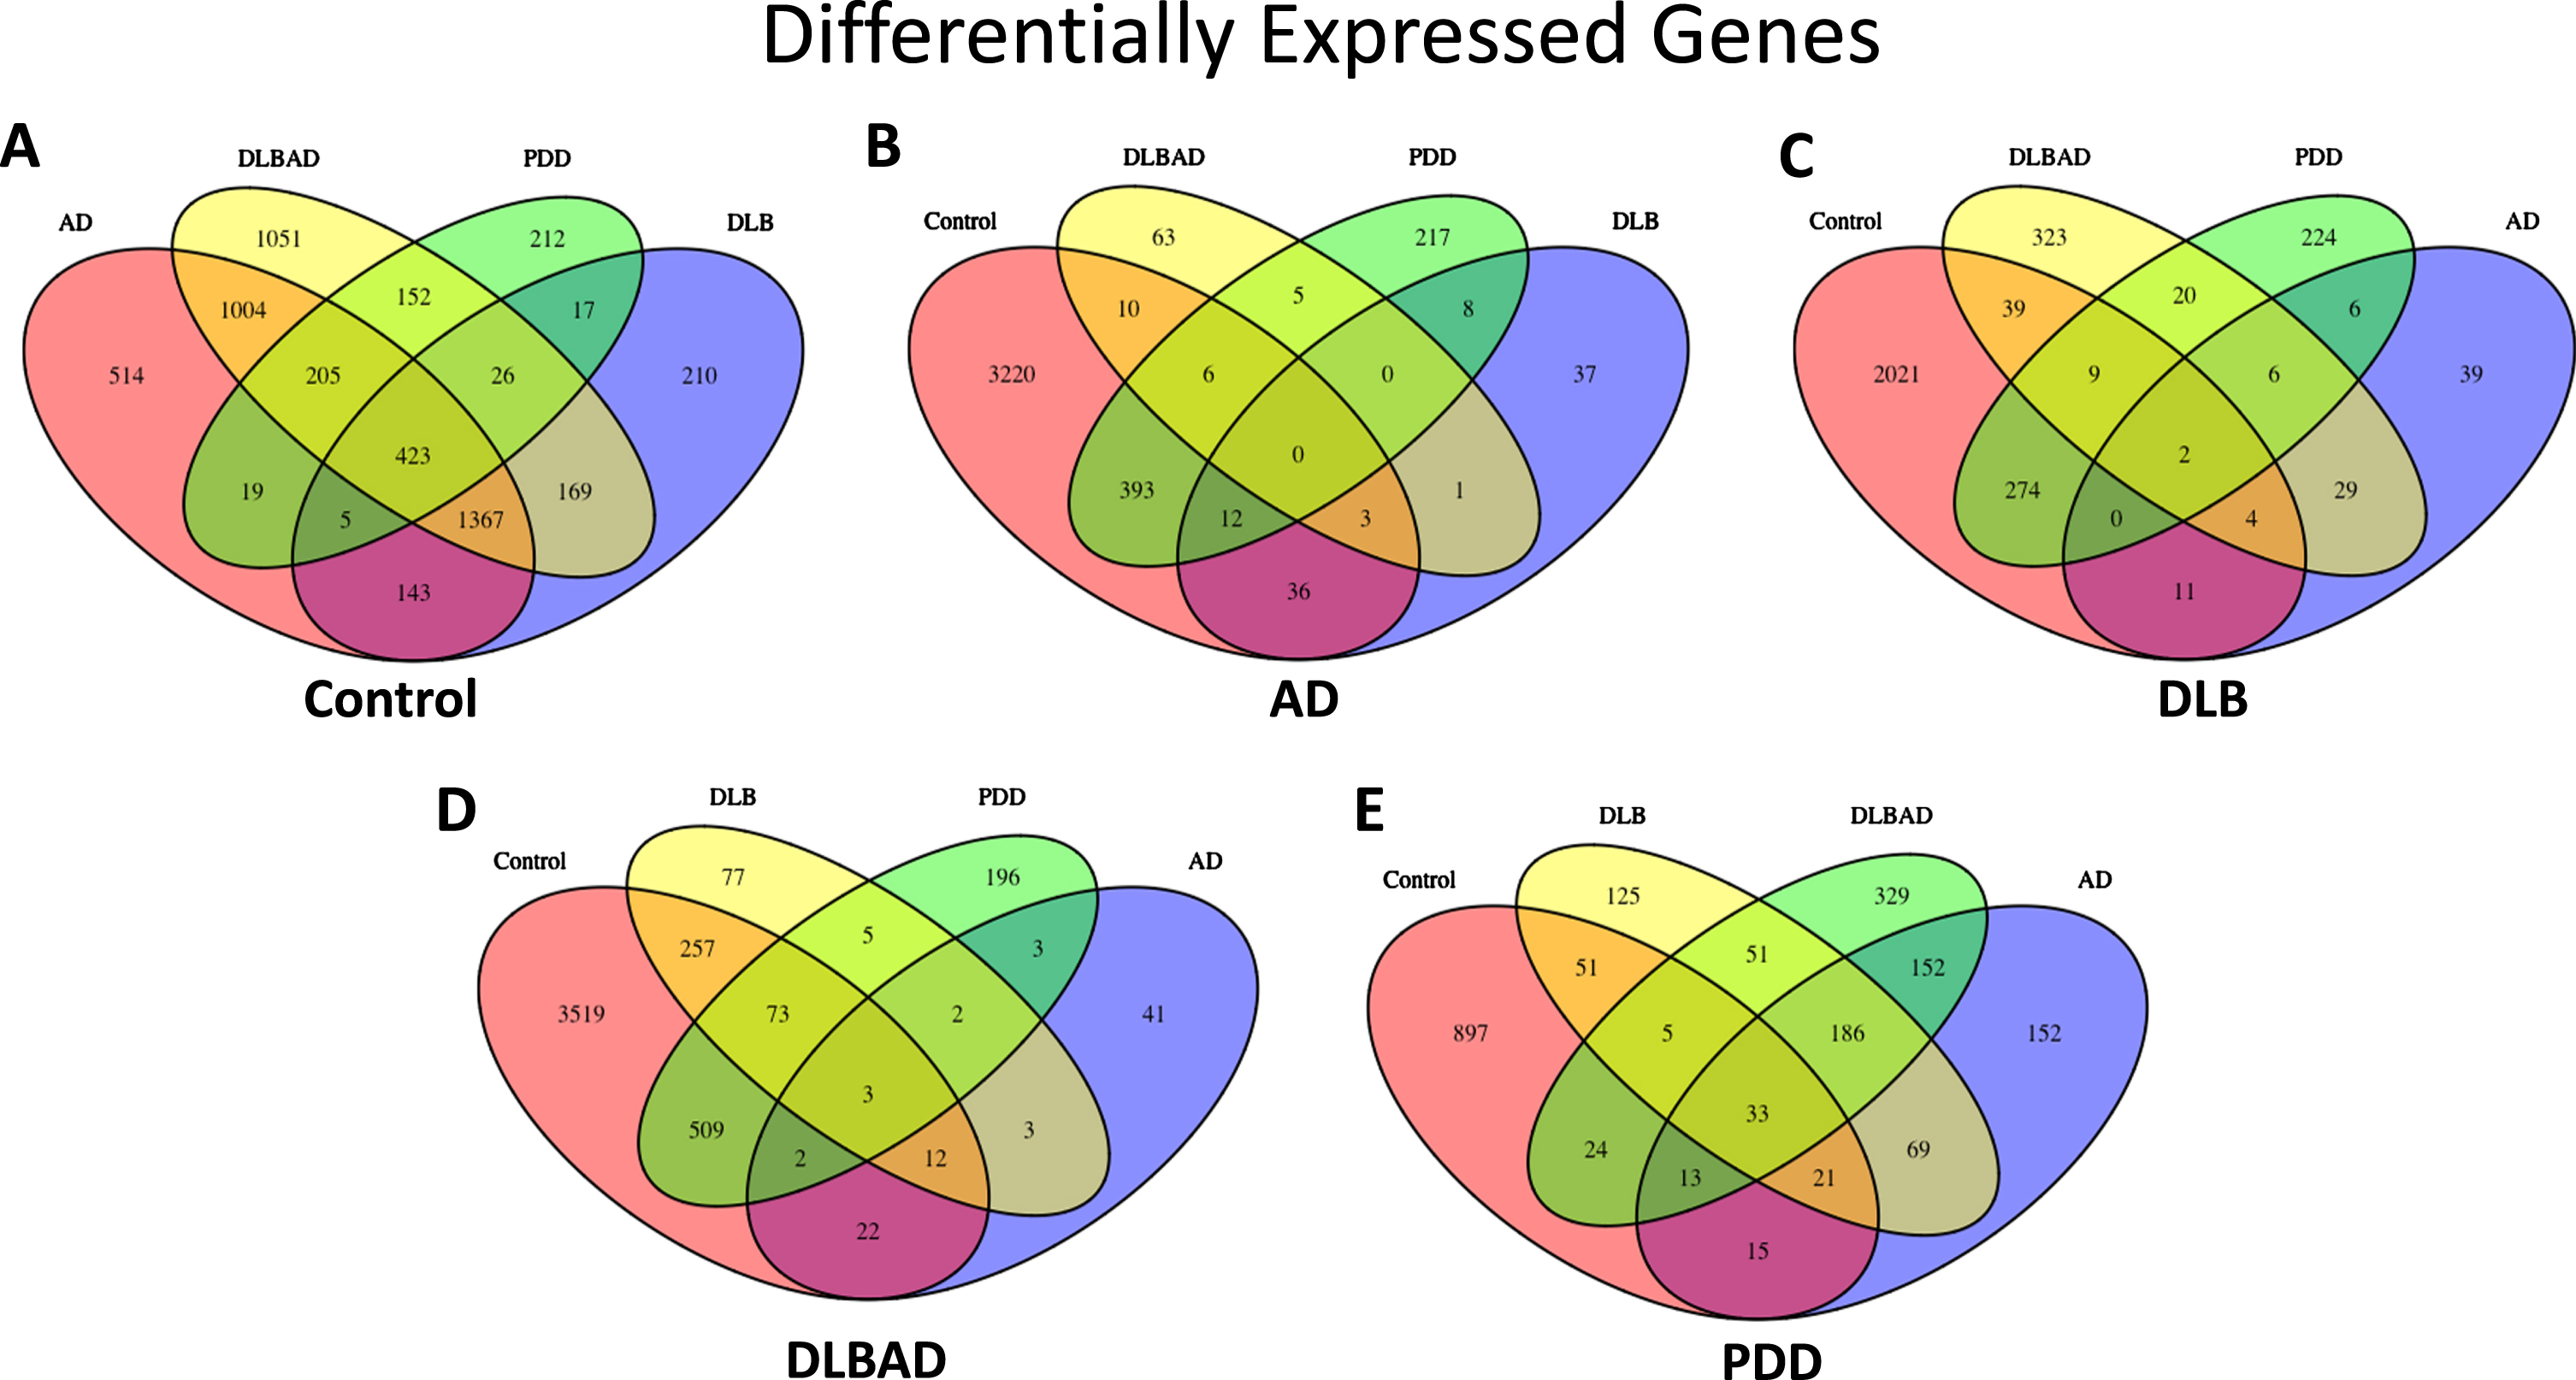
In addition, there were 423 DEGs that were in common when comparing all four dementia groups with controls, representing 11.5%, 17.9%, 9.6%, and 39.9% of the total DEGs for AD, DLB, DLBAD, and PDD, respectively (Supplementary Table 2). By comparison, there were no genes in common differentiating AD from the other dementias and controls, 0.1–2.1% overlapping genes in common when comparing DLB to the other dementias and controls, 0.1–3.4% in common when comparing DLBAD to the other dementias and controls, and 3.1–6.1% when comparing PDD to the other dementias and controls. When this analysis was restricted only to comparisons between the dementias, excluding controls, there were still no overlapping DEGs in common for AD, 1.5–8.2% for DLB, and 0.6–5.7% for DLBAD, which were still lower than the overlap seen when comparing controls versus the other dementias. Surprisingly, there were 27.6–40.5% overlapping DEGs in common when comparing PDD to the other dementias.
To determine what pathways may promote neurodegeneration across dementias, functional enrichment analysis was performed on the genes that were found to be in common when comparing the controls versus each dementia. Genes were enriched for a number of pathways compared to chance, and these include collagen binding and extracellular matrix, regulation of transcription, regulation of phosphorylation, response to lipids, vasculogenesis, focal adhesion, PI3K-Akt signaling, and IL-6 (Supplementary Data 5). In addition, some notable genes in this group include immune mediators CXCR4, IL4R, NFKBIA, JAK2, and STAT3; hypoxia responsive factors HIF1A, HIF3A, and EGR1; neurological disease-associated proteins SOD1, BACE1, and MECP2; the plasminogen regulator SERPINE1; and cholesterol metabolism genes LRP6, LRP10, and ABCA1.
While the paucity of overlapping DEGs for AD, DLB, and DLBAD precluded functional enrichment analysis, a number of pathways were discovered for the overlapping genes in common when comparing PDD to other dementias and include TGF-β signaling, Hippo signaling, and BMP signaling (Supplementary Data 6). Some interesting genes in the group included ASCL1, NOTCH2, CREBBP, SLC13 (EAAT1), BCL2, EGFR, YY1, and TGFB2.
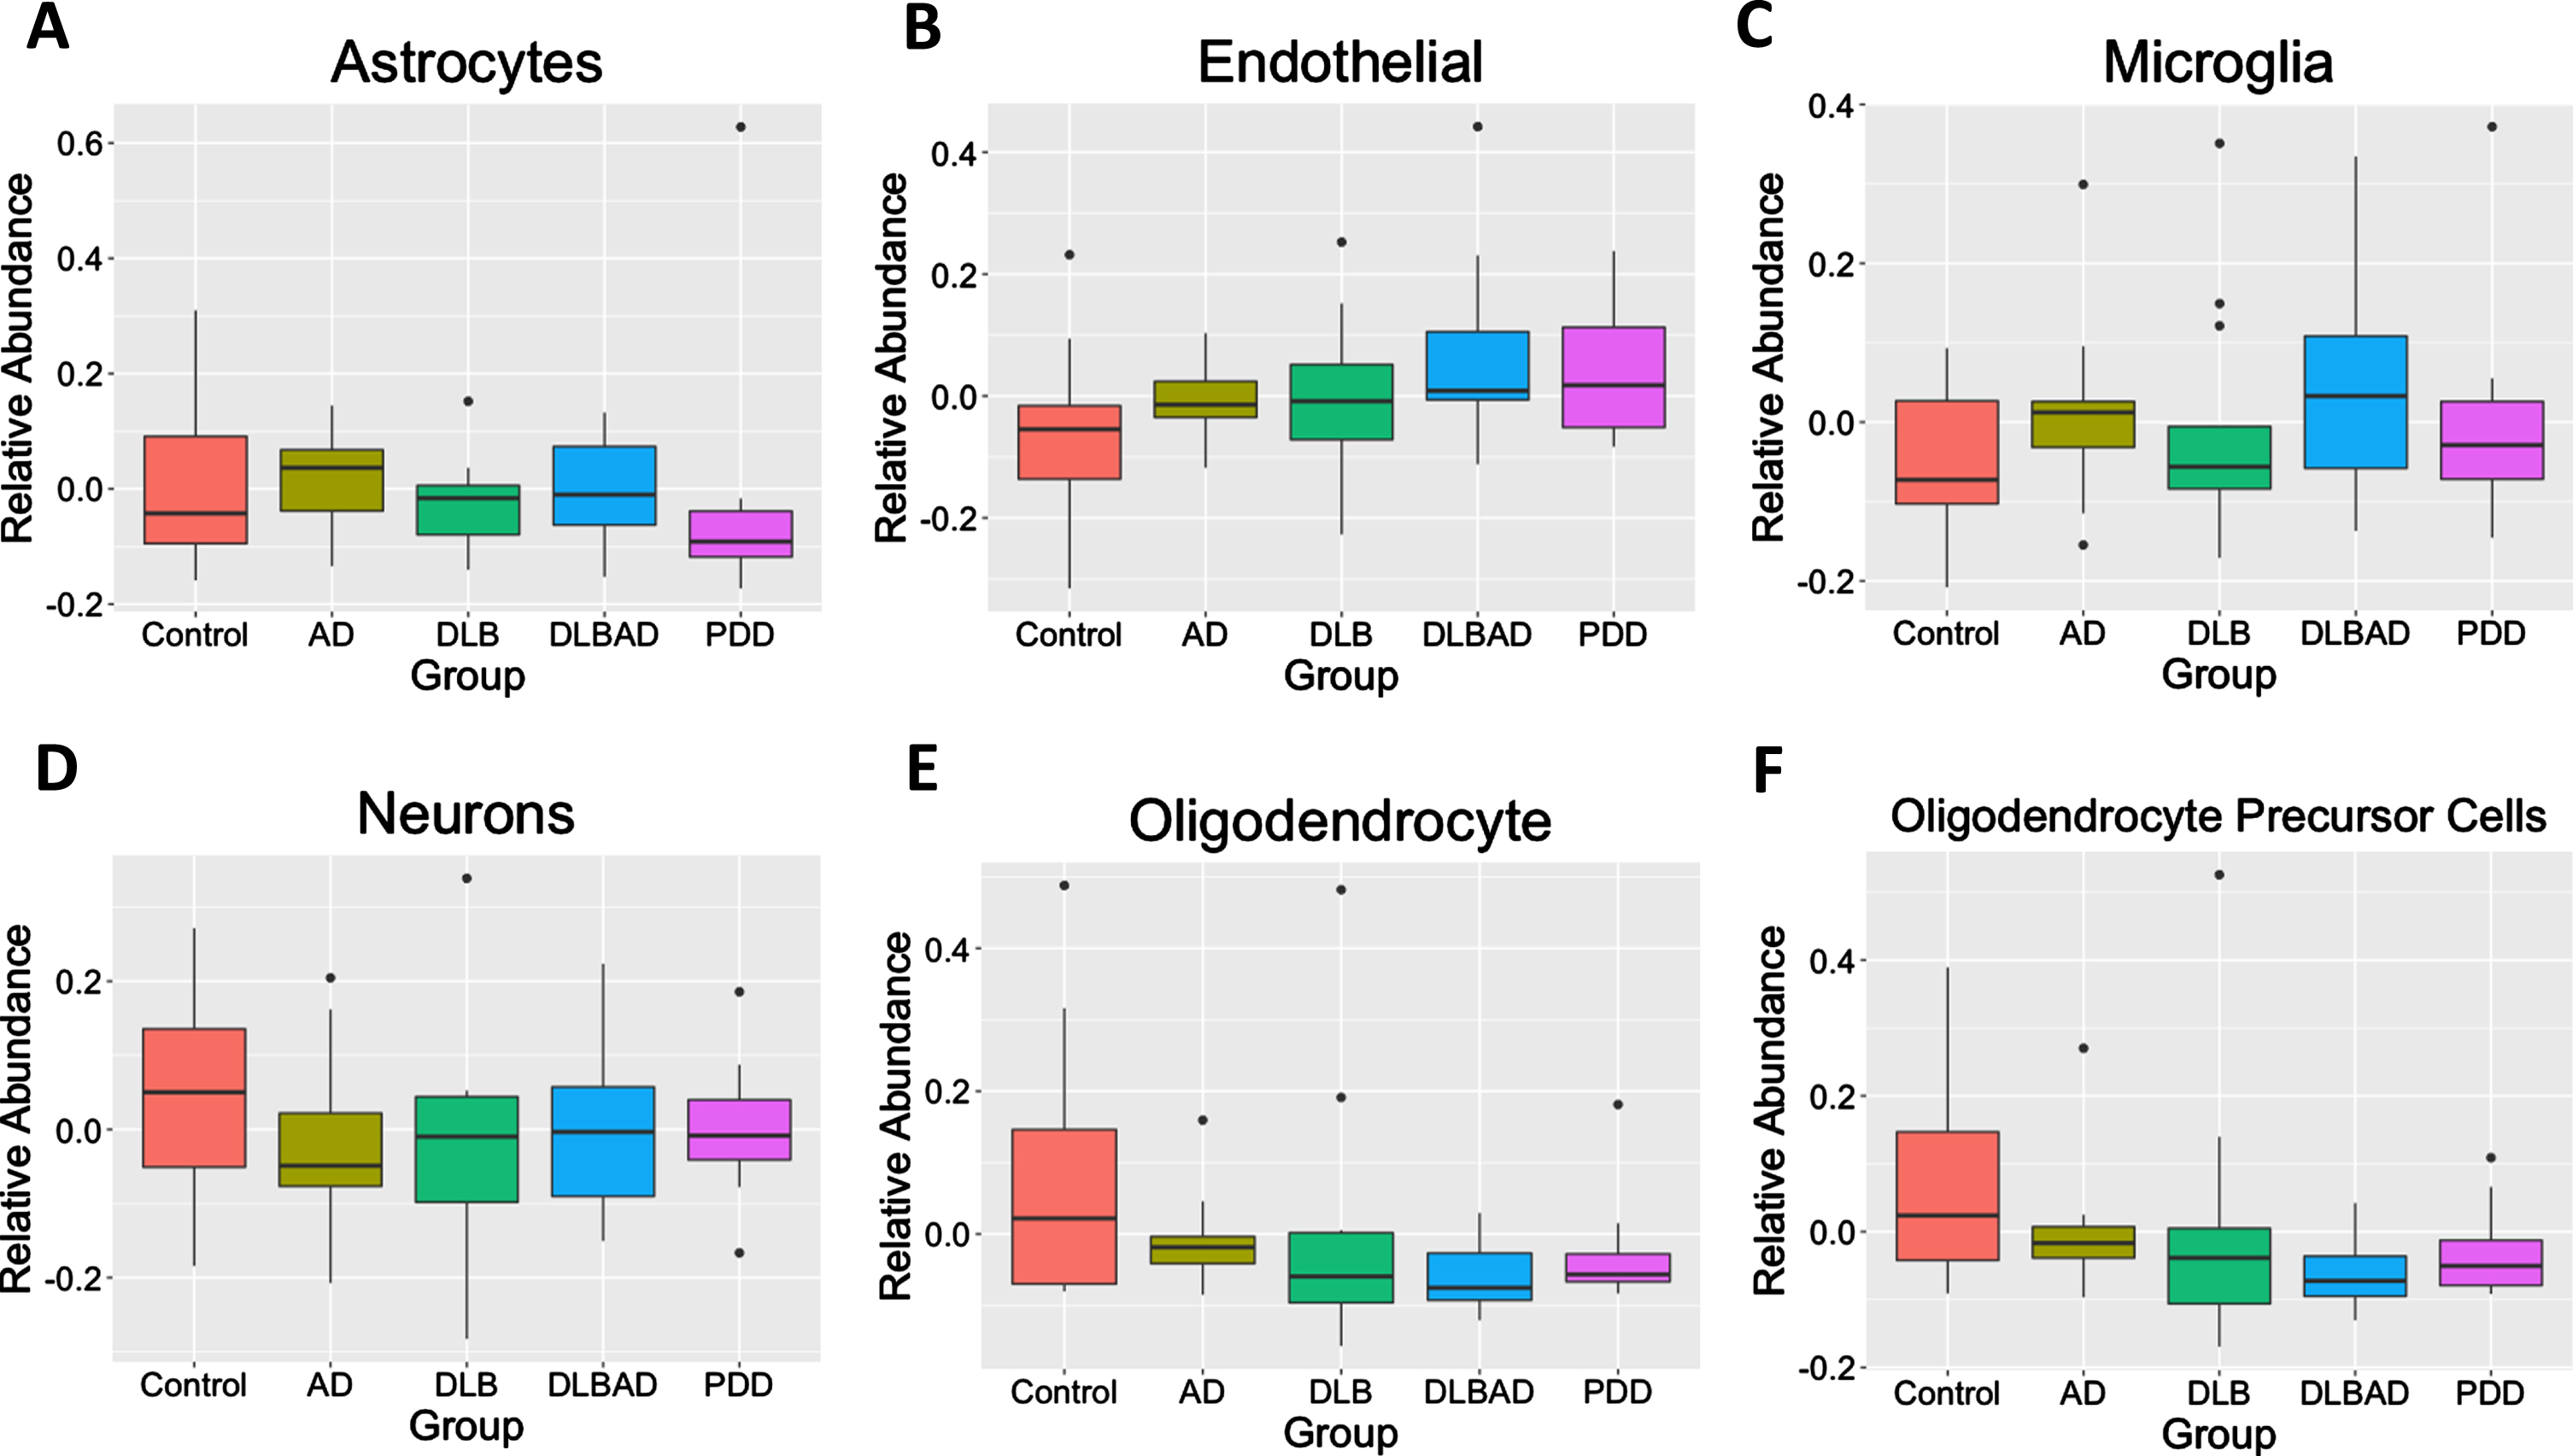
As differences in the abundances of different cells may bias transcriptomic or methylomic results, we used BRETIGEA [47] to estimate the relative abundance of 6 different cell types— astrocytes, endothelial cells, microglia, neurons, oligodendrocytes, and oligodendrocyte precursor cells— among the 5 different conditions. We found no differences in any of the 6 cell abundances among controls, AD, DLB, DLBAD, nor PDD (p > 0.05; Fig. 3).
Fig. 3
Estimates of relative cell abundance. Using an algorithm to estimate relative cell abundance from transcription of key cell-marker genes, there were no differences in A) astrocytes, B) endothelial Cells, C) microglia, D) neurons, E) oligodendrocytes, F) or oligodendrocyte precursor cells (OPCs) between the 5 comparison groups.
Co-expression networks associated with each dementia
Changes in transcription can be mediated by many factors beyond the experimental variable being studied, and co-expression networks can often be identified, whereby genes that participate in similar functions are also likely to be transcriptionally regulated in a similar manner [51]. In addition, genes that are found to have a large effect on the expression of other genes in the co-expression module can be identified as “hub genes,” whose perturbation may have some of the largest effects on the overall cellular function these genes facilitate.
Using weighted gene co-expression network analysis (WGCNA), we identified 14 co-expression modules and a grey module with unclustered genes from the top 30% most variably expressed genes and then determined the correlation between each eigengene with each of the 10 dementia comparisons as well as APOE status (Fig. 4, Supplementary Figure 1). While only the protein localization (red) module weakly correlated with APOE status (p < 0.05, r = –0.25), other modules were more strongly correlated with certain dementia comparisons. There were 56 potential hub genes (all hub genes listed in Supplementary Data 7 and 8) identified in the protein localization module, which included NR1H2 (LXRb), BAD, and CTSD (cathepsin D). Functional enrichment analysis suggested genes belonged to pathways involved in protein localization and endocytosis (all module enrichment analyses in Supplementary Data 9).
Fig. 4
WGCNA Module-Trait Heatmap. Correlation of eigengenes for each module (top value) and p-value (bottom value in parenthesis) for APOE status (ɛ3/ɛ4 heterozygosity) and all 10 comparisons. Positive associations are in red and negative associations are in blue. Bolded boxes contain important associations discussed in the text.
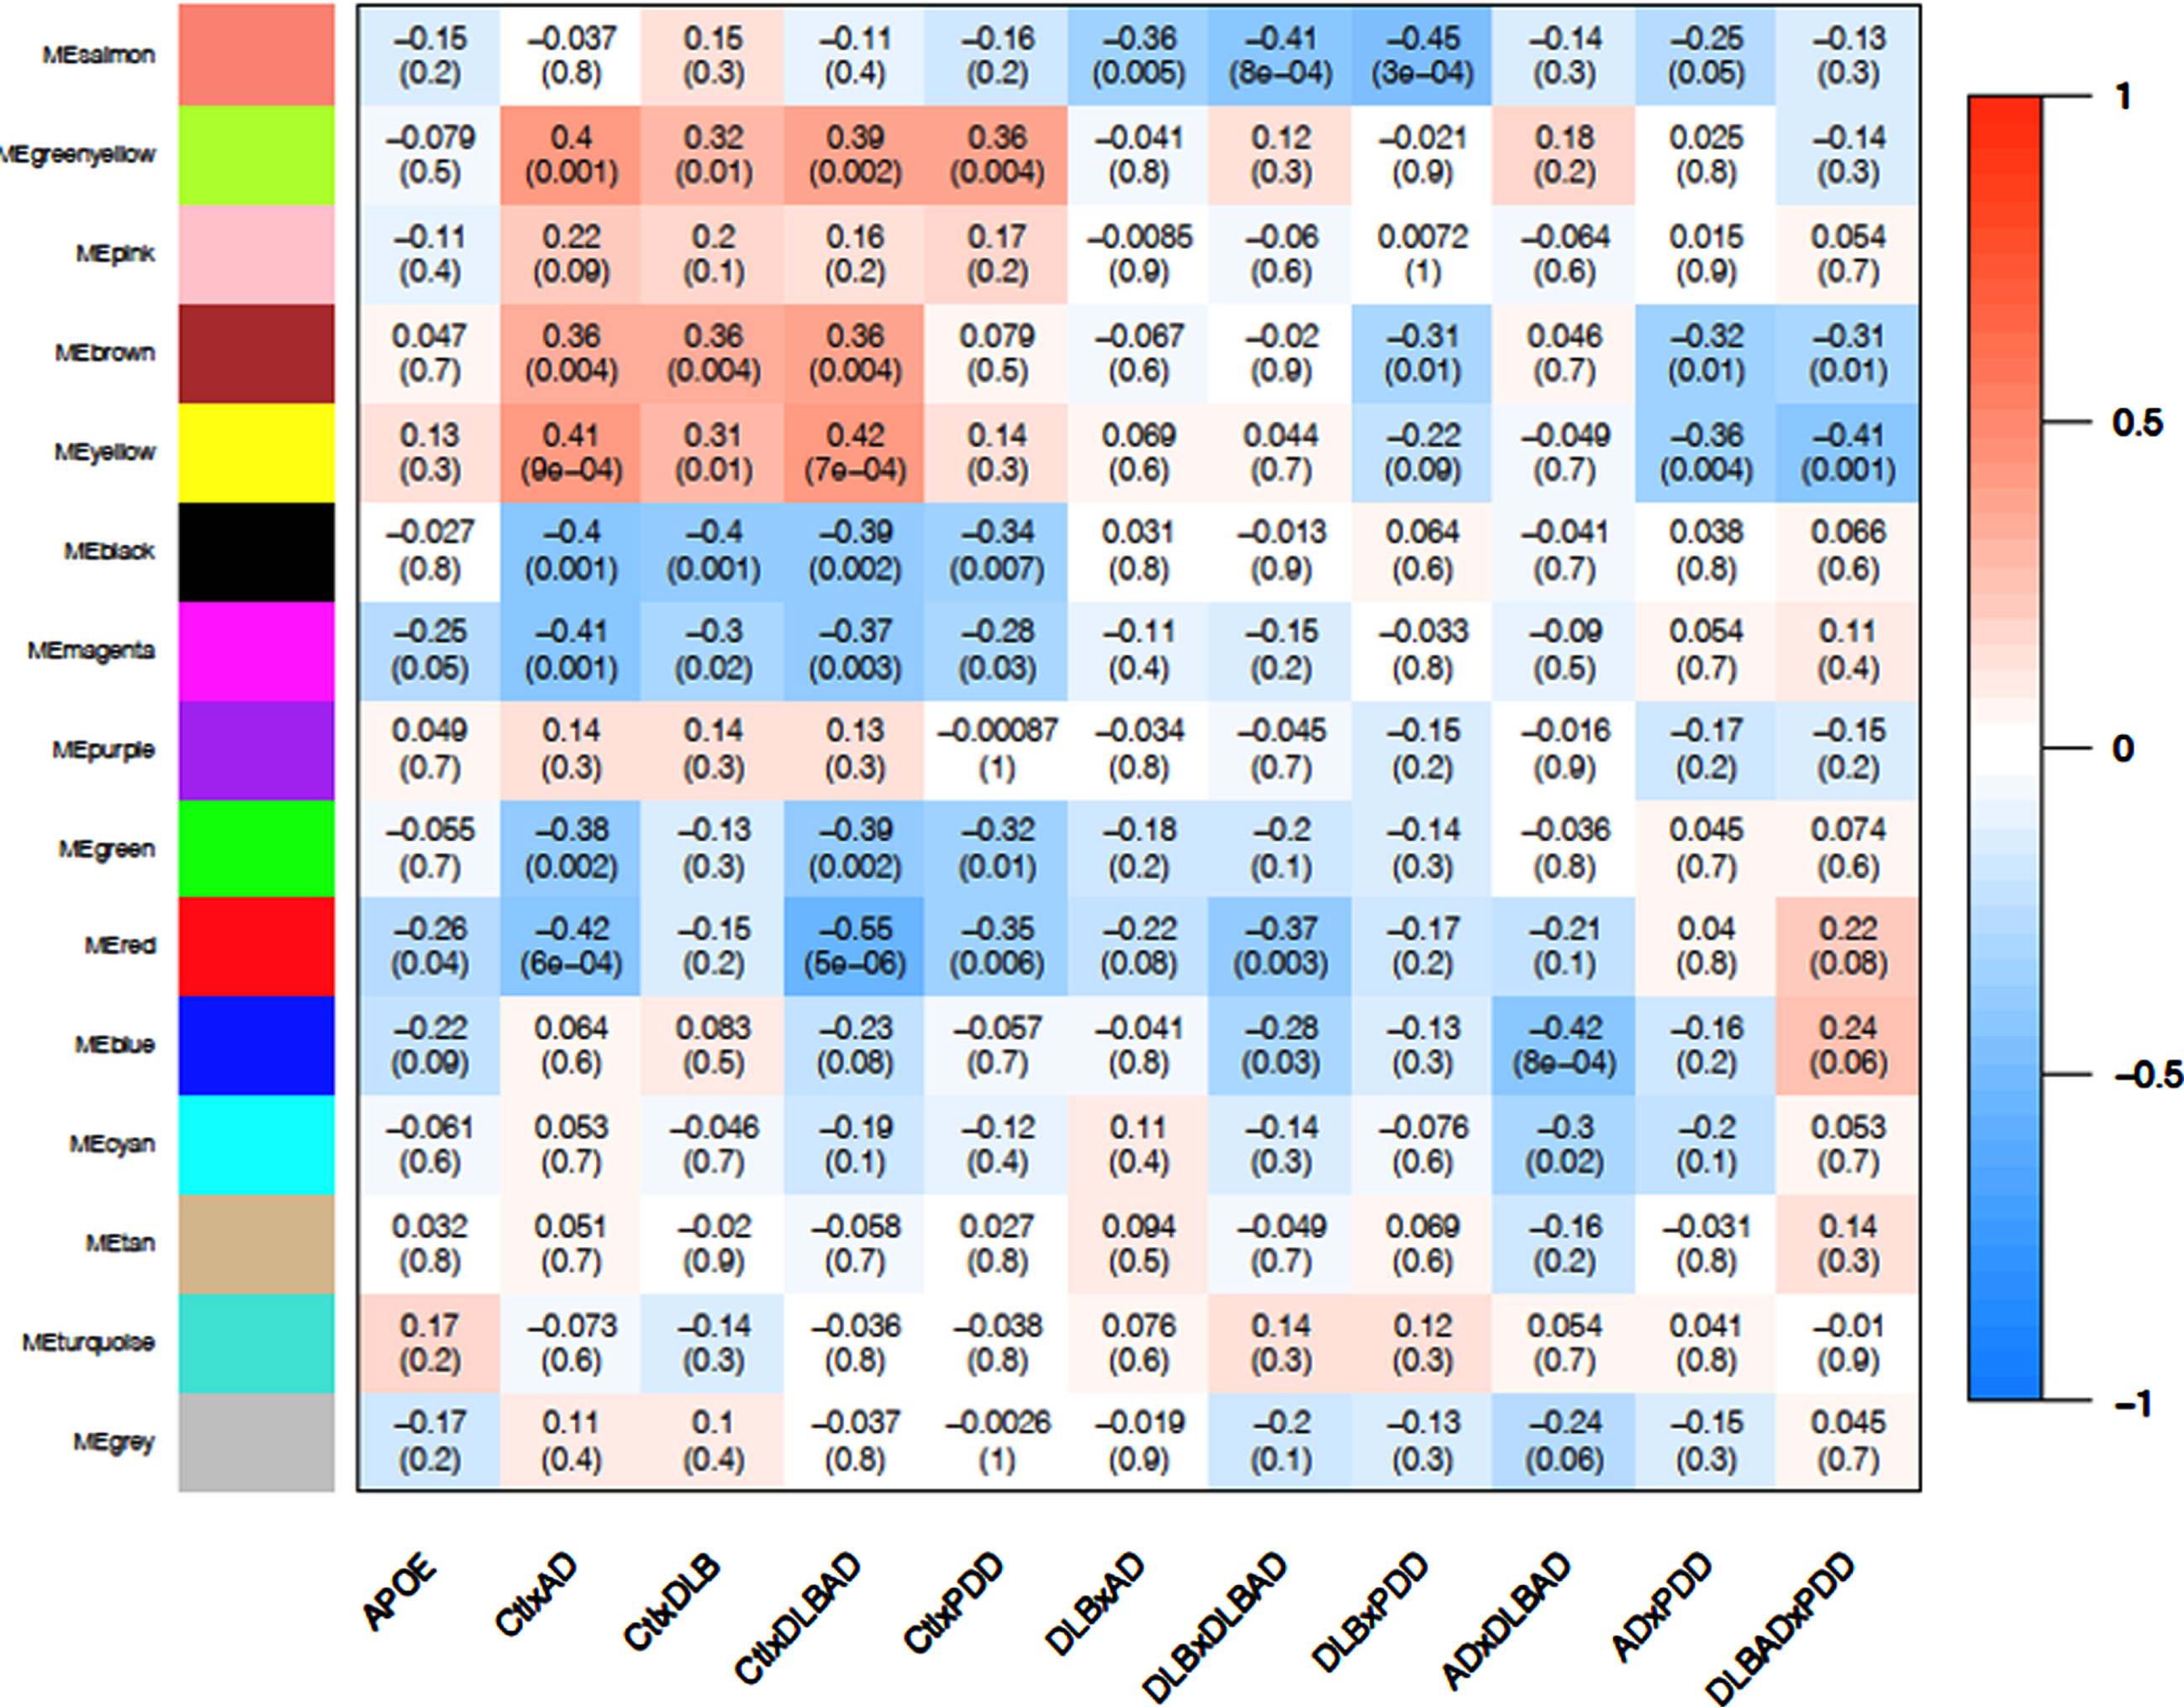
Among the four control comparisons (controls versus AD, controls versus DLB, controls versus DLBAD, and controls versus PDD), the oxidative phosphorylation (black) and extracellular matrix (ECM; green-yellow) modules showed consistent negative (p < 0.01; r = –0.34 to –0.40) and positive (p < 0.05; r = 0.32 to 0.40) correlations with all four comparisons, respectively (Fig. 4, Supplementary Figure 2). When identifying hub genes in common for the four comparisons, there were 73 and 21 potential hub genes for the oxidative phosphorylation and ECM modules, respectively. For the oxidative phosphorylation module, a number of antioxidant-related proteins were considered hub genes, including PRDX2, PRDX5, SOD1, PARK7, and TXN. In addition, numerous proteins in the electron transport chain were implicated, including 4 subunits of NADH ubiquinone oxidoreductase (complex I), 3 subunits of cytochrome c reductase (complex III), 6 subunits of cytochrome c oxidase (complex IV), and 5 ATP synthase subunits. Functional enrichment analysis similarly suggested a role for mitochondria and responses to oxidative stress. The ECM module contained hub genes FN1, ITGA5, and ITGB1, which together form a complex of integrin binding to fibronectin. In conjunction, enrichment analysis revealed pathways involved in ECM glycoproteins and cellular adhesion.
When comparing DLB to the other dementias, the astrocytic end-foot (salmon) module demonstrated consistent negative correlations (p < 0.005; r = –35 to –45), suggesting that this transcriptional module could be downregulated in DLB specifically (Fig. 4, Supplementary Figure 3). Across all three comparisons of DLB versus the other dementias, 11 hub genes were in common, and, surprisingly, every hub gene was expressed in astrocytes, many primarily [52]. Among them, MLC1, TTYH1, and GPR37L1 are functionally linked in their regulation of volume-regulated anion channel activity and binding to GliaCAM [53]. Further, CST3 encoding cystatin C is downregulated in the cerebrospinal fluid of patients with LB disorders and correlates with lower MoCA scores in these patients [54]. In agreement with these observations, functional enrichment analysis revealed pathways related to astrocytic foot processes, glial cells, and anion and acid transport. APOE was also sorted into this module, though its influence on the transcription of other genes was too weak to be considered a hub gene.
PDD had two modules that demonstrated a correlation between PDD and the other dementias, the lipid metabolism (brown; p = 0.01, r = 0.31 to 0.32) and mRNA regulation (yellow; p < 0.01 for PDD versus AD and PDD versus DLBAD, r = 0.35 to 0.41; p = 0.09 for PDD versus DLB, r = 0.22). Interestingly, these modules were also correlated with the comparisons between AD, DLB, and DLBAD and controls (p < 0.01; r = 0.31 to 0.42) but not between PDD and controls (p > 0.3, r = 0.08–0.14; Fig. 4, Supplementary Figure 4). By identifying hub genes in common for six comparisons between controls and non-PDD dementias as well as PDD and the other dementias, there were 84 and 58 potential hub genes for the lipid metabolism and mRNA regulation modules, respectively. Some notable hub genes in the lipid metabolism module were LRP1, NOTCH2, and PPARA while some in the mRNA regulation module were CREBBP, EP300, and YY1. Functional enrichment analysis yielded many terms for the lipid metabolism module but notably revealed enrichments in the Hippo pathway, fatty acid metabolism, and PPAR signaling, as well as receptor tyrosine kinase binding such as VEGF. For the mRNA regulation module, functionally enriched pathways were similarly broad but included numerous terms related to chromatin remodeling and mRNA processing.
Lastly, the myelination (blue) module was significantly correlated with the difference between AD and DLBAD (p = 8×10⁻⁴, r = 0.42; Fig. 4). This large module had 200 potential hub genes which included numerous genes involved in myelination including OLIG2, CNP, PLP1, PLLP, MOG, SIRT2, and CNTN2. In addition, potential hub genes also included 4 genes related to AβPP processing, BACE1, PSEN1, BIN1, and APBB2. However, while functional enrichment analysis revealed pathways associated with myelination, oligodendroglial development, actin binding, and Ras/Rho signaling, there were no enriched pathways associated with amyloid processing or AβPP.
Overlap between DNA methylation and transcription
As DNA methylation can have significant impact on transcription, we determined if there was significant overlap between the DEGs and DMPs for each of our comparisons. There was no significant enrichment of DMPs in any of the DEG lists for any of the 10 comparisons, suggesting a minimal effect of DNA methylation on the transcriptional differences that differentiate each dementia overall. This may be because most of the differences in methylation are small and because there is only a subset of genes in which transcription is greatly affected by changes in methylation among these dementias.
As methylation may have more subtle effects on transcription, and transcriptional modules may represent a number of genes with similar transcriptional patterns, we ran a similar analysis to see if DMPs were functionally enriched in any of the transcriptional modules from WGCNA. We found two modules that were enriched for DMPs, the oxidative phosphorylation module (p < 0.05 for controls versus DLBAD, controls versus PDD, DLBAD versus PDD, DLB versus DLBAD, and AD versus DLB) and the synaptic transmission (green) module (p < 0.05 for controls versus DLB, controls versus DLBAD, AD versus PDD, AD versus DLBAD, DLB versus DLBAD; Supplementary Figure 5). The oxidative phosphorylation module, which was largely enriched for mitochondrial genes activated in response to cellular stress, was associated with all of the dementias when compared to controls. The synaptic transmission module was negatively correlated with 3 dementias when compared to controls, AD, DLBAD, and PDD (p < 0.01; r = –0.35 to –0.55) but not DLB (p = 0.3; r = –0.13). The synaptic transmission module had 61 potential hub genes and many were genes encoding proteins vital to synaptic transmission, including RAB3A, NRGN, and CHRM1. Functional enrichment analysis similarly demonstrated numerous terms related to synaptic transmission as well as high enrichment of genes in both the pre- and post-synaptic compartments.
DISCUSSION
Multiple neurodegenerative conditions that result in dementia cause significant molecular alterations to the PFC, and our data show that there are unique transcriptional and DNA methylation patterns that may either represent final common pathways regardless of neurodegenerative etiology or may distinguish certain dementia types from one another. More specifically, in this preliminary study, we compared 5 different conditions in a pairwise experimental design: cognitively unimpaired controls, AD, DLB, DLBAD, and PDD. We showed that PDD had more DMPs in common when compared to controls or the other dementias than when the other dementias were compared against each other. Further, PDD showed a pattern of predominantly hypomethylated DMPs compared to the other dementias and controls. Transcriptionally, we determined that there were overall more DEGs when comparing controls to any of the dementias than there were when comparing each dementia to each other, and similarly there was relatively high overlap in the DEGs found when comparing each dementia to controls. We further used a co-expression analysis, WGCNA, to show that certain transcriptional modules were significantly correlated across dementias compared to controls as well as certain modules that defined certain dementia types. Finally, we determined that while there was not a significant overlap between DEGs and DMPs, there was a significant enrichment of DMPs in two of the transcriptional modules that were associated with controls and all the dementias as a whole. In total, despite our small sample size, this is nevertheless the largest study to date that differentiates Aβ– and LB-associated dementias based on both DNA methylation and RNA expression.
To better discern the differences between PDD and DLB, we not only compared these diseases to each other but also included comparisons to DLBAD to reduce concerns about the influence of concomitant AD pathology leading to a wider separation between the disorders. By doing this, we hypothesized that we would see the smallest difference in DNA methylation between our PDD and DLB groups. Therefore, we were surprised to find that the opposite was true, that there were the largest differences in DMPs between PDD and DLB with the difference between PDD versus DLBAD and PDD versus controls not far behind. However, similar to the observations of neuropsychiatric frequency being more similar between PDD and AD than DLB [9], we noticed many fewer DMP differentiating PDD and AD. Even more striking was the pattern of predominantly hypomethylated DMPs that were associated with PDD that was not seen in the other dementia comparisons. Though it is possible that differences in ages played a factor, age is generally associated with greater hypomethylation, and the PDD group trended younger than other groups, making an explanation based on aging alone tenuous. Again, this suggested that the pattern of DNA methylation may be a unique feature of PDD, suggesting epigenomic differences between PDD, DLB, and DLBAD. Similarly, with the exception of one DMR comparing PDD to controls, we found 197 DMRs when comparing PDD to DLB but no DMRs in any of the other comparisons. While the greatest differences in transcription were found between controls and the dementias, the second largest group of differences were also for PDD versus the other dementias. Taken together, the large differences in DNA methylation and transcription in the PDD comparisons may suggest that this dementia is more etiologically distinct than previously suggested, at least in terms of how it affects the PFC. Indeed, there was a relatively higher percentage of DEGs and DMPs in common when comparing PDD to the other dementias than with any other comparison, suggesting a core group of differentially methylated and transcribed genes that could be a unique hallmark of PDD pathogenesis.
The single DMR shared when comparing PDD versus controls and PDD versus DLB involved CpGs upstream of the homeobox protein OTX2, a gene that is involved in dopaminergic neuron development as well as parvalbumin-positive (PV+) neuron involvement in critical period plasticity [55–58]. While OTX2 is often thought of as a marker of ventral tegmental area neurons, ectopic overexpression in the substantia nigra is associated with protection of dopaminergic neurons to MPTP, a common neurotoxin used to model PD in rodents [58, 59]. Similarly, some evidence exists that PV+ interneurons are significantly affected by α-syn [60, 61]. Finally, while some evidence exists for OTX2 to influence psychiatric symptoms in humans and mouse models of certain affective disorders [62–64], a clear role in PDD is yet unknown. However, it is notable that during a recent analysis of OTX2 binding, binding sites were enriched for numerous neurodegenerative disorder genes as well as oxidative stress [56]. Therefore, it is possible that OTX2 methylation plays a unique role in susceptibility of certain dopaminergic and PV+ neuron populations in PDD.
Beyond the differential methylation associated with PDD, there were also a surprisingly high number of DEGs that were uniquely associated with PDD compared to the other dementias. Similarly, there were two transcriptional modules that were associated with PDD compared to the other dementias, the lipid metabolism and mRNA regulation modules. When functional enrichment analysis was performed, there was a convergence of increased representation of genes associated with the Hippo pathway in both the DEGs that were common to PDD and the lipid metabolism module. When DNA methylation of dorsal motor nucleus tissue was studied in PD patients, they also found an enrichment of DMRs associated with genes from the Hippo pathway [65]. The Hippo pathway can influence many cellular processes, including cell proliferation, cell differentiation, and innate immunity, but the Hippo pathway is most often implicated in neurodegeneration through its regulation of apoptosis [66, 67]. Interestingly, while numerous lines of evidence tie it to AD, Huntington’s disease, and amyotrophic lateral sclerosis, there are far fewer studies that have examined it in PD, PDD, or DLB. One group found that netrin-1 deficiency in PD leads to downstream activation of the Hippo pathway and elevated apoptosis, but it is unclear what brain region was tested, the cognitive status of these patients, and if there was concomitant Aβ pathology [68].
One consideration for the strong differences between PDD and the dementias in our study could be due to incomplete degeneration of PFC tissue in PDD. Though limbic and cortical involvement are observed in PDD, there is evidence for differences in cortical atrophy and p-tau burden when compared to DLB or AD [15, 69–71]. In addition, some have hypothesized that LB pathology may begin and spread in the brain via two separate routes: one starting from the periphery, gaining access to the brainstem through the vagus nerve, and another entering more directly into the CNS, starting in the olfactory bulb [72–74]. It is possible that the different sites of entry could lead to different patterns of spread, and these dissemination patterns could dictate if PD— and subsequent PDD— or DLB develops. Given these differences, if the PFC was affected later and less severely in PDD, the differences observed in this study could be a sign of these different pathways.
There was a relatively large number of shared genes differentiating controls from the dementias, and the largest amount of DEGs were seen when comparing each dementia group to controls as compared to when comparing the dementia subtypes to each other. This suggests that there could be common aberrant pathways associated with dementia that are independent of specific type. Similarly, our study also identified numerous transcriptional pathways that were commonly perturbed across all dementias and implicated many pathways by enrichment analysis. Specifically, two transcriptional modules were identified from WGCNA, oxidative phosphorylation, and ECM modules. While there was not significant overlap between DMPs and DEGs overall, there was a significant overlap of DMPs and genes in the oxidative phosphorylation module. This module was highly enriched for genes involved in antioxidant and mitochondrial pathways, and oxidative stress has long been proposed as a major driver of almost every age-related, neurodegenerative condition [75–78]. Further, the greatest risk factors for dementias is advancing age, and reductions in cellular ability to regulate oxidative stress with advancing age is well-described [77]. Though speculative, there is also some evidence that mitochondrial function, oxidative stress, and DNA methylation have mechanisms for cross-talk in response to changing condition [78, 79], and this could influence the differences in both transcription and DNA methylation observed in the oxidative phosphorylation module. In total, this module could represent a common pathway influenced by aging that when dysfunctional leads to increased risk of neurodegenerative dementias.
The astrocytic end-foot module was correlated with DLB when compared to the other dementias, and the preponderance of genes in this module were expressed in astroglia. The influence of α-syn on astrocytopathy in LB disorders has yielded impairments in mitochondrial processes, calcium homeostasis, glutamate homeostasis, and neuroinflammation [80, 81]. However, unlike AD, reactive astrogliosis is mild in LB disorders [82], suggesting that a more subtle pathological mechanism may be at play when Aβ is absent. Functional enrichment analysis applied to the astrocytic end-foot module also revealed numerous genes associated with anion transport, with carboxylic acid transport being among the most significant enrichments. Based on this, one could speculate that uptake of fatty acids and/or glutamate is impaired by DLB pathology, as one study showed altered transport of fatty acids with α-syn depletion in astrocytes [83]. Still, how astrocytes are affected in DLB versus PDD in the PFC has yet to be studied.
Though some studies have attempted to compare the differences in transcriptome, proteome, or DNA methylome in blood or brain tissue among some of the dementias reflected in our studies [65, 84–93], only one other study has compared the methylomes in the PFC between AD, DLB, and PD but not PDD patients [27]. In that study, Sanchez-Mut et al. used whole-genome bisulfite sequencing with an n = 1 design for AD, DLB, PD, and Down syndrome followed by a comparison of n = 5 with an Illumina 450K Methylome array and comparisons of n = 5–32 for pyrosequencing validation of specific promotor regions. They further used an RNA expression microarray to look at the overlap between DMRs and associated DEGs. Though this study found hundreds of DMRs associated with changes in gene expression, it is worth noting that the n = 5 design makes it challenging to interpret how many of these were due to neurodegeneration and how many were related to other differences between the individuals of the tissue’s origin, such as gender and age, as well as other variables that were not assessed here, including participant ancestry, medication status, and clinical course (e.g., age of onset, comorbidity, and cause of death). Still, it was surprising to find significant enrichments of their DMRs for the Hippo pathway and TGF-β signaling which were similar to our enrichment of these pathways of PDD versus the other dementias. Similarly, we found DMP enrichment in cell-cell adhesion for certain comparisons that may be similar to the enrichment of DMRs in the adherens junction pathway discovered by Sanchez-Mut et al. [27]. In all, we believe our current study builds on this previous work in a few key ways: 1) We have used more subjects to increase our statistical power and therefore our confidence that our findings are specific to the disease designations, 2) All tested groups had clinical designations of dementia, whereas Sanchez-Mut et al. [27] included PD patients without this designation, 3) We compared PDD, DLB, and DLBAD, which should allow some differentiation of changes due to isolated LB and combined LB + Aβ pathology, 4) We were able to use the most updated 850K array, which is an improvement on the 450K array used previously, and 5) Our WGCNA allowed for determination of transcriptionally linked genes that might be heavily influenced by DNA methylation and represent a conserved pathogenic pathway across dementias.
Although our study is the largest study to determine differences in DNA methylation and transcription between LB– and Aβ-driven dementias— as well as the only study to specifically determine differences in DLB, DLBAD, and PDD— there are some limitations that should be noted. First, despite compiling the largest study of its kind, our work should be viewed as a preliminary foundation for future efforts. The work is based on a convenience sample that was not initially collected for the purposes of methylome and transcriptome analyses, and the sample was too small to account for other covariates that may have influenced our results (e.g., medication status, burden of neuropsychiatric symptoms, and tissue availability), and thus our findings highlight associations rather than addressing specific hypotheses. We also cannot completely rule out the potential effects of institutions of origin (e.g., differences related to varied neuropathological protocols) or individual samples (e.g., the possibility that sample orientations or boundaries varied). However, quality control and inspection of data for outliers was performed, and cellular deconvolution from mRNA did not suggest differences in cell type composition, though this does not exclude more subtle differences in cell survival across dementias. Second, we noticed little overlap between our DMPs and DEGs, which is likely explained by the small absolute differences in DNA methylation being compensated for by other transcription regulation mechanisms. In a similar combined analysis between age-matched controls and PD patients, a similarly very low level of overlap between DNA methylation and transcription was observed across three brain regions [65]. Third, our analysis relied on bulk tissue, and so more subtle differences in DNA methylation and transcription within different cell types such as neurons, astrocytes, microglia, and oligodendrocytes could not be determined. Fourth, our analysis did not take into account varying levels of p-tau across diseases, which could have influenced the DNA methylome or transcriptome. In addition, we were unable to account for smaller vascular events like microinfarcts and degree of atherosclerosis, though our classification scheme would have excluded any participants with severe vascular pathology. Fifth, we were unable to confirm our methylated DNA results by another method, such as pyrosequencing or whole-genome methylome sequencing, nor with a validation cohort or with a cohort with PD but no dementia. Finally, our analysis demonstrated patterns in a single brain region without differentiation between the dorsolateral and ventrolateral prefrontal cortex, and it is very possible that other brain regions demonstrate different patterns of transcription and DNA methylation among these dementias, especially for various subcortical regions.
Overall, this study demonstrated that DNA methylation may drive a common transcriptional model across dementias that facilitates responses to oxidative stress. In addition, we showed that PDD has a strong divergence in DNA methylation and transcription within the PFC compared to the other dementias, which suggests that it may be more separable from DLB than previously thought, even when Aβ pathology is taken into account. We also demonstrated evidence that astrocytes could play a large role in facilitating pure DLB. We believe that future work in larger studies could be directed at expanding this joint DNA methylation and transcription analysis to other brain regions, as well as correlating these changes with neuropsychiatric symptoms to better understand how these processes influence symptom presentation across dementias.
ACKNOWLEDGMENTS
We thank the following institutions and associated individuals for help providing the neuropathological tissue: Alzheimer’s Disease Centers at Oregon Health and Science University (J. Kaye, R. Woltjier) Rush University Medical Center (D. Bennett, J. Schneider); University of California, San Diego (D. Galasko, E. Masliah), University of Kentucky (G. Jicha, P. Nelson, J. Neltner); University of Pennsylvania (D. Irwin); University of Pittsburgh (O. Lopez, J. Kofler); and University of Washington (J. Leverenz, D. Keene, T. Grabowski); Rush Memory and Aging Project, The Group Health/University of Washington Alzheimer’s Disease Patient Registry/Adult Changes in Thought Study (W. Kukull); Pacific Udall Parkinson’s Disease Research Center (C. Zabetian, T. Montine), Northwest PADRECC (J. Quinn, R. Woltijer); and University of Pennsylvania Udall Parkinson’s Disease Research Center (J. Trojanowski, D. Weintraub). We also thank Andrew Shutes-David for his insights during the conception and revision of this manuscript.
FUNDING
We thank the funders that supported this work: NIH/NINDS R03NS103950 (PI: D. Tsuang) and NIH/NINDS R01 NS48595 (PI: T. Montine).
CONFLICT OF INTEREST
The authors have no conflict of interest to report.
SUPPLEMENTARY MATERIAL
[1] The supplementary material is available in the electronic version of this article: https://dx.doi.org/10.3233/ADR-220114.
REFERENCES
[1] | Kovacs GG ((2019) ) Molecular pathology of neurodegenerative diseases: Principles and practice. J Clin Pathol 72: , 725–735. |
[2] | Nelson PT , Dickson DW , Trojanowski JQ , Jack CR , Boyle PA , Arfanakis K , Rademakers R , Alafuzoff I , Attems J , Brayne C , Coyle-Gilchrist ITS , Chui HC , Fardo DW , Flanagan ME , Halliday G , Hokkanen SRK , Hunter S , Jicha GA , Katsumata Y , Kawas CH , Keene CD , Kovacs GG , Kukull WA , Levey AI , Makkinejad N , Montine TJ , Murayama S , Murray ME , Nag S , Rissman RA , Seeley WW , Sperling RA , White III CL , Yu L , Schneider JA ((2019) ) Limbic-predominant age-related TDP-43 encephalopathy (LATE): Consensus working group report. Brain 142: , 1503–1527. |
[3] | Hardy JA , Higgins GA ((1992) ) Alzheimer’s disease: The amyloid cascade hypothesis. Science 256: , 184–185. |
[4] | McKhann GM , Knopman DS , Chertkow H , Hyman BT , Jack CR , Kawas CH , Klunk WE , Koroshetz WJ , Manly JJ , Mayeux R , Mohs RC , Morris JC , Rossor MN , Scheltens P , Carrillo MC , Thies B , Weintraub S , Phelps CH ((2011) ) The diagnosis of dementia due to Alzheimer’s disease: Recommendations from the National Institute on Aging-Alzheimer’s Association workgroups on diagnostic guidelines for Alzheimer’s disease. Alzheimers Dement 7: , 263–269. |
[5] | McKeith IG , Boeve BF , Dickson DW , Halliday G , Taylor J-P , Weintraub D , Aarsland D , Galvin J , Attems J , Ballard CG , Bayston A , Beach TG , Blanc F , Bohnen N , Bonanni L , Bras J , Brundin P , Burn D , Chen-Plotkin A , Duda JE , El-Agnaf O , Feldman H , Ferman TJ , Ffytche D , Fujishiro H , Galasko D , Goldman JG , Gomperts SN , Graff-Radford NR , Honig LS , Iranzo A , Kantarci K , Kaufer D , Kukull W , Lee VMY , Leverenz JB , Lewis S , Lippa C , Lunde A , Masellis M , Masliah E , McLean P , Mollenhauer B , Montine TJ , Moreno E , Mori E , Murray M , O’Brien JT , Orimo S , Postuma RB , Ramaswamy S , Ross OA , Salmon DP , Singleton A , Taylor A , Thomas A , Tiraboschi P , Toledo JB , Trojanowski JQ , Tsuang D , Walker Z , Yamada M , Kosaka K ((2017) ) Diagnosis and management of dementia with Lewy bodies: Fourth consensus report of the DLB Consortium. Neurology 89: , 88–100. |
[6] | Gale SA , Acar D , Daffner KR ((2018) ) Dementia. Am J Med 131: , 1161–1169. |
[7] | Vossius C , Rongve A , Testad I , Wimo A , Aarsland D ((2014) ) The use and costs of formal care in newly diagnosed dementia: A three-year prospective follow-up study. Am J Geriatr Psychiatry 22: , 381–388. |
[8] | Oesterhus R , Soennesyn H , Rongve A , Ballard C , Aarsland D , Vossius C ((2014) ) Long-term mortality in a cohort of home-dwelling elderly with mild Alzheimer’s disease and Lewy body dementia. Dement Geriatr Cogn Disord 38: , 161–169. |
[9] | Chiu P-Y , Tsai C-T , Chen P-K , Chen W-J , Lai T-J ((2016) ) Neuropsychiatric symptoms in Parkinson’s disease dementia are more similar to Alzheimer’s disease than dementia with Lewy bodies: A case-control study. PLoS One 11: , e0153989. |
[10] | Thomas AJ , Mahin-Babaei F , Saidi M , Lett D , Taylor JP , Walker L , Attems J ((2018) ) Improving the identification of dementia with Lewy bodies in the context of an Alzheimer’s-type dementia. Alzheimers Res Ther 10: , 27. |
[11] | Irwin DJ , Grossman M , Weintraub D , Hurtig HI , Duda JE , Xie SX , Lee EB , Van Deerlin VM , Lopez OL , Kofler JK , Nelson PT , Jicha GA , Woltjer R , Quinn JF , Kaye J , Leverenz JB , Tsuang D , Longfellow K , Yearout D , Kukull W , Keene CD , Montine TJ , Zabetian CP , Trojanowski JQ ((2017) ) Neuropathological and genetic correlates of survival and dementia onset in synucleinopathies: A retrospective analysis. Lancet Neurol 16: , 55–65. |
[12] | Walker L , Stefanis L , Attems J ((2019) ) Clinical and neuropathological differences between Parkinson’s disease, Parkinson’s disease dementia and dementia with Lewy bodies – current issues and future directions. J Neurochem 150: , 467–474. |
[13] | Jellinger KA ((2008) ) A critical reappraisal of current staging of Lewy-related pathology in human brain. Acta Neuropathol (Berl) 116: , 1. |
[14] | Beach TG , Adler CH , Lue L , Sue LI , Bachalakuri J , Henry-Watson J , Sasse J , Boyer S , Shirohi S , Brooks R , Eschbacher J , White CL , Akiyama H , Caviness J , Shill HA , Connor DJ , Sabbagh MN , Walker DG , Arizona Parkinson’s Disease Consortium ((2009) ) Unified staging system for Lewy body disorders: Correlation with nigrostriatal degeneration, cognitive impairment and motor dysfunction. Acta Neuropathol (Berl) 117: , 613–634. |
[15] | Jellinger KA , Korczyn AD ((2018) ) Are dementia with Lewy bodies and Parkinson’s disease dementia the same disease? BMC Med 16: , 34. |
[16] | McKeith IG , Galasko D , Kosaka K , Perry EK , Dickson DW , Hansen LA , Salmon DP , Lowe J , Mirra SS , Byrne EJ , Lennox G , Quinn NP , Edwardson JA , Ince PG , Bergeron C , Burns A , Miller BL , Lovestone S , Collerton D , Jansen EN , Ballard C , de Vos RA , Wilcock GK , Jellinger KA , Perry RH ((1996) ) Consensus guidelines for the clinical and pathologic diagnosis of dementia with Lewy bodies (DLB): Report of the consortium on DLB international workshop. Neurology 47: , 1113–1124. |
[17] | Mori H ((2005) ) Pathological substrate of dementia in Parkinson’s disease— its relation to DLB and DLBD. Parkinsonism Relat Disord 11: , S41–S45. |
[18] | Ballard C , Ziabreva I , Perry R , Larsen JP , O’Brien J , McKeith I , Perry E , Aarsland D ((2006) ) Differences in neuropathologic characteristics across the Lewy body dementia spectrum. Neurology 67: , 1931–1934. |
[19] | Jellinger KA ((2018) ) Dementia with Lewy bodies and Parkinson’s disease-dementia: Current concepts and controversies. J Neural Transm 125: , 615–650. |
[20] | Bougea A , Stefanis L , Paraskevas GP , Emmanouilidou E , Efthymiopoulou E , Vekrelis K , Kapaki E ((2018) ) Neuropsychiatric symptoms and α-synuclein profile of patients with Parkinson’s disease dementia, dementia with Lewy bodies and Alzheimer’s disease. J Neurol 265: , 2295–2301. |
[21] | Aarsland D , Cummings JL , Larsen JP ((2001) ) Neuropsychiatric differences between Parkinson’s disease with dementia and Alzheimer’s disease. Int J Geriatr Psychiatry 16: , 184–191. |
[22] | Aarsland D , Ballard C , Larsen JP , McKeith I ((2001) ) A comparative study of psychiatric symptoms in dementia with Lewy bodies and Parkinson’s disease with and without dementia. Int J Geriatr Psychiatry 16: , 528–536. |
[23] | Hepp DH , Vergoossen DLE , Huisman E , Lemstra AW , Netherlands Brain Bank , Berendse HW , Rozemuller AJ , Foncke EMJ , van de Berg WDJ ((2016) ) Distribution and load of amyloid-β pathology in Parkinson disease and dementia with Lewy bodies. J Neuropathol Exp Neurol 75: , 936–945. |
[24] | Lahiri DK , Maloney B , Zawia NH ((2009) ) The LEARn model: An epigenetic explanation for idiopathic neurobiological diseases. Mol Psychiatry 14: , 992–1003. |
[25] | Lardenoije R , Iatrou A , Kenis G , Kompotis K , Steinbusch HWM , Mastroeni D , Coleman P , Lemere CA , Hof PR , van den Hove DLA , Rutten BPF ((2015) ) The epigenetics of aging and neurodegeneration. Prog Neurobiol 131: , 21–64. |
[26] | Heyn H , Li N , Ferreira HJ , Moran S , Pisano DG , Gomez A , Diez J , Sanchez-Mut JV , Setien F , Carmona FJ , Puca AA , Sayols S , Pujana MA , Serra-Musach J , Iglesias-Platas I , Formiga F , Fernandez AF , Fraga MF , Heath SC , Valencia A , Gut IG , Wang J , Esteller M ((2012) ) Distinct DNA methylomes of newborns and centenarians. Proc Natl Acad Sci U S A 109: , 10522–10527. |
[27] | Sanchez-Mut JV , Heyn H , Vidal E , Moran S , Sayols S , Delgado-Morales R , Schultz MD , Ansoleaga B , Garcia-Esparcia P , Pons-Espinal M , de Lagran MM , Dopazo J , Rabano A , Avila J , Dierssen M , Lott I , Ferrer I , Ecker JR , Esteller M ((2016) ) Human DNA methylomes of neurodegenerative diseases show common epigenomic patterns. Transl Psychiatry 6: , e718. |
[28] | Moran S , Arribas C , Esteller M ((2016) ) Validation of a DNA methylation microarray for 850,000 CpG sites of the human genome enriched in enhancer sequences. Epigenomics 8: , 389–399. |
[29] | McKhann G , Drachman D , Folstein M , Katzman R , Price D , Stadlan EM ((1984) ) Clinical diagnosis of Alzheimer’s disease: Report of the NINCDS-ADRDA Work Group under the auspices of Department of Health and Human Services Task Force on Alzheimer’s Disease. Neurology 34: , 939–944. |
[30] | Gibb WR , Lees AJ ((1988) ) The relevance of the Lewy body to the pathogenesis of idiopathic Parkinson’s disease. J Neurol Neurosurg Psychiatry 51: , 745–752. |
[31] | Emre M , Aarsland D , Brown R , Burn DJ , Duyckaerts C , Mizuno Y , Broe GA , Cummings J , Dickson DW , Gauthier S , Goldman J , Goetz C , Korczyn A , Lees A , Levy R , Litvan I , McKeith I , Olanow W , Poewe W , Quinn N , Sampaio C , Tolosa E , Dubois B ((2007) ) Clinical diagnostic criteria for dementia associated with Parkinson’s disease, Mov Disord 22: , 1689–1707; quiz 1837. |
[32] | Leverenz JB , Hamilton R , Tsuang DW , Schantz A , Vavrek D , Larson EB , Kukull WA , Lopez O , Galasko D , Masliah E , Kaye J , Woltjer R , Clark C , Trojanowski JQ , Montine TJ ((2008) ) Empiric refinement of the pathologic assessment of Lewy-related pathology in the dementia patient. Brain Pathol 18: , 220–224. |
[33] | Duda JE , Giasson BI , Mabon ME , Lee VM-Y , Trojanowski JQ ((2002) ) Novel antibodies to synuclein show abundant striatal pathology in Lewy body diseases. Ann Neurol 52: , 205–210. |
[34] | Braak H , Braak E ((1991) ) Neuropathological stageing of Alzheimer-related changes. Acta Neuropathol (Berl) 82: , 239–259. |
[35] | Mirra SS , Heyman A , McKeel D , Sumi SM , Crain BJ , Brownlee LM , Vogel FS , Hughes JP , van Belle G , Berg L ((1991) ) The Consortium to Establish a Registry for Alzheimer’s Disease (CERAD). Part II. Standardization of the neuropathologic assessment of Alzheimer’s disease. Neurology 41: , 479–486. |
[36] | Tsuang D , Leverenz JB , Lopez OL , Hamilton RL , Bennett DA , Schneider JA , Buchman AS , Larson EB , Crane PK , Kaye JA , Kramer P , Woltjer R , Kukull W , Nelson PT , Jicha GA , Neltner JH , Galasko D , Masliah E , Trojanowski JQ , Schellenberg GD , Yearout D , Huston H , Fritts-Penniman A , Mata IF , Wan JY , Edwards KL , Montine TJ , Zabetian CP ((2012) ) GBA mutations increase risk for Lewy body disease with and without Alzheimer disease pathology. Neurology 79: , 1944–1950. |
[37] | Tsuang D , Leverenz JB , Lopez OL , Hamilton RL , Bennett DA , Schneider JA , Buchman AS , Larson EB , Crane PK , Kaye JA , Kramer P , Woltjer R , Trojanowski JQ , Weintraub D , Chen-Plotkin AS , Irwin DJ , Rick J , Schellenberg GD , Watson GS , Kukull W , Nelson PT , Jicha GA , Neltner JH , Galasko D , Masliah E , Quinn JF , Chung KA , Yearout D , Mata IF , Wan JY , Edwards KL , Montine TJ , Zabetian CP ((2013) ) APOE ɛ4 increases risk for dementia in pure synucleinopathies. JAMA Neurol 70: , 223–228. |
[38] | Tulloch J , Leong L , Chen S , Keene CD , Millard SP , Shutes-David A , Lopez OL , Kofler J , Kaye JA , Woltjer R , Nelson PT , Neltner JH , Jicha GA , Galasko D , Masliah E , Leverenz JB , Yu CE , Tsuang D ((2018) ) APOE DNA methylation is altered in Lewy body dementia. Alzheimers Dement 14: , 889–894. |
[39] | Aryee MJ , Jaffe AE , Corrada-Bravo H , Ladd-Acosta C , Feinberg AP , Hansen KD , Irizarry RA ((2014) ) Minfi: A flexible and comprehensive Bioconductor package for the analysis of Infinium DNA methylation microarrays. Bioinformatics 30: , 1363–1369. |
[40] | Ritchie ME , Phipson B , Wu D , Hu Y , Law CW , Shi W , Smyth GK ((2015) ) limma powers differential expression analyses for RNA-sequencing and microarray studies. Nucleic Acids Res 43: , e47. |
[41] | Jaffe AE , Kaminsky ZA ((2022) ) FlowSorted.DLPFC.450k: Illumina HumanMethylation data on sorted frontal cortex cell populations. R Package Version 1320. |
[42] | Phipson B , Maksimovic J , Oshlack A ((2016) ) missMethyl: An R package for analyzing data from Illumina’s HumanMethylation450 platform. Bioinformatics 32: , 286–288. |
[43] | Peters TJ , Buckley MJ , Chen Y , Smyth GK , Goodnow CC , Clark SJ ((2021) ) Calling differentially methylated regions from whole genome bisulphite sequencing with DMRcate. Nucleic Acids Res 49: , e109. |
[44] | Dobin A , Davis CA , Schlesinger F , Drenkow J , Zaleski C , Jha S , Batut P , Chaisson M , Gingeras TR ((2013) ) STAR: Ultrafast universal RNA-seq aligner. Bioinformatics 29: , 15–21. |
[45] | Li B , Dewey CN ((2011) ) RSEM: Accurate transcript quantification from RNA-Seq data with or without a reference genome. BMC Bioinformatics 12: , 323. |
[46] | Robinson MD , McCarthy DJ , Smyth GK ((2010) ) edgeR: A Bioconductor package for differential expression analysis of digital gene expression data. Bioinformatics 26: , 139–140. |
[47] | McKenzie AT , Wang M , Hauberg ME , Fullard JF , Kozlenkov A , Keenan A , Hurd YL , Dracheva S , Casaccia P , Roussos P , Zhang B ((2018) ) Brain cell type specific gene expression and co-expression network architectures. Sci Rep 8: , 8868. |
[48] | Langfelder P , Horvath S ((2008) ) WGCNA: An R package for weighted correlation network analysis. BMC Bioinformatics 9: , 559. |
[49] | Raudvere U , Kolberg L , Kuzmin I , Arak T , Adler P , Peterson H , Vilo J ((2019) ) g:Profiler: A web server for functional enrichment analysis and conversions of gene lists (2019 update). Nucleic Acids Res 47: , W191–W198. |
[50] | Shen L (2022) GeneOverlap: An R package to test and visualize gene overlaps. |
[51] | Zhang B , Horvath S ((2005) ) A general framework for weighted gene co-expression network analysis. Stat Appl Genet Mol Biol 4: , Article 17. |
[52] | Sjöstedt E , Zhong W , Fagerberg L , Karlsson M , Mitsios N , Adori C , Oksvold P , Edfors F , Limiszewska A , Hikmet F , Huang J , Du Y , Lin L , Dong Z , Yang L , Liu X , Jiang H , Xu X , Wang J , Yang H , Bolund L , Mardinoglu A , Zhang C , von Feilitzen K , Lindskog C , Pontén F , Luo Y , Hökfelt T , Uhlén M , Mulder J ((2020) ) An atlas of the protein-coding genes in the human, pig, and mouse brain. Science 367: , eaay5947. |
[53] | Alonso-Gardón M , Elorza-Vidal X , Castellanos A , La Sala G , Armand-Ugon M , Gilbert A , Di Pietro C , Pla-Casillanis A , Ciruela F , Gasull X , Nunes V , Martínez A , Schulte U , Cohen-Salmon M , Marazziti D , Estévez R ((2021) ) Identification of the GlialCAM interactome: The G protein-coupled receptors GPRC5B and GPR37L1 modulate megalencephalic leukoencephalopathy proteins. Hum Mol Genet 30: , 1649–1665. |
[54] | Maetzler W , Schmid B , Synofzik M , Schulte C , Riester K , Huber H , Brockmann K , Gasser T , Berg D , Melms A ((2010) ) The CST3 BB genotype and low cystatin C cerebrospinal fluid levels are associated with dementia in Lewy body disease. J Alzheimers Dis 19: , 937–942. |
[55] | Soleman S , Filippov MA , Dityatev A , Fawcett JW ((2013) ) Targeting the neural extracellular matrix in neurological disorders. Neuroscience 253: , 194–213. |
[56] | Sakai A , Nakato R , Ling Y , Hou X , Hara N , Iijima T , Yanagawa Y , Kuwano R , Okuda S , Shirahige K , Sugiyama S ((2017) ) Genome-wide target analyses of Otx2 homeoprotein in postnatal cortex. Front Neurosci 11: , 307. |
[57] | Reyes S , Fu Y , Double KL , Cottam V , Thompson LH , Kirik D , Paxinos G , Watson C , Cooper HM , Halliday GM ((2013) ) Trophic factors differentiate dopamine neurons vulnerable to Parkinson’s disease. Neurobiol Aging 34: , 873–886. |
[58] | Tripathi PP , Di Giovannantonio LG , Sanguinetti E , Acampora D , Allegra M , Caleo M , Wurst W , Simeone A , Bozzi Y ((2014) ) Increased dopaminergic innervation in the brain of conditional mutant mice overexpressing Otx2: Effects on locomotor behavior and seizure susceptibility. Neuroscience 261: , 173–183. |
[59] | Di Salvio M , Di Giovannantonio LG , Acampora D , Prosperi R , Omodei D , Prakash N , Wurst W , Simeone A ((2010) ) Otx2 controls neuron subtype identity in ventral tegmental area and antagonizes vulnerability to MPTP. Nat Neurosci 13: , 1481–1488. |
[60] | Flores-Cuadrado A , Ubeda-Bañon I , Saiz-Sanchez D , Martinez-Marcos A ((2017) ) α-synucleinopathy in the human amygdala in Parkinson disease: Differential vulnerability of somatostatin- and parvalbumin-expressing neurons. J Neuropathol Exp Neurol 76: , 754–758. |
[61] | Stanojlovic M , Yllescas JPP , Vijayakumar A , Kotz C ((2019) ) Early sociability and social memory impairment in the A53T mouse model of Parkinson’s disease are ameliorated by chemogenetic modulation of orexin neuron activity. Mol Neurobiol 56: , 8435–8450. |
[62] | Kaufman J , Wymbs NF , Montalvo-Ortiz JL , Orr C , Albaugh MD , Althoff R , O’Loughlin K , Holbrook H , Garavan H , Kearney C , Yang B-Z , Zhao H , Peña C , Nestler EJ , Lee RS , Mostofsky S , Gelernter J , Hudziak J ((2018) ) Methylation in OTX2 and related genes, maltreatment, and depression in children. Neuropsychopharmacology 43: , 2204–2211. |
[63] | Peña CJ , Kronman HG , Walker DM , Cates HM , Bagot RC , Purushothaman I , Issler O , Loh Y-HE , Leong T , Kiraly DD , Goodman E , Neve RL , Shen L , Nestler EJ ((2017) ) Early life stress confers lifelong stress susceptibility in mice via ventral tegmental area OTX2. Science 356: , 1185–1188. |
[64] | Vincent C , Gilabert-Juan J , Gibel-Russo R , Alvarez-Fischer D , Krebs M-O , Le Pen G , Prochiantz A , Di Nardo AA ((2021) ) Non-cell-autonomous OTX2 transcription factor regulates anxiety-related behavior in the mouse. Mol Psychiatry 26: , 6469–6480. |
[65] | Young JI , Sivasankaran SK , Wang L , Ali A , Mehta A , Davis DA , Dykxhoorn DM , Petito CK , Beecham GW , Martin ER , Mash DC , Pericak-Vance M , Scott WK , Montine TJ , Vance JM ((2019) ) Genome-wide brain DNA methylation analysis suggests epigenetic reprogramming in Parkinson disease. Neurol Genet 5: , e342. |
[66] | Gogia N , Chimata AV , Deshpande P , Singh A , Singh A ((2020) ) Hippo signaling: Bridging the gap between cancer and neurodegenerative disorders. Neural Regen Res 16: , 643–652. |
[67] | Sahu MR , Mondal AC ((2020) ) The emerging role of Hippo signaling in neurodegeneration. J Neurosci Res 98: , 796–814. |
[68] | Ahn EH , Kang SS , Qi Q , Liu X , Ye K ((2020) ) Netrin1 deficiency activates MST1 via UNC5B receptor, promoting dopaminergic apoptosis in Parkinson’s disease. Proc Natl Acad Sci U S A 117: , 24503–24513. |
[69] | Walker L , McAleese KE , Thomas AJ , Johnson M , Martin-Ruiz C , Parker C , Colloby SJ , Jellinger K , Attems J ((2015) ) Neuropathologically mixed Alzheimer’s and Lewy body disease: Burden of pathological protein aggregates differs between clinical phenotypes. Acta Neuropathol (Berl) 129: , 729–748. |
[70] | Colloby SJ , Watson R , Blamire AM , O’Brien JT , Taylor J-P ((2020) ) Cortical thinning in dementia with Lewy bodies and Parkinson disease dementia. Aust N Z J Psychiatry 54: , 633–643. |
[71] | Sanchez-Castaneda C , Rene R , Ramirez-Ruiz B , Campdelacreu J , Gascon J , Falcon C , Calopa M , Jauma S , Juncadella M , Junque C ((2009) ) Correlations between gray matter reductions and cognitive deficits in dementia with Lewy bodies and Parkinson’s disease with dementia. Mov Disord 24: , 1740–1746. |
[72] | Raunio A , Kaivola K , Tuimala J , Kero M , Oinas M , Polvikoski T , Paetau A , Tienari PJ , Myllykangas L ((2019) ) Lewy-related pathology exhibits two anatomically and genetically distinct progression patterns: A population-based study of Finns aged 85+. Acta Neuropathol (Berl) 138: , 771–782. |
[73] | Horsager J , Andersen KB , Knudsen K , Skjærbæk C , Fedorova TD , Okkels N , Schaeffer E , Bonkat SK , Geday J , Otto M , Sommerauer M , Danielsen EH , Bech E , Kraft J , Munk OL , Hansen SD , Pavese N , Göder R , Brooks DJ , Berg D , Borghammer P ((2020) ) Brain-first versus body-first Parkinson’s disease: A multimodal imaging case-control study. Brain 143: , 3077–3088. |
[74] | Borghammer P ((2018) ) How does parkinson’s disease begin? Perspectives on neuroanatomical pathways, prions, and histology. Mov Disord 33: , 48–57. |
[75] | Jurcau A ((2021) ) Insights into the pathogenesis of neurodegenerative diseases: Focus on mitochondrial dysfunction and oxidative stress. Int J Mol Sci 22: , 11847. |
[76] | Krols M , van Isterdael G , Asselbergh B , Kremer A , Lippens S , Timmerman V , Janssens S ((2016) ) Mitochondria-associated membranes as hubs for neurodegeneration. Acta Neuropathol (Berl) 131: , 505–523. |
[77] | Grimm A , Eckert A ((2017) ) Brain aging and neurodegeneration: From a mitochondrial point of view. J Neurochem 143: , 418–431. |
[78] | Coppedè F ((2021) ) One-carbon epigenetics and redox biology of neurodegeneration. Free Radic Biol Med 170: , 19–33. |
[79] | Wiese M , Bannister AJ ((2020) ) Two genomes, one cell: Mitochondrial-nuclear coordination via epigenetic pathways. Mol Metab 38: , 100942. |
[80] | Sorrentino ZA , Giasson BI , Chakrabarty P ((2019) ) α-Synuclein and astrocytes: Tracing the pathways from homeostasis to neurodegeneration in Lewy body disease. Acta Neuropathol (Berl) 138: , 1–21. |
[81] | Jeon Y-M , Kwon Y , Jo M , Lee S , Kim S , Kim H-J ((2020) ) The role of glial mitochondria in α-synuclein toxicity. Front Cell Dev Biol 8: , 548283. |
[82] | Ferrer I ((2017) ) Diversity of astroglial responses across human neurodegenerative disorders and brain aging. Brain Pathol 27: , 645–674. |
[83] | Castagnet PI , Golovko MY , Barceló-Coblijn GC , Nussbaum RL , Murphy EJ ((2005) ) Fatty acid incorporation is decreased in astrocytes cultured from alpha-synuclein gene-ablated mice. J Neurochem 94: , 839–849. |
[84] | Nasamran CA , Sachan ANS , Mott J , Kuras YI , Scherzer CR , Study HB , Ricciardelli E , Jepsen K , Edland SD , Fisch KM , Desplats P ((2021) ) Differential blood DNA methylation across Lewy body dementias. Alzheimers Dement (Amst) 13: , e12156. |
[85] | Santpere G , Garcia-Esparcia P , Andres-Benito P , Lorente-Galdos B , Navarro A , Ferrer I ((2018) ) Transcriptional network analysis in frontal cortex in Lewy body diseases with focus on dementia with Lewy bodies. Brain Pathol 28: , 315–333. |
[86] | Bereczki E , Branca RM , Francis PT , Pereira JB , Baek J-H , Hortobágyi T , Winblad B , Ballard C , Lehtiö J , Aarsland D ((2018) ) Synaptic markers of cognitive decline in neurodegenerative diseases: A proteomic approach. Brain 141: , 582–595. |
[87] | Rajkumar AP , Bidkhori G , Shoaie S , Clarke E , Morrin H , Hye A , Williams G , Ballard C , Francis P , Aarsland D ((2020) ) Postmortem cortical transcriptomics of Lewy body dementia reveal mitochondrial dysfunction and lack of neuroinflammation. Am J Geriatr Psychiatry 28: , 75–86. |
[88] | Humphries CE , Kohli MA , Nathanson L , Whitehead P , Beecham G , Martin E , Mash DC , Pericak-Vance MA , Gilbert J ((2015) ) Integrated whole transcriptome and DNA methylation analysis identifies gene networks specific to late-onset Alzheimer’s disease. J Alzheimers Dis 44: , 977–987. |
[89] | Masliah E , Dumaop W , Galasko D , Desplats P ((2013) ) Distinctive patterns of DNA methylation associated with Parkinson disease. Epigenetics 8: , 1030–1038. |
[90] | Henderson-Smith A , Fisch KM , Hua J , Liu G , Ricciardelli E , Jepsen K , Huentelman M , Stalberg G , Edland SD , Scherzer CR , Dunckley T , Desplats P ((2019) ) DNA methylation changes associated with Parkinson’s disease progression: Outcomes from the first longitudinal genome-wide methylation analysis in blood. Epigenetics 14: , 365–382. |
[91] | Li P , Ensink E , Lang S , Marshall L , Schilthuis M , Lamp J , Vega I , Labrie V ((2020) ) Hemispheric asymmetry in the human brain and in Parkinson’s disease is linked to divergent epigenetic patterns in neurons. Genome Biol 21: , 61. |
[92] | Moore K , McKnight AJ , Craig D , O’Neill F ((2014) ) Epigenome-wide association study for Parkinson’s disease. NeuroMolecular Med 16: , 845–855. |
[93] | Dashtipour K , Tafreshi A , Adler C , Beach T , Chen X , Serrano G , Tashiro S , Wang C ((2017) ) Hypermethylation of synphilin-1, alpha-synuclein-interacting protein (SNCAIP) gene in the cerebral cortex of patients with sporadic Parkinson’s disease. Brain Sci 7: , 74. |


