
Sleep Dysregulation Is Associated with 18F-FDG PET and Cerebrospinal Fluid Biomarkers in Alzheimer’s Disease
Abstract
Background:
Sleep impairment has been commonly reported in Alzheimer’s disease (AD) patients. The association between sleep dysregulation and AD biomarkers has been separately explored in mild cognitive impairment (MCI) and AD patients.
Objective:
The present study investigated cerebrospinal-fluid (CSF) and 18F-fluoro-deoxy-glucose positron emission tomography (18F-FDG-PET) biomarkers in MCI and AD patients in order to explore their association with sleep parameters measured with polysomnography (PSG).
Methods:
MCI and AD patients underwent PSG, 18F-FDG-PET, and CSF analysis for detecting and correlating these biomarkers with sleep architecture.
Results:
Thirty-five patients were included in the study (9 MCI and 26 AD patients). 18F-FDG uptake in left Brodmann area 31 (owing to the posterior cingulate cortex) correlated negatively with REM sleep latency (p = 0.013) and positively with REM sleep (p = 0.033). 18F-FDG uptake in the hippocampus was negatively associated with sleep onset latency (p = 0.041). Higher CSF orexin levels were associated with higher sleep onset latency (p = 0.042), Non-REM stage 1 of sleep (p = 0.031), wake after sleep onset (p = 0.028), and lower sleep efficiency (p = 0.045). CSF levels of Aβ42 correlated negatively with the wake bouts index (p = 0.002). CSF total-tau and phosphorylated tau levels correlated positively with total sleep time (p = 0.045) and time in bed (p = 0.031), respectively.
Conclusion:
Sleep impairment, namely sleep fragmentation, REM sleep dysregulation, and difficulty in initiating sleep correlates with AD biomarkers, suggesting an effect of sleep on the pathological processes in different AD stages. Targeting sleep for counteracting the AD pathological processes represents a timely need for clinicians and researchers.
INTRODUCTION
Sleep is commonly impaired in patients with Alzheimer’s disease (AD) [1–4]. Compelling evidence demonstrated that REM sleep is progressively fragmented and reduced, slow wave sleep becomes lower, the sleep-wake cycle becomes irregular, and nocturnal sleep losses continuity and stability in the AD continuum [2, 5–9]. In particular, transversal studies including patients with mild cognitive impairment (MCI) and dementia due to AD demonstrated a progressive deterioration of sleep quality and continuity [10]. Recently, the bidirectional relation between sleep and AD has been postulated with several studies highlighting that sleep disturbances can increase the risk of developing AD and hasten amyloid-β (Aβ) pathology [1–4]. Increasing evidence suggests that sleep deteriorates in parallel with deposition of Aβ in AD [11–14]. Moreover, sleep dysregulation may occur earlier than cognitive decline, or can be coupled with the impairment of cognitive performance along the AD progression [12–14].
Consistently, previous studies demonstrated that sleep impairment, featured by increased sleep onset latency (SOL), decreased sleep efficiency (SE), or reduced total sleep time (TST), is associated with a greater Aβ burden measured by positron emission tomography (PET) and reduced cerebrospinal fluid (CSF) Aβ42 levels [5, 15–18].
Considering the significant role that sleep presents in the neurodegenerative AD trajectory, the impact of sleep dysregulation in MCI and AD patients and its modulating effect on the commonly used biomarkers for AD diagnosis is not completely known. Therefore, the present study aimed to evaluate the association among sleep impairment measured by polysomnography (PSG), CSF biomarkers (Aβ42 and tau proteins), and cerebral glucose metabolism evaluated using 18F-fluoro-deoxy-glucose PET (18F-FDG-PET) in a cohort of patients affected by AD, either with MCI or dementia. Moreover, considering the role that orexin has in AD pathology [19], the correlation among CSF orexin levels, cerebral glucose metabolism and sleep in patients with MCI and dementia due to AD was also assessed.
METHODS
Participants and study design
This study included a retrospective cohort, which was already described in previous studies, of MCI due to AD patients and AD patients, selected on the basis of the additional 18F-FDG-PET performed at the time of the other analysis [20, 21]. All patients were recruited at the Neurology Unit of the University Hospital of Rome “Tor Vergata”, and underwent physical and neurological examination (including Mini-Mental State Examination [MMSE] and Clinical Dementia Rating [CDR]), PSG, lumbar puncture for CSF AD biomarker and orexin analysis, and 18F-FDG-PET. All patients with AD included in this study received the diagnosis of MCI or AD according to the diagnostic guidelines and biomarker analysis [22, 23].
Patients were required to fulfil the following inclusion criteria: no additional neurological or psychiatric disease; and no intake of CNS active drugs. Exclusion criteria for patients were: systemic and/or neurologic infectious, inflammatory, or autoimmune diseases; diabetes; diagnosis of primary sleep disorders or other conditions interfering with sleep quality, such as symptomatic obstructive pulmonary disease and uncontrolled seizures; abnormal cell count (>4 cells/mcL) at the CSF sample analysis; history of alcohol or other substance abuse; intake of caffeine or substances interfering with sleep quality at the time of analysis.
A group of age and sex-matched controls was also recruited at the Department of Biomedicine and Prevention at the University of Rome “Tor Vergata”. All the controls underwent physical and neurological examinations and 18F-FDG PET. Specifically, the control group included patients undergoing clinical neurologic examination and 18F-FDG PET for suspected malignancies, which were ruled out after diagnostic investigations.
The study protocol was considered observational and approved by the Ethical Committee of the University Hospital of Rome “Tor Vergata”. Written informed consent was obtained from all the participants in the study.
Polysomnographic recordings
Patients with MCI and AD underwent the PSG study to evaluate their nocturnal sleep, as previously reported (SOMNOscreen; SOMNOmedics GmbH) [7, 21]. Briefly, the montage consisted of 2 oculographic channels, 3 electromyographic channels (mental and anterior tibialis muscles), and 8 electroencephalographic channels (F4, C4, O2, A2, F3, C3, O1, and A1). PSG recordings were evaluated by experts in sleep medicine (CL, FP, FI) and the following standard PSG variables were included in the analysis: time in bed (TIB, time spent in bed between lights off and lights on), SOL (the interval between lights off and the first sleep epoch), TST (the actual sleep time without sleep onset latency and awakenings), SE (the ratio of total sleep time to time in bed), REM sleep latency (REML, the interval between sleep onset and the first epoch of REM), stage 1 of non-REM sleep (N1), stage 2 of non-REM sleep (N2), stage 3 of non-REM sleep (N3), REM sleep, and wakefulness after sleep onset (WASO). Sleep stage percentages were calculated over the TST. The wake bouts index, defined as continuous sequences of wake epochs occurring after the beginning of persistent sleep and then divided by the number of hours of sleep was identified and computed over TIB.
CSF biomarker analysis
All CSF samples were obtained the day after the PSG recording by lumbar puncture performed in the decubitus position between 8 : 00 and 9 : 30 AM, within 1 to 2 hours after morning awakening, using an atraumatic needle. For detailed methods please see previously published studies [20, 24]. The CSF levels of Aβ42, total-tau (t-tau), phosphorylated tau (p-tau), and orexin were determined according to previously published standard procedures [25–27].
PET/CT scanning protocol
All subjects were intravenously injected with 18F-FDG (dose range 185–295 megabecquerels) and hydrated with 500 mL of saline (0.9 % sodium chloride). PET/CT acquisition, using a General Electric VCT PET/CT scanner, started 30±5 min after 18F-FDG injection and lasted 10 min for all participants. 18F-FDG-PET studies were performed within one week of the PSG recording. The reconstruction parameters were as follows: ordered subset expectation maximization, 4 subsets and 14 iterations; matrix 256×256; full width at half maximum (FWHM): 5 mm [28].
Statistical analysis
Data were analysed using the commercial statistical software SPSS (IBM Corporation, Armonk, NY, USA) [29]. Data are reported as mean and standard deviation or medians and interquartile ranges for continuous variables, whereas categorical data are reported as counts and percentages. The differences between MCI and AD patients groups for demographic, clinical, PSG, and CSF data were tested using Mann-Whitney U-test.
Statistical parametric mapping 12 (SPM12) implemented in MATLAB 2018a was used to analyse PET scans in this study (https://www.fil.ion.ucl.ac.uk/spm/software/spm12/). PET data were converted from DICOM to NIfTI format using MRIcro software available at https://www.nitrc.org/projects/mricron and then subjected to a normalisation process. A bias regularisation was applied (0.0001) to limit biases due to smooth, spatially varying artefacts that modulate the image’s intensity and hinder automated images processing. To prevent the algorithm from trying to model the intensity variation due to different tissue types, the FWHM of the Gaussian smoothness of bias was set at a 60-mm cut-off. A tissue probability map implemented in SPM12 was used (TPM.nii). To achieve approximate alignment to the ICBM space template—European brains [30, 31], mutual information affine registration was used with the tissue probability maps [32]. Warping regularisation was set with the following 1×5 arrays (0, 0.001, 0.5, 0.05, 0.2). To cope with functional anatomical variability that is not compensated by spatial normalisation and improves the signal-to-noise ratio, smoothness was set at 5 mm, and the sampling distance, which encodes the approximate distance between sampled points when estimating the model parameters, was set at 3.
To blur the individual variations (especially gyral variations) and to increase the signal-to-noise ratio, an 8-mm isotropic Gaussian filter was employed. Before regression analysis, the following parameters and post-processing tools were used: global normalisation (which escalates images to a global value)=50 (using proportional scaling); masking threshold (to help identify voxels with an acceptable signal in them) was set to 0.8; transformation tool of statistical parametric maps into normal distribution; correction of SPM coordinates to match the Talairach coordinates, subroutine implemented by Matthew Brett (https://www.mrc-cbu.cam.ac.uk/Imaging). Brodmann areas (BA) were identified at a range from 0 to 3 mm from the corrected Talairach coordinates of the SPM output isocenter using a Talairach client available at https://www.talairach.org/index.html. As proposed by Bennett et al. [33], SPM t-maps were corrected for multiple comparisons using the false discovery rate (p≤0.05) and corrected for multiple comparisons at the cluster level (p≤0.001). The level of significance was set at 100 (5×5×5 voxels, i.e., 11×11×11 mm) contiguous voxels [33]. The following voxel-based comparisons were assessed: controls versus MCI and AD patients and vice versa. All the comparisons were performed using the ‘two-sample t-test’ design model available in SPM12 [28]. Sex and age were used as covariates in the analyses.
The cluster obtained in the regression analysis was then exported by means of the WFU Pickatlas tool implemented in SPM 12. Specifically, the mean signal intensities calculated from each cluster within each subject were normalised to the average intensities of the Pons volume of interest, as previously suggested by Pagani and colleagues [34]. To determine whether the normalised 18F-FDG values for the studied cluster were Gaussian distributed, the D’Agostino K-squared normality test was applied (with the null hypothesis being normal distribution). Only the BA showing a significantly significance on 18F-FDG uptake (i.e., highest Z-scores; Supplementary Table 1) in the comparison between patients to controls were then selected for the correlations. Correlations between the CSF biomarker levels, 18F-FDG PET, and PSG data in all AD patients were performed using Kendalls’ tau b correlation test. Statistical significance was set at p≤0.05.
RESULTS
Thirty-five patients with biomarkers consistent with AD pathology (54.3% male, mean age of 70.66±7.18) were included in this study. Nine patients were diagnosed as affected by MCI due to AD (55.6% male, mean age of 70.33±7.70) and 26 patients with AD (53.8% male, mean age of 70.77±7.15). Patients’ demographic and clinical characteristics are reported in Table 1.
Table 1
Patients’ demographic and clinical data
| Patients’ subgroup | |||
| Total AD patients | MCI patients | AD patients | |
| (n = 35) | (n = 9) | (n = 26) | |
| Mean±SD | Mean±SD | Mean±SD | |
| Mean age, y | 70.66±7.18 | 70.33±7.70 | 70.77±7.15 |
| Sex, n. (%) | |||
| Male | 19 (54.3%) | 5 (55.6 %) | 14 (53.8 %) |
| Female | 16 (45.7 %) | 4 (44.4 %) | 12 (46.2%) |
| Disease duration in years | 2.89±1.99 | 2.11±1.05 | 3.16±2.18 |
| MMSE score | 19.88±5.09 | 25.84±1.13 | 17.82±4.20 |
| CDR score | 1.71±1.07 | 0.50±0.00 | 2.13±0.91 |
AD, Alzheimer’s disease; MCI, mild cognitive impairment; SD, standard deviation; MMSE, Mini-Mental State Examination; CDR, Clinical Dementia Rating.
With regard to CSF biomarkers, no significant differences were found between the MCI and AD groups (Table 2). From the group differences regarding PSG data, patients with AD showed a higher duration in TIB and WASO, as well as a lower SE when compared to the patients with MCI due to AD (Table 2). No other significant differences were documented for PSG data between these two groups.
Table 2
Cerebrospinal fluid biomarkers and polysomnographic data of AD patients
| Differences between groups | |||||||
| AD patients | MCI due to AD | AD patients | Mann-Whitney | ||||
| (n = 35) | (n = 9) | (n = 26) | test | ||||
| Mean±SD | Median | 25-75th Percentile | Median | 25-75th Percentile | U | p | |
| CSF data | |||||||
| Aβ42 | 347.94±242.26 | 312.00 | 139.00 –460.50 | 315.00 | 207.50 –399.00 | 131.0 | 0.616 |
| t-tau. | 660.20±255.85 | 674.00 | 516.00 –905.00 | 643.50 | 468.00 –789.25 | 106.0 | 0.697 |
| p-tau | 94.26±43.62 | 84.00 | 71.00 –110.50 | 87.50 | 60.00 –114.25 | 114.0 | 0.926 |
| Orexin | 147.73±35.24 | 139.60 | 118.10 –152.30 | 152.10 | 122.05 –171.85 | 143.5 | 0.323 |
| PSG data | |||||||
| Total Time in Bed | 518.02±71.76 | 460.00 | 430.00 –524.00 | 536.0 | 506.01 –584.25 | 176.0 | 0.025 |
| Total sleep time (min) | 367.71±67.45 | 382.70 | 334.00 –422.50 | 363.0 | 335.84 –404.44 | 101.0 | 0.565 |
| Sleep efficiency (%) | 71.52±12.22 | 82.50 | 72.60 –88.05 | 69.50 | 61.40 –76.88 | 57.50 | 0.023 |
| Sleep onset latency (min) | 23.18±26.64 | 17.00 | 8.00 –21.50 | 18.50 | 2.00 –31.25 | 126.0 | 0.753 |
| REM sleep latency (min) | 206.24±145.34 | 140.50 | 41.00 –251.00 | 208.50 | 122.75 –298.00 | 151.0 | 0.210 |
| REM (%) | 6.26±4.72 | 9.60 | 3.70 –12.55 | 5.45 | 1.20 –9.38 | 78.0 | 0.149 |
| N1 (%) | 34.16±11.89 | 32.00 | 23.45 –38.35 | 37.75 | 29.51 –43.10 | 158.0 | 0.128 |
| N2 (%) | 49.03±10.75 | 48.60 | 40.05 –58.40 | 50.55 | 41.85 –56.23 | 116.0 | 0.985 |
| N3 (%) | 10.19±8.46 | 12.80 | 2.20 –18.15 | 6.75 | 2.03 –16.98 | 108.5 | 0.753 |
| WASO (min) | 150.70±76.49 | 102.40 | 54.50 –137.00 | 163.70 | 115.75 –222.50 | 188.0 | 0.006 |
| Wake bouts index | 4.45±1.99 | 4.30 | 2.65 –5.80 | 4.00 | 2.75 –6.10 | 124.0 | 0.810 |
AD, Alzheimer’s disease; MCI, mild cognitive impairment; SD, standard deviation; CSF, cerebrospinal-fluid; Aβ42, amyloid-beta 42; t-tau, total tau; p-tau, phosphorylated tau; PSG, polysomnographic, t-tau; WASO, wake after sleep onset; REM, Rapid Eye Movement, N1, Non-REM stage 1; N2, Non-REM stage 2; N3, Non-REM stage 3.
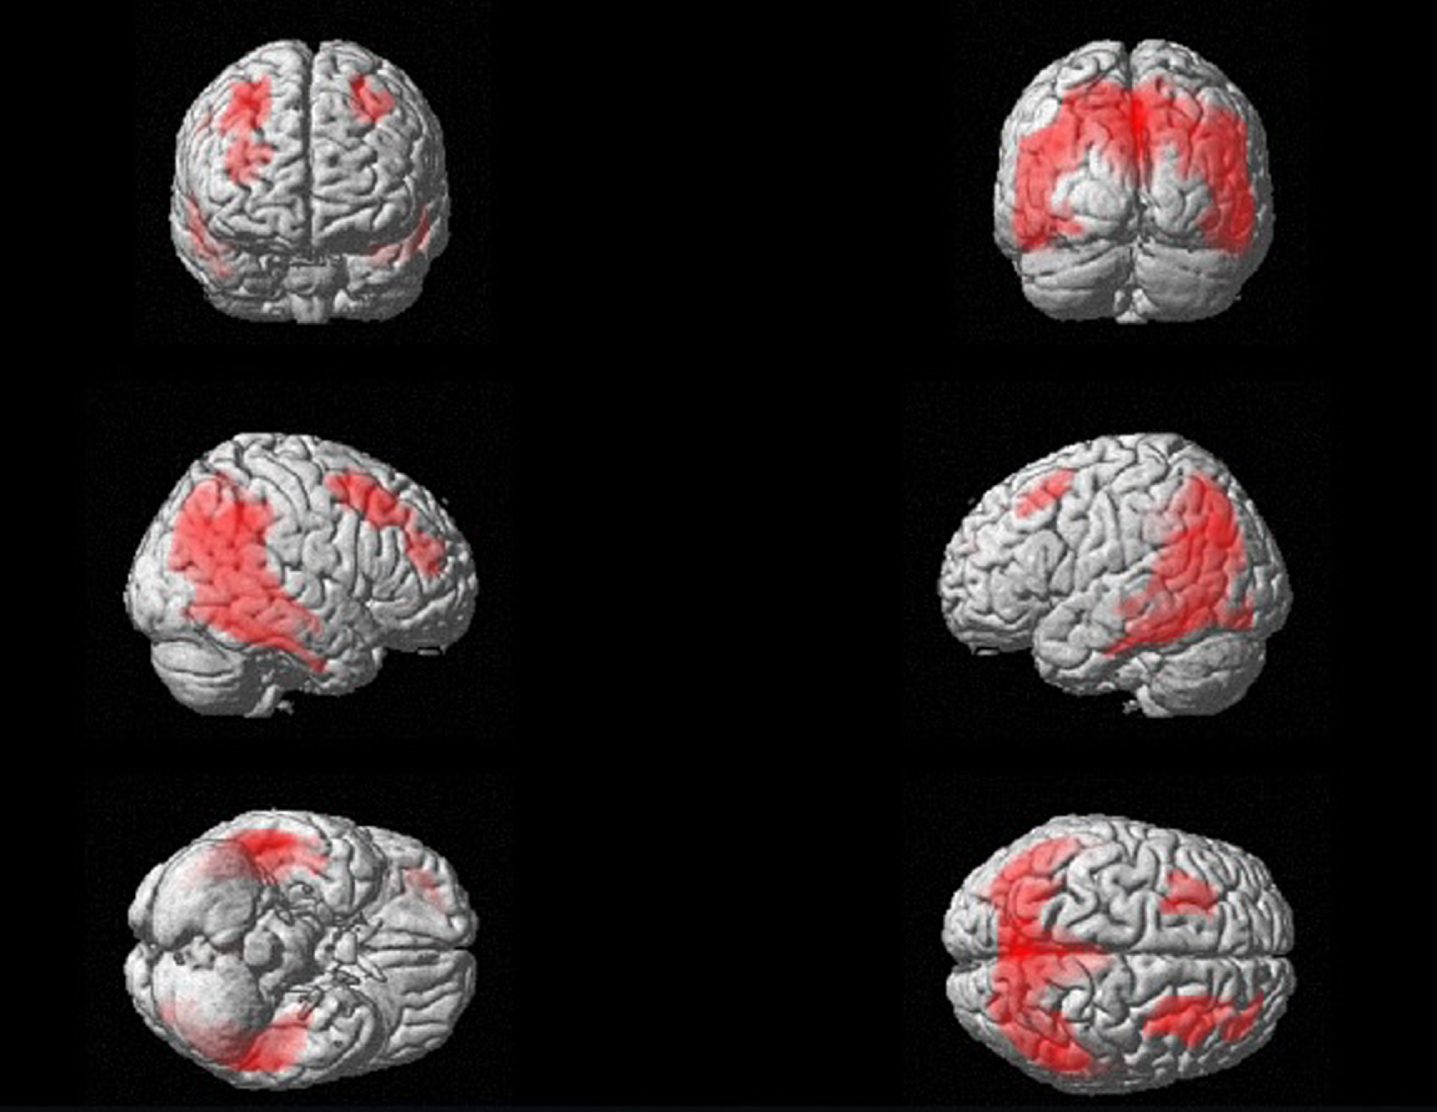
In the 18F-FDG PET analysis, the comparison between patients and controls lead to the detection of a wide cluster of reduced glucose metabolism in patients with MCI and AD. As reported in supplemental Table 1, this cluster reaches its highest significance in the following BA: 31, 7, and 19, which correspond to cingulate gyrus and praecuneus. Nevertheless, the wide cluster involves also parietal and temporal lobes, which are known to be substantially affected by AD (see Fig. 1). Considering these results, exclusively the BA showing the high significance (i.e., highest Z-scores) in the comparison between patients and controls were included in the correlation analysis.
Fig. 1
Three-dimensional brain rendering displaying the results of SPM comparison between patients and controls, which shows a wide cluster that involves bilateral parietal and temporal lobes and frontal cortex. For the SPM analysis, see Supplementary Table 1.
Regarding the correlations between clinical, CSF, PSG, and 18F-FDG PET data, a significant association was found between the 18F-FDG uptake in some BA and PSG parameters. 18F-FDG uptake in left BA31 (owing to the posterior cingulate cortex) correlated negatively with LREM (r=-0.294, p = 0.013) and positively with REM sleep (r = 0.253, p = 0.033). 18F-FDG uptake in the hippocampus correlated negatively with SOL (r=-0.245, p = 0.041). No significant associations were found between CSF data and brain 18F-FDG uptake. MMSE scores correlated negatively with several PSG parameters, namely TIB (r=-0.357, p = 0.003), LREM (r=-0.244, p = 0.041), and WASO (r=-0.379, p = 0.002), whereas correlated positively with SE (r = 0.317, p = 0.008). Moreover, a positive correlation was found between MMSE and 18F-FDG uptake in the left BA7 (owing to the inferior parietal lobe) (r = 0.241, p = 0.043).
Levels of CSF orexin correlated positively with SOL (r = 0.244; p = 0.042), N1 (r = 0.257; p = 0.031), and WASO (r = 0.262; p = 0.028). Furthermore, CSF orexin levels were negatively correlated with SE (r=–0.238; p = 0.045). CSF levels of Aβ42 only correlated negatively with the wake bouts index (p = 0.002). CSF t-tau and p-tau levels were positive associated with TST (r = 0.237; p = 0.045) and TIB (r = 0.247; p = 0.031), respectively. Table 3 shows the significant correlations among clinical, CSF, PSG, and 18F-FDG PET data in the whole group of patients.
Table 3
Correlations among clinical features, 18F-FDG PET, CSF, and PSG data
| 1 | 2 | 3 | 4 | 5 | 6 | 7 | 8 | 9 | 10 | 11 | 12 | 13 | 14 | 15 | 16 | 17 | 18 | 19 | 20 | 21 | 22 | 23 | 24 | |
| 1. MMSE | 1 | |||||||||||||||||||||||
| 2. CSF t-tau | 0.014 | 1 | ||||||||||||||||||||||
| 3. CSF p-tau | 0.005 | 0.602** | 1 | |||||||||||||||||||||
| 4. CSF Aβ42 | –0.066 | –0.024 | 0.073 | 1 | ||||||||||||||||||||
| 5. CSF orexin | –0.039 | 0.030 | 0.019 | –0.002 | 1 | |||||||||||||||||||
| 6. TIB | –0.357** | 0.217 | 0.257* | –0.013 | 0.132 | 1 | ||||||||||||||||||
| 7. TST | 0.031 | 0.237* | 0.166 | 0.135 | –0.034 | 0.247* | 1 | |||||||||||||||||
| 8. SE | 0.317** | 0.064 | 0.039 | 0.062 | –0.238* | –0.229 | 0.525** | 1 | ||||||||||||||||
| 9. SOL | –0.108 | 0.099 | 0.012 | –0.100 | 0.244* | 0.245* | 0.051 | –0.148 | 1 | |||||||||||||||
| 10. LREM | –0.244* | 0.049 | –0.054 | 0.007 | 0.132 | 0.278* | 0.045 | –0.175 | 0.119 | 1 | ||||||||||||||
| 11. N1 (%) | –0.122 | 0.146 | 0.179 | –0.003 | 0.257* | 0.210 | 0.008 | –0.148 | 0.078 | 0.089 | 1 | |||||||||||||
| 12. N2 (%) | –0.094 | –0.135 | –0.178 | –0.019 | –0.019 | 0.037 | 0.013 | 0.019 | –0.237* | 0.270* | –0.246* | 1 | ||||||||||||
| 13. N3 (%) | 0.088 | –0.210 | –0.081 | –0.061 | –0.220 | –0.133 | –0.106 | 0.067 | 0.082 | –0.180 | –0.520** | –0.091 | 1 | |||||||||||
| 14. REM (%) | 0.175 | 0.071 | 0.019 | 0.157 | –0.198 | –0.206 | 0.067 | 0.221 | 0.053 | –0.519** | –0.219 | –0.370** | 0.192 | 1 | ||||||||||
| 15. WASO (%) | –0.379** | –0.024 | 0.042 | –0.045 | 0.262* | 0.401** | –0.353** | –0.823** | 0.202 | 0.205 | 0.232* | –0.008 | –0.131 | –0.255* | 1 | |||||||||
| 16. Wake bout index | –0.032 | –0.162 | –0.144 | –0.363** | –0.046 | –0.007 | –0.432** | –0.319** | 0.002 | –0.003 | –0.017 | –0.005 | 0.088 | –0.107 | 0.258* | 1 | ||||||||
| 17. Hippocampus | 0.047 | –0.052 | 0.105 | –0.111 | –0.054 | –0.086 | –0.170 | 0.034 | –0.245* | –0.049 | 0.015 | 0.128 | 0.015 | –0.111 | –0.040 | 0.165 | 1 | |||||||
| 18. Left BA31 | 0.207 | 0.012 | 0.196 | 0.168 | –0.017 | 0.019 | 0.123 | 0.155 | –0.194 | –0.294* | 0.012 | –0.067 | –0.035 | 0.253* | –0.165 | –0.078 | 0.136 | 1 | ||||||
| 19. Left BA7 | 0.241* | –0.055 | 0.115 | 0.108 | –0.010 | 0.025 | –0.032 | –0.027 | –0.092 | –0.227 | 0.126 | –0.229 | –0.123 | 0.162 | 0.024 | –0.037 | –0.012 | 0.516** | 1 | |||||
| 20. Right BA19 | 0.180 | –0.015 | 0.051 | 0.118 | 0.125 | –0.002 | –0.099 | –0.030 | –0.065 | –0.133 | –0.049 | –0.081 | –0.035 | 0.182 | 0.024 | 0.091 | 0.123 | 0.355** | 0.449** | 1 | ||||
| 21. Right BA6 | –0.014 | 0.022 | 0.054 | 0.077 | 0.020 | 0.170 | 0.079 | –0.044 | 0.000 | –0.062 | 0.156 | –0.104 | –0.153 | 0.064 | 0.104 | 0.030 | –0.129 | 0.277* | 0.439** | 0.264* | 1 | |||
| 22. Right BA8 | 0.102 | –0.123 | –0.088 | 0.135 | –0.030 | 0.042 | –0.012 | 0.000 | –0.112 | –0.079 | –0.035 | 0.040 | –0.062 | 0.115 | 0.000 | 0.030 | –0.079 | 0.368** | 0.455** | 0.375** | 0.620** | 1 | ||
| 23. Left BA6 | –0.007 | 0.018 | 0.068 | 0.141 | 0.047 | 0.184 | 0.096 | –0.054 | 0.044 | –0.139 | 0.180 | –0.162 | –0.130 | 0.145 | 0.108 | –0.047 | –0.200 | 0.287* | 0.462** | 0.220 | 0.782** | 0.576** | 1 | |
| 24. Left BA8 | 0.146 | –0.129 | –0.054 | 0.081 | –0.003 | 0.045 | 0.042 | 0.034 | 0.003 | –0.227 | –0.035 | –0.074 | –0.049 | 0.202 | –0.020 | –0.047 | –0.173 | 0.308** | 0.503** | 0.274* | 0.580** | 0.644** | 0.664** | 1 |
*p<0.05; ** p < 0.01. MMSE, Mini-Mental State Examination; t-tau, total tau; p-tau, phosphorylated tau; Aβ42, amyloid-beta 42; TIB, time in bed; TST, total sleep time; SE, sleep efficiency; SOL, sleep onset latency; LREM, REM sleep latency; N1, Non-REM stage 1; N2, Non-REM stage 2; N3, Non-REM stage 3; REM, Rapid Eye Movement; WASO, wake after sleep onset; BA, Brain Broadman areas.
DISCUSSION
The progressive dysregulation of sleep and the sleep-wake cycle has been shown in the AD continuum [2, 10]. In the present study, as expected, sleep fragmentation was more evident in patients with dementia than in those with MCI due to AD. In particular, SE was lower in AD patients than in MCI subjects, which suggests a progressive sleep dysregulation occurring in parallel with the progression of AD pathology. However, the association between sleep impairment and the biomarkers of neurodegeneration in this continuum is not yet completely elucidated. Hence, this study aimed to shed light on this aspect in order to investigate sleep dysregulation in AD pathology and its association with CSF and 18F-FDG PET biomarkers of neurodegeneration and neuronal injury. In the current study, the correlations between brain 18F-FDG uptake and PSG data showed that sleep impairment was associated with the biomarkers of neurodegeneration in a sample of both MCI and AD patients. Consistently, sleep macrostructure is altered from the early stages of AD, with evidence of less continuous sleep, slow-wave sleep impairment, REM sleep reduction in AD patients. Moreover, these sleep alterations may also occur before the onset of cognitive impairment and increase the risk for dementia [2, 10, 35, 36]. It is conceivable that sleep dysregulation is linked to the neuropathology of AD from the early stage of the disease, and this supposition is in line with the recent literature documenting the interplay between sleep impairment and the biomarkers of AD pathology. Moreover, a possible direct effect of sleep fragmentation and dysregulation on AD biomarkers has been hypothesised, even before the MCI stage [2]. In agreement with this evidence, the present study confirmed the association between sleep impairment, namely REM sleep dysregulation and symptoms of insomnia (prolonged SOL), and AD neurodegeneration. Moreover, cognitive decline was associated with both sleep fragmentation and cerebral glucose metabolism impairment. Specifically, 18F-FDG uptake in inferior parietal lobe correlated with cognitive impairment, while 18F-FDG uptake in the hippocampus and the CSF levels of Aβ42 were both associated with longer SOL and higher wake bouts index, respectively. These symptoms of sleep impairment and fragmentation are frequently documented in patients with MCI and AD [2, 10]. Moreover, REM sleep dysregulation, featured by longer REML and reduced amount of REM sleep, also correlated to the impaired 18F-FDG uptake in posterior cingulate cortex. This data, therefore, extends the findings of previous studies by highlighting the significant REM sleep alteration and its correlation with brain functioning in MCI and AD patients, as well as reinforcing the clinical potential of targeting REM sleep as part of a therapeutic strategy in AD for enhancing cerebral function [10, 37]. Furthermore, CSF AD biomarkers and orexin correlated with sleep dysregulation, confirming the previously shown evidence achieved separately in MCI and AD subjects [7, 10, 21, 38].
Overall, the findings of the present study allow to substantiate the hypothesis of sleep modulation on the AD biomarkers. In agreement with our results, animal model studies documented that sleep may exert a modulating effect on CSF dynamics, thus influencing CSF biomarkers, and also modifying CSF orexin levels and orexin system functioning [39–41]. In humans, sleep impairment and sleep deprivation, even when partial, can increase the CSF orexin levels. The results of the present study merged with these previous reports increase the knowledge about the interplay between CSF orexin levels and sleep in AD [7, 38, 42, 43]. Furthermore, in the present study, and as hypothesised, patients with AD showed a worse sleep quality than patients with MCI due to AD, showing higher sleep fragmentation and poorer sleep hygiene. These findings are in line with the few previous studies that highlighted how sleep deteriorates in AD staging, suggesting a more disrupted nocturnal sleep as the disease progresses [6, 7]. Nonetheless, the assessment of sleep impairment measured by PSG in relation to the disease staging is still scarce and needs to be better studied, specially taking into consideration the PSG markers of sleep fragmentation and loss of sleep stability and continuity. This study, besides supporting previous findings on sleep impairment in AD, broadens previous knowledge by highlighting the recognition of sleep impairment, and in particular, REM sleep dysregulation, in patients with AD pathology, either in the MCI or dementia stage of the disease, since it significantly correlates with biomarkers of the ongoing neurodegeneration. These findings reinforce the importance of targeting sleep as a potential marker, and not only as a symptom since sleep impairment can accelerate the progression of AD pathology, burden AD patients and caregivers, and influence the neurodegenerative mechanisms [44–46]. Accordingly, sleep can impair cognitive and behavioral symptoms from the preclinical and early stages of AD, and therefore, sleep assessments should be considered in the diagnostic work-up of patients with MCI or AD. It is important to note that sleep impairment can also aggravate the prognosis of the AD neurodegenerative process, as well as impair the patient and caregiver’s well-being since represents a disabling neuropsychiatric symptom with multiple consequences. Moreover, considering the association of sleep impairment with AD biomarkers, it is conceivable that sleep improvement, as a therapeutic target in the management of MCI and AD patients, may positively interfere and, thus, counteract the cascade of events fueling the AD progressive neurodegenerative process.
The present study presents some limitations that need to be acknowledged. The sample of patients is small since it was achieved in a single Neurology Unit. Despite the high-specialised investigations performed in our study, a multicentre study to increase the number of patients should be planned in the future. Although hypothesised, the cross-sectional nature of this study and the small sample size of MCI patients did not allow a demonstration of the impact of sleep dysregulation on the AD continuum and how AD may determine changes in sleep patterns. Longitudinal studies with a larger cohort of patients are needed and future correlation analysis should consider separately MCI and AD patients. Even though high-resolution MRI images can provide better anatomical information than functional PET images, in the present study it was not possible to use MRI-based partial-volume correction due to the retrospective design of our study. Nonetheless, in order to partially mitigate the issues related to the partial volume effect, a smoothing procedure, coupled with the spatial normalisation process, was applied [20, 47]. Specifically, the smoothing procedure allows the suppression and noise due to residual differences in functional and gyral anatomy during inter-subject averaging [48]. To the best of our knowledge, few tools are available in order to mitigate the partial volume effect in brain PET imaging. Indeed, one of the latest tools developed for SPM aimed to improve local regional detection of radiopharmaceutical uptake in corrected images as compared to non-corrected images [49]. Nevertheless, the toolbox was developed specifically for amyloid imaging and does not apply to our case studies thus, future analyses on this topic should include MRI-based partial-volume correction.
Although the control group helped in the identification of BA significantly affected in MCI and AD patients, only three BAs (31, 7, and 19) were considered significant for the correlation analysis. These regions, corresponding to cingulate gyrus and praecuneus, which represent limited structures of the brain that do not play a major role in the AD process. Nevertheless, 18F-FDG PET analysis detected a wide cluster of reduced glucose metabolism in MCI and AD patients compared to the controls, involving parietal and temporal lobes that are known to be substantially affected by AD. These findings may be partially explained by the inclusion of MCI patients in the analysis, who usually show a lower degree of neurodegeneration. Finally, the lack of a PSG evaluation and a CSF assessment in the control group is also one of the limitations of the present study.
In conclusion, the present study reinforces the critical role of sleep not only in the AD neuropathological processes but also at the different clinical stages of the disease by documenting an association between sleep dysregulation and different AD biomarkers. These findings invite further longitudinal studies to monitor sleep during the AD continuum in order to set trials targeting sleep improvement as a potential therapeutic approach to antagonise the neurodegenerative processes in MCI and AD patients, also considering the association between CSF orexin levels and sleep dysregulation in AD.
ACKNOWLEDGMENTS
The authors have no acknowledgements to report.
FUNDING
The authors have no funding to report.
CONFLICT OF INTEREST
The authors report no conflict of interest.
DATA AVAILABILITY
The data that support the findings of this study are available from the corresponding author upon reasonable request.
SUPPLEMENTARY MATERIAL
[1] The supplementary material is available in the electronic version of this article: https://dx.doi.org/10.3233/ADR-220111.
REFERENCES
[1] | Moran M , Lynch CA , Walsh C , Coen R , Coakley D , Lawlor BA ((2005) ) Sleep disturbance in mild to moderate Alzheimer’s disease. Sleep Med 6: , 347–352. |
[2] | Peter-Derex L , Yammine P , Bastuji H , Croisile B ((2015) ) Sleep and Alzheimer’s disease. Sleep Med Rev 19: , 29–38. |
[3] | Carpenter BD , Strauss M , Patterson MB ((1996) ) Sleep disturbances in community-dwelling patients with Alzheimer’s disease. Clin Gerontol 16: , 35–49. |
[4] | Guarnieri B , Adorni F , Musicco M , Appollonio I , Bonanni E , Caffarra P , Caltagirone C , Cerroni G , Concari L , Cosentino FII , Ferrara S , Fermi S , Ferri R , Gelosa G , Lombardi G , Mazzei D , Mearelli S , Morrone E , Murri L , Nobili FM , Passero S , Perri R , Rocchi R , Sucapane P , Tognoni G , Zabberoni S , Sorbi S ((2012) ) Prevalence of sleep disturbances in mild cognitive impairment and dementing disorders: A multicenter Italian clinical cross-sectional study on 431 patients. Dement Geriatr Cogn Disord 33: , 50–58. |
[5] | Ju Y-ES , McLeland JS , Toedebusch CD , Xiong C , Fagan AM , Duntley SP , Morris JC , Holtzman DM ((2013) ) Sleep quality and preclinical Alzheimer disease. JAMA Neurol 70: , 587–593. |
[6] | Maestri M , Carnicelli L , Tognoni G , Di Coscio E , Giorgi FS , Volpi L , Economou N-T , Ktonas P , Ferri R , Bonuccelli U ((2015) ) Non-rapid eye movement sleep instability in mild cognitive impairment: A pilot study. Sleep Med 16: , 1139–1145. |
[7] | Liguori C , Romigi A , Nuccetelli M , Zannino S , Sancesario G , Martorana A , Albanese M , Mercuri NB , Izzi F , Bernardini S , Nitti A , Sancesario GM , Sica F , Marciani MG , Placidi F ((2014) ) Orexinergic system dysregulation, sleep impairment, and cognitive decline in Alzheimer disease. JAMA Neurol 71: , 1498–1505. |
[8] | Liguori C , Spanetta M , Izzi F , Franchini F , Nuccetelli M , Sancesario GM , Di Santo S , Bernardini S , Mercuri NB , Placidi F ((2020) ) Sleep-wake cycle in Alzheimer’s disease is associated with tau pathology and orexin dysregulation. J Alzheimers Dis 74: , 501–508. |
[9] | McCurry SM , Ancoli-Israel S ((2003) ) Sleep dysfunction in Alzheimer’s disease and other dementias. Curr Treat Options Neurol 5: , 261–272. |
[10] | Liguori C , Placidi F , Izzi F , Spanetta M , Mercuri NB , Di Pucchio A ((2020) ) Sleep dysregulation, memory impairment, and CSF biomarkers during different levels of neurocognitive functioning in Alzheimer’s disease course. Alzheimers Res Ther 12: , 5. |
[11] | Sperling RA , LaViolette PS , O’Keefe K , O’Brien J , Rentz DM , Pihlajamaki M , Marshall G , Hyman BT , Selkoe DJ , Hedden T ((2009) ) Amyloid deposition is associated with impaired default network function in older persons without dementia. Neuron 63: , 178–188. |
[12] | Bliwise DL , Hughes M , McMahon PM , Kutner N ((1995) ) Observed sleep/wakefulness and severity of dementia in an Alzheimer’s disease special care unit. J Gerontol A Biol Sci Med Sci 50: , M303–M306. |
[13] | Rauchs G , Schabus M , Parapatics S , Bertran F , Clochon P , Hot P , Denise P , Desgranges B , Eustache F , Gruber G , Anderer P ((2008) ) Is there a link between sleep changes and memory in Alzheimer’s disease? Neuroreport 19: , 1159–1162. |
[14] | Rauchs G , Piolino P , Bertran F , de La Sayette V , Viader F , Eustache F , Desgranges B ((2013) ) Retrieval of recent autobiographical memories is associated with slow-wave sleep in early AD. Front Behav Neurosci 7: , 114. |
[15] | Sprecher KE , Bendlin BB , Racine AM , Okonkwo OC , Christian BT , Koscik RL , Sager MA , Asthana S , Johnson SC , Benca RM ((2015) ) Amyloid burden is associated with self-reported sleep in nondemented late middle-aged adults. Neurobiol Aging 36: , 2568–2576. |
[16] | Spira AP , Gamaldo AA , An Y , Wu MN , Simonsick EM , Bilgel M , Zhou Y , Wong DF , Ferrucci L , Resnick SM ((2013) ) Self-reported sleep and β-amyloid deposition in community-dwelling older adults. JAMA Neurol 70: , 1537–1543. |
[17] | Branger P , Arenaza-Urquijo EM , Tomadesso C , Mézenge F , André C , de Flores R , Mutlu J , de La Sayette V , Eustache F , Chételat G , Rauchs G ((2016) ) Relationships between sleep quality and brain volume, metabolism, and amyloid deposition in late adulthood. Neurobiol Aging 41: , 107–114. |
[18] | Lucey BP , Hicks TJ , McLeland JS , Toedebusch CD , Boyd J , Elbert DL , Patterson BW , Baty J , Morris JC , Ovod V , Mawuenyega KG , Bateman RJ ((2018) ) Effect of sleep on overnight cerebrospinal fluid amyloid β kinetics. Ann Neurol 83: , 197–204. |
[19] | Kang J-E , Lim MM , Bateman RJ , Lee JJ , Smyth LP , Cirrito JR , Fujiki N , Nishino S , Holtzman DM ((2009) ) Amyloid-β dynamics are regulated by orexin and the sleep-wake cycle. Science 326: , 1005–1007. |
[20] | Liguori C , Chiaravalloti A , Sancesario G , Stefani A , Sancesario GM , Mercuri NB , Schillaci O , Pierantozzi M ((2016) ) Cerebrospinal fluid lactate levels and brain [18F]FDG PET hypometabolism within the default mode network in Alzheimer’s disease. Eur J Nucl Med Mol Imaging 43: , 2040–2049. |
[21] | Liguori C , Nuccetelli M , Izzi F , Sancesario G , Romigi A , Martorana A , Amoroso C , Bernardini S , Marciani MG , Mercuri NB , Placidi F ((2016) ) Rapid eye movement sleep disruption and sleep fragmentation are associated with increased orexin-A cerebrospinal-fluid levels in mild cognitive impairment due to Alzheimer’s disease. Neurobiol Aging 40: , 120–126. |
[22] | McKhann GM , Knopman DS , Chertkow H , Hyman BT , Jack CR , Kawas CH , Klunk WE , Koroshetz WJ , Manly JJ , Mayeux R , Mohs RC , Morris JC , Rossor MN , Scheltens P , Carrillo MC , Thies B , Weintraub S , Phelps CH ((2011) ) The diagnosis of dementia due to Alzheimer’s disease: Recommendations from the National Institute on Aging-Alzheimer’s Association workgroups on diagnostic guidelines for Alzheimer’s disease. Alzheimers Dement 7: , 263–269. |
[23] | Albert MS , DeKosky ST , Dickson D , Dubois B , Feldman HH , Fox NC , Gamst A , Holtzman DM , Jagust WJ , Petersen RC , Snyder PJ , Carrillo MC , Thies B , Phelps CH ((2011) ) The diagnosis of mild cognitiveimpairment due to Alzheimer’s disease: Recommendations from theNational Institute on Aging-Alzheimer’s Association workgroups ondiagnostic guidelines for Alzheimer’s disease. AlzheimersDement 7: , 270–279. |
[24] | Liguori C , Stefani A , Sancesario G , Sancesario GM , Marciani MG , Pierantozzi M ((2015) ) CSF lactate levels, τ proteins, cognitive decline: A dynamic relationship in Alzheimer’s disease. J Neurol Neurosurg Psychiatry 86: , 655–659. |
[25] | Mulder C , Verwey NA , Van Der Flier WM , Bouwman FH , Kok A , Van Elk EJ , Scheltens P , Blankenstein MA ((2010) ) Amyloid-β(1-42), total tau, and phosphorylated tau as cerebrospinal fluid biomarkers for the diagnosis of Alzheimer disease. Clin Chem 56: , 248–253. |
[26] | Duits FH , Teunissen CE , Bouwman FH , Visser PJ , Mattsson N , Zetterberg H , Blennow K , Hansson O , Minthon L , Andreasen N , Marcusson J , Wallin A , Rikkert MO , Tsolaki M , Parnetti L , Herukka SK , Hampel H , De Leon MJ , Schröder J , Aarsland D , Blankenstein MA , Scheltens P , Van Der Flier WM ((2014) ) The cerebrospinal fluid “Alzheimer profile”: Easily said, but what does it mean? Alzheimers Dement 10: , 713–723.e2. |
[27] | Ripley B , Overeem S , Fujiki N , Nevsimalova S , Uchino M , Yesavage J , Di Monte D , Dohi K , Melberg A , Lammers GJ , Nishida Y , Roelandse FWC , Hungs M , Mignot E , Nishino S ((2001) ) CSF hypocretin/orexin levels in narcolepsy and other neurological conditions. Neurology 57: , 2253–2258. |
[28] | Lancaster JL , Rainey LH , Summerlin JL , Freitas CS , Fox PT , Evans AC , Toga AW , Mazziotta JC ((1997) ) Automated labeling of the human brain: A preliminary report on the development and evaluation of a forward-transform method. Hum Brain Mapp 5: , 238–242. |
[29] | IBM (2020) SPSS – Statistical Package for Social Sciences. |
[30] | Mazziotta JC , Toga AW , Evans A , Fox P , Lancaster J ((1995) ) A probabilistic atlas of the human brain: Theory and rationale for its development. The International Consortium for Brain Mapping (ICBM). Neuroimage 2: , 89–101. |
[31] | Mazziotta J , Toga A , Evans A , Fox P , Lancaster J , Zilles K , Woods R , Paus T , Simpson G , Pike B , Holmes C , Collins L , Thompson P , MacDonald D , Iacoboni M , Schormann T , Amunts K , Palomero-Gallagher N , Geyer S , Parsons L , Narr K , Kabani N , Le Goualher G , Feidler J , Smith K , Boomsma D , Pol HH , Cannon T , Kawashima R , Mazoyer B ((2001) ) A four-dimensional probabilistic atlas of the human brain. J Am Med Informatics Assoc 8: , 401–430. |
[32] | D’Agostino E , Maes F , Vandermeulen D , Suetens P ((2007) ) Atlas-to-image non-rigid registration by minimization of conditional local entropy. Inf Process Med Imaging 20: , 320–332. |
[33] | Bennett CM , Wolford GL , Miller MB ((2009) ) The principled control of false positives in neuroimaging. Soc Cogn Affect Neurosci 4: , 417–422. |
[34] | Pagani M , De Carli F , Morbelli S , Öberg J , Chincarini A , Frisoni GB , Galluzzi S , Perneczky R , Drzezga A , Van Berckel BNM ((2015) ) Volume of interest-based [18F] fluorodeoxyglucose PET discriminatesMCI converting to Alzheimer’s disease from healthy controls. AEuropean Alzheimer’s Disease Consortium (EADC) study. Neuroimage Clin 7: , 34–42. |
[35] | Petit D , Gagnon J-F , Fantini ML , Ferini-Strambi L , Montplaisir J ((2004) ) Sleep and quantitative EEG in neurodegenerative disorders. J Psychosom Res 56: , 487–496. |
[36] | D’Rozario AL , Chapman JL , Phillips CL , Palmer JR , Hoyos CM , Mowszowski L , Duffy SL , Marshall NS , Benca R , Mander B , Grunstein RR , Naismith SL ((2020) ) Objective measurement of sleep in mild cognitive impairment: A systematic review and meta-analysis. Sleep Med Rev 52: , 101308. |
[37] | Pase MP , Himali JJ , Grima NA , Beiser AS , Satizabal CL , Aparicio HJ , Thomas RJ , Gottlieb DJ , Auerbach SH , Seshadri S ((2017) ) Sleep architecture and the risk of incident dementia in the community. Neurology 89: , 1244–1250. |
[38] | Gabelle A , Jaussent I , Hirtz C , Vialaret J , Navucet S , Grasselli C , Robert P , Lehmann S , Dauvilliers Y ((2017) ) Cerebrospinal fluid levels of orexin-A and histamine, and sleep profile within the Alzheimer process. Neurobiol Aging 53: , 59–66. |
[39] | Roh JH , Jiang H , Finn MB , Stewart FR , Mahan TE , Cirrito JR , Heda A , Snider BJ , Li M , Yanagisawa M ((2014) ) Potential role of orexin and sleep modulation in the pathogenesis of Alzheimer’s disease. J Exp Med 211: , 2487–2496. |
[40] | Pedrazzoli M , D’Almeida V , Martins PJF , Machado RB , Ling L , Nishino S , Tufik S , Mignot E ((2004) ) Increased hypocretin-1 levels in cerebrospinal fluid after REM sleep deprivation. Brain Res 995: , 1–6. |
[41] | Xie L , Kang H , Xu Q , Chen MJ , Liao Y , Thiyagarajan M , O’Donnell J , Christensen DJ , Nicholson C , Iliff JJ , Takano T , Deane R , Nedergaard M ((2013) ) Sleep drives metabolite clearance from the adult brain. Science 342: , 373–377. |
[42] | Liguori C , Mercuri NB , Nuccetelli M , Izzi F , Bernardini S , Placidi F ((2018) ) Cerebrospinal fluid orexin levels and nocturnal sleep disruption in Alzheimer’s disease patients showing neuropsychiatric symptoms. J Alzheimers Dis 66: , 993–999. |
[43] | Olsson M , Ärlig J , Hedner J , Blennow K , Zetterberg H ((2018) ) Sleep deprivation and cerebrospinal fluid biomarkers for Alzheimer’sdisease. Sleep 41: , zsy025. |
[44] | Mander BA , Winer JR , Jagust WJ , Walker MP ((2016) ) Sleep: A novel mechanistic pathway, biomarker, and treatment target in the pathology of Alzheimer’s disease? Trends Neurosci 39: , 552–566. |
[45] | Irwin MR , Vitiello MV ((2019) ) Implications of sleep disturbance and inflammation for Alzheimer’s disease dementia. Lancet Neurol 18: , 296–306. |
[46] | Spira AP , Gottesman RF ((2017) ) Sleep disturbance: An emerging opportunity for Alzheimer’s disease prevention? Int Psychogeriatr 29: , 529–531. |
[47] | Della Rosa PA , Cerami C , Gallivanone F , Prestia A , Caroli A , Castiglioni I , Gilardi MC , Frisoni G , Friston K , Ashburner J , Perani D , EADC-PET Consortium ((2014) ) A standardized [18F]-FDG-PET template for spatial normalization in statistical parametric mapping of dementia. Neuroinformatics 12: , 575–593. |
[48] | Fernandes M , Mari L , Chiaravalloti A , Paoli B , Nuccetelli M , Izzi F , Giambrone MP , Camedda R , Bernardini S , Schillaci O , Mercuri NB , Placidi F , Liguori C ((2022) ) 18F-FDG PET, cognitive functioning, and CSF biomarkers in patients with obstructive sleep apnoea before and after continuous positive airway pressure treatment. J Neurol 269: , 5356–5367. |
[49] | Gonzalez-Escamilla G , Lange C , Teipel S , Buchert R , Grothe MJ ((2017) ) PETPVE12: An SPM toolbox for partial volume effects correction in brain PET –Application to amyloid imaging with AV45-PET. Neuroimage 1147: , 669–677. |


