
Dementia Risk Models in an Australian First Nations Population: Cross-Sectional Associations and Preparation for Follow-Up
Abstract
Background:
Reducing the burden of dementia in First Nations populations may be addressed through developing population specific methods to quantify future risk of dementia.
Objective:
To adapt existing dementia risk models to cross-sectional dementia prevalence data from a First Nations population in the Torres Strait region of Australia in preparation for follow-up of participants. To explore the diagnostic utility of these dementia risk models at detecting dementia.
Methods:
A literature review to identify existing externally validated dementia risk models. Adapting these models to cross-sectional data and assessing their diagnostic utility through area under the receiver operating characteristic curve (AUROC) analyses and calibration using Hosmer-Lemeshow Chi2.
Results:
Seven risk models could be adapted to the study data. The Aging, Cognition and Dementia (AgeCoDe) study, the Framingham Heart Study (FHS), and the Brief Dementia Screening Indicator (BDSI) had moderate diagnostic utility in identifying dementia (i.e., AUROC >0.70) before and after points for older age were removed.
Conclusion:
Seven existing dementia risk models could be adapted to this First Nations population, and three had some cross-sectional diagnostic utility. These models were designed to predict dementia incidence, so their applicability to identify prevalent cases would be limited. The risk scores derived in this study may have prognostic utility as participants are followed up over time. In the interim, this study highlights considerations when transporting and developing dementia risk models for First Nations populations.
INTRODUCTION
Dementia is a term for a group of diseases that progressively affect thinking, memory, and behavior to significantly reduce an individual’s independence in daily life. The global burden of dementia increased from 20.2 to 43.8 million between 1990 and 2016 [1] and is projected to increase to 152 million by 2050 [2]. The pathology of dementia commences decades before clinical symptoms become apparent [3]. Early intervention in the disease course is essential for reducing the burden of this condition.
Dementia is an emerging public health issue for First Nations populations globally, and likely due to the levels of modifiable risk factors in these populations [4–6]. In Australia, dementia is 3–5 times higher among the Aboriginal and Torres Strait Islander peoples, who are respectfully referred to hereon as the First Nations peoples of Australia [7–10]. This difference reflects the enduring impact of colonization, the corrosion of traditional lifestyles, and systematic social disadvantage. A cross-sectional dementia prevalence survey (2015–2018) identified dementia as a public health issue in a culturally and ethnically distinct First Nations population living in the Torres Strait region of Cape York, Australia [7]. A follow-up of participants from the Torres Strait dementia survey will commence in 2024 to determine risk and protective factors for incident dementia. The impact of dementia risk factors is cumulative, and individuals with more risk factors are more likely to develop dementia [11]. However, the accuracy with which certain combinations of risk factors predict dementia varies across populations [12, 13]. There is currently no established method to quantify the future risk of dementia that is specific to an Australian First Nations population.
Prognostic disease risk models calculate the likelihood of an individual developing a disease within a given time frame based on a combination of risk and protective factors [14]. These models convert statistical representations of risk into cumulative scores, which provide an intuitive metric to communicate the likelihood of disease back to the individual. Numerous dementia risk models have been developed to assist users with decisions such as whether to intervene directly, refer for further assessment, or not intervene and instead provide reassurance [15, 16]. The accuracy of models is often assessed with sensitivity and specificity, and area under the receiver operating characteristic curve (AUROC) analyses. Accurate models tend to use a variety of information sources and risk factors [15, 17], and have AUROC values ≥0.80 and sensitivity and specificity ≥80% [15]. Factors commonly included in risk models are sociodemographic (e.g., age, sex, and education), cognitive assessment results [15], health indicators, and behaviors [17]. It is unclear how much sensitive measures, such as brain imaging [17, 18] and genetic markers [17–19] improve the accuracy of dementia risk models, and given these methods are invasive and time consuming, their cost-to-benefit ratio needs to be considered [15, 17]. The overall utility of dementia risk models remains unclear. Reviews suggest that most existing models are inaccurate [15] or at least ‘acceptable’ [16, 18] at discriminating which at-risk individuals will develop dementia. Although this level of accuracy may be appropriate for health education, it may be unsuitable for potentially harmful interventions [19].
Dementia risk models are also limited by their lack of ‘transportability’ across populations. Researchers often develop dementia risk models on single homogenous cohorts, and external validation on other populations is relatively uncommon [16, 20, 21]. Despite calls from authors to validate models in high-risk populations that are racially and culturally diverse [12, 18, 20, 22], and non-white [19], there is a lack of external validation in these groups. As of 2022, only one model had been developed for an ethnically diverse population [23], and four existing models were validated in samples of ethnically diverse populations [12, 24]. Therefore, the transportability of these models remains a gap in contemporary literature.
Although risk models are designed to predict the likelihood of future dementia longitudinally, previous research has examined their utility using cross-sectional data [12, 25–29]. While this testing of longitudinal models on cross-sectional data has limitations [12, 26, 30], the practice allows researchers to comment on the potential applicability of models for longitudinal use in future studies, as has been done in some ethnically diverse populations [12].
This study aimed to examine whether existing dementia risk models, developed and validated in populations outside of Australia, could be adapted to cross-sectional dementia prevalence data from a First Nations population, in preparation for follow-up of these participants [7, 31]. The study also aimed to compare the diagnostic utility of these models in identifying dementia. As risk models are designed to predict dementia longitudinally, we expected they would have lower diagnostic utility. However, the process would allow commentary on the potential utility of these models in predicting futuredementia.
MATERIALS AND METHODS
Setting and participants
The data for this research were collected as part of a cross-sectional dementia prevalence study conducted in the Torres Strait and Northern Peninsula Area of Cape York in Australia between May 2015 and February 2018. Ethics approval for this study was provided by Queensland Health (HREC/13/QCH/129-878) and James Cook University (H5495) Human Research Ethics Committees. There were 274 First Nations Australian residents aged 45 years and over, who were recruited through convenience sampling and the local health service. The detailed methodology of this study has been reported elsewhere [31–33] and is summarized briefly below.
Procedure
Participants were administered the Kimberley Indigenous Cognitive Assessment tool (KICA), which collects demographic and clinical information, functional status, and informant reports. The cognitive assessment component, the KICA-Cog, assesses orientation, recognition, naming, registration, verbal comprehension, verbal fluency (measured through the number of animals listed in one minute), recall, and praxis. This tool is the only validated cognitive screening tool for identifying dementia in Australian First Nations populations [7, 31]. The KICA-Cog has a score range of 0–39.
All participants also underwent a comprehensive dementia assessment with a Geriatrician experienced in cross-cultural assessment. The Geriatricians conducted a standard diagnostic medical examination, which covered physical, cognitive, and psychosocial factors and used standardized screening tools, including the Mini-Mental Status Examination (MMSE), category fluency (animals), and collateral history, as part of a global clinical assessment of cognition.
Study variables
The primary dependent variable from the Torres Strait Dementia Prevalence Survey was a diagnosis of cognitively normal, cognitive impairment not dementia (CIND) or dementia. This variable represented a consensus diagnosis made by a panel of Geriatricians and an Older Person’s Psychiatrist, who blind-reviewed results from the comprehensive geriatric assessments. The diagnoses were based on criteria from the Diagnostic and Statistical Manual for Mental Disorders, 4th Edition (DSMIV-TR) [34].
The predictor variables were obtained from participant responses to the KICA and clinical notes made by the Geriatricians during the comprehensive assessments. These variables comprised demographic information (age, gender, marital status) and lifestyle factors (alcohol consumption, smoking). Education was measured using two methods. The first method was the highest education of any form, including formal schooling or post-school qualifications, such as tertiary education or technical college apprenticeship training. The second method was the highest formal school-based education only. Self-reported medical history was obtained from KICA responses and included mobility, previous head injury with loss of consciousness, pain, urinary incontinence, assistance required with instrumental activities of daily living (iADLS), and reports from informants (carer/family member) of participants. An informant reported memory problem was defined as a carer or family member answering “sometimes” or “all the time” to any question regarding whether the person was forgetting “a lot of things”, the names of family, recent events, place, repeating information, week, getting lost, or saying culturally inappropriate things. Subscales in the KICA assessed falls (Elderly Falls Screening Test) [35], continence (International Consultation on Incontinence Questionnaire) [36], and depression (adapted Patient Health Questionnaire-9) [37]. Medical history from the Geriatrician assessments included hearing impairment and vascular risk factors (diabetes, chronic kidney disease (CKD), heart disease, stroke, hypertension).
Literature review and selection of existing models
The literature was reviewed to identify dementia risk models that could be ‘mapped’ to the Torres Strait dementia prevalence survey data. This literature review was conducted in three stages. The first stage examined the most recent systematic literature reviews to identify potential models. These reviews were by Hou et al. in 2019 [16] and Vonk et al. [18], which systematically reviewed the literature from 1995 to 01/04/2020. In the second stage, these reviews were extended by searching PubMed between 01/04/2020 and 01/10/2021 using the search string that was published by Vonk et al. and included terms that were used by Hou et al. The search string was: (model OR models) AND (risk) AND (dementia OR Alzheimer) AND (predict* AND (develop* OR create*)) AND (ROC OR (c statistic) OR (c-statistic) OR AUC OR (area under the curve)). The search aimed to identify existing dementia risk models that had not already been reported by Hou et al. and Vonk et al.
In the third literature review stage, all the dementia risk models from Hou et al., Vonk et al., and the additional PubMed search were reviewed according to inclusion-exclusion criteria. The inclusion criteria were models that had been validated in an external cohort (i.e., outside the development cohort). Models were excluded if they were developed in a study that did not use clinical diagnosis or cognitive assessment to identify dementia. Models specific to a clinical subgroup (e.g., diabetes) were excluded to improve generalizability and accessibility of findings, as were models based on genetic risk, neuroimaging, or uniquely cognitive assessment. Population-level studies were also excluded, as were models designed to predict an outcome other than dementia (e.g., diabetes risk) or in languages other than English.
The literature review methodology is presented in Supplementary Figure 1. The systematic reviews by Hou et al. [16] and Vonk et al. [18] each had 11 primary studies of externally validated models. After applying the exclusion criteria, there were five studies from each review, and these studies evaluated four and five models, respectively. The PubMed search identified 91 studies, and after applying the inclusion and exclusion criteria, two studies evaluated eight models. A search of reference lists identified a further two studies and five models. The study by Vonk et al. [18] also evaluated five models, so this article and its models were included. When the studies from all sources were combined, 14 studies (4, 6, 12, 14, 18, 19, 22, 24, 30, 33, 49–51) contained information on 11 unique and externally validated dementia risk models that met the inclusion criteria. The scoring criteria of these 11 models were reviewed, and seven models used variables captured in the Torres Strait dementia prevalence survey data. As a result, these seven models could be ‘mapped’ to the dementia prevalence survey data. These seven models were the Study on Aging, Cognition and Dementia (AgeCoDe) [38], the Australian National University Alzheimer’s Disease Risk Index (ANU-ADRI) [39], the Brief Dementia Screening Indicator (BDSI) [40], the Canadian Study of Health and Aging (CSHAI) [41], the Framingham Heart Study (FHS) [42], the Mexican American Dementia Nomogram (MADeN) [23] and the Washington Heights-Inwood Columbia Aging Project (WHIACP) [43].
Mapping of seven existing risk models to dementia prevalence data
Table 1 displays study variables and their association with a dementia diagnosis. Supplementary Table 1 provides an overview of the seven risk models, including their age cut-offs, score ranges, and level of discrimination for dementia in the original studies. Scores for the seven existing risk indices were created by summing the points for each participant according to the risk model formulas (Supplementary Table 2). For the AgeCoDe, for example, participants were assigned 3 points if aged ≥80 years, 4 points for low verbal fluency, 2 to 4 points for low delayed recall, 2 points for requiring assistance with iADLs, and 4 points for an MMSE score <27. Only full-case data were used, so most models were applied to a subset of study participants. The ANU-ADRI had the lowest number of participants with complete data (n = 224) and the CSHAI had the highest (n = 274). Higher scores on the risk models indicated higher dementia risk.
Table 1
Demographic, behavioral, medical, and cognitive assessment information for 274 First Nations residents aged 45 years and over, by dementia status, age adjusted logistic regression analyses showing odds ratios (OR) (2015–2018)
| No Dementia | Dementia | Age adjusted | |||||
| n | (% ) | n | (% ) | OR | (95% CI) | p | |
| Total | 235 | (100.0) | 39 | (100.0) | |||
| Age categorized | |||||||
| 45–64 | 133 | (56.6) | 5 | (12.8) | |||
| 65–74 | 62 | (26.4) | 15 | (38.5) | |||
| 75–94 | 40 | (17.0) | 19 | (48.7) | |||
| Sex | |||||||
| Male (Female ref) | 80 | (34.0) | 14 | (35.9) | 1.11 | (0.51, 2.43) | 0.786 |
| Highest education | |||||||
| Primary school only (Ref) | 69 | (30.7) | 13 | (48.1) | |||
| Any high school | 64 | (28.4) | 10 | (37.0) | 1.60 | (0.60, 4.30) | 0.350 |
| Any post school | 92 | (40.9) | 4 | (14.8) | 0.48 | (0.14, 1.68) | 0.252 |
| Marital status (Ref single) | |||||||
| Married/De-facto | 110 | (48.7) | 10 | (27.8) | 0.56 | (0.18, 1.77) | 0.323 |
| Previously married | 82 | (36.3) | 19 | (52.8) | 0.70 | (0.24, 2.07) | 0.525 |
| Self-reported behaviors | |||||||
| Current drinks alcohol | 66 | (28.8) | 2 | (5.6) | 0.24 | (0.05, 1.08) | 0.063 |
| Previously drank alcohol | 171 | (75.0) | 17 | (48.6) | 0.51 | (0.23, 1.13) | 0.099 |
| Current smoker | 37 | (16.2) | 4 | (11.1) | 0.76 | (0.23, 2.44) | 0.639 |
| Past smoker | 161 | (71.9) | 19 | (65.5) | 0.97 | (0.39, 2.38) | 0.941 |
| Reported medical history | |||||||
| Poor mobility/walking | 61 | (27.4) | 17 | (54.8) | 1.89 | (0.81, 4.41) | 0.140 |
| Loss of Consciousness | 40 | (18.3) | 4 | (15.4) | 1.09 | (0.33, 3.59) | 0.882 |
| iADLs (Any dependence) | 55 | (24.7) | 24 | (72.7) | 4.80 | (1.99, 11.60) | <0.001 |
| Memory - Informant | 22 | (9.4) | 15 | (38.5) | 4.44 | (1.92, 10.27) | <0.001 |
| Incontinent | 49 | (22.0) | 10 | (32.3) | 2.00 | (0.82, 4.90) | 0.129 |
| Medical history from Geriatrician assessments | |||||||
| Obesity | 39 | (16.6) | 4 | (10.3) | 0.93 | (0.29, 3.02) | 0.909 |
| Hearing impairment | 34 | (14.6) | 12 | (31.6) | 1.69 | (0.71, 4.03) | 0.235 |
| Diabetes | 141 | (60.0) | 30 | (76.9) | 2.17 | (0.92, 5.12) | 0.076 |
| Dyslipidemia | 94 | (40.0) | 23 | (59.0) | 2.07 | (0.97, 4.41) | 0.060 |
| Chronic kidney disease | 40 | (17.0) | 15 | (38.5) | 2.31 | (1.04, 5.13) | 0.040 |
| Heart disease | 39 | (16.6) | 10 | (25.6) | 1.09 | (0.45, 2.61) | 0.851 |
| Stroke/CVD | 7 | (3.0) | 12 | (30.8) | 27.68 | (8.19, 93.50) | <0.001 |
| Hypertension | 149 | (63.4) | 28 | (71.8) | 1.10 | (0.48, 2.50) | 0.828 |
| Test scores (median, IQR) | |||||||
| BPI total | 3.5 | (0.0–7.0) | 0 | (0.0–4.0) | 0.91 | (0.81, 1.03) | 0.131 |
| EFST total | 1 | (0.0–2.0) | 2 | (1.0–3.0) | 1.18 | (0.91, 1.52) | 0.211 |
| ICIQ total | 0 | (0.0–2.0) | 0 | (0.0–2.5) | 1.23 | (1.03, 1.46) | 0.019 |
| KICA-Depression total | 1 | (0.0–3.0) | 2 | (0.0–4.0) | 1.05 | (0.91, 1.22) | 0.489 |
| Depression (KICA-Dep ≥8) | 24 | (11.2) | 1 | (4.5) | 1.12 | (0.13, 9.72) | 0.917 |
| Cognitive assessment | |||||||
| Fluency 0–7 (Ref ≥8 words) | 49 | (21.8) | 25 | (80.6) | 8.34 | (3.07, 22.66) | <0.001 |
| Recall (Ref 4-5 pictures) | |||||||
| 3 | 48 | (21.4) | 4 | (12.9) | 1.42 | (0.31, 6.47) | 0.648 |
| 0–2 | 36 | (16.1) | 23 | (74.2) | 11.73 | (3.61, 38.08) | <0.001 |
| MMSE (<27) | 40 | (17.8) | 33 | (91.7) | 32.41 | (9.28, 113.21) | <0.001 |
| KICA-Cog (<34) | 18 | (8.0) | 25 | (80.6) | 34.24 | (11.64, 100.71) | <0.001 |
iADLs, Instrumental Activities of Daily Living; CVD, cerebrovascular disease; BPI, Brief Pain Inventory; EFST, Elderly Falls Screening Test; ICIQ, The International Consultation of Incontinence questionnaire; KICA, Kimberley Indigenous Cognitive Assessment tool; KICA-Dep, Brief depression screen in the KICA; Fluency, verbal fluency measured through the number of animals listed in one minute; Recall, free recall of five pictures encoded during administration of the KICA; MMSE, Mini-Mental Status Exam; KICA-Cog, Brief cognitive screen tool in the KICA; IQR, Interquartile Range.
There were data in the Torres Strait dementia prevalence study that did not directly map to the criteria in the seven risk models. For example, while age, diabetes, stroke, and other clearly defined variables in the prevalence data could be incorporated into the risk models, assumptions were required for other variables, such as verbal fluency or free recall. For example, while Free Recall in the AgeCoDe was based on 10 words recalled after delay, in the Torres Strait dementia prevalence study, delayed recall of 5 pictures was used, as this information was captured in the KICA-Cog. The assumptions used to adapt the prevalence study data to seven risk models are described in detail in Supplementary Box 1. The seven risk models were also created after removing points for age and, where applicable, for the MMSE. In the AgeCoDe example above, any points for age and MMSE were excluded to create an AgeCoDe score for each participant that did not include these variables.
Diagnostic utility of risk models
All participants in the Torres Strait dementia prevalence survey had a score derived for each of the seven existing dementia risk models based on the methods described in Supplementary Table 2. For the ANU-ADRI for example, participants were assigned points based on their age, gender, education, body weight, smoking status, alcohol consumption frequency, mood, diabetes status, and previous head injury history. The result was a final risk score for each participant for the seven existing models. The means, standard deviations (SD), medians, interquartile ranges (IQR), and ranges of these models are presented in Table 2. The median (IQR) of these models was examined by levels of independent study variables (e.g., by gender) using Kruskal-Wallis non-parametric ANOVAs (Supplementary Table 3). The discriminative utility of the risk models at detecting dementia was examined using AUROC analyses (Table 3, Fig. 1). Calibration was examined using Hosmer-Lemeshow Chi2 (Fig. 2), and effect sizes using logistic regression analyses (Table 3). All models and analyses were repeated after accounting for age, the strongest predictor of dementia in this and previous studies [7, 31].
Table 2
Distribution of scores from seven existing dementia risk models, and two new models, for 274 Torres Strait Islander and Aboriginal residents aged 45 years and over (2015–2018)
| Risk Index | N | Mean (SD) | Median (IQR) | Range |
| Australian National University Alzheimer’s Disease Risk Index | ||||
| ANU-ADRI (Anstey et al., 2013) [39] | ||||
| Full | 225 | 15.1 (10.9) | 12 (7–21) | 0, 51 |
| No Age | 225 | 8.2 (4.0) | 8 (6–11) | 0, 19 |
| Study on Aging, Cognition and Dementia | ||||
| AgeCoDe (Jessen et al., 2011) [38] | ||||
| Full | 244 | 5.3 (5.0) | 4 (0–8) | 0, 17 |
| No MMSE | 253 | 3.4 (3.7) | 2 (0–6) | 0, 13 |
| No Age (no MMSE) | 253 | 3.1 (3.3) | 2 (0–6) | 0, 10 |
| Brief Dementia Screening Indicator | ||||
| BDSI (Barnes et al., 2014) [40] | ||||
| Full | 234 | 15.9 (8.7) | 12 (12–21) | 0, 43 |
| No Age | 234 | 12.0 (5.5) | 12 (9–12) | 0, 28 |
| Canadian Study of Health and Aging | ||||
| CSHAI (Hogan et al., 2000) [41] | ||||
| Full | 262 | 35.0 (20.7) | 29 (20–44) | 12, 123 |
| No MMSE | 274 | 17.6 (4.8) | 16 (15–19) | 11, 32 |
| No Age (no MMSE) | 274 | 1.4 (3.4) | 0 (0-0) | 0, 10 |
| Framingham Heart Study | ||||
| FHS (Li et al., 2018) [42] | ||||
| Full | 262 | 4.5 (4.4) | 3 (1–7) | –1, 17 |
| No Age | 262 | 1.9 (1.3) | 2 (1–3) | –1, 5 |
| Mexican American Dementia Nomogram | ||||
| MADeN (Donwer et al., 2016) [23] | ||||
| Full | 234 | 9.0 (6.6) | 8 (5–12) | 0, 31 |
| No Age | 234 | 5.1 (3.0) | 5 (3–7) | 0, 13 |
| Washington Heights-Inwood Columbia Aging Project | ||||
| WHIACP (Reitz et al., 2010) [43] | ||||
| Full | 251 | 9.4 (7.7) | 9 (2–14) | 0, 34 |
| No Age | 251 | 6.8 (4.9) | 9 (1–10) | 0, 18 |
Table 3
Diagnostic properties of seven existing dementia risk models, for identifying dementia in 274 Torres Strait Islander and Aboriginal residents aged 45 years and over (2015–2018), each model presented with four variations, Model 1 (M1) Full, Model 2 (M2) excluding Mini-Mental Status Exam (MMSE) results, Model 3 (M3) excluding age and, Model 4 (M4) excluding age and limited to participants <75 years
| ANU-ADRI | AgeCoDe | BDSI | CSHAI | FHS | MADeN | WHACP | |
| Discrimination - AUROC (95% CI) | |||||||
| M1 - Full | 0.79 | 0.93 | 0.87 | 0.95 | 0.84 | 0.77 | 0.67 |
| (0.69–0.89) | (0.89–0.96) | (0.80–0.94) | (0.92–0.98) | (0.77–0.91) | (0.68–0.86) | (0.55–0.79) | |
| M2 - No MMSE | 0.90 | 0.82 | |||||
| M3 - No age (No MMSE) | 0.56 | 0.89 | 0.76 | 0.65 | 0.73 | 0.61 | 0.54 |
| (0.43–0.68) | (0.83–0.95) | (0.63–0.88) | (0.57–0.73) | (0.63–0.83) | (0.48–0.75) | (0.43–0.66) | |
| M4 - No age, <75 | 0.64 | 0.88 | 0.83 | 0.66 | 0.73 | 0.61 | 0.54 |
| (0.50–0.79) | (0.78–0.98) | (0.71–0.96) | (0.55–0.77) | (0.58–0.87) | (0.44–0.77) | (0.37–0.70) | |
| Calibration - Hosmer Lemeshaw Chi2 (df, sig.) | |||||||
| M1 - Full | 28.01 (43) | 6.34 (12) | 65.99 (31)** | 113.79 (193) | 16.45 (17) | 25.91 (28) | 19.63 (27) |
| M2 - No MMSE | 9.34 (9) | 64.47 (63) | |||||
| M3 - No age (No MMSE) | 9.73 (17) | 1.64 (4) | 17.55 (11) | 10.42 (5) | 13.41 (11) | 5.42 (15) | |
| M4 - No age, <75 | 9.64 (17) | 2.30 (4) | 2.67 (10) | 5.85 (5) | 6.99 (10) | 10.86 (14) | |
| M5 - No age, <75, adj. | 63.95 (135) | 49.42 (90) | 44.78 (96) | 25.84 (38) | 68.98 (99) | 98.45 (125) | 112.98 (126) |
| Logistic Regression - OR (95% CI, sig.) | |||||||
| M1 - Full | 1.08** | 1.52** | 1.16** | 1.11** | 1.30** | 1.13** | 1.08* |
| (1.04–1.13) | (1.33–1.73) | (1.09–1.22) | (1.08–1.15) | (1.20–1.41) | (1.07–1.20) | (1.03–1.14) | |
| M2 - No MMSE | 1.58** | 1.24** | |||||
| (1.38–1.81) | (1.16–1.32) | ||||||
| M3 - No age (No MMSE) | 1.08 | 1.68** | 1.21** | 1.20** | 2.09** | 1.11 | 1.03 |
| (0.95–1.22) | (1.44–1.96) | (1.12–1.31) | (1.11–1.29) | (1.51–2.87) | (0.96–1.29) | (0.95–1.12) | |
| M4 - No age, <75 | 1.16 | 1.62** | 1.29** | 1.22** | 2.05* | 1.11 | 1.03 |
| (0.99–1.36) | (1.34–1.96) | (1.16–1.44) | (1.10–1.36) | (1.30–3.22) | (0.92–1.32) | (0.93–1.15) | |
| M5 - No age, <75, age adj. | 1.18 | 1.62** | 1.35** | 1.15* | 1.98* | 1.17 | 0.94 |
| (0.98–1.43) | (1.30–2.01) | (1.18–1.54) | (1.03–1.28) | (1.21–3.24) | (0.96–1.43) | (0.84–1.06) | |
ANU-ADRI, Australian National University Alzheimer’s Disease Risk Index; AgeCoDe, Study on Aging, Cognition and Dementia; BDSI, Brief Dementia Screening Indicator; CSHAI, Canadian Study of Health and Aging; FHS, Framingham Heart Study; MADeN, Mexican American Dementia Nomogram; WHIACP, Washington Heights-Inwood Columbia Aging Project.
Fig. 1
Area Under the Receiver Operator Curve (AUROC) of seven existing dementia risk models, excluding age, for 274 Torres Strait Islander and Aboriginal residents aged 45 years and over (2015–2018).
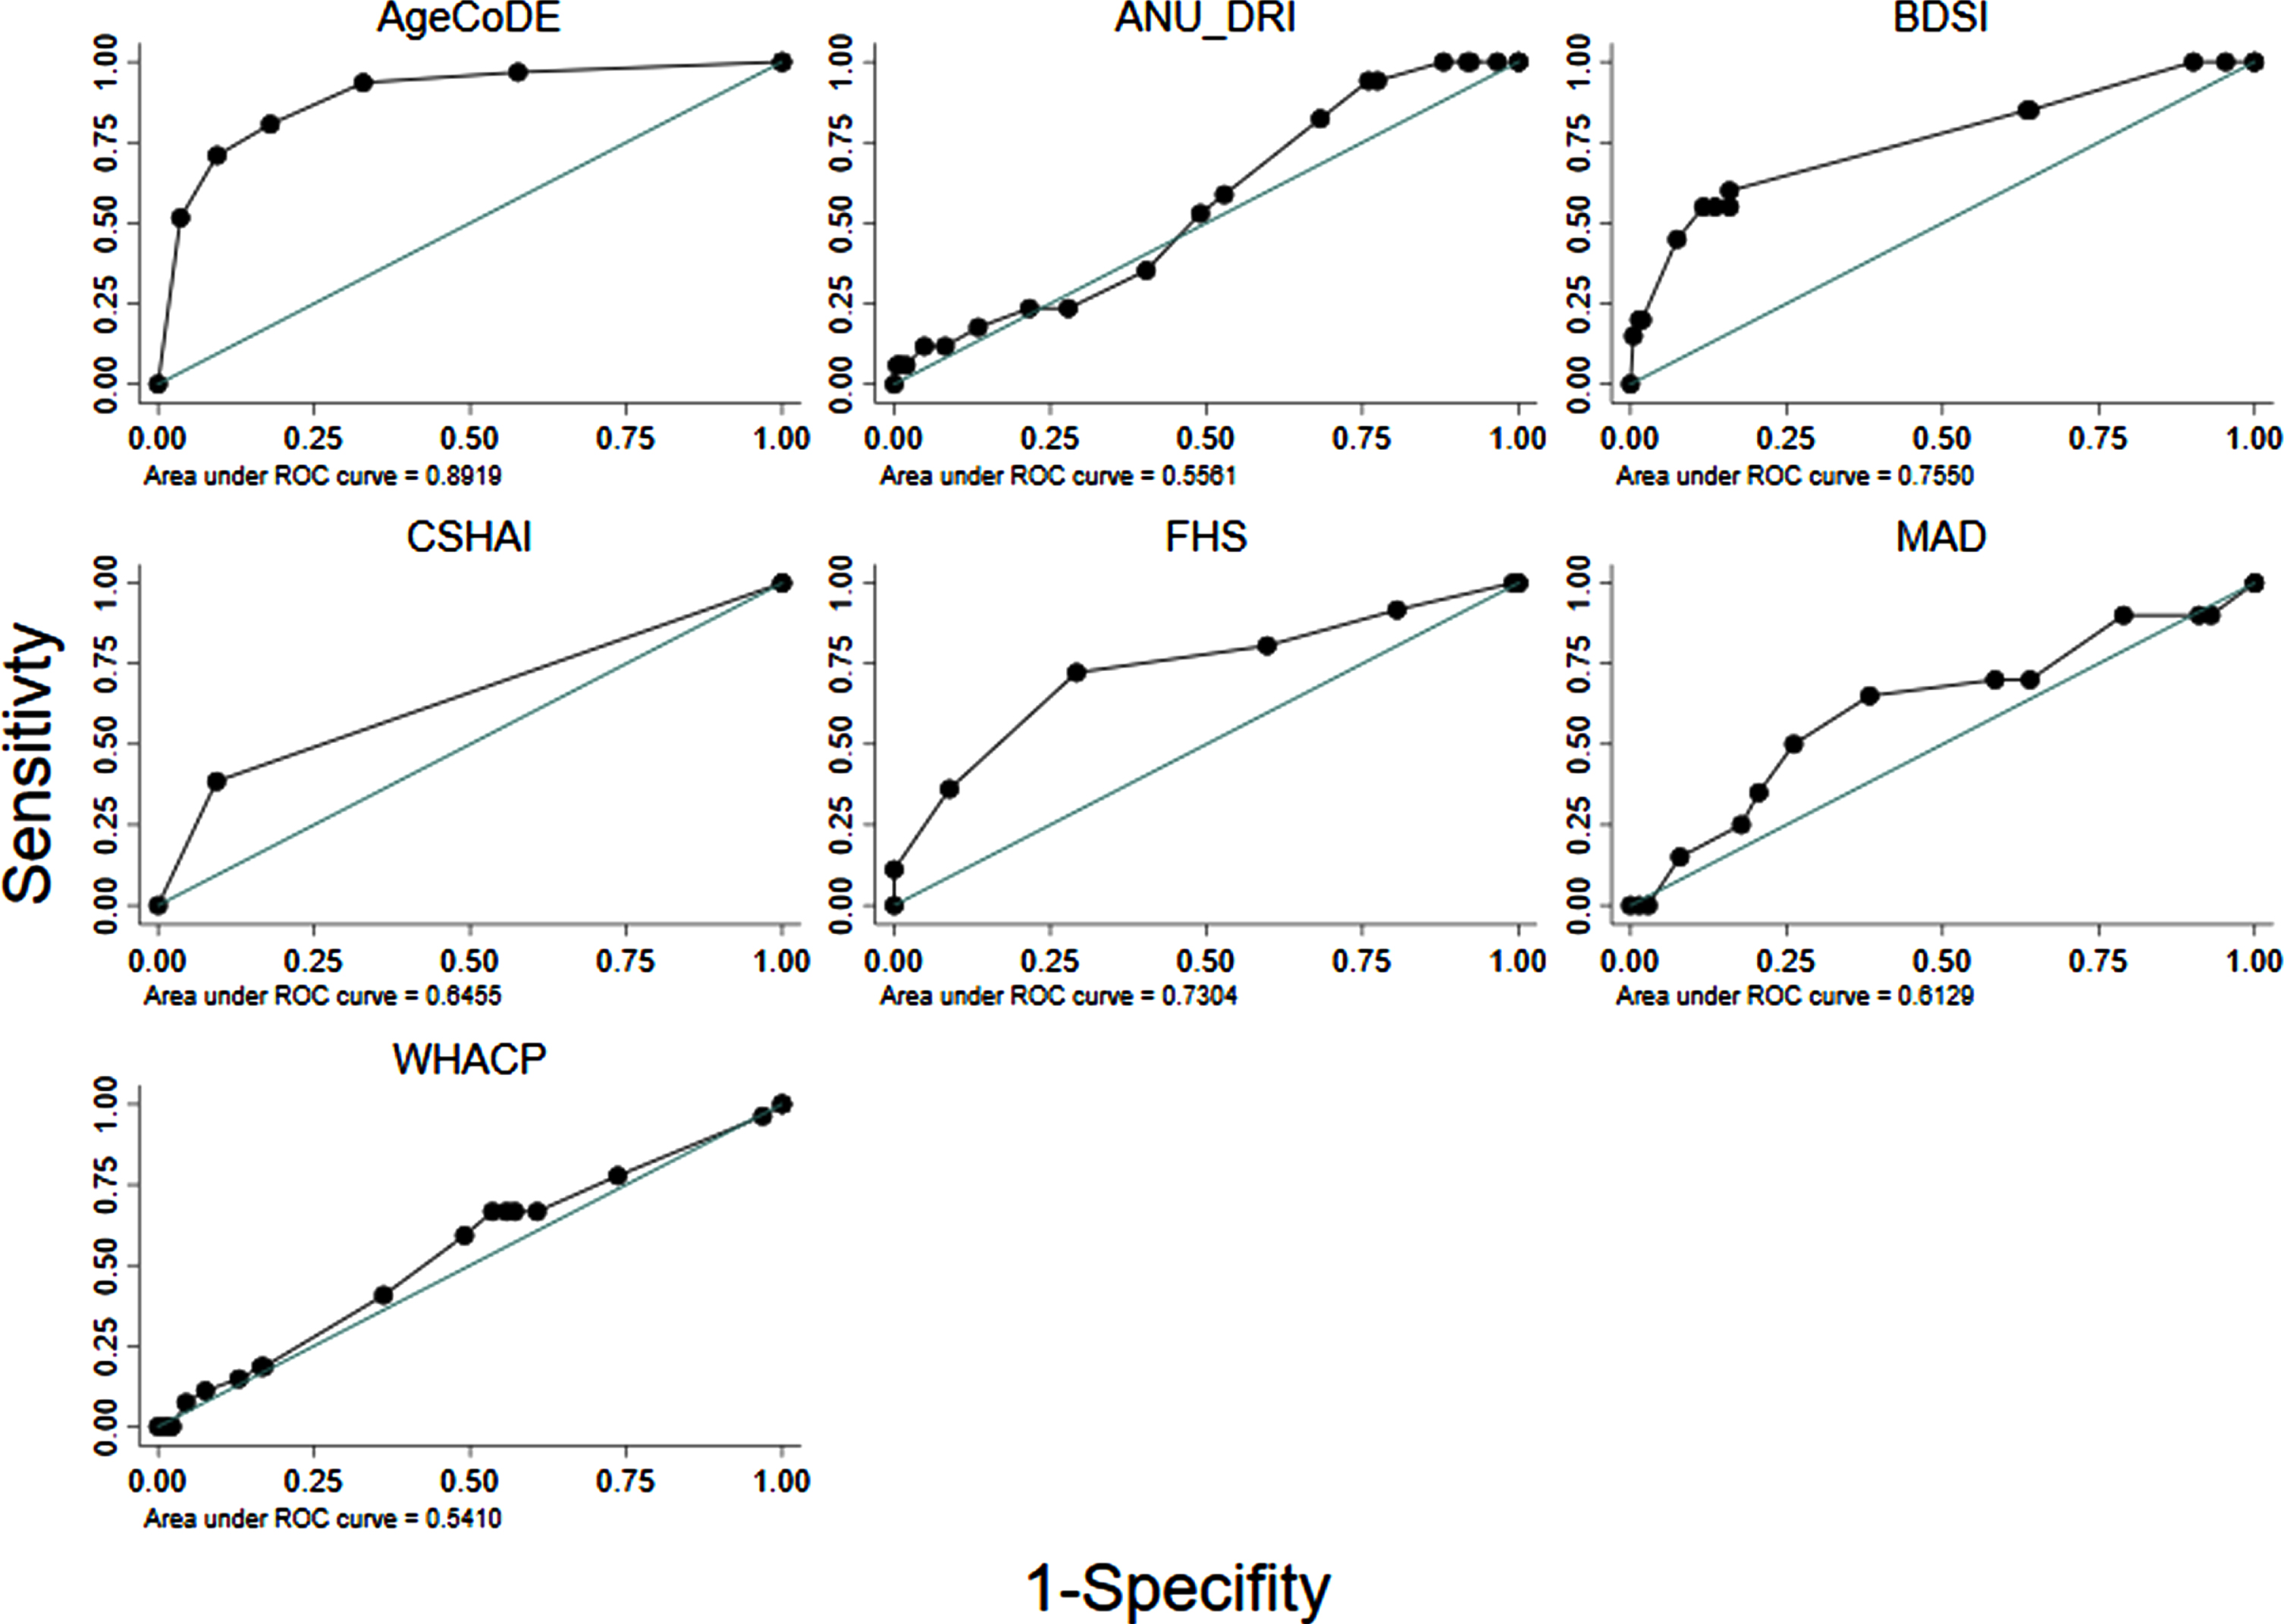
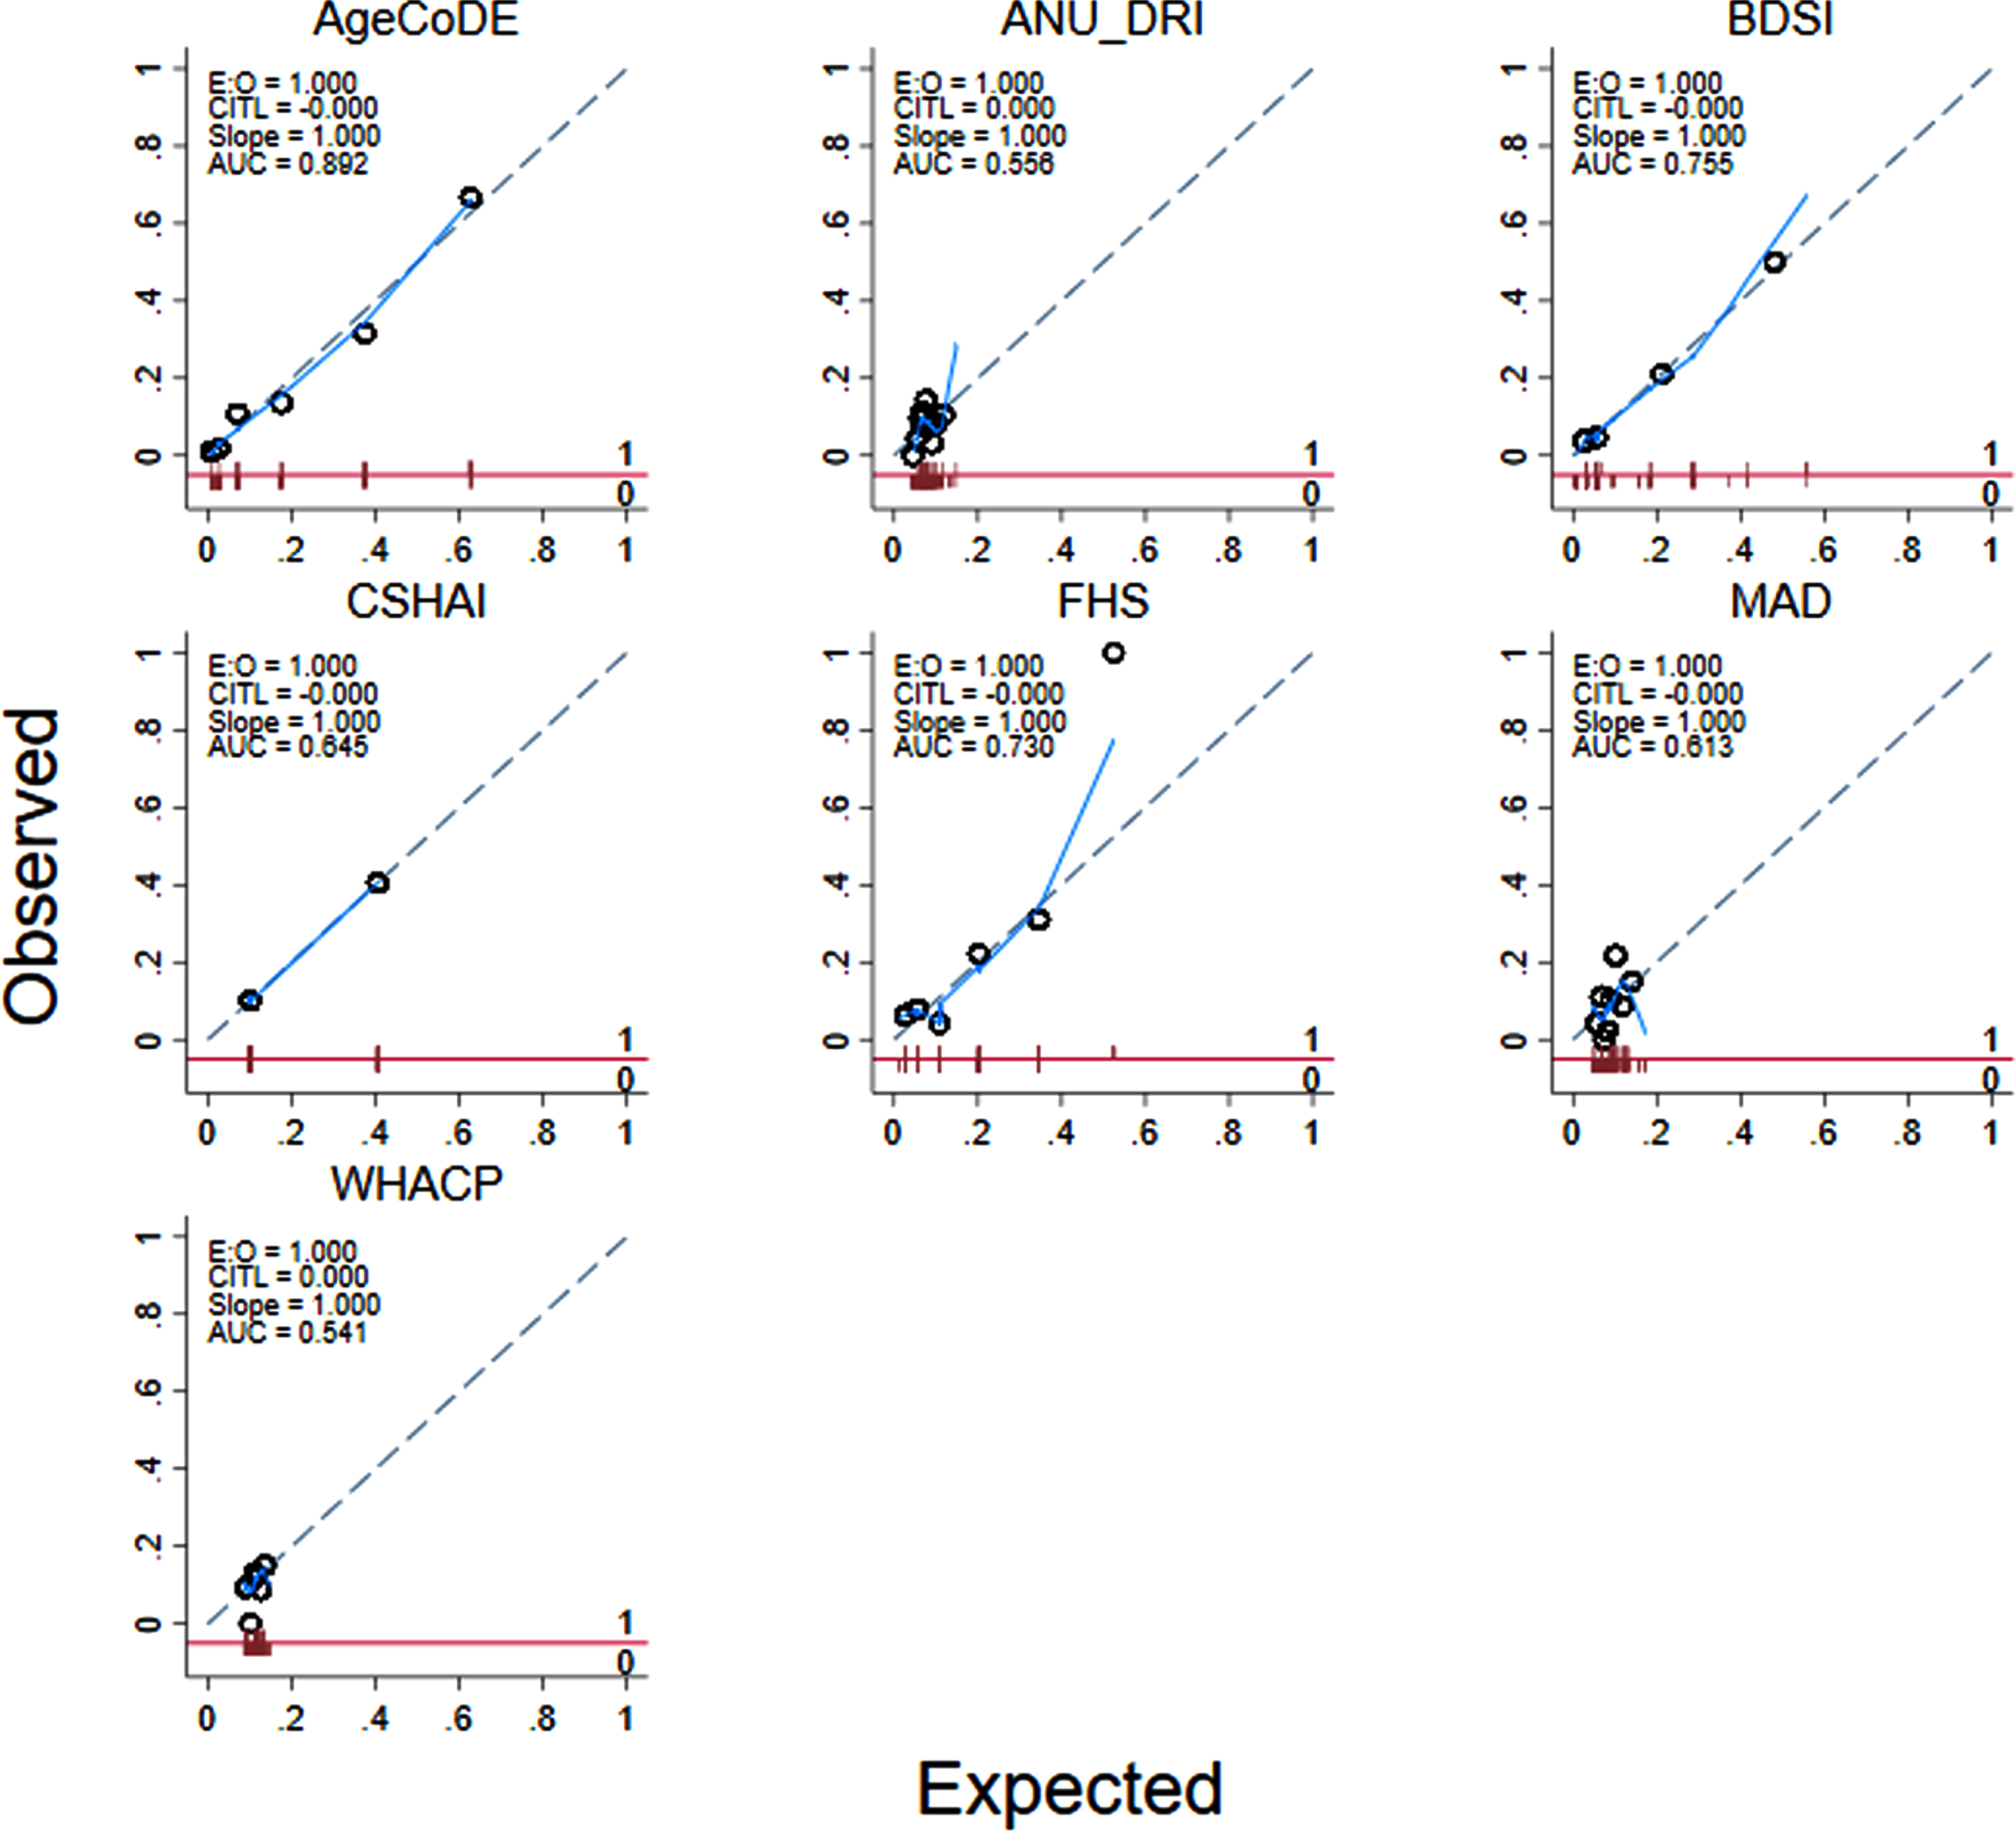
Fig. 2
Calibration of seven existing dementia risk models, excluding age, for 274 Torres Strait Islander and Aboriginal residents aged 45 years and over (2015–2018).
RESULTS
A total of 274 First Nations Australian residents aged 45 years and older participated in the dementia prevalence survey. The mean age was 65.1 years (SD 10.8, range 45–93), and 34.3% were male. All participants had some level of formal education, and 95% of participants spoke English as either a primary or a secondary language (data not tabled). There were 39 (14.2% ) participants diagnosed with dementia, 60 (21.9% ) with CIND, and 175 with no dementia or CIND. The two comparison groups for this study were participants with (n = 39) and without (n = 235) dementia.
Participants with dementia were older and had less post-school education (Table 1). After adjusting for age, participants with dementia were less likely to consume alcohol, more likely to require assistance with iADLs, and have a history of CKD, stroke/CVD, and incontinence. The age adjusted odds ratio (aOR) of having an informant who reported memory problems was four times higher among participants with dementia (aOR = 4.44, p < 0.001). On KICA-Cog testing, participants with dementia performed lower on verbal fluency and delayed word recall, and were more likely to score below the cut-off (i.e.,<34) for suspected dementia (aOR = 32.24, p < 0.001). Diabetes and dyslipidemia were more common among participants with dementia at trend significance (i.e., p < 0.10) after age adjustment. There was no clear statistical association between dementia risk and level of education, either as a categorical variable (not tabled) or dichotomized (Table 1), however proportions and odds ratios indicated more education as protective.
The distribution of scores for the seven existing models is presented in Table 2. Most models were non-parametric, based on a combined test of skewness and kurtosis (Stata command ‘sktest’), and scores tended to group in the lower end of the ranges. Supplementary Table 3 shows the median scores on these risk models, excluding age and MMSE, by participant characteristics. Most of the seven models (i.e., ≥5) showed differences in median scores by age categories, education, mobility, dependence of iADLs, informant reported memory difficulties, diabetes, hypertension, verbal fluency, recall, MMSE, KICA-Cog cut-off, and dementia status. Several models (i.e., 3–5) differed by marital status, alcohol/smoking, obesity, CKD, and stroke. Only a couple of models had differences in scores by sex, previous head injury, pain, hearing impairment, and dyslipidemia.
Table 3 shows the diagnostic properties of the full risk models (M1) as they were defined in the original studies and the same models excluding MMSE scores where applicable (M2) and points for age (M3). The diagnostic properties of these models are also shown when limited to participants aged <75 years, and points for age were excluded (M4). Almost all the models had at least moderate discrimination (i.e., AUROC >0.70) when analyzed in full form. However, when points for age and MMSE were removed from the models and analyses were limited to participants 75 years and younger, only the AgeCoDe, BDSI and FHS retained AUROC over 0.70 (Table 3, Fig. 1). For these models, Hosmer-Lemeshow results were generally non-significant, suggesting good calibration. However, there were large degrees of freedom for the ANU-DRI and CSHAI, and for all models when they were limited to participants <75 years, which indicated poor calibration. After adjustment for age, logistic regressions indicated the AgeCoDe and FHS, were strongly associated with prevalent dementia (Table 3). When age was examined as the sole variable associated with dementia, the AUROC was 0.80 (results not tabled).
DISCUSSION
This study aimed to adapt dementia risk models to cross-sectional prevalence data from a First Nations population in the Torres Strait region of Australia, which will allow testing of their predictive utility as participants are followed-up in the coming years. The long-term aim of this work is to improve the prediction of dementia in this population. We found seven dementia risk models could be adapted to cross-sectional dementia prevalence data for this population and three of these models, the AgeCoDe, BDSI, and the FHS, showed some diagnostic utility. These models were designed to predict dementia over time, so the predictive risk scores derived in this study may become applicable when the same participants are followed up in the coming years. In the interim, the current results allow preliminary commentary on the potential applicability of risk models for predicting dementia in First Nations populations.
Almost all the dementia risk models assessed in this study had AUROC scores of ‘moderate’ diagnostic utility (i.e., AUROC >0.70) for identifying dementia. However, this effect was primarily due to the models including older age. Once age was removed from these models, only the AgeCoDe, BDSI, and FHS retained moderate diagnostic utility. The strong performance of the AgeCoDe in this sample is likely associated with its allocating points for carer-reported memory difficulties, verbal fluency, and delayed recall. The FHS and BDSI assigned high points to a history of stroke (i.e., 6 and 5, respectively). As stroke was the strongest associated risk of dementia in the sample, assigning points for stroke likely improved the performance of the FHS and BDSI. Bodyweight, depression, and diabetes, which were assigned points in the FHS and BDSI models, were not significant in age-adjusted analyses of this cross-sectional data. As a result, the FHS and BDSI may have less utility in identifying people at risk for dementia in this population who did not have a history of stroke. The ANU-DRI, MADeN, WHACP, and CSHAI had minimal utility in identifying dementia in this sample.
The dementia risk models generally had low diagnostic utility in this population, based on AUROC analyses. These results are unsurprising given the models were designed for longitudinal analyses, and would likely have lower diagnostic utility in cross-sectional data. For example, many characteristics in dementia risk models are time dependent and may be a risk for dementia when present in one stage of life, while less so in another stage. Despite these limitations, previous research has examined the diagnostic utility of risk models in cross-sectional data [12, 25–29], which has allowed for commentary on the potential transportability of models for longitudinal use in future studies in some ethnically diverse populations [12]. Similarly, the work in the current study has highlighted several preliminary considerations. First, risk models were designed in populations with different profiles of risk and protective factors for dementia compared to many First Nations populations, including the one in the current study. High rates of modifiable risks are thought to contribute to the high rates of dementia in First Nations populations [4]. Risks that occur commonly in a given population, however, may be less effective at differentiating who develops a given disease in that population [44, 45]. Therefore, some factors that are often included in dementia risk models may be less applicable to predicting dementia in First Nations populations. Diabetes, for examples, was present in four of the seven models examined in this study. This risk, however, has had limited cross-sectional and longitudinal associations with dementia likelihood in First Nations Australians, including in the Torres Strait [31, 46–49], although small study samples and shorter follow-up periods may have contributed to these null results. Future research is needed to determine whether prevalent dementia risks improve the prognostic utility of dementia risk models in First Nations populations.
Other assumptions used in risk models, such as the age of onset for dementia and female sex may also have limited applicability. For example, the risk models in this study generally assigned increased risk of dementia after 65 years of age (Supplementary Table 2); however, dementia is known to onset at earlier ages more often in First Nations populations [7, 9, 49, 50]. Similarly, female sex was allocated more risk in a few of the models in this study, however, this assumption does not always hold in First Nations dementia studies, where males have been at higher risk [49, 51, 52]. The most accurate dementia risk models incorporate multiple information sources and factors [15], including cognitive assessment results [15, 18]. In Australian First Nations populations [53], scores on the KICA-cog and its subtests are associated with dementia, suggesting this tool or similar culturally appropriate tools could be incorporated into future risk models.
The current study had several significant limitations. The cross-sectional application of prognostic risk models limited their utility. The data in this study also did not include many sensitive measures associated with dementia risk. These include physical activity levels, cognitive engagement, low body weight, pathology measures, and APOE ɛ4 status. This limitation meant that four eligible risk models could not be adapted to the study data. For the models that were adapted, it was necessary to make some assumptions when mapping the risk models to the data. Although this practice occurs in dementia risk model research [4], the result is that transported models that do not exactly replicate the original models. Similarly, some models could not have all the variables mapped, such as the ANU-DRI, which quantifies a rich array of dementia risk and protective factors, of which only a subset could be examined here. Given all these limitations, the current study results should be considered suggestive and set the scene for future work to address the knowledge gap of transportability of dementia risk models in First Nations populations.
Conclusion
Seven dementia risk models were adapted to the study sample, and the risk scores derived may become applicable when the same participants are followed up in the coming years. Future research could trial dementia risk models in larger longitudinal datasets of similar populations. The goal would be to improve the early detection of dementia risk for First Nations populations, to allow for earlier targeted intervention in the pre-clinical stage of the disease course.
ACKNOWLEDGMENTS
The authors would like to acknowledge the traditional owners of the lands where this research was conducted and pay respects to the elders, past present, and emerging. The authors wish to thank the residents of the Torres Strait and Northern Peninsula Area of Cape York, who participated in the two projects that underpinned this study. The authors also thank the staff at the primary health centres, without whom the study would never have been completed. The staff in the Doctoral Cohort Program at James Cook University, Cairns, Australia, provided support to the primary author throughout the development of this manuscript.
FUNDING
This project was funded by grants from the Australian National Health and Medical Research Council (NHMRC, GNT1107140, GNT1191144, GNT1106175). This funding body did not have a role in the study design, data collection, analysis, and interpretation of data, or in the writing of the manuscript, and in the decision to submit the manuscript for publication.
CONFLICT OF INTEREST
The authors have no conflict of interest to declare.
DATA AVAILIABILITY
The data that support the findings of this study is sensitive. These data are not publicly available due to privacy and ethical restrictions. The data are available on request from the corresponding author. Additional institutional approvals, such as ethics approval, would be required to enable sharing of these data. Requests to access the datasets should be directed to E-mail: .
SUPPLEMENTARY MATERIAL
[1] The supplementary material is available in the electronic version of this article: https://dx.doi.org/10.3233/ADR-220093.
REFERENCES
[1] | Nichols E , Szoeke CE , Vollset SE , Abbasi N , Abd-Allah F , Abdela J , Aichour MTE , Akinyemi RO , Alahdab F , Asgedom SW ((2019) ) Global, regional, and national burden of Alzheimer’s disease and other dementias, 1990– 2016: A systematic analysis for the Global Burden of Disease Study 2016. Lancet Neurol 18: , 88–106. |
[2] | World Health Organization (2019) Risk reduction of cognitive decline and dementia: WHO guidelines. https://www.who.int/mental_health/neurology/dementia/guidelines_risk_reduction/en/, Accessed 16 May 2021. |
[3] | Jack CR Jr , Knopman DS , Jagust WJ , Shaw LM , Aisen PS , Weiner MW , Petersen RC , Trojanowski JQ ((2010) ) Hypothetical model of dynamic biomarkers of the Alzheimer’s pathological cascade. Lancet Neurol 9: , 119–128. |
[4] | Walker JD , Spiro G , Loewen K , Jacklin K ((2020) ) Alzheimer’s disease and related dementia in Indigenous populations: A systematic review of risk factors. J Alzheimers Dis 78: , 1439–1451. |
[5] | Ma’u E , Cullum S , Cheung G , Livingston G , Mukadam N ((2021) ) Differences in the potential for dementia prevention between major ethnic groups within one country: A cross sectional analysis of population attributable fraction of potentially modifiable risk factors in New Zealand. Lancet Reg Health West Pac 13: , 100191. |
[6] | MacDonald JP , Barnes DE , Middleton LE ((2015) ) Implications of risk factors for Alzheimer’s disease in Canada’s Indigenous population. Can Geriatr J 18: , 152–158. |
[7] | Russell S , Quigley R , Thompson F , Sagigi B , LoGiudice D , Smith K , Pachana N , Miller G , Strivens E ((2021) ) Prevalence of dementia in the Torres Strait. Australas J Ageing 40: , e125–e132. |
[8] | Radford K , Mack HA , Draper B , Chalkley S , Daylight G , Cumming R , Bennett H , Delbaere K , Broe GA ((2015) ) Prevalence of dementia in urban and regional Aboriginal Australians. Alzheimers Dement 11: , 271–279. |
[9] | Smith K , Flicker L , Lautenschlager N , Almeida O , Atkinson D , Dwyer A , LoGiudice D ((2008) ) High prevalence of dementia and cognitive impairment in Indigenous Australians. Neurology 71: , 1470–1473. |
[10] | Li SQ , Guthridge SL , Eswara Aratchige P , Lowe MP , Wang Z , Zhao Y , Krause V ((2014) ) Dementia prevalence and incidence among the Indigenous and non-Indigenous populations of the Northern Territory. Med J Aust 200: , 465–469. |
[11] | Peters R , Booth A , Rockwood K , Peters J , D’Este C , Anstey KJ ((2019) ) Combining modifiable risk factors and risk of dementia: A systematic review and meta-analysis. BMJ Open 9: , e022846. |
[12] | Torres S , Alexander A , O’Bryant S , Medina LD ((2020) ) Cognition and the predictive utility of three risk scores in an ethnically diverse sample. J Alzheimers Dis 75: , 1049–1059. |
[13] | Stephan BC , Pakpahan E , Siervo M , Licher S , Muniz-Terrera G , Mohan D , Acosta D , Pichardo GR , Sosa AL , Acosta I ((2020) ) Prediction of dementia risk in low-income and middle-income countries (the 10/66 Study): An independent external validation of existing models. Lancet Glob Health 8: , e524–e535. |
[14] | Ritchie CW , Muniz-Terrera G ((2019) ) Models for dementia risk prediction: So much activity brings a need for coordination and clarity. J Neurol Neurosurg Psychiatry 90: , 372. |
[15] | Stephan BC , Kurth T , Matthews FE , Brayne C , Dufouil C ((2010) ) Dementia risk prediction in the population: Are screening models accurate? Nat Rev Neurol 6: , 318. |
[16] | Hou X-H , Feng L , Zhang C , Cao X-P , Tan L , Yu J-T ((2019) ) Models for predicting risk of dementia: A systematic review. J Neurol Neurosurg Psychiatry 90: , 373–379. |
[17] | Tang EY , Harrison SL , Errington L , Gordon MF , Visser PJ , Novak G , Dufouil C , Brayne C , Robinson L , Launer LJ ((2015) ) Current developments in dementia risk prediction modelling: An updated systematic review, PloS One 10: , e0136181. |
[18] | Vonk JM , Greving JP , Gudnason V , Launer LJ , Geerlings MI ((2021) ) Dementia risk in the general population: Large-scale external validation of prediction models in the AGES-Reykjavik study. Eur J Epidemiol 36: , 1025–1041. |
[19] | Solomon A , Soininen H ((2015) ) Risk prediction models in dementia prevention. Nat Rev Neurol 11: , 375–377. |
[20] | Stephan BCM ((2014) ) Models for predicting risk of dementia: Predictive accuracy and model complexity. In Health and Cognition in Old Age, International Perspectives on Aging, vol 10: . LeistA, KulmalaJ, NyqvistF, eds. Springer, Cham, pp. 141–159. |
[21] | Goerdten J , Čukić I , Danso SO , Carrière I , Muniz-Terrera G ((2019) ) Statistical methods for dementia risk prediction and recommendations for future work: A systematic review. Alzheimers Dement (N Y) 5: , 563–569. |
[22] | Licher S , Leening MJ , Yilmaz P , Wolters FJ , Heeringa J , Bindels PJ , Initiative AsDN , Vernooij MW , Stephan BC , Steyerberg EW ((2019) ) Development and validation of a dementia risk prediction model in the general population: An analysis of three longitudinal studies. Am J Psychiatry 176: , 543–551. |
[23] | Downer B , Kumar A , Veeranki SP , Mehta HB , Raji M , Markides KS ((2016) ) Mexican-American dementia nomogram: Development of a dementia risk index for Mexican-American older adults. J Am Geriatr Soc 64: , e265–e269. |
[24] | Capuano AW , Shah RC , Blanche P , Wilson RS , Barnes LL , Bennett DA , Arvanitakis Z ((2022) ) Derivation and validation of the Rapid Assessment of Dementia Risk (RADaR) for older adults. PLoS One 17: , e0265379. |
[25] | Pase MP , Rowsthorn E , Cavuoto MG , Lavale A , Yassi N , Maruff P , Buckley RF , Lim YY ((2022) ) Association of neighborhood-level socioeconomic measures with cognition and dementia risk in Australian adults. JAMA Netw Open 5: , e224071. |
[26] | Ecay-Torres M , Estanga A , Tainta M , Izagirre A , Garcia-Sebastian M , Villanua J , Clerigue M , Iriondo A , Urreta I , Arrospide A ((2018) ) Increased CAIDE dementia risk, cognition, CSF biomarkers, and vascular burden in healthy adults. Neurology 91: , e217–e226. |
[27] | Enache D , Solomon A , Cavallin L , Kåreholt I , Kramberger MG , Aarsland D , Kivipelto M , Eriksdotter M , Winblad B , Jelic V ((2016) ) CAIDE Dementia Risk Score and biomarkers of neurodegeneration in memory clinic patients without dementia. Neurobiol Aging 42: , 124–131. |
[28] | Tolea MI , Heo J , Chrisphonte S , Galvin JE ((2021) ) A modified CAIDE risk score as a screening tool for cognitive impairment in older adults. J Alzheimers Dis 82: , 1755–1768. |
[29] | Hou Q , Guan Y , Liu X , Xiao M , Lü Y ((2022) ) Development and validation of a risk model for cognitive impairment in the older Chinese inpatients: An analysis based on a 5-year database. J Clin Neurosci 104: , 29–33. |
[30] | Tosto G , Bird TD , Bennett DA , Boeve BF , Brickman AM , Cruchaga C , Faber K , Foroud TM , Farlow M , Goate AM ((2016) ) The role of cardiovascular risk factors and stroke in familial Alzheimer disease. JAMA Neurol 73: , 1231–1237. |
[31] | Russell SG , Quigley R , Thompson F , Sagigi B , LoGiudice D , Smith K , Pachana N , Miller G , Strivens E ((2021) ) Factors associated with the increased risk of dementia found in the Torres Strait. Australas J Ageing 41: , 88–96. |
[32] | Russell S , Strivens E , LoGiudice D , Smith K , Helmes E , Flicker L ((2016) ) Ageing on Hammond Island: Is there cause for concern in the Torres Strait? Aust J Rural Health 24: , 342–343. |
[33] | Russell SG , Quigley R , Sagigi B , Miller G , Strivens E ((2021) ) Prevalence of Dementia in Torres Strait Islander Communities - Community Report. James Cook University. |
[34] | Frances A , First MB , Pincus HA ((1995) ) DSM-IV guidebook, American Psychiatric Association. |
[35] | Cwikel JG , Fried AV , Biderman A , Galinsky D ((1998) ) Validation of a fall-risk screening test, the Elderly Fall Screening Test (EFST), for community-dwelling elderly. Disabil Rehabil 20: , 161–167. |
[36] | Avery K , Donovan J , Peters TJ , Shaw C , Gotoh M , Abrams P ((2004) ) ICIQ: A brief and robust measure for evaluating the symptoms and impact of urinary incontinence. Neurourol Urodyn 23: , 322–330. |
[37] | Almeida OP , Flicker L , Fenner S , Smith K , Hyde Z , Atkinson D , Skeaf L , Malay R , LoGiudice D ((2014) ) The Kimberley assessment of depression of older Indigenous Australians: Prevalence of depressive disorders, risk factors and validation of the KICA-dep scale. PLoS One 9: , e94983. |
[38] | Jessen F , Wiese B , Bickel H , Eifflaender-Gorfer S , Fuchs A , Kaduszkiewicz H , Koehler M , Luck T , Moesch E , Pentzek M ((2011) ) Prediction of dementia in primary care patients. PLoS One 6: , e16852. |
[39] | Anstey KJ , Cherbuin N , Herath PM ((2013) ) Development of a new method for assessing global risk of Alzheimer’s disease for use in population health approaches to prevention. Prev Sci 14: , 411–421. |
[40] | Barnes DE , Beiser AS , Lee A , Langa KM , Koyama A , Preis SR , Neuhaus J , McCammon RJ , Yaffe K , Seshadri S ((2014) ) Development and validation of a brief dementia screening indicator for primary care. Alzheimers Dement 10: , 656–665e651. |
[41] | Hogan DB , Ebly EM ((2000) ) Predicting who will develop dementia in a cohort of Canadian seniors. Can J Neurol Sci 27: , 18–24. |
[42] | Li J , Ogrodnik M , Devine S , Auerbach S , Wolf PA , Au R ((2018) ) Practical risk score for 5-, 10-, and 20-year prediction of dementia in elderly persons: Framingham Heart Study. Alzheimers Dement 14: , 35–42. |
[43] | Reitz C , Tang M-X , Schupf N , Manly JJ , Mayeux R , Luchsinger JA ((2010) ) A summary risk score for the prediction of Alzheimer disease in elderly persons. Arch Neurol 67: , 835–841. |
[44] | Glymour MM , Whitmer RA ((2019) ) Using cross-cultural studies to improve evidence on dementia prevention: Lessons from the special issue sponsored by the International Research Network on Dementia Prevention (IRNDP). J Alzheimers Dis 70: (s1), S5–S10. |
[45] | Rose G ((2001) ) Sick individuals and sick populations. Int J Epidemiol 30: , 427–432. |
[46] | Thompson F , Russell SG , Harriss LR , Esterman A , Taylor S , Quigley R , Strivens E , McDermott R ((2022) ) Using health check data to understand risks for dementia and cognitive impairment among Torres Strait Islander and Aboriginal peoples in Northern Queensland— a data linkage study. Front Public Health 10: , 782373. |
[47] | Radford K , Lavrencic LM , Delbaere K , Draper B , Cumming R , Daylight G , Mack HA , Chalkley S , Bennett H , Garvey G ((2019) ) Factors associated with the high prevalence of dementia in older Aboriginal Australians, J Alzheimers Dis 70: , S75–S85. |
[48] | LoGiudice D , Smith K , Fenner S , Hyde Z , Atkinson D , Skeaf L , Malay R , Flicker L ((2016) ) Incidence and predictors of cognitive impairment and dementia in Aboriginal Australians: A follow-up study of 5 years. Alzheimers Dement 12: , 252–261. |
[49] | Smith K , Flicker L , Dwyer A , Atkinson D , Almeida OP , Lautenschlager NT , LoGiudice D ((2010) ) Factors associated with dementia in Aboriginal Australians. Austr N Z J Psychiatry 44: , 888–893. |
[50] | de Souza-Talarico JN , de Carvalho AP , Brucki S , Nitrini R , Ferretti-Rebustini REd ((2016) ) Dementia and cognitive impairment prevalence and associated factors in indigenous populations. Alzheimer Dis Assoc Disord 30: , 281–287. |
[51] | Carty CL , Noonan C , Muller C , Saner D , Reiman EM , Buchwald D , Bell RA , Nelson LA ((2020) ) Risk factors for Alzheimer’s disease and related dementia diagnoses in American Indians. Ethn Dis 30: , 671–680. |
[52] | Radford K , Lavrencic LM , Delbaere K , Draper B , Cumming R , Daylight G , Mack HA , Chalkley S , Bennett H , Garvey G , Hill TY , Lasschuit D , Broe GA ((2019) ) Factors associated with the high prevalence of dementia in older Aboriginal Australians. J Alzheimers Dis 70: , S75–S85. |
[53] | Smith K , Flicker L , Dwyer A , Marsh G , Mahajani S , Almeida O , Lautenschlager N , Atkinson D , LoGiudice D ((2009) ) Assessing cognitive impairment in indigenous Australians: Re-evaluation of the Kimberley indigenous cognitive assessment in western Australia and the Northern Territory. Aust Psychol 44: , 54–61. |


