
Tubulin Isotypes and Posttranslational Modifications in Vascular Dementia and Alzheimer’s Disease
Abstract
Background:
Vascular dementia (VaD) and Alzheimer’s disease (AD) are the two most common forms of dementia. Although these two types of dementia have different etiologies, they share some similarities in their pathophysiology, such as neuronal loss and decreased levels of tau protein. We hypothesize that these can have an impact upon the molecular changes in tubulin, precede the neuronal cell loss, and lead to changes in cytoskeletal associated proteins, as documented in both VaD and AD.
Objective:
We characterized different isotypes of tubulin together with their posttranslational modifications, as well as several microtubule associated proteins (MAPs), such as tau protein, MAP2 and MAP6, all together known as the tubulin code.
Methods:
We performed western blotting in human brain homogenates of controls and AD and VaD subjects.
Results:
We report that the levels of different tubulin isotypes differ depending on the dementia type and the brain area being studied: whereas α-tubulin is increased in the temporal lobe of VaD patients, it is decreased in the frontal lobe of AD patients. In VaD patients, the frontal lobe had a decrease in tyrosinated tubulin, which was accompanied by a decrease in tau protein and a tendency for lower levels of MAP2.
Conclusion:
Our findings highlight distinct changes in the tubulin code in VaD and AD, suggesting a therapeutic opportunity for different dementia subtypes in the future.
INTRODUCTION
Alzheimer’s disease (AD) and vascular dementia (VaD) are the two most common forms of dementia [1, 2]. Whereas AD is characterized by extracellular aggregates of insoluble amyloid-β (Aβ) throughout the whole cerebral cortex [3], together with accumulation of neurofibrillary tangles (NFTs) containing hyperphosphorylated tau protein [4], VaD occurs when the blood flow to the brain is either reduced or blocked, and there is no oxygen supply. In fact, VaD is considered a heterogeneous group of brain disorders since it can be caused by several cerebrovascular pathologies, such as atherosclerosis, small vessel disease, or cerebral amyloid angiopathy [5–8]. Even though both AD and VaD differ in their etiology, they share similar risk factors, i.e., age and hypercholesterolemia, as well as having similarities in their pathophysiology (Table 1) [9], such as neuronal cell volume loss [10], which has been correlated with severity of disease both in AD [11–14] and VaD [10, 15].
Table 1
Pathophysiological similarities between AD and VaD
| Alzheimer’s Disease | Vascular Dementia | |
| APOE genotype | Higher prevalence of APOE ɛ4 allele [31] | |
| Altered hemodynamic | Altered vessel hemodynamics, angiogenesis, vascular cell function, vascular coverage, blood-brain barrier permeability. In AD these are attributed to amyloid toxicity [31]. | |
| Aβ | Significantly higher amounts of Aβ42 in the temporal and frontal lobes [32] | Tendency of Aβ42 to be higher in the temporal lobe [32] |
| Tau protein | Loss of total tau protein in temporal lobe [16] | |
| Widespread significant increase in phosphorylated tau protein [16] | No overt change in phosphorylated tau protein (Ser202/Thr205 and Ser262 phosphorylated sites) in temporal and frontal lobes [16] | |
| Morphological and cellular changes | Loss of neuronal cell volume [10] | |
| Hippocampal and medial temporal lobe atrophy and CA1 pyramidal neuronal loss [15] | ||
| Changes in synaptic proteins | Loss of synaptophysin and SNAP-25 [33] | |
Previous work in our laboratory has shown loss of tau in the temporal lobe of human brain homogenates of AD and VaD [16], as well as a tendency for reduced levels of tubulin in the dorsolateral prefrontal cortex of VaD samples [17]. Microtubules (MTs) are the main proteins of the cytoskeleton and are formed by different types of tubulin [18]. MTs are essential for a variety of functions [19], including synaptic plasticity and physiological functioning of neurons [20].
For the MTs to perform their function, they need to be specialized, which is achieved in two different ways: by interacting with microtubule associated proteins (MAPs), and by the tubulin code, a mechanism by which MTs regulate themselves expressing different isotypes of α- and β-tubulin and by modifying these isotypes with posttranslational modifications (PTMs).
There are more than ten PTMs that tubulin can undergo [21], and several of them have been studied in neurodegenerative diseases, such as deacetylation in AD, Parkinson’s disease, or Huntington’s disease [22, 23], and polyglutamylation (PolyE) and tyrosination (Tyr) in AD [24–26]. However, none of them has been studied in VaD. Since the tubulin code regulates the binding affinity of MTs to different MAPs, this may well underlie the distinct dementia development trajectories, and thus determine dementia subtypes.
In the current study, we measured the levels of different isotypes of tubulin, together with the main tubulin PTMs that have been related to neurodegeneration, namely PolyE, Tyr, detyrosinated tubulin (DeTyr), and acetylation, as well as the main MAPs: tau, MAP2, and MAP6 in human brain homogenates of controls, AD, and VaD patients.
MATERIALS AND METHODS
Brain samples
The brain homogenates were a kind donation from Professor Raj J. Kalaria, University of Newcastle. They were retrieved from the Newcastle Brain Tissue Resource Centre at the Institute of Neuroscience, Newcastle University, UK and were homogenized in a buffer containing guanidine hydrochloride (Gdn-HCl) and a cocktail of protease inhibitors, as described elsewhere [16]. The brain homogenates came from the grey matter of frontal (BA9/46) and temporal (BA21/22) brain areas, and they correspond to three different groups: controls (C), patients with a definite diagnosis of vascular dementia (VaD), and Alzheimer’s disease (AD). There were a total of 43 samples from the temporal lobe (C; n = 13, VaD; n = 15 and AD; n = 15) and 22 from the frontal lobe (C; n = 7; VaD; n = 8 and AD; n = 8) (Table 2).
Table 2
Patients’ demographic and neuropathological data
| Parameter | Control (n = 15) | VaD (n = 16) | AD (n = 15) |
| Age (y) | 79.00±2.97 | 81.44±2.67 | 80.06±2.59 |
| Sex (F/M) | 9/6 | 10/6 | 9/6 |
| Infarcts | 2 | 6 | 0 |
| Microinfarcts | 0 | 9 | 2 |
| White matter changes | 0 | 4 | 2 |
| Vascular lesions | 1 | 4 | 1 |
| CAA | 0 | 2 | 0 |
In majority of cases, bronchopneumonia was recorded as the cause of death. VaD, vascular dementia; AD, Alzheimer’s disease; F, female; M, male; CAA, cerebral amyloid; y, years.
Ethical approval
Ethical approval for the storage and research of the brain samples was granted by the Human Tissue Authority (HTA) and held by the Newcastle University, UK. The University Ethics Sub-Committee of Medicine and Biological Sciences of the University of Leicester, UK, granted the ethics approval for the use of these human samples for the current research; ethics reference: 21750-esm14-ls:neuroscience,psychology&behaviour.
Protein quantification
The Bradford assay was used to quantify total protein concentration in each sample. A standard curve was prepared with Bovine Serum Albumin (BSA) (Fisher Scientific; 16356518) with concentrations ranging from 0 to 2.5 mg/mL. 200μL of Bradford reagent were added to the whole plate, and then triplicates of each sample diluted 1:4 in dH2O (10μL/well) were added and mixed with the reagent. The plates were then left at room temperature for 7 min and read at 595 nm with the BIO-RAD iMarkTM Microplate Reader and the Microplate Manager Software 6.
Ethanol precipitation of guanidine hydrochloride samples
For SDS-PAGE, Gdn-HCl treated samples were precipitated in ethanol, as previously described [16]. Briefly, 1 volume of sample (50μL) was mixed with 9 volumes of cold pure ethanol (450μL) and left overnight at –20°C. Samples were then centrifuged (Eppendorf Centrifuge 5417R) at 15,000 g for 15 min. The supernatant was discarded, and the pellets were washed in 90% ethanol. Afterwards, they were once again centrifuged at 15,000 g for 15 min and the supernatant was discarded. Two-thirds of dH2O of the initial sample volume were added to the pellet and sonicated for 15 s. After, one-third of 6x Laemmli buffer of the initial sample volume was added. Samples were then heated at 99°C for 5 min and used immediately or frozen at –20°C until used for western blotting (WB).
Western blotting
The ethanol precipitated samples were resolved in different percentages of acrylamide gels and run at constant 100 V for 90 min, and then transferred to nitrocellulose membranes (pore size, 0.45μm Fisher Scientific; 15220033) at a constant 100 V for 60 min. Membranes were incubated with Revert 700 Total Protein Stain (LI-COR, 926-11021) for 5 min and washed twice for 30 s with Revert Wash Buffer. Immediately afterwards, the membranes were scanned with the Syngene G:BOX. Membranes were then blocked in 5% BSA-TBST at room temperature for 60 min.
Antibodies were diluted in blocking solution, and the membranes were incubated overnight at 4°C. Polyclonal antibodies for α-tubulin (α3A1; 1:10000), Detyr-tubulin (J63; 1:10000), and the monoclonal antibody for Tyr-tub (YL1/2; 1:10000) were kindly donated by Dr. Marie-Jo Moutin, Grenoble Institut des Neurosciences, University Grenoble Alpes, France. The other antibodies used in the current project were purchased from different companies: βII-tubulin (1:2000; Genetex, GTX100117), βIII-tubulin (1:5000; Biolegend, 801202), acetyl-α-tubulin Lys40 (1:2000; Elabsciences, E-AB-20302), MAP2 (1:2000; Proteintech, 17490-1-AP), MAP6 (1:500; Scientific LTD, ARP60316-P050), PolyE (1:4000; AdipoGen Life Sciences, AG-25B-0030-CO50), and tau (1:10000; Proteintech, 66499-1-Ig). After the incubation with the primary antibody, the membranes were washed thrice in TBST and incubated with the secondary antibody diluted 1:10000 (IR Dye 800 CW Goat anti-mouse IgG; LI-COR, 925-32210; IR Dye 800 CW Goat anti-rabbit IgG; LI-COR, 925-32211; IR Dye 800 CW Goat anti-rat IgG; Fisher Scientifics, 13457177) at room temperature for 60 min. Membranes were washed and then scanned with the LI-COR Odyssey Infrared scanner at 800 nm.
Statistical analysis
For the western blot analysis, all proteins were normalized to the total protein of each sample. All statistical analysis was done using GraphPad Prism 8.1.2. One-Way ANOVA tests were used to compare the three groups, followed by a Tukey’s post-hoc multiple comparison test (when normality applied) or a Kruskal-Wallis test followed by Dunn’s post-hoc multiple comparison test (when normality did not apply). Statistical significance was achieved when p < 0.05. All data in the graphs are presented as individual values and mean±standard error of the mean (SEM).
In the temporal lobe, each dot represents the average of triplicate experiments for each sample, whereas in the frontal lobe each dot represents one experiment for each sample.
RESULTS
Levels of tubulin isotypes in VaD and AD human brain homogenates
We measured three different isotypes of α- and β-tubulin in brain homogenates from VaD and AD subjects. In the frontal lobe, only a significant decrease of α-tubulin was found in AD patients when compared to controls (Tukey’s test, p = 0.0374). Similarly, the AD group showed a tendency for decreased levels of α-tubulin when compared to VaD patients, although it did not reach statistical significance (p = 0.0584). In contrast, βII- or βIII-tubulin isotypes’ levels were similar between the three groups (Kruskal-Wallis, p = 0.5810 and one way-ANOVA, F (2,19) = 2.575, p = 0.1024, respectively) (Fig. 1A, B).
Fig. 1
Levels of various tubulin isotypes in the frontal and temporal lobes of human brain homogenates. A) Human brain homogenates were probed against α-tubulin, βII-tubulin, and βIII- tubulin. Total protein was used for normalization. B) Immunoblot quantifications in the frontal lobe and (C) immunoblot quantifications in the temporal lobe. 10μg of protein was added on each lane. Data are expressed as the relative ratio of protein/total protein and graphs represent individual values with mean±SEM. One-Way ANOVA with Tukey’s posthoc tests. *p < 0.05, **p < 0.01. N for frontal lobe: C (4–7), V (7-8), A (5–7). N for the temporal lobe: C (13), V (14), A (15). C, controls; V/VaD, vascular dementia; A/AD, Alzheimer’s disease. Please note that the number of analyzed samples (N) for the frontal lobe varies depending on samples available for the assay.
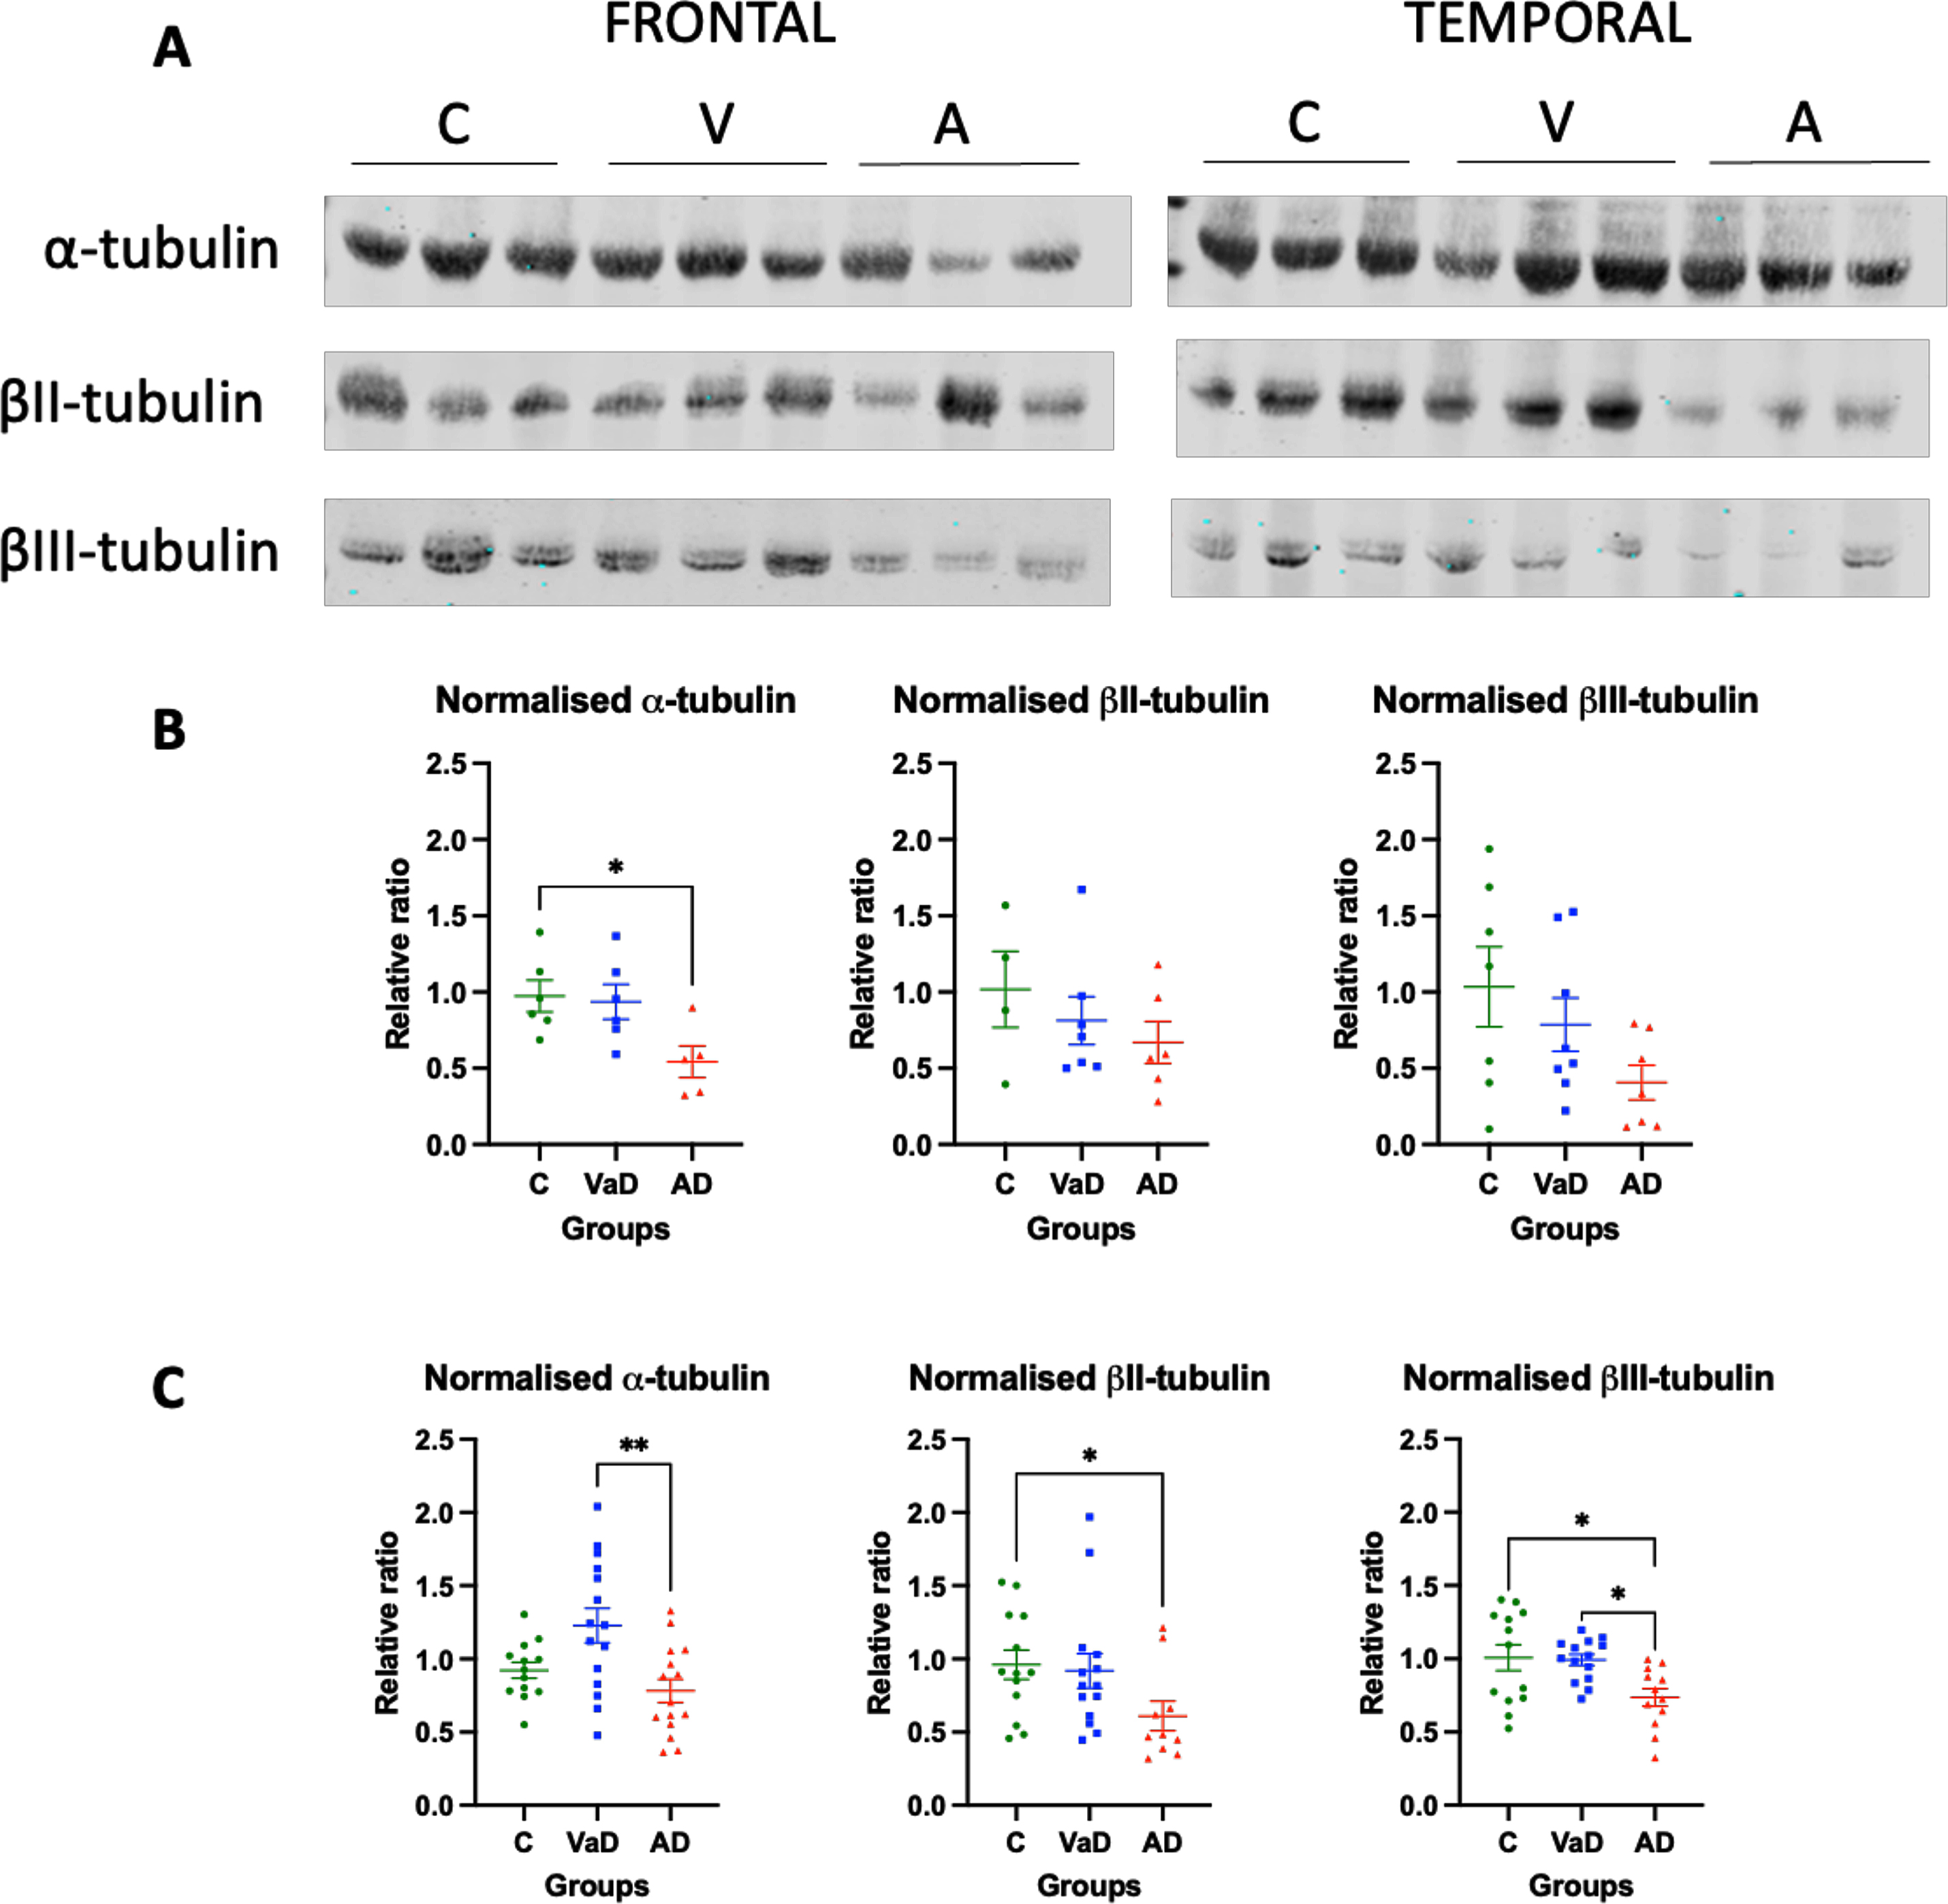
When the levels of tubulin isotypes were quantified in the temporal lobe, the levels of α-tubulin were significantly increased in VaD patients when compared to AD patients (p = 0.0026). These levels seemed to also be increased when compared to the control group, although they were not statistically significant (Tukey’s test, p = 0.0576). Surprisingly, no differences were found between controls and AD patients (Tukey’s test, p = 0.5294) (Fig. 1A, C). The opposite pattern was found when the β-tubulin isotypes were measured. βII- and βIII-tubulin levels were significantly lower in AD patients when compared to controls (Tukey’s test, p = 0.0369 and p = 0.0177, respectively). Furthermore, the levels of βIII-tubulin in AD patients were significantly lower when compared to VaD patients (Tukey’s test, p = 0.0236). No differences were found in either of the β-tubulin isotypes between controls and VaD patients (Tukey’s test, p > 0.9999 and p = 0.9839, respectively) (Fig. 1A, C).
Decreased levels of tyrosinated tubulin in the frontal lobe of VaD patients
When the frontal lobe was analyzed, VaD patients showed significantly lower levels of Tyr-tubulin when compared to controls (Tukey’s test, p = 0.0412). On the other hand, AD patients had a tendency for decreased levels of Tyr tubulin when compared to controls, although it did not reach statistical significance (Tukey’s test, p = 0.0537). No differences were found between the two types of dementia for Tyr tubulin (Tukey’s test, p = 0.9903) or any other type of PTMs (Fig. 2A, B).
Fig. 2
Levels of various tubulin PTMs in the frontal and temporal lobes of human brain homogenates. A) Human brain homogenates were probed against PolyE, Tyr, DeTyr, and Ac.tub. Total protein was used for normalization. B) Immunoblot quantifications in the frontal lobe and (C) immunoblot quantifications in the temporal lobe. 10μg of protein was added on each lane. Data are expressed as the relative ratio of protein/total protein and graphs represent individual values with mean±SEM. One-Way ANOVA with Tukey’s posthoc tests. *p < 0.05, **p < 0.01. N for frontal lobe: C (5–7), V (7-8), A (6-7). N for the temporal lobe: C (13), V (14), A (15). C, controls; V/VaD, vascular dementia; A/AD, Alzheimer’s disease. Please note that the number of analyzed samples (N) for the frontal lobe varies depending on samples available for the assay.
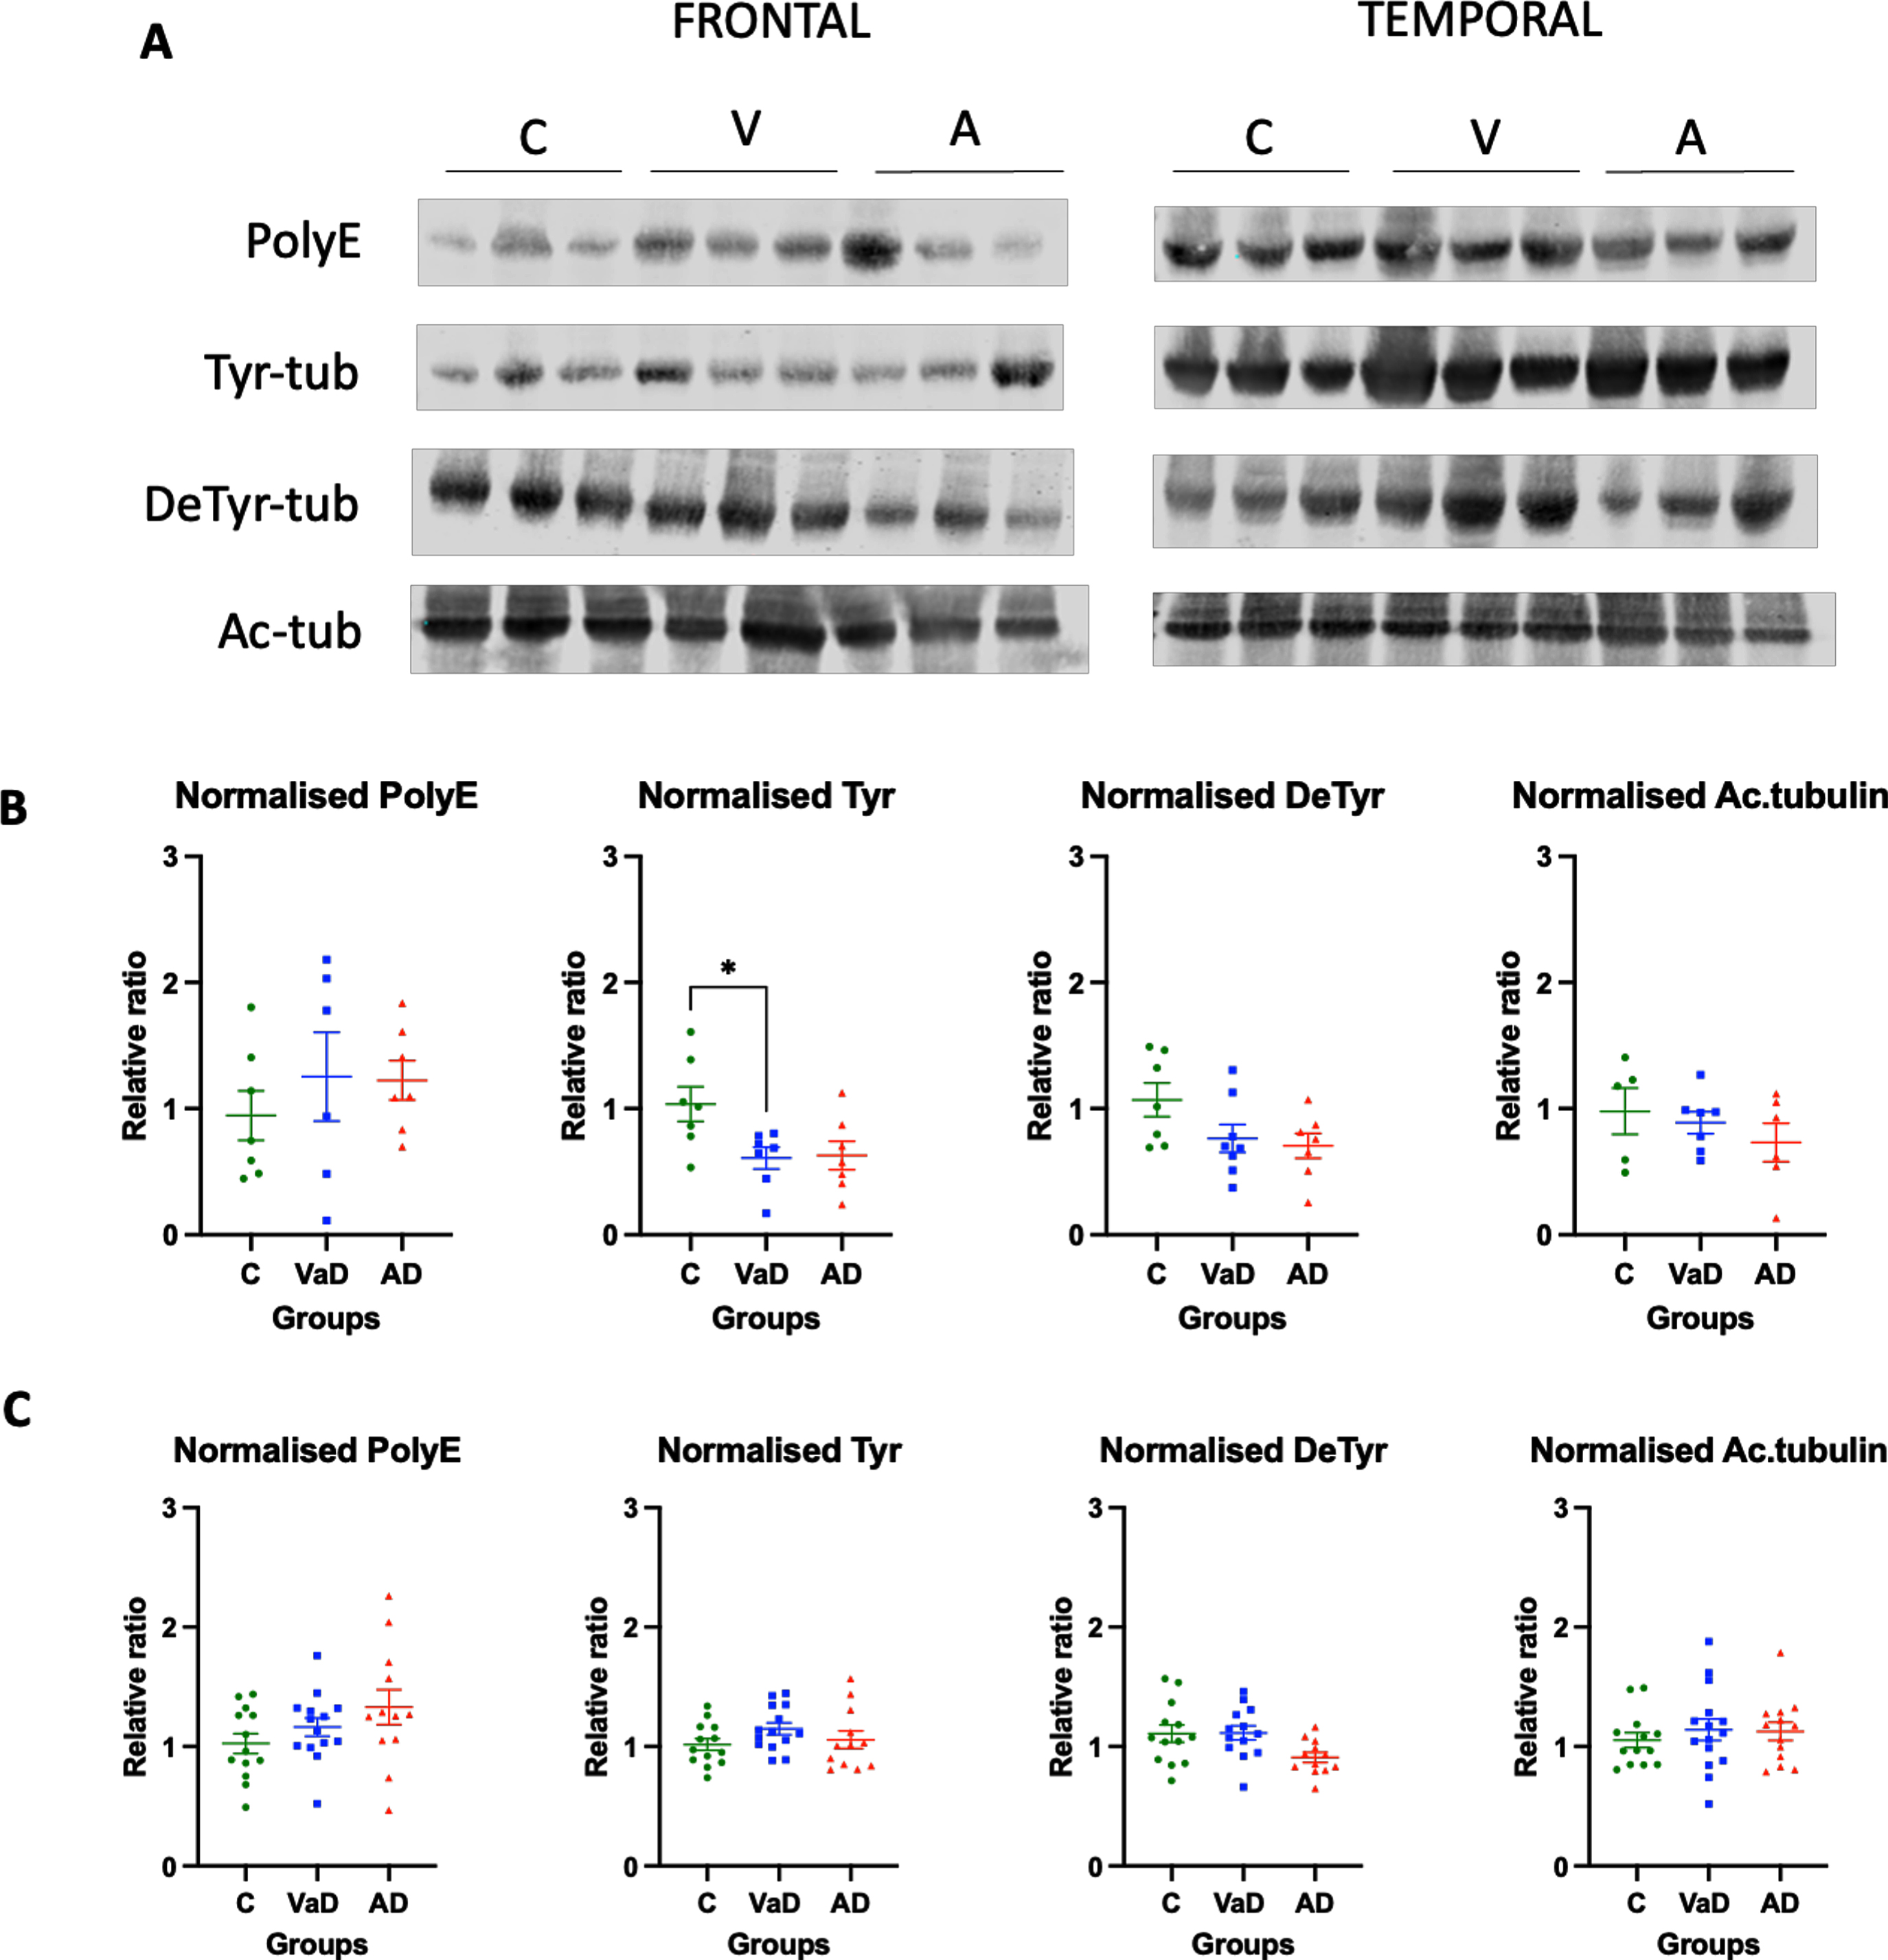
The tubulin PTMs in the temporal lobe were similar among the three analyzed groups. Thus, there was not significant difference in PolyE-tubulin, Tyr-tubulin, and Ac-tubulin in the temporal lobes of control, AD, and VaD brain homogenates (one way ANOVA, F (2,36) = 2.100, p = 0.1373; one way ANOVA, F (2,36) = 1.449, p = 0.2481; one way ANOVA, F (2,38) = 0.3434, p = 0.7116, respectively). Surprisingly, when Detyr-tubulin was analyzed using one way ANOVA, the results were statistically significant (one way ANOVA, F (2,36) = 3.669, p = 0.0358). However, the posterior post-hoc test did not reveal any statistical significance between the groups, but only a tendency for AD patients to present lower levels when compared to both controls and VaD patients (Tukey’s test C versus AD, p = 0.0639; Tukey’s test VaD versus AD, p = 0.063). No differences were found between controls and VaD patients either (Tukey’s test, p = 0.9337) (Fig. 2A, C).
Decreased levels of MAPs in brain homogenates of VaD and AD patients
Finally, we sought to investigate and characterize the levels of different MAPs and determine whether these would be modified in the same conditions where tubulin levels or its PTMs were also altered.
When the frontal lobe was analyzed, a significant decrease in the level of the heaviest isoform of tau, termed Big tau, which has been hypothesized to be neuroprotective [27] was observed in both VaD and AD samples when compared to controls (Tukey’s test, p = 0.0245 and p = 0.0095, respectively) (Fig. 3A, B). Similarly, MAP2 levels were significantly decreased in AD patients when compared to controls (Tukey’s test, p = 0.0196), and VaD patients presented a tendency for decreased levels that did not reach statistical significance when compared to controls (Tukey’s test, p = 0.0896). MAP6 levels in the frontal lobe were similar among the three analyzed groups (Kruskal-Wallis, p = 0.6557 ns) (Fig. 3A, B).
Fig. 3
Levels of various MAPs in the frontal and temporal lobes of human brain homogenates. A) Human brain homogenates were probed against Big Tau, MAP2C and MAP6. Total protein was used for normalization. B) Immunoblot quantifications in the frontal lobe and (C) immunoblot quantifications in the temporal lobe. 10μg of protein was added on each lane. Data are expressed as the relative ratio of protein/total protein and graphs represent individual values with mean±SEM. One-Way ANOVA with Tukey’s posthoc tests. *p < 0.05, **p < 0.01. N for frontal lobe: C (3–5), V (4–7), A (4–6). N for the temporal lobe: C (13), V (14), A (15). C, controls; V/VaD, vascular dementia; A/AD, Alzheimer’s disease. Please note that the number of analyzed samples (N) for the frontal lobe varies depending on samples available for the assay.
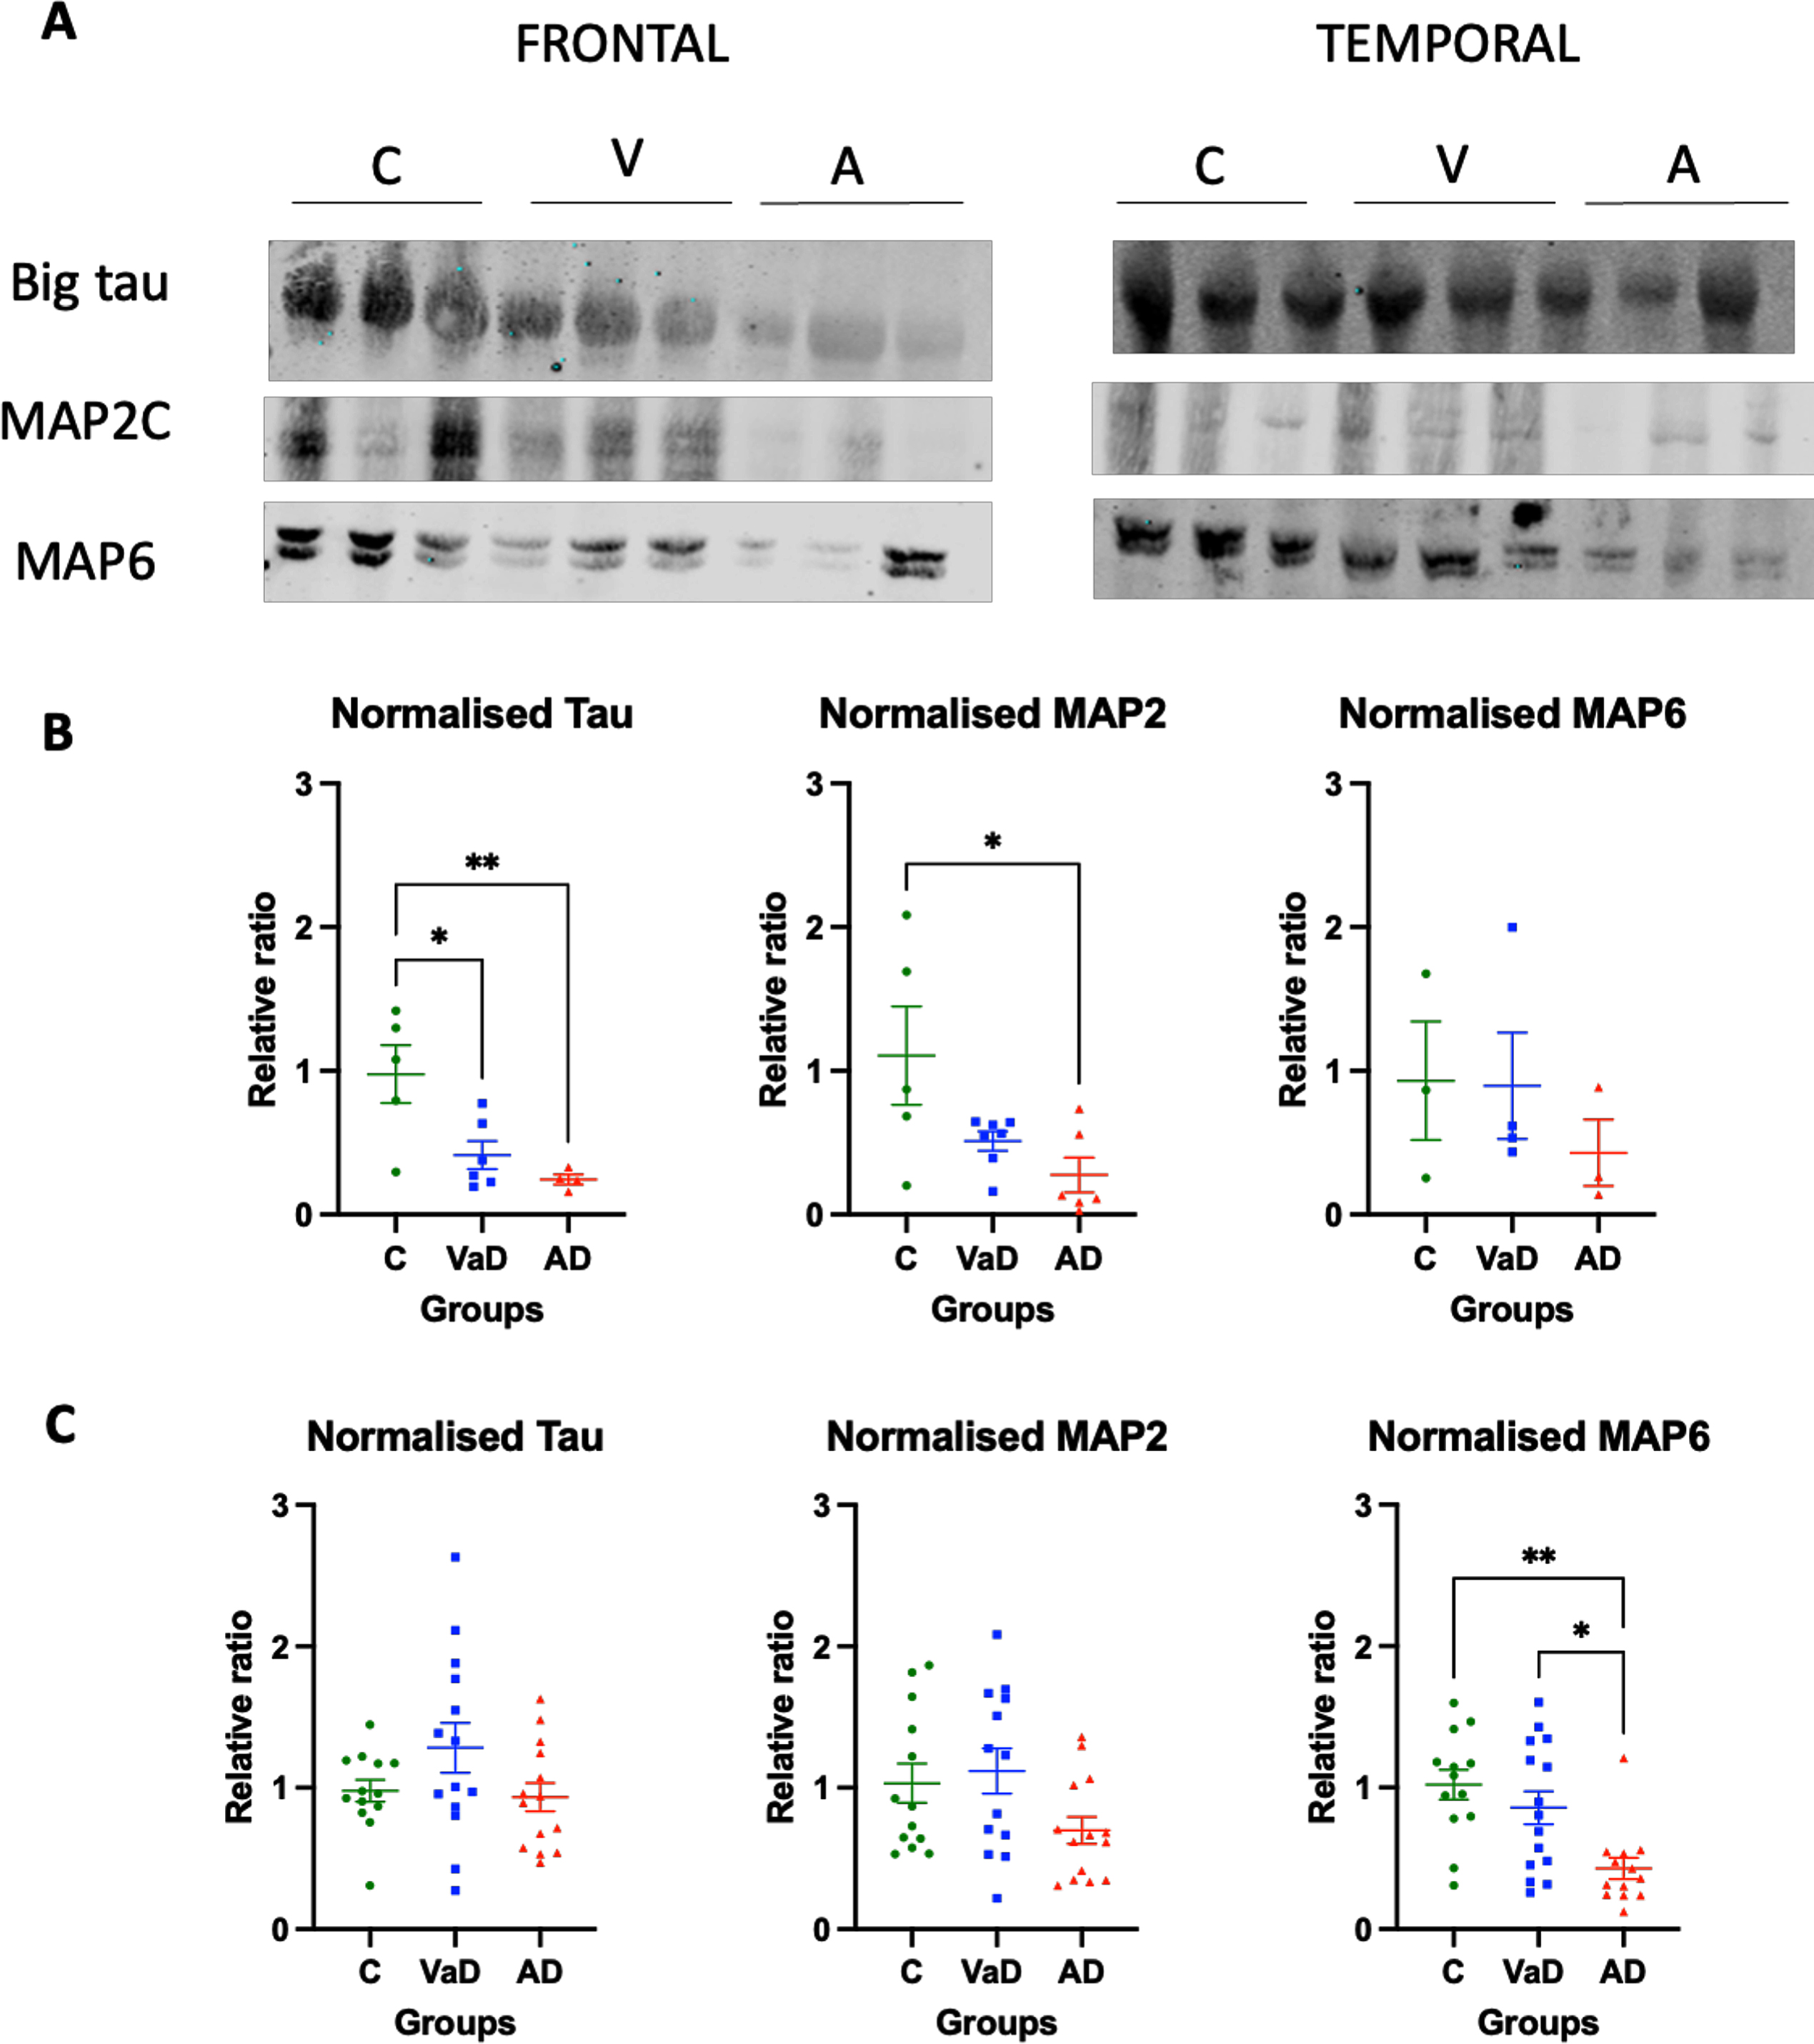
In contrast, in the temporal lobe MAP proteins were differently changed. No statistically significant differences were observed for neither Big tau nor MAP2 proteins between the three groups (one way ANOVA, F (2,38) = 2.277, p = 0.1164 and one ANOVA, F (2,37) = 2.862, p = 0.0699, respectively). AD patients had a tendency for reduced levels of MAP2 when compared to controls, although this did not reach statistical significance (Tukey’s test, p = 0.0753). Furthermore, AD patients had reduced levels of MAP6 when compared to both controls (Dunn’s test, p = 0.0025) and VaD patients (Dunn’s test, p = 0.0207) (Fig. 3A, C).
DISCUSSION
Tubulin PTMs have already been described in human brain homogenates of AD patients [25, 26]. However, no past work has focused on the analysis of tubulin PTMs in VaD. The current study is not only the first one to address this, but also the first to characterize the level of different tubulin isotypes in two neocortical areas (frontal and temporal) in both VaD and AD patients.
Our data indicate that each type of dementia presents with a unique pattern of tubulin expression. This is especially true for the α-tubulin: whereas in the temporal lobe there are higher levels of α-tubulin in VaD patients when compared to controls and AD patients, in AD subjects, α-tubulin levels are significantly decreased in the frontal lobe. As for the measurements of βII- and βIII-tubulin isotypes, similar levels were found in the temporal lobe of controls and VaD patients, while these were significantly reduced in AD patients.
The characterization of different tubulin isotypes and the quantification of their levels are important not only to portray and understand these two types of dementia better, but to possibly validate cellular and animal models of VaD and AD. Even though altered levels of tubulin are neither a hallmark of either of the diseases, nor a critical pathological event, it is possible that correctly recreating its level in disease models may help recapitulate both VaD and AD better.
Increased polyglutamylated tubulin has been established as the direct cause of neurodegeneration in pcd mice, a mouse model that lacks the deglutamylating enzyme CCP1 [24]. There are various reasons for the observed difference between our work and that of Rogowski and colleagues [24]: 1) the species used (mouse versus human), 2) the brain area studied (cerebellum versus hippocampus versus frontal and temporal lobe), and 3) the expression of deglutamylating and polyglutamylating enzymes in the brain areas. However, our work is in support of Zhang et al. [26]. Namely, when Zhang and colleagues measured PolyE-tubulin in human brain homogenates of AD hippocampus, they did not find a significant increase when compared to controls, but just a tendency for increased levels [26]. On the other hand, Rogowski and colleagues found that neurodegeneration observed in the cerebellum of pcd mice is due to the lack of the deglutamylase CCP1 [24]. They also found that in the cortex, the absence of CCP1 is compensated by the CCP6 enzyme, which would explain why we and Zhang et al failed to detect any significant increase in polyglutamylated tubulin in the cortex of human samples [26].
Previous studies in cortical astrocyte cultures from rats have shown that accumulation of tau protein leads to an increase of detyrosinated tubulin [28]. Furthermore, Pianu et al. (2014) described that Aβ1-42 expression led to an increase in detyrosinated tubulin in cellular cultures of murine embryonic fibroblasts [29]. Since the two hallmarks of AD are neurofibrillary tangles and amyloid plaques, an increase in detyrosinated tubulin in AD patients would be expected. In contrast, Zhang et al. (2015) showed that in human samples, detyrosination was decreased in the hippocampus of AD patients. In the current biochemical study, we expand on the latter findings, and report that decreased levels of tubulin detyrosination are not only present in the temporal lobe, but also in the frontal lobe of AD patients when compared to controls. One possibility for the discrepancy between the studies could be that tubulins might be modified differently in neurons and astrocytes. Furthermore, although very informative, cellular models do not present the same complexity as human brain tissue does, and thus, there could be slight disparities in the results.
To date there are no reports on detyrosinated tubulin in VaD patients. Our current study describes that whereas there are no altered levels of detyrosinated tubulin in the temporal lobe of VaD when compared to controls, there is a tendency towards decreased levels in the frontal lobe. In fact, when the levels in both the frontal and temporal lobe were compared, there were significantly lower levels of detyrosinated tubulin in the frontal lobe of both VaD and AD patients (data not shown). This could suggest that the frontal lobe is more sensitive to vascular damage, and thus, neurons die earlier. Were this true, it would be in accordance with Gemmel et al. (2012), who showed that there was a loss of neuronal cells in the dorsolateral prefrontal cortex of patients with VaD [10].
Acetylation is another modification that has recently been shown to cause stabilization of MTs, specifically acetylation on K40 of α-tubulin [30]. Decreased levels of acetylated tubulin in the hippocampus of patients with AD when compared to age-matched controls have been previously described [26]. Nonetheless, the current study failed to confirm any differences between the analyzed groups in both the temporal and the frontal lobes. The difference in the findings between Zhang’s study [26] and our current study may lie in the normalization used. Whereas in the former acetylation was normalized to either GAPDH or α-tubulin [26], the current study normalized it to total protein. Even though both types of normalizations are accepted in the scientific community, they may show a different effect, which highlights the importance of standardizing a specific method of normalization. Furthermore, the sample size used by Zhang and colleagues was limited to 4 controls and 3 AD patients [26], which might be too low to accurately represent people with dementia. Because both studies were using human brain tissue, differences in quality and processing of the samples could also have an impact on the reported results.
When we sought to characterize the different MAPs, AD patients showed lower levels of MAP2 and MAP6 in the frontal and temporal lobes when compared to controls, as well as reduced levels of tau in the frontal lobe. On the other hand, VaD patients presented only decreased levels of MAPs in the frontal lobe. Since these MAPs are related to MT stability, the results might suggest that modifications in tubulin lead to modifications in other proteins, such as tau and MAPs. Unfortunately, the current study was limited to biochemical analysis in human brain homogenates. Future studies should include experiments to explore this further.
In summary, we characterized for the first time the tubulin code in human brain homogenates of VaD and AD. Our results show that the different tubulin isotypes present with different levels depending on the disease and the brain area being studied. Furthermore, our study has shown that there is a decrease in tyrosinated tubulin in the frontal lobe of VaD patients. Whereas human homogenates of AD did not present any significant change in tubulin modifications, they showed lower levels of MAP2 and MAP6 in the frontal and temporal lobe, respectively.
ACKNOWLEDGMENTS
We thank Dr. Raj N. Kalaria (Newcastle University, UK) for providing the human brain homogenates and Dr. Marie-Jo Moutin (Grenoble Institut Neurosciences, France) for providing us with some of the antibodies used in the current study, as well as her insight in tubulin and its modifications.
FUNDING
The financial and material support for this research was provided by a PhD grant by University of Leicester (ES-M/EBM-L).
CONFLICT OF INTEREST
The authors have no conflict of interest to report.
REFERENCES
[1] | Qiu C , Kivipelto M , von Strauss E ((2009) ) Epidemiology of Alzheimer’s disease: Occurrence, determinants, and strategies toward intervention. Dialogues Clin Neurosci 11: , 111–128. |
[2] | Vijayan M , Kumar S , Bhatti JS , Reddy PH ((2017) ) Molecular links and biomarkers of stroke, vascular dementia, and Alzheimer’s disease. Prog Mol Biol Transl Sci 146: , 95–126. |
[3] | Lesne SE , Sherman MA , Grant M , Kuskowski M , Schneider JA , Bennett DA , Ashe KH ((2013) ) Brain amyloid-β oligomers in ageing and Alzheimer’s disease. Brain 136: , 1383–1398. |
[4] | McKhann GM , Knopman DS , Chertkow H , Hyman BT , Jack CR Jr. , Kawas CH , Klunk WE , Koroshetz WJ , Manly JJ , Mayeux R , Mohs RC , Morris JC , Rossor MN , Scheltens P , Carrillo MC , Thies B , Weintraub S , Phelps CH ((2011) ) The diagnosis of dementia due to Alzheimer’s disease: Recommendations from the National Institute on Aging-Alzheimer’s Association workgroups on diagnostic guidelines for Alzheimer’s disease. Alzheimers Dement 7: , 263–269. |
[5] | Iadecola C ((2013) ) The pathobiology of vascular dementia. Neuron 80: , 844–866. |
[6] | McAleese KE , Alafuzoff I , Charidimou A , De Reuck J , Grinberg LT , Hainsworth AH , Hortobagyi T , Ince P , Jellinger K , Gao J , Kalaria RN , Kovacs GG , Kövari E , Love S , Popovic M , Skrobot O , Taipa R , Thal DR , Werring D , Wharton SB , Attems J ((2016) ) Post-mortem assessment in vascular dementia: Advances and aspirations. BMC Med 14: , 129. |
[7] | Kalaria RN ((2018) ) The pathology and pathophysiology of vascular dementia. Neuropharmacology 134: , 226–239. |
[8] | Smith EE ((2017) ) Clinical presentations and epidemiology of vascular dementia. Clin Sci (Lond) 131: , 1059–1068. |
[9] | Kalaria RN , Ballard C ((1999) ) Overlap between pathology of Alzheimer disease and vascular dementia. Alzheimer Dis Assoc Disord 13: (Suppl 3), S115–S123. |
[10] | Gemmell E , Bosomworth H , Allan L , Hall R , Khundakar A , Oakley AE , Deramecourt V , Polvikoski TM , O’Brien JT , Kalaria RN ((2012) ) Hippocampal neuronal atrophy and cognitive function in delayed poststroke and aging-related dementias. Stroke 43: , 808–814. |
[11] | Chi H , Chang HY , Sang TK ((2018) ) Neuronal cell death mechanisms in major neurodegenerative diseases. Int J Mol Sci 19: , 3082. |
[12] | Arendt T , Brückner MK , Morawski M , Jäger C , Gertz HJ ((2015) ) Early neurone loss in Alzheimer’s disease: Cortical or subcortical? Acta Neuropathol Commun 3: , 10. |
[13] | Bussière T , Giannakopoulos P , Bouras C , Perl DP , Morrison JH , Hof PR ((2003) ) Progressive degeneration of nonphosphorylated neurofilament protein-enriched pyramidal neurons predicts cognitive impairment in Alzheimer’s disease: Stereologic analysis of prefrontal cortex area 9. J Comp Neurol 463: , 281–302. |
[14] | Martínez-Pinilla E , Ordóñez C , Del Valle E , Navarro A , Tolivia J ((2016) ) Regional and gender study of neuronal density in brain during aging and in Alzheimer’s disease. Front Aging Neurosci 8: , 213. |
[15] | Kril JJ , Patel S , Harding AJ , Halliday GM ((2002) ) Patients with vascular dementia due to microvascular pathology have significant hippocampal neuronal loss. J Neurol Neurosurg Psychiatry 72: , 747–751. |
[16] | Mukaetova-Ladinska EB , Abdel-All Z , Mugica ES , Li M , Craggs LJ , Oakley AE , Honer WG , Kalaria RN ((2015) ) Tau proteins in the temporaland frontal cortices in patients with vascular dementia. JNeuropathol Exp Neurol 74: , 148–157. |
[17] | Li M , Mukaetova-Ladinska EB , Kalaria RN ((2014) ) Tau protein changes in vascular dementia (Thesis). University of Newcastle. |
[18] | Horio T , Murata T ((2014) ) The role of dynamic instability in microtubule organization. Front Plant Sci 5: , 511. |
[19] | Mandelkow E , Mandelkow EM ((1995) ) Microtubules andmicrotubule-associated proteins. Curr Opin Cell Biol 7: , 72–81. |
[20] | Carnwath T , Mohammed R , Tsiang D ((2018) ) The direct and indirect effects of α-synuclein on microtubule stability in the pathogenesis of Parkinson’s disease. Neuropsychiatr Dis Treat 14: , 1685–1695. |
[21] | Santiago-Mujika E , Luthi-Carter R , Giorgini F , Kalaria RN , Mukaetova-Ladinska EB ((2021) ) Tubulin and tubulin posttranslational modifications in Alzheimer’s disease and vascular dementia. Front Aging Neurosci 13: , 730107. |
[22] | Li L , Yang XJ ((2015) ) Tubulin acetylation: Responsible enzymes, biological functions and human diseases. Cell Mol Life Sci 72: , 4237–4255. |
[23] | Fernández-Barrera J , Correas I , Alonso MA ((2018) ) Age-relatedneuropathies and tubulin acetylation. Aging (Albany NY) 10: , 524–525. |
[24] | Rogowski K , van Dijk J , Magiera MM , Bosc C , Deloulme JC , Bosson A , Peris L , Gold ND , Lacroix B , Bosch Grau M , Bec N , Larroque C , Desagher S , Holzer M , Andrieux A , Moutin MJ , Janke C ((2010) ) A family of protein-deglutamylating enzymes associated with neurodegeneration. Cell 143: , 564–578. |
[25] | Magiera MM , Bodakuntla S , Žiak J , Lacomme S , Marques Sousa P , Leboucher S , Hausrat TJ , Bosc C , Andrieux A , Kneussel M , Landry M , Calas A , Balastik M , Janke C ((2018) ) Excessive tubulin polyglutamylation causes neurodegeneration and perturbs neuronal transport. EMBO J 37: , e100440. |
[26] | Zhang F , Su B , Wang C , Siedlak SL , Mondragon-Rodriguez S , Lee HG , Wang X , Perry G , Zhu X ((2015) ) Posttranslational modifications of α-tubulin in Alzheimer disease. Transl Neurodegener 4: , 9. |
[27] | Fischer I , Baas PW ((2020) ) Resurrecting the mysteries of big tau. Trends Neurosci 43: , 493–504. |
[28] | Yoshiyama Y , Zhang B , Bruce J , Trojanowski JQ , Lee VM ((2003) ) Reduction of detyrosinated microtubules and Golgi fragmentation are linked to tau-induced degeneration in astrocytes. J Neurosci 23: , 10662–10671. |
[29] | Pianu B , Lefort R , Thuiliere L , Tabourier E , Bartolini F ((2014) ) The Aβ1-42 peptide regulates microtubule stability independently of tau. J Cell Sci 127: , 1117–1127. |
[30] | Eshun-Wilson L , Zhang R , Portran D , Nachury MV , Toso DB , Löhr T , Vendruscolo M , Bonomi M , Fraser JS , Nogales E ((2019) ) Effects of α-tubulin acetylation on microtubule structure and stability. Proc Natl Acad Sci U S A 116: , 10366–10371. |
[31] | Govindpani K , McNamara LG , Smith NR , Vinnakota C , Waldvogel HJ , Faull RL , Kwakowsky A ((2019) ) Vascular dysfunction in Alzheimer’s disease: A prelude to the pathological process or a consequence of it? J Clin Med 8: , 651. |
[32] | Lewis H , Beher D , Cookson N , Oakley A , Piggott M , Morris CM , Jaros E , Perry R , Ince P , Kenny RA , Ballard CG , Shearman MS , Kalaria RN ((2006) ) Quantification of Alzheimer pathology in ageing and dementia: Age-related accumulation of amyloid-beta(42) peptide in vascular dementia. Neuropathol Appl Neurobiol 32: , 103–118. |
[33] | Mukaetova-Ladinska EB , Xuereb JH , Garcia-Sierra F , Hurt J , Gertz HJ , Hills R , Brayne C , Huppert FA , Paykel ES , McGee MA , Jakes R , Honer WG , Harrington CR , Wischik CM ((2009) ) Lewy body variant of Alzheimer’s disease: Selective neocortical loss of t-SNARE proteins and loss of MAP2 and alpha-synuclein in medial temporal lobe. ScientificWorld Journal 9: , 1463–1475. |

