
Temporal Cortical Thickness and Cognitive Associations among Typical and Atypical Phenotypes of Alzheimer’s Disease
Abstract
Background:
The hippocampus and temporal lobe are atrophic in typical amnestic Alzheimer’s disease (tAD) and are used as imaging biomarkers in treatment trials. However, a better understanding of how temporal structures differ across atypical AD phenotypes and relate to cognition is needed.
Objective:
Our goal was to compare temporal lobe regions between tAD and two atypical AD phenotypes (logopenic progressive aphasia (LPA) and posterior cortical atrophy (PCA)), and assess cognitive associations.
Methods:
We age and gender-matched 77 tAD participants to 50 LPA and 27 PCA participants, all of which were amyloid-positive. We used linear mixed-effects models to compare FreeSurfer-derived hippocampal volumes and cortical thickness of entorhinal, inferior and middle temporal, and fusiform gyri, and to assess relationships between imaging and memory, naming, and visuospatial function across and within AD phenotype.
Results:
Hippocampal volume and entorhinal thickness were smaller bilaterally in tAD than LPA and PCA. PCA showed greater right inferior temporal and bilateral fusiform thinning and LPA showed greater left middle and inferior temporal and left fusiform thinning. Atypical AD phenotypes differed with greater right hemisphere thinning in PCA and greater left hemisphere thinning in LPA. Verbal and visual memory related most strongly to hippocampal volume; naming related to left temporal thickness; and visuospatial related to bilateral fusiform thickness. Fewer associations remained when examined within AD group.
Conclusion:
Atypical AD phenotypes are associated with greater thinning of lateral temporal structures, with relative sparing of medial temporal lobe, compared to tAD. These findings may have implications for future clinical trials in AD.
INTRODUCTION
Structural magnetic resonance imaging (MRI) allows for the assessment of neurodegeneration (N) in Alzheimer’s disease (AD) via cortical thickness and volume, which along with pathologic amyloid-β (A) and tau (T) deposition are elements of the 2018 National Institute on Aging –Alzheimer’s Association Research Framework (AT/N Model) [1]. Typical amnestic AD (tAD) is associated with atrophy of the hippocampus [2] and cortical thinning across temporal, parietal, and frontal regions [3–5]. Temporal cortex is particularly affected in tAD and a temporal lobe meta-region of interest (ROI) has recently been used to capture the regions that have the most tau deposition in tAD [6–8]. The temporal meta-ROI includes the entorhinal cortex, amygdala, parahippocampal gyrus, fusiform, inferior temporal, and middle temporal regions [6]. Recent investigations using this temporal meta-ROI have demonstrated its value as a biomarker relating to disease progression and correlations with cognitive outcomes, particularly memory, in tAD [7, 8]. Imaging measures from the temporal lobe are also often utilized as outcome measures for clinical treatment trials in tAD [8].
The temporal lobe is also atrophic in patients with atypical clinical presentations of AD, including logopenic progressive aphasia (LPA), in which patients present with hesitant speech, anomia and poor sentence repetition [9], and posterior cortical atrophy (PCA), in which patients present with prominent visuospatial and perceptual problems [10, 11]. Cortical thinning and atrophy have been observed in the lateral temporal lobe in both LPA [12–16] and PCA [15, 17, 18], although there appears to be regional variability in temporal lobe involvement across LPA, PCA, and tAD [15, 16, 18–20]. Prior studies often focused on one atypical AD group compared to controls or tAD, and less attention has been paid specifically to evaluating temporal lobe regions in atypical AD compared to one another. A better understanding of how temporal thinning patterns differ across typical and atypical AD is important since the findings may help inform the appropriateness of temporal lobe focused imaging biomarkers for clinical treatment trials that include both typical and atypical AD.
There is evidence that different temporal lobe regions may relate to cognitive symptoms across the AD clinical spectrum, and that the defined primary cognitive domain according to phenotype may not always separate out according to syndromic expectation. Impaired episodic memory performance is the hallmark cognitive feature of tAD [21] and has been associated with atrophy of the hippocampus. By definition, memory cannot be the primary cognitive domain effected in atypical AD; however, memory deficits may co-occur [22–24]. Indeed, when typical and atypical AD are directly compared, the expected poorer episodic memory in tAD is not always found [23, 25–27]. Whether verbal or visual memory is assessed among AD variants may contribute to different conclusions [24], and therefore a thorough assessment of episodic memory in AD should include both modalities. Similarly, despite primary language deficit in LPA, object naming performance is at times comparable when directly compared to other AD variants [24, 26]. Spatial reasoning is one of the primary cognitive deficits in PCA and is more commonly impaired in PCA relative to other AD variants [19, 23, 27], though comparable impairments have also been shown [26]. Studies have also found conflicting results regarding the neuroanatomic correlates of memory impairment in atypical AD. In LPA, one study found correlations in the medial temporal lobe [24], but another found correlations with the middle temporal gyrus [28]. In PCA, memory has been associated with hippocampal volumes, as is commonly found in tAD [19]. Object naming deficits are commonly found in the context of temporal lobe changes though the specific regions identified is mixed. For example, the left superior temporal lobe gyrus has been associated with naming deficits in LPA and tAD [12], as has the middle temporal lobe though not the superior temporal lobe in a separate study with similar disease groups [28]. In a recent study combining tAD and atypical AD, the left lateral and inferior temporal and medial temporal, but not entorhinal cortices were associated with naming deficits [29]. Notably, in the context of naming deficits, right temporal lobe atrophy particularly involving the inferior temporal gyrus as also been shown in tAD [12] and when tAD and atypical AD are combined [29]. The inferior temporal lobe has also been associated with spatial object perception in PCA [17]. These cognitive associations with temporal lobe regions occur within atypical AD phenotypes that tend to present with left greater than right temporoparietal atrophy in LPA [16] and bilateral posterior cortical atrophy, including posterior temporal more so in the right hemisphere in PCA [18]. Given the expected laterality differences in the atrophy patterns associated with cognition across the AD spectrum, evaluation of these cortical and cognitive relationships when comparing tAD to atypical AD should include both hemispheres.
Here, we included individuals on the AD continuum such that all participants were amyloid-β positive. We aimed to determine whether tAD and atypical AD 1) differed on structural measures, specifically hippocampal atrophy and cortical thickness of temporal regions, and 2) whether cognitive performances differed between and within groups and correlated with the temporal lobe measures. For the first aim, we hypothesized that tAD would show hippocampal atrophy compared to the atypical variants, that LPA would show more atrophy in regions within the left temporal lobe and that PCA would show more atrophy in regions within the right temporal lobe. For the second aim, we hypothesized that language would be associated with predominantly left lateral temporal cortical thickness, predominantly in the LPA group, that the visuospatial function would most strongly correlate with posterior temporal fusiform regions predominantly in the PCA group, and that memory performances would most strongly correlate with medial temporal regions, particularly in the tAD group.
METHODS
Standard protocol approvals and patient consent
The Mayo Clinic Institutional Review Board approved this study. All participants provided written informed consent before participating in the research.
Procedures and participants
All participants had a positive amyloid-PET scan described below, thus confirming they fall on the AD continuum. We age- and sex-matched 77 participants (96% White, 97% Non-Hispanic) from the Mayo Clinic Alzheimer’s Disease Research Center (ADRC, recruited from 2005–2015) who met criteria for tAD [30] to 27 participants who met criteria for PCA [11] and 50 who met criteria for LPA [9] recruited from the Mayo Clinic Neurodegenerative Research Group (NRG) between 2007 and 2015. We excluded those who did not speak English as their primary language and who did not have an informant who could provide an independent evaluation of the patient’s functioning and history of impairment. Participants were also excluded from the study if they had concurrent illnesses that could account for the clinical deficits, such as traumatic brain injury, or if there were conditions that may confound brain imaging studies (e.g., structural abnormalities).
Neuropsychological testing
All participants underwent a comprehensive neuropsychological evaluation. Tests included in the present analysis were selected to assess the primary cognitive domains affected in each of the three groups, and included: 1) memory (Wechsler Memory Scale - Revised (WMR-R) or Third Edition (WMS-III) Logical Memory (LM) and Visual Reproduction (VR) delayed recalls [31, 32]; the Rey Auditory Verbal Learning Test (AVLT) delayed recall [33]), 2) language (15-Item Boston Naming Test (BNT) [34] or 60-Item Boston Naming Test [35]), and 3) visuospatial function (Rey-Osterreith Complex Figure Test copy trial [36]). To account for different versions of LM and VR due to participants coming from different study protocols, we used published scaled score norms. To account for different versions of the BNT, we used percentage correct. Participants also completed the Mini-Mental State Examination (MMSE) as a brief measure of global cognition [19].
Neuroimaging
All patients were scanned on a PET/CT scanner (GE Healthcare) while operating in 3D mode. Patients were injected with Pittsburgh Compound B (PiB) of approximately 628 MBq (range, 385–723 MBq) and after a 40-to-60-min uptake period a 20-min PiB scan was obtained. All patients also underwent a 3T volumetric head MRI within two days of the PiB-PET scan, which included a 3D magnetization prepared rapid acquisition gradient echo sequence (MPRAGE). The parameters were as follows: TR/TE/T1, 2300/3/900 ms; flip angle 8 degrees, 26 cm field of view (FOV); 256×256 in-plane matrix with a phase FOV of 0.94, and slice thickness of 1.2 mm. All MPRAGE scans underwent corrections for intensity inhomogeneity and gradient unwarping before analysis. The PiB-PET scans were registered to the corresponding MPRAGE scan using a 6 degrees-of-freedom registration in SPM12. The Mayo Clinic Adult Lifespan Template (MCALT) (https://www.nitrc.org/projects/mcalt/) was then transformed into the native space of each MPRAGE using ANTs software [38]. Median Aβ uptake was calculated for the following regions-of-interest (ROIs) defined using MCALT: inferior parietal, superior parietal, supramarginal gyrus, angular gyrus, cingulate (anterior, mid, posterior, and retrosplenial), precuneus, superior frontal, middle frontal, orbitofrontal, inferior frontal (operculum+triangularis), medial frontal, fusiform, lateral temporal (inferior, middle, and superior temporal gyri + Heschl), and temporal pole. Uptake was calculated from the grey and white matter in each region and divided by uptake in the cerebellar crus grey matter to calculate standard uptake value ratios (SUVRs). A global Aβ SUVR was calculated as the weighted median average from the ROIs. Positive amyloid-PET was determined based on a global SUVR ≥1.48 [6]. FreeSurfer (v5.3) software was used to derive regional cortical thickness and hippocampal volume [39]. Cortical thickness was calculated for bilateral entorhinal, inferior temporal, middle temporal, and fusiform regions, which were defined using the Desikan parcellation scheme [40]. We adjusted hippocampal volumes for total intracranial volume (TIV) to account for individual difference in brain size. Cortical thickness values were not adjusted for TIV [4]. Imaging analysts manually inspected hippocampal masks, FreeSurfer segmentations and TIV for quality.
Statistical analysis
We used IBM SPSS Version 21 for Windows to perform statistical analyses on basic clinical and demographic variables. Because the neuropsychological data were not normally distributed, we used non-parametric Kruskal-Wallis tests for group comparisons and Mann Whitney U Tests to determine individual group differences as appropriate. We used parametric Chi-Square and one-way analysis of variance (ANOVA) and Tukey HSD following a significant ANOVA to assess demographic features across groups as appropriate, with a p value < 0.05, to determine clinical significance. We used three linear mixed-effects models to address the main questions of interest in this study. The first model predicted log-transformed imaging value (grey matter thickness in each region except the hippocampus where we used TIV-adjusted volume) predicted by fixed effects for each diagnosis in each region and a random intercept per person to account for generally higher or lower imaging values across regions within a person. From this model, we can answer the question of whether baseline imaging values are different across diagnosis groups.
In a second model, we predict again log-transformed imaging value, this time by an intercept per clinical test per region, a slope per clinical test per region, and a regional age adjustment. We also again included a random intercept per person in this model to account for the multiple observations per person. Our third model was an extension of this second model, including diagnosis-specific fixed effects. These two models answer two related but different questions; the second model addresses whether there is a relationship between clinical score and imaging across diagnosis groups and the third model assesses whether these relationships are specific to each diagnosis group. Naturally, having split the sample into multiple smaller groups, the uncertainty around each effect estimate will be highest in this third model but allow assessment of whether diagnosis groups may differ or share a relationship between imaging and clinical values.
Hierarchical models are an elegant solution to analyzing these rich, multimodal data. They use data efficiently by including multiple observations per person in a single model and proactively accounting for the problem of multiple comparisons by using helpful bias to shrink estimates, allocate uncertainty across random effects (dependent data points), and answer multiple questions simultaneously thereby avoiding the problem of multiple comparisons [41, 42]. These models were fit using the statistical software R version 4.0.3 [43] using the lme4 package version 1.1-27.1 [44].
RESULTS
The groups did not differ on age at scan, age at onset, education, or PiB SUVR (ps > 0.05). LPA had a shorter illness duration (M = 3.4, SD = 1.4) than tAD (M = 4.6, SD = 2.6) and PCA (M = 5.0, SD = 2.4) (F (2, 146) = 5.76, p = 0.004, η2 = 0.07) (Table 1).
Table 1
Demographic characteristics and neuropsychological test scores
| tAD | LPA | PCA | Total | p | |
| (n = 77) | (n = 50) | (n = 27) | (N = 154) | ||
| Age (y) | 68.2 (9.4) | 66.3 (8.7) | 63.9 (6.7) | – | 0.080 |
| Education (y) | 15.2 (2.9) | 15.6 (2.7) | 14.9 (2.7) | – | 0.051 |
| Sex | 41 (53%) | 27 (54%) | 14 (52%) | 0.997 | |
| Illness duration (y) | 4.6 (2.6) | 3.4 (1.4) | 5.0 (2.8) | – | 0.004a |
| Age at onset (y) | 62.7 (9.2) | 62.7 (8.4) | 58.9 (6.0) | – | 0.100 |
| PiB Ratio | 2.2 (.24) | 2.2 (.24) | 2.3 (.35) | – | 0.240 |
| MMSE | 21.3 (4.7) | 22.0 (6.2) | 23.2 (6.2) | – | 0.290 |
| AVLT Delay (ss) | 3.6 (1.8) | 5.9 (3.5) | 5.6 (3.8) | 4.8 (3.1) | 0.001b |
| Logical Memory Delay (ss) | 3.4 (2.1) | 5.2 (3.4) | 5.5 (3.9) | 4.4 (3.1) | 0.002b |
| Visual Reproduction Delay (ss) | 2.8 (2.0) | 6.9 (3.4) | 5.8 (2.2) | 5.1 (3.3) | < 0.001b |
| BNT % Correct | 77.6 (15.8) | 48.1 (28.8) | 77.2 (24.2) | 67.7 (26.2) | < 0.001a |
| Rey-O Figure Copy (/36) | 20.4 (10.4) | 17.7 (11.1) | 4.2 (4.2) | 16.4 (11.4) | < 0.001c |
Values reported are means (standard deviations). tAD, typical amnestic Alzheimer’s disease; LPA, logopenic primary progressive aphasia; PCA, posterior cortical atrophy; PiB, Pittsburgh Compound B; AVLT, Rey Auditory Verbal Learning Test; Rey-O, Rey Osterrieth Complex Figure Test; ss, scaled score (1-19); MMSE, Mini-Mental State Examination (/30). Contrasts: aLPA < Typical AD and PCA. bTypical AD < LPA and PCA. cPCA < Typical AD and LPA.
Neuropsychological testing
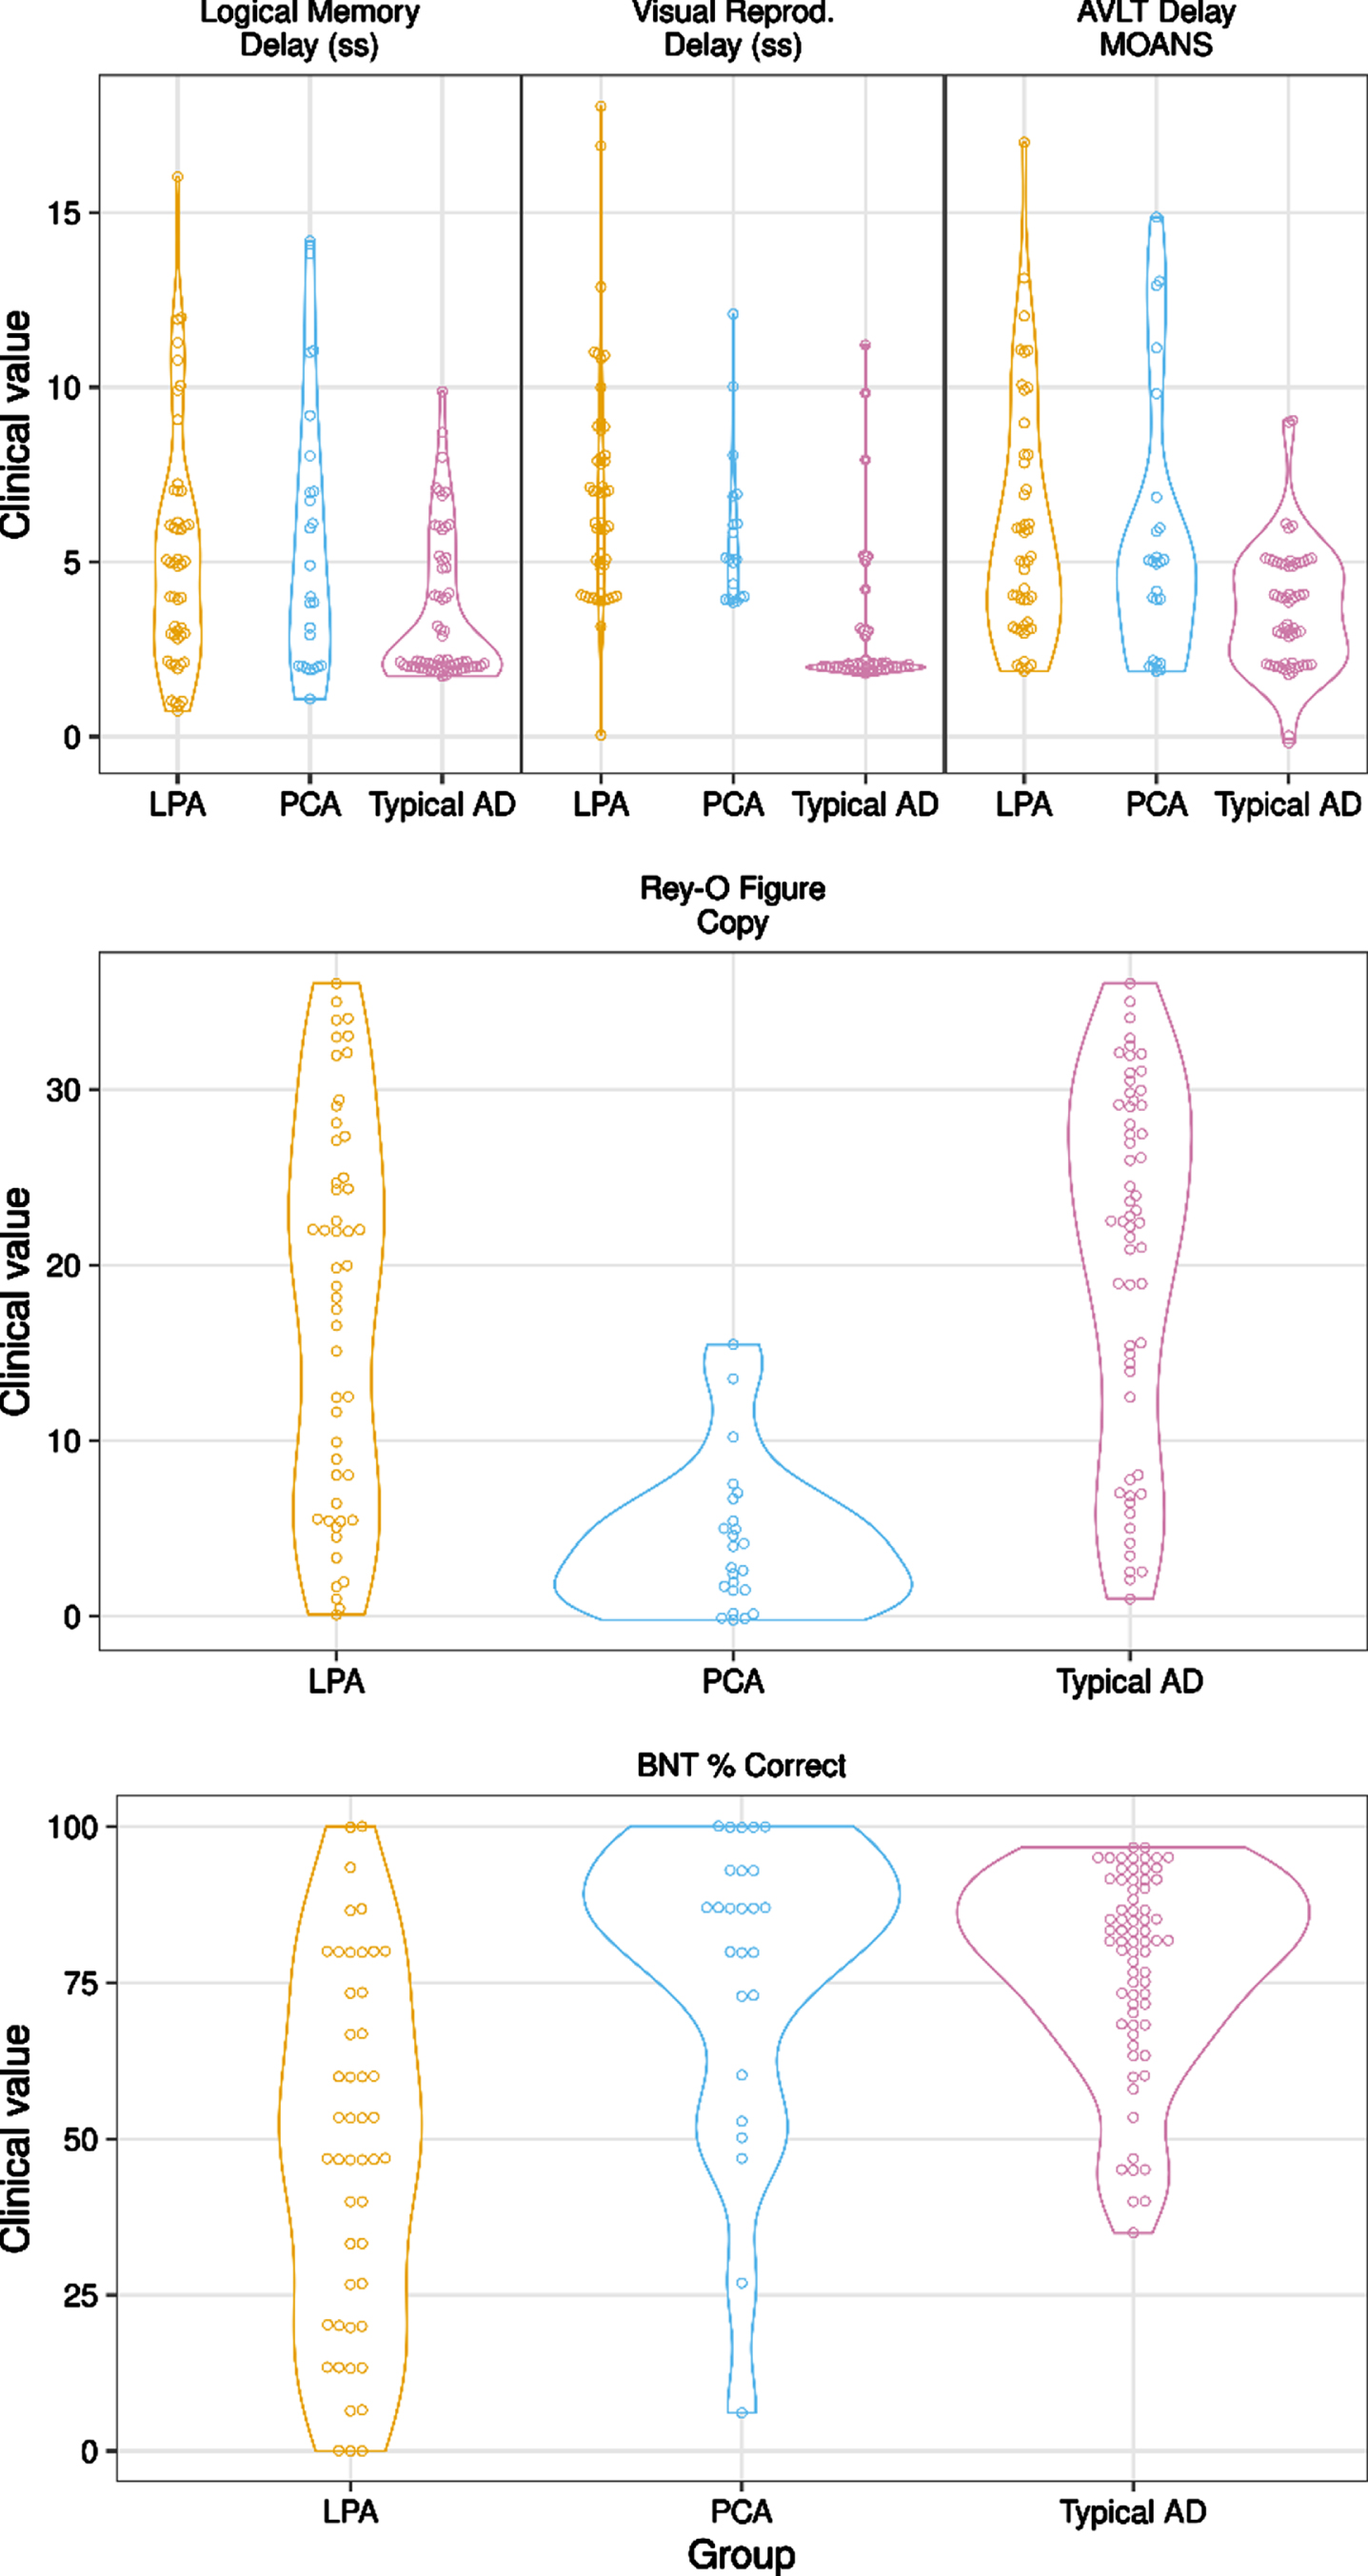
MMSE scores did not differ among groups [F (2, 150) = 1.24, p = 0.29]. Although all AD groups scored below average on memory measures, there was a significant difference in performance for all memory measures (LM: χ2 (2, n = 140) = 12.71, p = 0.002; VR: χ2 (2, n = 113) = 54.85, p < 0.001; AVLT: χ2 (2, n = 130) = 13.10, p = 0.001). Post-hoc testing revealed that tAD had significantly worse performance across all verbal and visual memory measures relative to LPA and PCA (ps < 0.032). The Boston Naming Test differed among AD type (χ2 (2, n = 144) = 35.05, p < 0.001), with LPA performing significantly worse relative to tAD and PCA (ps < 0.001). Finally, visuospatial function as measured by the Rey-Osterrieth Complex Figure Test differed among AD type (χ2 (2, n = 132) = 35.95, p < 0.001), with PCA performing significantly worse than tAD and LPA (ps < 0.001). Please see Table 1 and Fig. 1 for neuropsychological group differences.
Fig. 1
Cognitive Performances Among Groups. Note: Typical AD = Amnestic Alzheimer’s disease. LPA = Logopenic Primary Progressive. Aphasia. PCA = Posterior Cortical Atrophy. LM =Logical Memory. VR = Visual Reproduction. AVLT = Auditory Verbal Learning Test. BNT = Boston Naming Test. Copy Score is Rey-Osterrieth Complex Figure Test, Copy Trial.
Neuroimaging
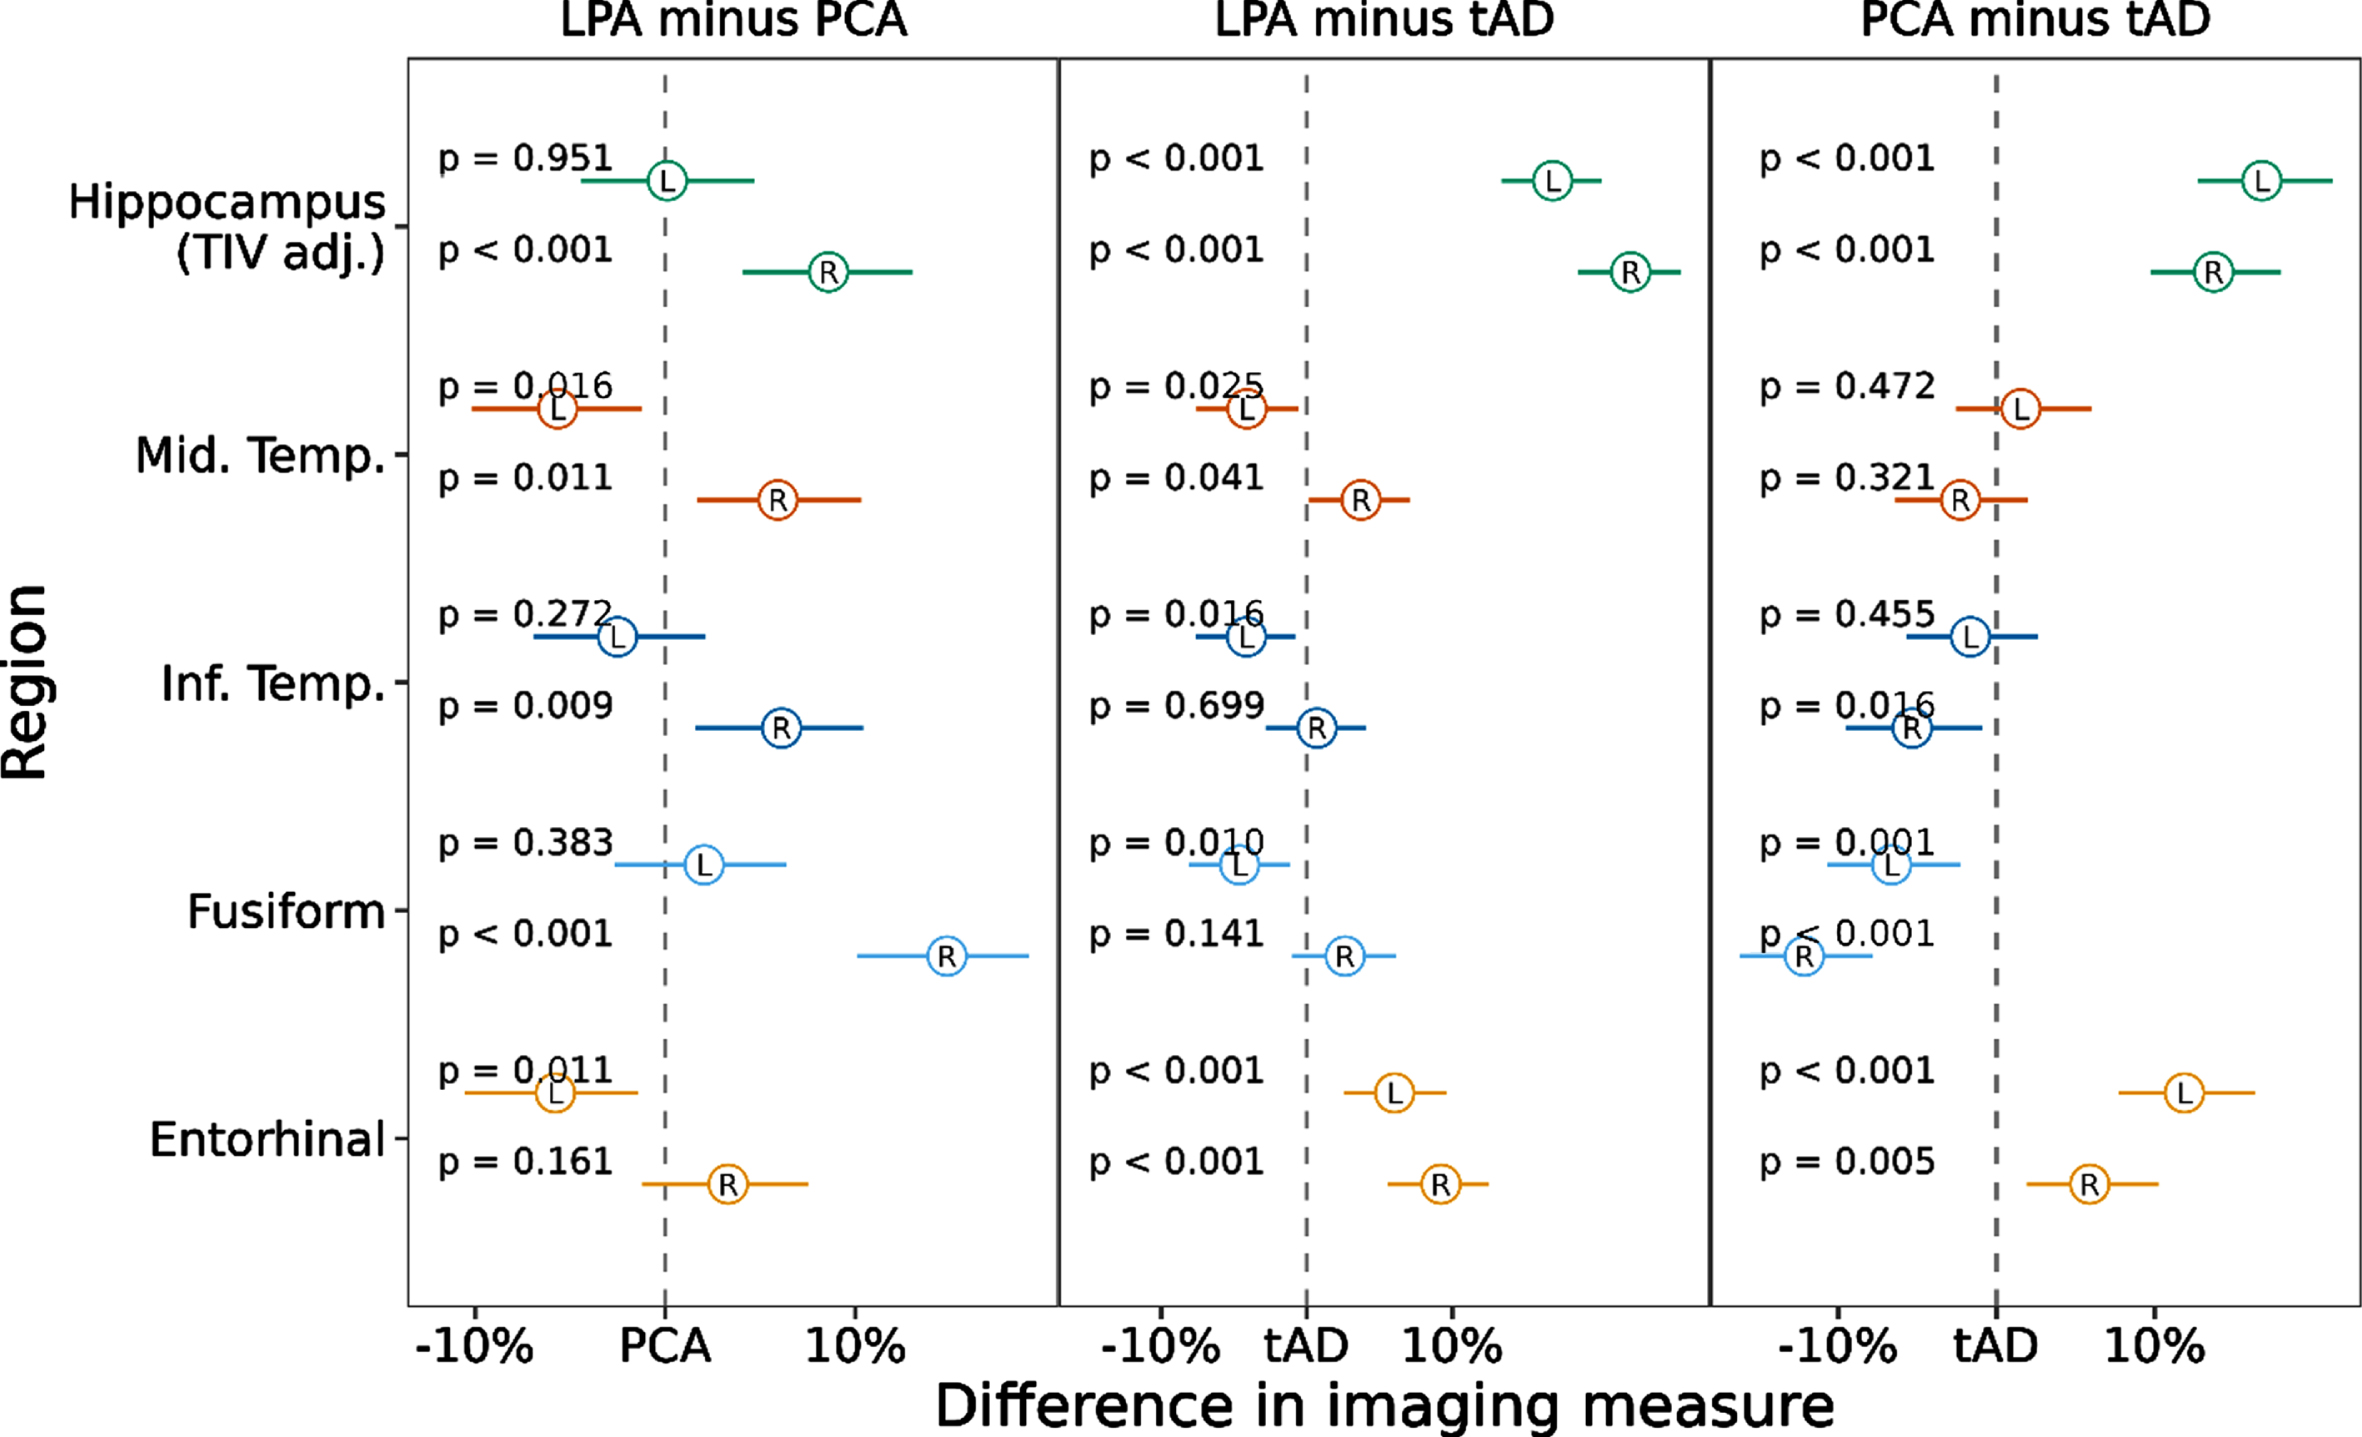
To examine imaging ROIs by diagnostic group, we first ran a model predicting imaging ROI value by group. We then calculated pairwise comparisons to assess whether volume/thickness of each region, examining left and right hemispheres separately, differed between tAD and atypical AD (see Fig. 2). We assessed left and right hemispheres separately given these are not equivocally bilateral diseases. Hippocampal volumes and entorhinal cortex thickness were smaller in tAD compared to both atypical AD variants (ps < 0.001). Right hippocampal volume was smaller in PCA compared to LPA (p < 0.001). Compared to tAD, LPA showed greater thinning of the left middle (p = 0.025) and inferior temporal (p = 0.016) and left fusiform gyri (p = 0.010) but were relatively spared in the right middle temporal thickness (p = 0.041). PCA compared to the tAD group showed greater thinning of the right inferior temporal lobe (p = 0.016) and bilateral fusiform (ps≤0.001). When comparing the atypical variants to one another, PCA showed greater thinning of the right hippocampus (p < 0.001), middle (p = 0.011), and inferior temporal (p = 0.009) regions and right fusiform (p < 0.001) compared to LPA. In contrast, LPA showed greater thinning of the left middle temporal (p = 0.016) and left entorhinal cortex (p = 0.011) compared to PCA (Fig. 2).
Fig. 2
Linear Mixed-effects model results showing pairwise comparisons of temporal lobe ROIs between AD variants. Notes: Values represent estimated effect (circle) and 95% confidence interval (line) for each region and hemisphere, scaling volume to have effects in % change. tAD = Typical Alzheimer’s disease. LPA = Logopenic Primary Progressive Aphasia. PCA = Posterior Cortical Atrophy.
Associations between neuroimaging and neuropsychological performance
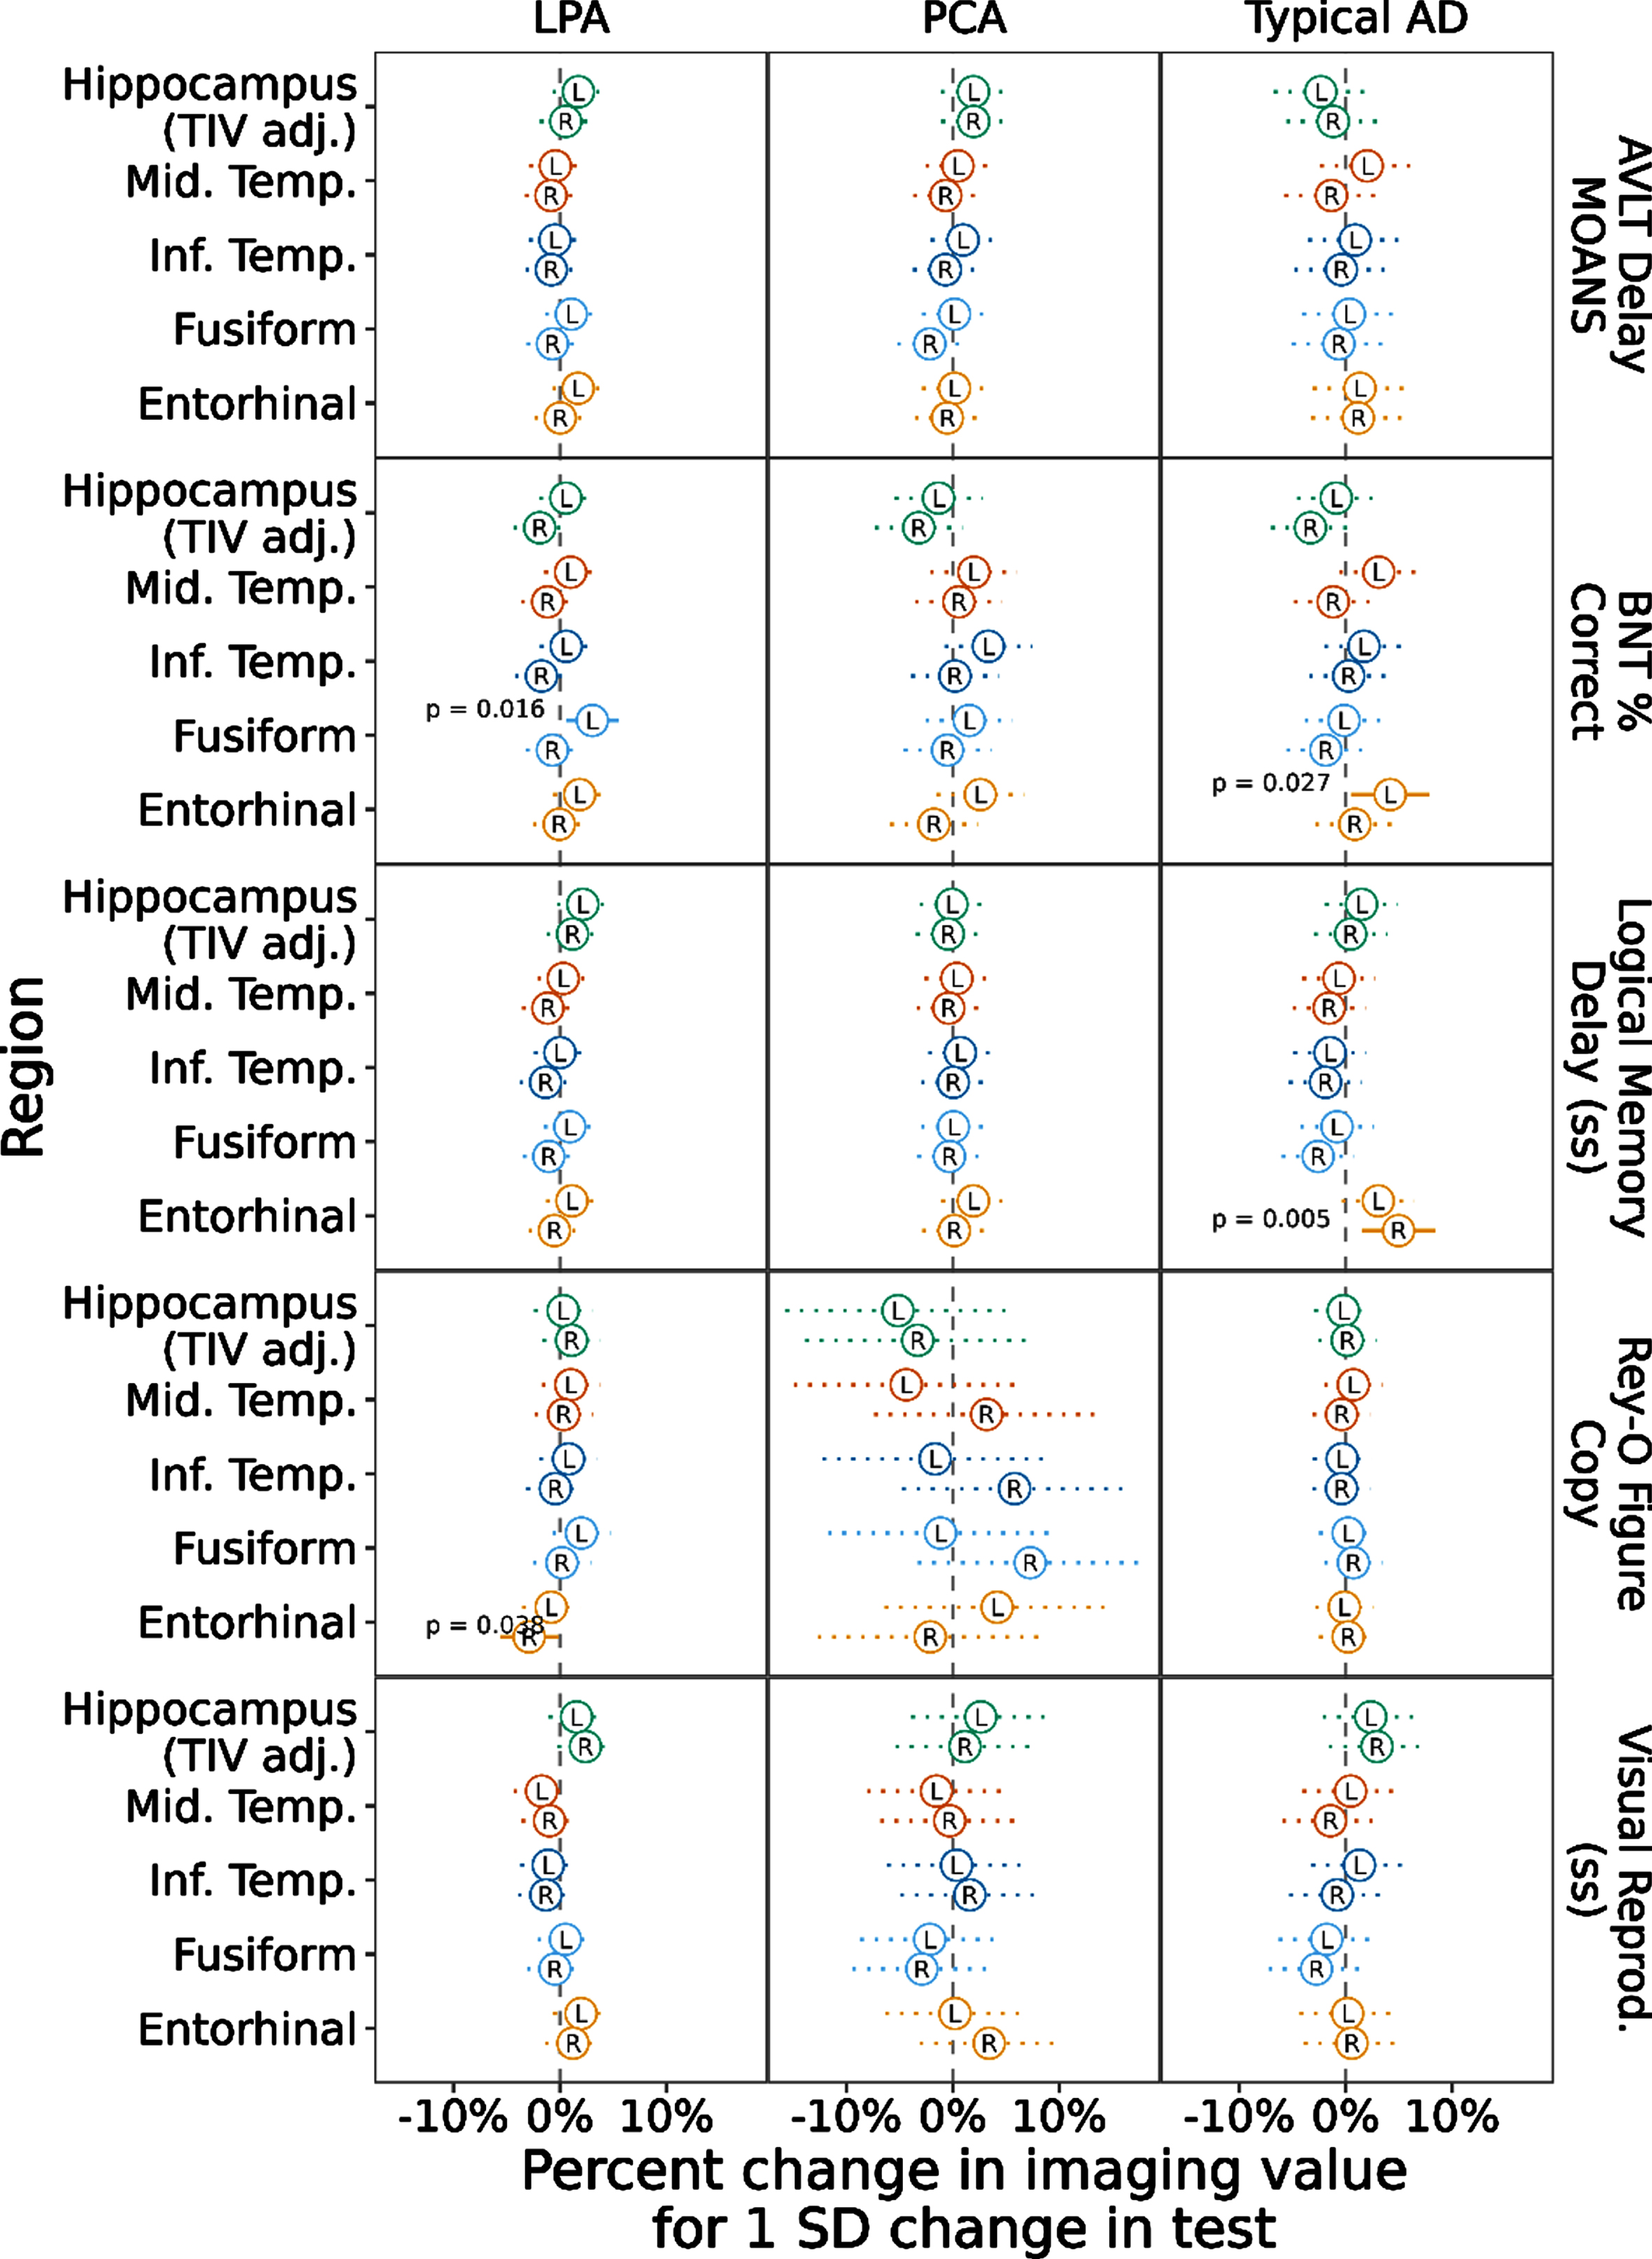
To assess the relationship between cognitive performance and neurodegeneration, we ran a mixed model with the cognitive scores predicting imaging values of the regions across the whole cohort regardless of diagnostic group (Fig. 3). This model showed a positive association with left and right hippocampal volume for all three memory tests (AVLT Delay, Logical Memory Delay, Visual Reproduction Delay ps≤0.002). Another way to view these data, for the AVLT Delay score for example, is to consider that as the memory score decreases by 1 SD (the standard deviation of this score across this data set), hippocampal volume is expected to decrease by a little more than 3% in the left and right hippocampus. Object naming performance showed a positive association with left middle and inferior temporal (ps < 0.001) and left fusiform (p < 0.001) and entorhinal thickness (p = 0.018), though somewhat surprisingly negatively correlated with hippocampal volume (ps≤0.003). Spatial reasoning performance was most strongly positively correlated with fusiform thickness, particularly on the right (p = 0.002, left fusiform: p = 0.032). Finally, we ran a mixed model with the cognitive scores predicting imaging values of the regions by diagnostic group (Fig. 4). This model resulted in most of the previous associations not being retained. In tAD, the left entorhinal cortex was associated with naming performance (p = 0.027) and the right entorhinal cortex was associated with Logical Memory Recall (p = 0.005). In LPA, the left fusiform was associated with naming performance (p = 0.016) and the right entorhinal cortex was associated with spatial reasoning (p = 0.038). No associations remained in PCA (see Supplementary Table 1).
Fig. 3
Linear Mixed-effects model with cognitive scores predicting temporal lobe ROI values across all AD patients. Notes: Values represent estimated effect (circle) and 95% confidence interval (line) for each test in each region and hemisphere, scaling volume to have effects in % change and centering and scaling the predictors to be on the SD scale. Typical AD = Typical Amnestic Alzheimer’s disease. LPA = Logopenic Primary Progressive Aphasia. PCA = Posterior Cortical Atrophy
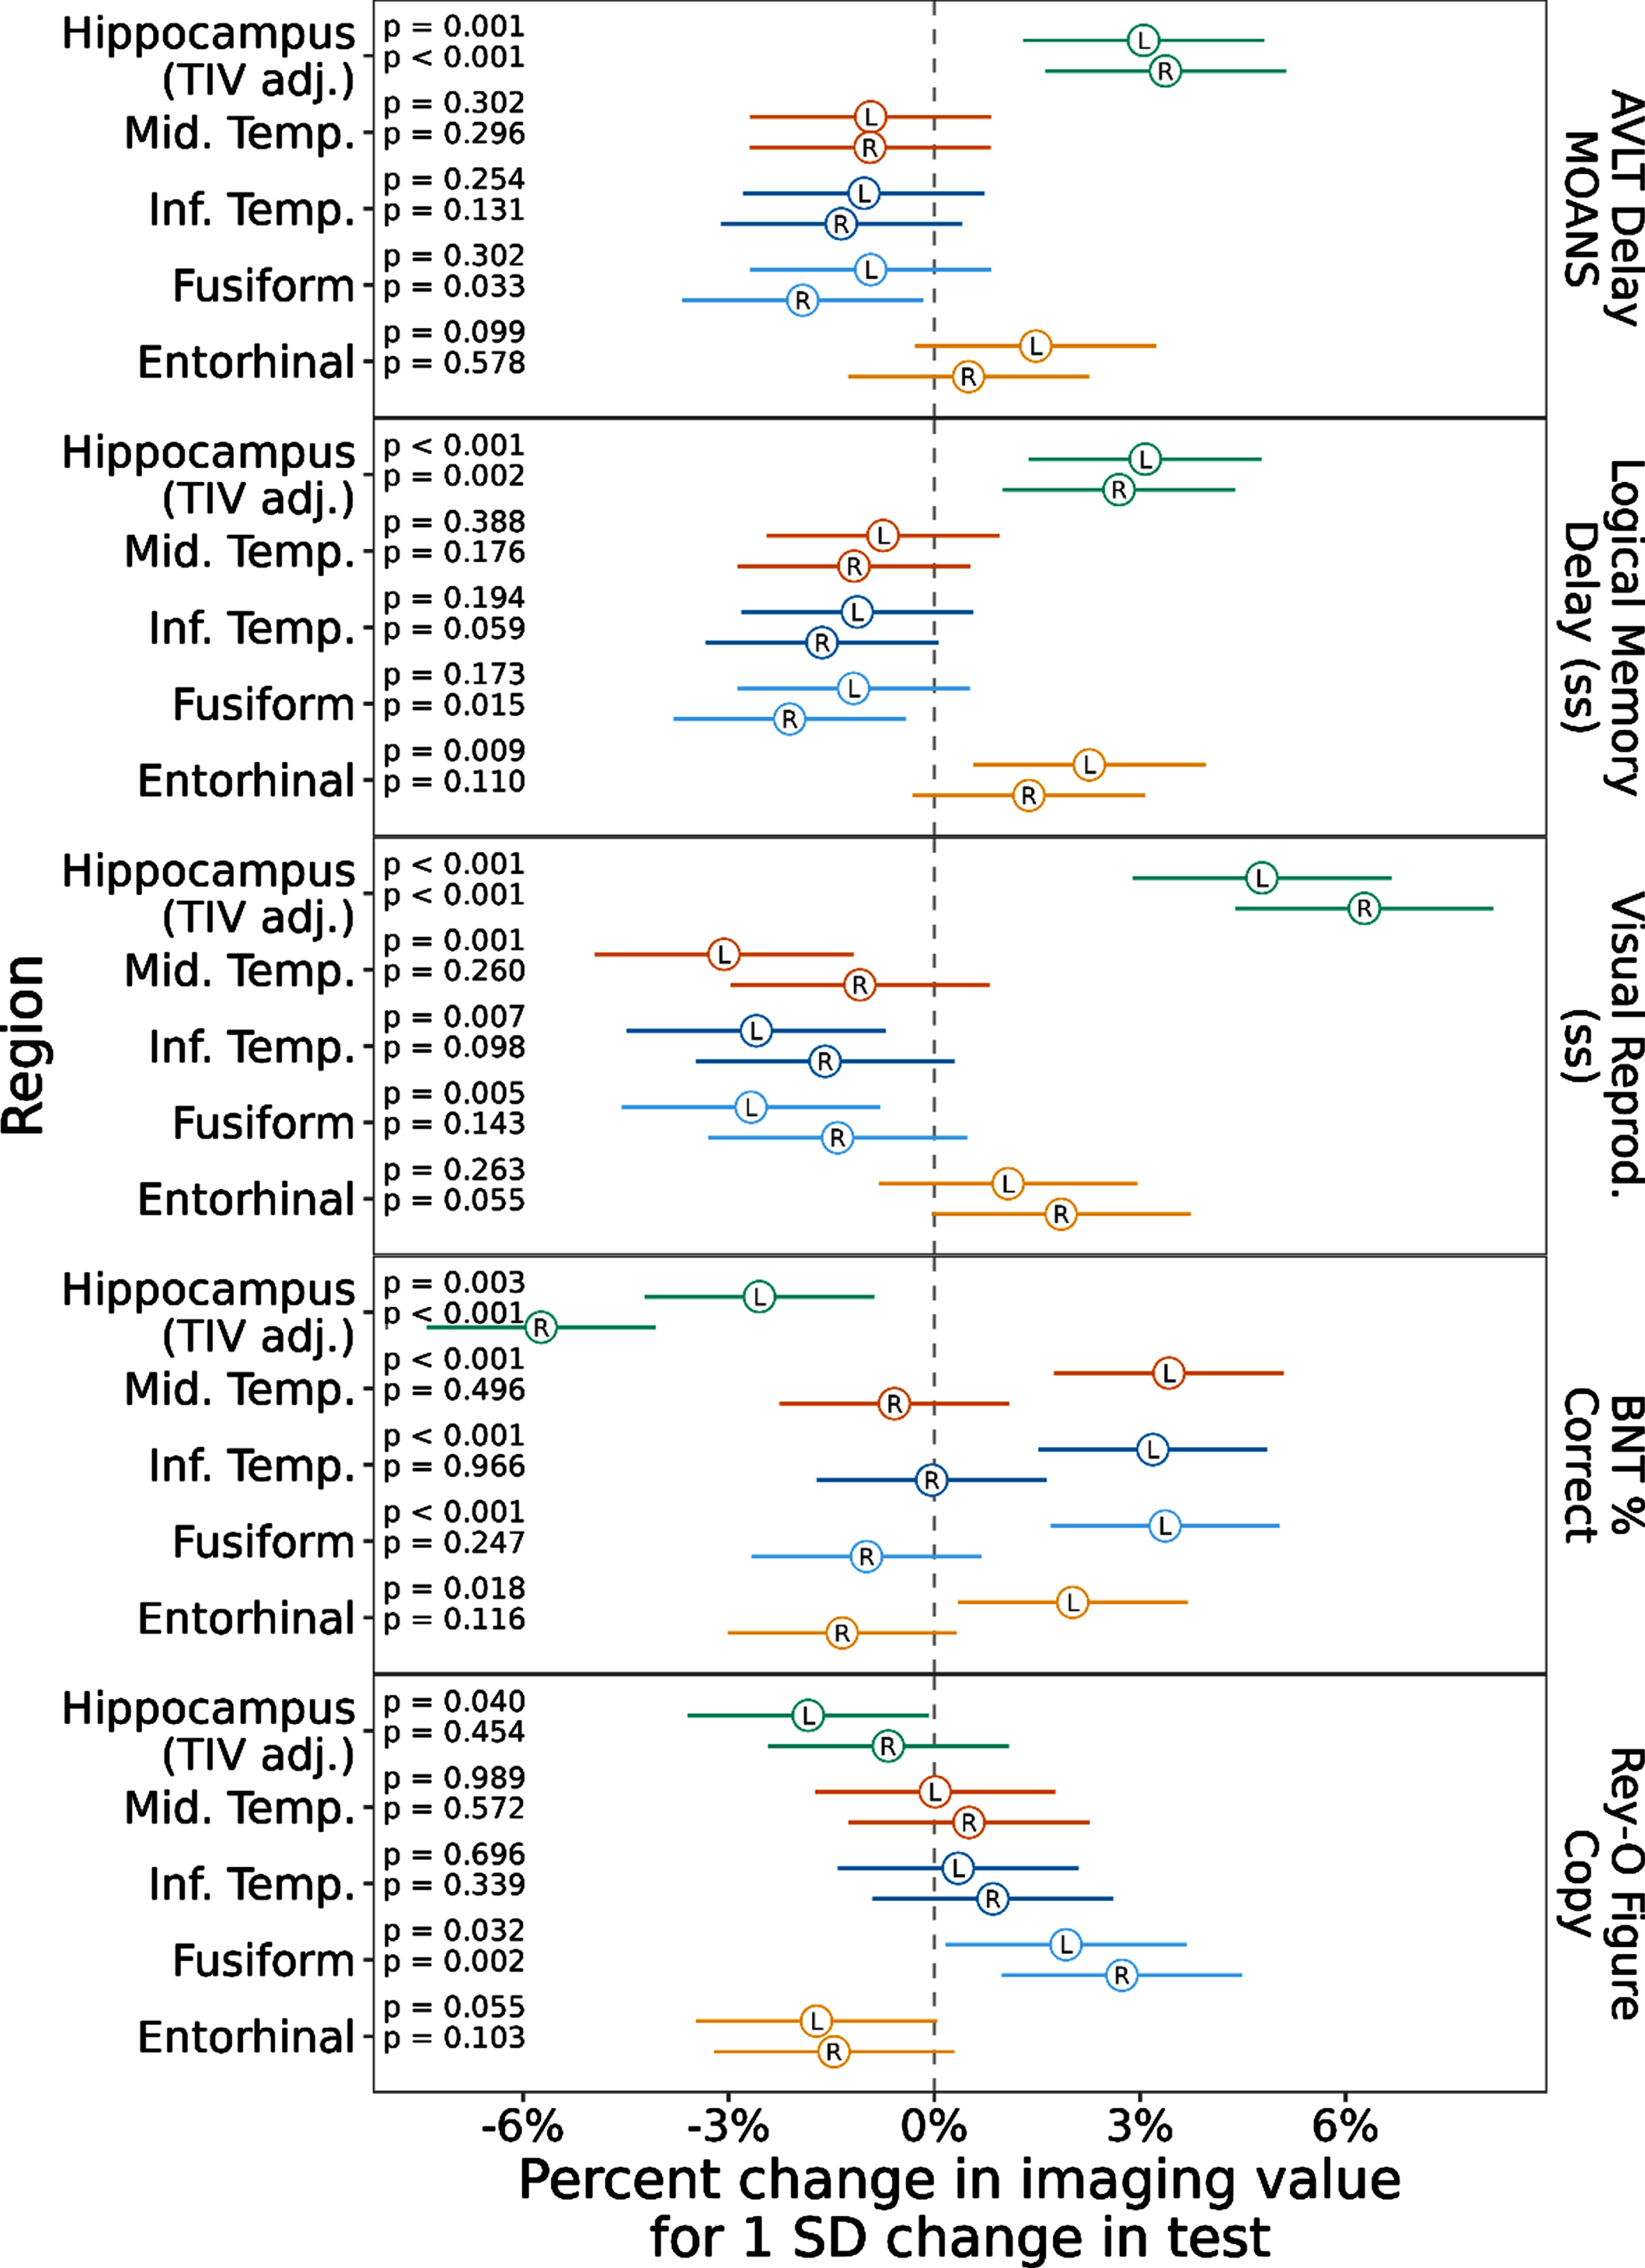
Fig. 4
Linear Mixed-effects models with cognitive scores predicting temporal lobe ROI values within each AD variant. Notes: Values represent estimated effect (circle) and 95% confidence interval (line) for each test in each region and hemisphere, scaling volume to have effects in % change and centering and scaling the predictors to be on the SD scale. Typical AD = Typical Amnestic Alzheimer’s disease. LPA = Logopenic Primary Progressive Aphasia. PCA = Posterior Cortical Atrophy.
DISCUSSION
We aimed to explore the relationships between structural change in the temporal lobe and cognitive decline in typical and atypical AD. We hypothesized that tAD would show greater hippocampal atrophy compared to atypical AD, that there would be greater left temporal thinning in LPA, and greater right temporal thinning in PCA. We also hypothesized memory would be most impaired in tAD and most strongly correlated with medial temporal structures, that LPA would show greatest impairment on the language naming task and that the left lateral temporal regions would reveal the strongest correlation with naming performance, and that PCA would show greatest impairment on the visuospatial task and that poor performance would be associated with fusiform thinning. Overall, our hypotheses were partially supported.
Medial temporal regions, including bilateral hippocampal volumes and entorhinal cortices, were smaller in tAD compared to atypical AD variants. While this is consistent with our hypothesis given hippocampal atrophy as a biomarker of tAD [2], hippocampal atrophy has not always differentiated tAD from atypical AD in direct comparisons [24]. Interestingly, in our sample the right hippocampus was smaller in PCA compared to LPA. The medial temporal lobe findings here are consistent with prior work showing atrophy of hippocampal subfields tends to occur more bilaterally in typical AD and when present in PCA, it tends to occur worse on the right [45, 46]. PCA also showed greater right inferior temporal gyrus and bilateral posterior temporal (fusiform) thinning compared to tAD and additionally right middle temporal thinning compared to LPA. This bilateral posterior thinning with a greater right hemisphere bias of cortical degeneration is in keeping with the general pattern of posterior cortical volume loss in PCA [18] with additional support for a less common finding of specific involvement in posterior temporal fusiform to a degree that uniquely differentiates PCA from other AD variants. The LPA pattern of thinning was more left sided, with generally greater thinning of left lateral temporal regions, particularly with the left middle temporal gyrus differentiating LPA from other AD variants. This also extends some of our prior work showing the middle temporal gyri rate of atrophy separates nicely from healthy controls [47] by demonstrating lateralized thinning of the middle temporal gyri differentiating the atypical AD variants.
Consistent with clinical expectation, the tAD group had a prominent and greater deficit in episodic memory (verbal and visual memory), the LPA group had poorer language/naming and the PCA group had poorer visuospatial performance, respectively, compared to the other AD variants. The direct comparison of cognition in tAD and atypical AD is valuable as similar cognitive domains are often impaired relative to controls and the literature is somewhat mixed on whether the relative declines differ among AD variants [22, 26, 48]. For example, Li et al. (2018) compared PCA to tAD on memory and spatial reasoning and found no verbal memory difference between groups though did find poorer spatial reasoning in PCA [27]. In another study, verbal memory was modestly stronger in LPA, but visual memory was poorer compared to tAD [24]. As we have discussed previously [22], deriving a neuropsychological assessment without the confound of language is very difficult if not impossible given the overlap of cognitive skills across domains. This is particularly salient while trying to assess a higher order cognitive skill such as memory in individuals with either a primary language or spatial deficit, as occurs with LPA and PCA respectively. As such, we chose to include common clinical measures to assess both verbal and visual memory to ensure that any separation of memory performance in tAD from atypical AD was not modality specific and arguably solely attributable to their primary cognitive deficit. With this approach, we demonstrated that regardless of modality episodic memory is most strikingly impaired in tAD relative to atypical AD.
The final aim of the current study was to explore the relationship between changes in cortical thickness and cognition among and within the AD variants. Bilateral medial temporal structural thinning (entorhinal cortex and hippocampal atrophy) was associated with poorer memory performance, as expected given the established association between hippocampal volume and memory [19, 45, 49]. The association of episodic memory deficit and hippocampal atrophy is consistent with similar studies that compare one atypical variant to tAD [19, 24], but here we show that this core hippocampal finding persists when combining three AD variants. Also, consistent with Leyton et al. (2017), we found that performance on the naming task was associated with left inferior temporal and fusiform thinning. The superior temporal gyrus was also associated with anomia in the Leyton et al. study, and while that was not an area of interest in the current study, we did find additional correlations with the left middle temporal and entorhinal cortices. Win et al. (2017) also found this association with naming and left middle temporal gyrus in tAD and LPA, though they did not show a significant association with medial temporal structures [28]. Our data suggest that in addition to the commonly found lateral temporal associations with naming, the medial temporal structures also play a role, perhaps given the role of semantic categorization of objects in the hippocampal-entorhinal system [50]. Relatedly, Leyton et al. found single word comprehension was associated with bilateral fusiform atrophy, suggesting a role in ventral stream semantic processing [12]. We found that while the left fusiform was associated with naming performance, right fusiform thinning was not, fitting more with a predominantly asymmetrical language processing ventral stream. Instead, our bilateral fusiform regions were associated with visuospatial performance, which has also been suggested to play a role in spatial perception and integration of objects in addition to faces [51]. The finding of posterior temporal right fusiform thinning in PCA relative to other AD variants and its association with cognition is an interesting finding that warrants further investigation in tAD and atypical AD. The fusiform has also been shown to separate cognitively unimpaired amyloid positive individuals from cognitively unimpaired amyloid negative individuals in a longitudinal tau imaging paradigm [7]. This prior work suggests that the fusiform may play an important role early in the AD disease process, and our data suggest this important role may continue into the later symptomatic stages of AD across the spectrum. Longitudinal studies across the AD spectrum are needed to assess the potential value of the fusiform as an AD biomarker.
Isolating structural and cognitive associations to disease specific groups, yielded fewer relationships. Naming was associated with left fusiform in LPA, again supporting the possible critical role of the fusiform as a biomarker, and left entorhinal in typical AD. Additionally, the right entorhinal cortex was somewhat surprisingly associated with spatial reasoning performance in LPA but more understandably associated with memory recall on the Logical Memory Delay test. We anticipated that naming performance would most strongly associate with left lateral temporal regions particularly in LPA but this was not fully supported here. More associations between a temporal regions and cognition within AD phenotypes may become evident if examined longitudinally, as suggested by a recent study following PPA patients (non-semantic, and therefore may include LPA or agrammatic) which showed greater rates of atrophy particularly in the temporal lobe in those who were amyloid positive [13].
An alternative explanation for the limited associations that remained after separating by AD variant may be related to sample size and heterogeneity across groups. For example, by restricting the analysis to look at associations between cortical thickness and cognition within each AD variant individually, while the homogeneity of the groups increase, the ranges of both structural integrity as measured by neuroimaging and distribution of clinical test scores are reduced (i.e., the cognitive decline in disease states over time lead to reduced ranges in cognitive tests). For example, the PCA group did not show any significant associations between structural change and cognitive performance. This group also had the widest confidence intervals, partly because this is also the smallest sample in the current study. Alternatively, there may not be an effect here to find, particularly with PCA given that the majority of cortical atrophy in this group tends to be bilateral parietal and occipital, in addition to posterior temporal [18]. This second explanation alone seems less likely, particularly for LPA and tAD, given the prior work demonstrating associations between structural change and cognitive decline in AD variants (e.g., [12, 19, 24]). Perhaps, too, the cross-sectional nature of this study limits our ability to find differences among a dynamic process. Multi-modal imaging studies exploring associations between cognition and additional biomarkers, including PiB PET and tau PET, may also help to elucidate patterns of neurodegeneration and cognitive decline [13, 24, 47, 52].
Taken together, these findings have important research, clinical and potential treatment implications. They provide direct support of critical temporal lobe differences between typical and atypical AD, as well as the presence of pathognomonic cognitive differences that drive the phenotype even when directly compared to other AD variants. These important distinctions may help determine which patient would benefit from further biomarker investigation (e.g., PET scanning, CSF analysis, etc.) as having a high confidence in disease etiology and ensuring the patient is on the AD continuum is important in guiding appropriate treatment recommendations and informing clinical trial enrollment [53]. Temporal ROIs, in particular, may have important utility and require a smaller sample size than other modalities for a clinical trial in cognitively unimpaired, yet amyloid positive, individuals, for example [7]. Our study lends further support for focusing on temporal regions and cognitive associations, with specific attention paid to the phenotype of AD being examined. It will also be important to consider cognitive outcomes as measured by neuropsychological tests associated with each phenotype.
Strengths and limitations
Strengths of the current study include relatively large groups of individuals on the AD continuum with careful attempts at matching based on age and sex. Our statistical methods were sophisticated, managing the structured nature of the data and proactively managing the problem of multiple comparisons by fitting just three models to answer many questions of interest across multiple clinical tests and cortical regions. Given that we matched the groups in terms of age, a limitation is that our findings may not generalize to older cohorts of tAD. We selected temporal cortical regions a priori rather than looking at whole brain differences. One could view this decision as both a strength and a weakness given that we did not look for differences and associations in other brain areas, which may have been informative. Yet, a longitudinal comparison of similar groups showed greatest atrophy related changes in temporal regions in these AD variants [47]. We also compared a limited number of neuropsychological tests which restricts detection of cognitive differences among groups, though this was unavoidable due to limited availability of similar cognitive tests across data sets. Relatedly, due to pooling participants across data sets, we were unable to avoid using different versions of the two of the memory and language tests, but we attempted to control for this by using scaled scores on memory tests and percentage correct on different versions of the BNT. It is also possible the language symptoms confounded verbal memory, though we attempted to counterbalance this by also examining visual memory. There was also a lack of racial diversity in the study cohort (most individuals were White, Non-Hispanic), which may limit generalizability. These findings also may not generalize to other variants of AD, such as the dysexecutive AD variant [54], or other disease stages. Furthermore, this study is not longitudinal, so we do not know whether these represent meaningful findings over time. These are areas of intended future investigation.
Conclusions
Findings from this large study of well-matched tAD and atypical AD groups show evidence of topographic brain changes within the temporal lobe that correspond to clinical presentation. More specifically, PCA is more likely to show greater cortical thinning in right lateral and posterior temporal regions, LPA is more likely to show greater thinning of left lateral temporal regions, and tAD is more likely to show medial temporal regional structural change. These patterns of neurodegeneration were also associated with cognitive performance, with memory associated with medial temporal atrophy, naming associated predominantly with left temporal thinning, and spatial associated with bilateral posterior, particularly right hemisphere thinning. The fusiform emerged as a unique area of thinning that may hold an important role as a biomarker in future clinical trials for the AD spectrum.
ACKNOWLEDGMENTS
The authors would like to thank the patients and their families for their generous participation in the study. Thank you to Sarah Boland, BA, as research coordinator, and the Mayo Clinic Alzheimer’s Disease Research Center staff who were critical is data collection.
FUNDING
This work was supported by the National Institute on Deafness and Other Communicable Disorders (R01 DC010367), National Institute of Aging (R01 AG050603, P50 AG16574, and R01 AG11378), and the Alzheimer’s Association (NIRG-12-242215).
CONFLICT OF INTEREST
Drs. Machulda, Josephs, Whitwell, and Duffy receive funding from the NIH.
Dr. Lowe consults for Bayer Schering Pharma, Piramal Life Sciences, Life Molecular Imaging, Eisai Inc., AVID Radiopharmaceuticals, and Merck Research and receives research support from GE Healthcare, Siemens Molecular Imaging, AVID Radiopharmaceuticals, and the NIH (NIA, NCI).
Dr. Graff-Radford is funded by the NIH and serves on the Neurology editorial board.
Dr. Jack serves on an independent data monitoring board for Roche, has served as a speaker for Eisai, and consulted for Biogen, but he receives no personal compensation from any commercial entity. He receives research support from NIH and the Alexander Family Alzheimer’s Disease Research Professorship of the Mayo Clinic.
Dr. Knopman serves on a Data Safety Monitoring Board for the DIAN study. He serves on a Data Safety monitoring Board for a tau therapeutic for Biogen but receives no personal compensation. He is an investigator in clinical trials sponsored by Biogen, Lilly Pharmaceuticals, and the University of Southern California. He has served as a consultant for Roche, Samus Therapeutics, Third Rock and Alzeca Biosciences but receives no personal compensation. He receives funding from the NIH.
The remaining authors have no conflict of interest to report.
SUPPLEMENTARY MATERIAL
[1] The supplementary material is available in the electronic version of this article: https://dx.doi.org/10.3233/ADR-220010.
REFERENCES
[1] | Jack CR Jr , Bennett DA , Blennow K , Carrillo MC , Dunn B , Haeberlein SB , Holtzman DM , Jagust W , Jessen F , Karlawish J , Liu E , Molinuevo JL , Montine T , Phelps C , Rankin KP , Rowe CC , Scheltens P , Siemers E , Snyder HM , Sperling R ((2018) ) NIA-AA Research Framework: Toward a biological definition of Alzheimer’s disease. Alzheimers Dement 14: , 535–562. |
[2] | Jack CR Jr , Petersen RC , O’Brien PC , Tangalos EG ((1992) ) MR-based hippocampal volumetry in the diagnosis of Alzheimer’s disease. Neurology 42: , 183–188. |
[3] | Dickerson BC , Bakkour A , Salat DH , Feczko E , Pacheco J , Greve DN , Grodstein F , Wright CI , Blacker D , Rosas HD , Sperling RA , Atri A , Growdon JH , Hyman BT , Morris JC , Fischl B , Buckner RL ((2009) ) The cortical signature of Alzheimer’s disease: Regionally specific cortical thinning relates to symptom severity in very mild to mild AD dementia and is detectable in asymptomatic amyloid-positive individuals. Cereb Cortex 19: , 497–510. |
[4] | Jack CR Jr , Wiste HJ , Weigand SD , Knopman DS , Mielke MM , Vemuri P , Lowe V , Senjem ML , Gunter JL , Reyes D , Machulda MM , Roberts R , Petersen RC ((2015) ) Different definitions of neurodegeneration produce similar amyloid/neurodegeneration biomarker group findings. Brain 138: , 3747–3759. |
[5] | Schwarz CG , Gunter JL , Wiste HJ , Przybelski SA , Weigand SD , Ward CP , Senjem ML , Vemuri P , Murray ME , Dickson DW , Parisi JE , Kantarci K , Weiner MW , Petersen RC , Jack CR Jr ((2016) ) A large-scale comon of cortical thickness and volume methods for measuring Alzheimer’s disease severity. Neuroimage Clin 11: , 802–812 paris. |
[6] | Jack CRJ , Wiste HJ , Weigand SD , Therneau TM , Lowe VJ , Knopman DS , Gunter JL , Senjem ML , Jones DT , Kantarci K , Machulda MM , Mielke MM , Roberts RO , Vemuri P , Reyes DA , Petersen RC ((2017) ) Defining imaging biomarker cut points for brain aging and Alzheimer’s disease. Alzheimers Dement 13: , 205–216. |
[7] | Jack CRJ , Wiste HJ , Schwarz CG , Lowe VJ , Senjem ML , Vemuri P , Weigand SD , Therneau TM , Knopman DS , Gunter JL , Jones DT , Graff-Radford J , Kantarci K , Roberts RO , Mielke MM , Machulda MM , Petersen RC ((2018) ) Longitudinal tau PET in ageing and Alzheimer’s disease. Brain 141: , 1517–1528. |
[8] | Jack CR , Wiste HJ , Weigand SD , Therneau TM , Lowe VJ , Knopman DS , Botha H , Graff-Radford J , Jones DT , Ferman TJ , Boeve BF , Kantarci K , Vemuri P , Mielke MM , Whitwell J , Josephs K , Schwarz CG , Senjem ML , Gunter JL , Petersen RC ((2020) ) Predicting future rates of tau accumulation on PET. Brain 143: , 3136–3150. |
[9] | Gorno-Tempini ML , Hillis AE , Weintraub S , Kertesz A , Mendez M , Cappa SF , Ogar JM , Rohrer JD , Black S , Boeve BF , Manes F , Dronkers NF , Vandenberghe R , Rascovsky K , Patterson K , Miller BL , Knopman DS , Hodges JR , Mesulam MM , Grossman M ((2011) ) Classification of primary progressive aphasia and its variants. Neurology 76: , 1006–1014. |
[10] | Tang-Wai DF , Graff-Radford NR , Boeve BF , Dickson DW , Parisi JE , Crook R , Caselli RJ , Knopman DS , Petersen RC ((2004) ) Clinical, genetic, and neuropathologic characteristics of posterior cortical atrophy. Neurology 63: , 1168–1174. |
[11] | Crutch SJ , Schott JM , Rabinovici GD , Murray M , Snowden JS , van der Flier WM , Dickerson BC , Vandenberghe R , Ahmed S , Bak TH , Boeve BF , Butler C , Cappa SF , Ceccaldi M , de Souza LC , Dubois B , Felician O , Galasko D , Graff-Radford J , Graff-Radford NR , Hof PR , Krolak-Salmon P , Lehmann M , Magnin E , Mendez MF , Nestor PJ , Onyike CU , Pelak VS , Pijnenburg Y , Primativo S , Rossor MN , Ryan NS , Scheltens P , Shakespeare TJ , Suárez González A , Tang-Wai DF , Yong KXX , Carrillo M , Fox NC ((2017) ) Consensus classification of posterior cortical atrophy. Alzheimers Dement 13: , 870–884. |
[12] | Leyton CE , Hodges JR , Piguet O , Ballard KJ ((2017) ) Common and divergent neural correlates of anomia in amnestic and logopenic presentations of Alzheimer’s disease. Cortex 86: , 45–54. |
[13] | Rogalski EJ , Sridhar J , Martersteck A , Rader B , Cobia D , Arora AK , Fought AJ , Bigio EH , Weintraub S , Mesulam M-M , Rademaker A ((2019) ) Clinical and cortical decline in the aphasic variant of Alzheimer’s disease. Alzheimers Dement 15: , 543–552. |
[14] | Rohrer JD , Ridgway GR , Crutch SJ , Hailstone J , Goll JC , Clarkson MJ , Mead S , Beck J , Mummery C , Ourselin S , Warrington EK , Rossor MN , Warren JD ((2010) ) Progressive logopenic/phonological aphasia: Erosion of the language network. Neuroimage 49: , 984–993. |
[15] | Ossenkoppele R , Cohn-Sheehy BI , la Joie R , Vogel JW , Möller C , Lehmann M , van Berckel BNM , Seeley WW , Pijnenburg YA , Gorno-Tempini ML , Kramer JH , Barkhof F , Rosen HJ , van der Flier WM , Jagust WJ , Miller BL , Scheltens P , Rabinovici GD ((2015) ) Atrophy patterns in early clinical stages across distinct phenotypes of Alzheimer’s disease. Hum Brain Mapp 36: , 4421–4437. |
[16] | Madhavan A , Whitwell JL , Weigand SD , Duffy JR , Strand EA , Machulda MM , Tosakulwong N , Senjem ML , Gunter JL , Lowe VJ , Petersen RC , Jack CR Jr , Josephs KA ((2013) ) FDG PET and MRI in logopenic primary progressive aphasia versus dementia of the Alzheimer’s type. PLoS One 8: , e62471. |
[17] | Lehmann M , Barnes J , Ridgway GR , Wattam-Bell J , Warrington EK , Fox NC , Crutch SJ ((2011) ) Basic visual function and cortical thickness patterns in posterior cortical atrophy. Cereb Cortex 21: , 2122–2132. |
[18] | Whitwell JL , Jack CRJ , Kantarci K , Weigand SD , Boeve BF , Knopman DS , Drubach DA , Tang-Wai DF , Petersen RC , Josephs KA ((2007) ) Imaging correlates of posterior cortical atrophy. Neurobiol Aging 28: , 1051–1061. |
[19] | Peng G , Wang J , Feng Z , Liu P , Zhang Y , He F , Chen Z , Zhao K , Luo B ((2016) ) Clinical and neuroimaging differences between posterior cortical atrophy and typical amnestic Alzheimer’s disease patients at an early disease stage. Sci Rep 6: , 29372. |
[20] | Migliaccio R , Agosta F , Rascovsky K , Karydas A , Bonasera S , Rabinovici GD , Miller BL , Gorno-Tempini ML ((2009) ) Clinical syndromes associated with posterior atrophy. Neurology 73: , 1571–1578. |
[21] | Peng G-P , Feng Z , He F-P , Chen Z-Q , Liu X-Y , Liu P , Luo B-Y ((2015) ) Correlation of hippocampal volume and cognitive performances in patients with either mild cognitive impairment or Alzheimer’s disease. CNS Neurosci Ther 21: , 15–22. |
[22] | Butts AM , Machulda MM , Duffy JR , Strand EA , Whitwell JL , Josephs KA ((2015) ) Neuropsychological profiles differ among the three variants of primary progressive aphasia. J Int Neuropsychol Soc 21: , 429–435. |
[23] | Das G , Dubey S , Sinharoy U , Mukherjee A , Banerjee S , Lahiri D , Biswas A ((2021) ) Clinical and radiological profile of posterior cortical atrophy and comparison with a group of typical Alzheimer disease and amnestic mild cognitive impairment. Acta Neurol Belg 121: , 1009–1018. |
[24] | Ramanan S , Marstaller L , Hodges JR , Piguet O , Irish M ((2020) ) Understanding the neural basis of episodic amnesia in logopenic progressive aphasia: A multimodal neuroimaging study. Cortex 125: , 272–287. |
[25] | Ramanan S , Flanagan E , Leyton CE , Villemagne VL , Rowe CC , Hodges JR , Hornberger M ((2016) ) Non-verbal episodic memory deficits in primary progressive aphasias are highly predictive of underlying amyloid pathology. J Alzheimers Dis 51: , 367–376. |
[26] | Mendez MF , Monserratt LH , Liang L-J , Chavez D , Jimenez EE , Maurer JJ , Laffey M ((2019) ) Neuropsychological similarities and differences between amnestic Alzheimer’s disease and its non-amnestic variants. J Alzheimers Dis 69: , 849–855. |
[27] | Li J , Wu L , Tang Y , Zhou A , Wang F , Xing Y , Jia J ((2018) ) Differentiation of neuropsychological features between posterior cortical atrophy and early onset Alzheimer’s disease. BMC Neurol 18: , 65. |
[28] | Win KT , Pluta J , Yushkevich P , Irwin DJ , McMillan CT , Rascovsky K , Wolk D , Grossman M ((2017) ) Neural correlates of verbal episodic memory and lexical retrieval in logopenic variant primary progressive aphasia. Front Neurosci 11: , 330. |
[29] | Putcha D , Dickerson BC , Brickhouse M , Johnson KA , Sperling RA , Papp KV ((2020) ) Word retrieval across the biomarker-spectrum confirmed Alzheimer’s disease syndromic . Neuropsychologia 140: , 107391. |
[30] | McKhann GM , Knopman DS , Chertkow H , Hyman BT , Jack CR Jr , Kawas CH , Klunk WE , Koroshetz WJ , Manly JJ , Mayeux R , Mohs RC , Morris JC , Rossor MN , Scheltens P , Carrillo MC , Thies B , Weintraub S , Phelps CH ((2011) ) The diagnosis of dementia due to Alzheimer’s disease: Recommendations from the National Institute on Aging-Alzheimer’s Association workgroups on diagnostic guidelines for Alzheimer’s disease. Alzheimers Dement 7: , 263–269. |
[31] | Wechsler D (1987) WMS-R: Wechsler Memory Scale–Revised: Manual, Psychological Corp.: Harcourt Brace Jovanovich, San Antonio. |
[32] | Wechsler D ((2012) ) Neuropsychological Assessment, Oxford University Press, New York, NY. |
[33] | Lezak MD ((2012) ) Neuropsychological Assessment, Oxford University Press, New York, NY. |
[34] | Lansing AE , Ivnik RJ , Cullum CM , Randolph C ((1999) ) An empirically derived short from of the Boston naming test. Arch Clin Neuropsychol 14: , 481–487. |
[35] | Goodglass H , Kaplan E (1972) The assessment of aphasia and related disorders, Lea & Febiger. |
[36] | Meyers JE , Meyers KR (1955) Rey Complex Figure Test and Recognition Trial: Professional manual, PAR, Inc. |
[37] | Folstein MF , Folstein SE , McHugh PR ((1975) ) “Mini-mental state”. A practical method for grading the cognitive state of patients for the clinician. J Psychiatr Res 12: , 189–198. |
[38] | Avants BB , Epstein CL , Grossman M , Gee JC ((2008) ) Symmetric diffeomorphic image registration with cross-correlation: Evaluating automated labeling of elderly and neurodegenerative brain. Med Image Anal 12: , 26–41. |
[39] | Fischl B ((2012) ) FreeSurfer. Neuroimage 62: , 774–781. |
[40] | Desikan RS , Ségonne F , Fischl B , Quinn BT , Dickerson BC , Blacker D , Buckner RL , Dale AM , Maguire RP , Hyman BT , Albert MS , Killiany RJ ((2006) ) An automated labeling system for subdividing the human cerebral cortex on MRI scans into gyral based regions of interest. Neuroimage 31: , 968–980. |
[41] | Greenland S ((2000) ) Principles of multilevel modelling. Int J Epidemiol 29: , 158–167. |
[42] | Gelman A , Hill J ((2006) ) Data Analysis Using Regression and Multilevel/Hierarchical Models,Cambridge University Press. |
[43] | R: A language and environment for statistical computing. |
[44] | Bates D , Mächler M , Bolker B , Walker S ((2015) ) Fitting linear mixed-effects models using lme4. J Stat Softw 67: , 1–48. |
[45] | Gabere M , Thu Pham NT , Graff-Radford J , Machulda MM , Duffy JR , Josephs KA , Whitwell JL ((2020) ) Automated hippocampal subfield volumetric analyses in atypical Alzheimer’s disease. J Alzheimers Dis 78: , 927–937. |
[46] | Josephs KA , Pham NTT , Graff-Radford J , Machulda MM , Lowe VJ , Whitwell JL ((2022) ) Medial temporal atrophy in posterior cortical atrophy and its relationship to the cingulate island sign. J Alzheimers Dis 86: , 491–498. |
[47] | Sintini I , Graff-Radford J , Senjem ML , Schwarz CG , Machulda MM , Martin PR , Jones DT , Boeve BF , Knopman DS , Kantarci K , Petersen RC , Jack CR , Lowe VJ , Josephs KA , Whitwell JL ((2020) ) Longitudinal neuroimaging biomarkers differ across Alzheimer’s disease phenotypes. Brain 143: , 2281–2294. |
[48] | Foxe DG , Irish M , Hodges JR , Piguet O ((2013) ) Verbal and visuospatial span in logopenic progressive aphasia and Alzheimer’s disease. J Int Neuropsychol Soc 19: , 247–253. |
[49] | Jack CR Jr ((2016) ) Brain atrophy on magnetic resonance imaging as a biomarker of neurodegeneration. JAMA Neurol 73: , 1179–1182. |
[50] | Viganò S , Piazza M ((2021) ) The hippocampal-entorhinal system represents nested hierarchical relations between words during concept learning. Hippocampus 31: , 557–568. |
[51] | Weiner KS , Zilles K ((2016) ) The anatomical and functional specialization of the fusiform gyrus. Neuropsychologia 83: , 48–62. |
[52] | Farrell ME , Papp K v , Buckley RF , Jacobs HIL , Schultz AP , Properzi MJ , Vannini P , Hanseeuw BJ , Rentz DM , Johnson KA , Sperling RA ((2022) ) Association of emerging β-amyloid and tau pathology with early cognitive changes in clinically normal older adults. Neurology 98: , e1512–e1524. |
[53] | Rohrer JD , Rossor MN , Warren JD ((2012) ) Alzheimer’s pathology in primary progressive aphasia. Neurobiol Aging 33: , 744–752. |
[54] | Townley RA , Graff-Radford J , Mantyh WG , Botha H , Polsinelli AJ , Przybelski SA , Machulda MM , Makhlouf AT , Senjem ML , Murray ME , Reichard RR , Savica R , Boeve BF , Drubach DA , Josephs KA , Knopman DS , Lowe VJ , Jack CRJ , Petersen RC , Jones DT ((2020) ) Progressive dysexecutive syndrome due to Alzheimer’s disease: A description of 55 cases and comparison to other phenotypes. Brain Commun 2: , fcaa068. |


