
Plasma Neurofilament Light and Future Declines in Cognition and Function in Alzheimer’s Disease in the FIT-AD Trial
Abstract
Background:
Utilities of blood-based biomarkers in Alzheimer’s disease (AD) clinical trials remain unknown.
Objective:
To evaluate the ability of plasma neurofilament light chain (NfL) to predict future declines in cognition and activities of daily living (ADL) outcomes in 26 older adults with mild-to-moderate AD dementia from the FIT-AD Trial.
Methods:
Plasma NfL was measured at baseline and 3 and 6 months. Cognition and ADL were assessed using the AD Assessment Scale-Cognition (ADAS-Cog) and AD Uniform Dataset Instruments and Disability Assessment for Dementia (DAD), respectively, at baseline, 3, 6, 9, and 12 months. Linear mixed effects models were used to examine the associations between baseline or change in plasma NfL and changes in outcomes.
Results:
Higher baseline plasma NfL was associated with greater rate of decline in ADAS-Cog from baseline to 6 months (standardized estimate of 0.00462, p = 0.02853) and in ADL from baseline to 12 months (standardized estimate of –0.00284, p = 0.03338). Greater increase in plasma NfL in short term from baseline to 3 months was associated with greater rate of decline in memory and ADL from 3 to 6 months (standardized estimate of –0.04638 [0.003], p = 0.01635; standardized estimate of –0.03818, p = 0.0435) and greater rate of decline in ADL from 3 to 12 month (standardized estimate of –0.01492, p = 0.01082).
Conclusion:
This study demonstrated that plasma NfL might have the potential to predict cognitive and function decline up to 12 months. However, future studies with bigger sample sizes need to confirm the findings.
INTRODUCTION
Randomized controlled trials (RCTs) in Alzheimer’s disease (AD) often use clinical endpoints (e.g., cognitive decline) that are not very sensitive and subjective to measurement errors [1]. In recent years, biomarker surrogate endpoints have emerged such as PET or cerebrospinal fluid (CSF) amyloid-beta 42 (Aβ 42) for AD amyloid pathology [2], but they are costly and invasive. Blood biomarkers, such as neurofilament light chain (NfL), would be more advantageous. NfL represents subcortical large-caliber axonal degeneration [3, 4]. Elevated plasma NfL levels have been found in multiple neurodegenerative conditions including frontotemporal dementia [5], multiple sclerosis [6], severe traumatic brain injury [7], atypical parkinsonian disorders [8], and AD [9, 10]. Cross-sectionally, blood NfL increases with increasing symptom severity across the clinical AD spectrum [11]. Longitudinally, plasma NfL predicts long-term (15 months to four years) changes in cognition among cognitively unimpaired individuals and those with a diagnosis of MCI or AD dementia [12, 13]. Rates of change in plasma NfL have also been found to correlate with the rates of change in cognition, CSF Aβ 42 and phosphorylated Tau (p-Tau) markers, hippocampal atrophy, and FDG-PET hypometabolism [12, 13]. These results suggest that plasma NfL may be a useful prognostic and a predictive marker to track disease progression and treatment response.
Recently, Raket et al. studied the utility of plasma NfL in an 18-month phase III trial of the non-steroidal anti-inflammatory and γ-secretase modulator tarenflurbil among 500 older adults with mild AD. Plasma samples were collected at baseline, 9, and 18 months, and functional and cognitive outcomes were assessed every 3 month (baseline, 3, 6, 9, 12, 15, and 18 months) [14]. Although the full trial was negative and no between-group effect was found on plasma NfL, when combined treatment and control groups, the study found that baseline plasma NfL was independently predictive of future cognitive decline from 6 to 18 months. However, the study did not examine whether short-term changes in NfL (e.g., in 3 months) predicted future declines in cognitive and functional outcomes.
The objective of this pilot study was to examine the associations of baseline plasma NfL and change in plasma NfL from baseline to 3 months (0–3 m) with monthly rates of change in cognitive and functional outcomes in the FIT-AD Trial. We hypothesized that: 1) higher baseline plasma NfL is associated with greater rates of decline in cognition and activities of daily living (ADL) from baseline to 6 months (0–6 m) and from baseline to 12 months (0–12 m); and 2) 0–3 m increase in plasma NfL is associated with greater rates of decline in cognition and ADL from 3 to 6 month (3–6 m) and from 3 to 12 month (3–12 m).
MATERIALS AND METHODS
Design
This study included 26 of the 96 participants enrolled in the FIT-AD Trial because blood collections did not begin until after 70 participants had already been enrolled. The FIT-AD Trial was a pilot RCT that investigated the effects of a 6-month, individualized, moderate-intensity cycling intervention on cognition and hippocampal volume in community-dwelling older adults with mild-to-moderate AD dementia [15, 16]. The trial randomized 96 subjects to 6-month cycling or stretching exercise on a 2:1 allocation ratio and followed them for an additional 6 months after the interventions. The details of the FIT-AD Trial protocol and its main cognitive findings were published previously [15, 16]. Study participants of the FIT-AD Trial were community-dwelling older adults 66 + years old with AD dementia. AD dementia was diagnosed per 2011 diagnostic criteria [17] and verified by providers. Other inclusion criteria included Mini-Mental State Examination (MMSE) and Clinical Dementia Rating (CDR) of 15–26 and 0.5–2, respectively, stable on AD drugs > 1 month if prescribed, provider clearance for exercise safety, and English speaking. Exclusion criteria included resting heart rate > 100 or < 50 beats per minute, or neurological, psychiatric, or substance disorders that may explain cognitive impairment.
Participants meeting the FIT-AD Trial eligibility criteria needed to meet two additional requirements to be eligible for this study: 1) agree to donate 20 mL blood at each collection (60 mL total); and 2) agree to fast for at least 8 h (no food or drink other than water and prescribed medicines) before blood collection. We collected fasting blood samples from subjects at baseline and at 3 and 6 months. After collections, blood specimens were stored immediately on wet ice. A laboratory technician processed and aliquoted these specimens according to an established protocol [18]. Briefly, plasma EDTA tubes were mixed and centrifuged in 4°C using a temperature-controlled centrifuge with a Swing out Rotor at 1,439 g for 15 min. The tubes were removed from the centrifuge immediately after completion. Plasma samples were aliquoted and stored in a –80°C freezer [18]. Plasma NfL was measured using the Simoa ® NF-light Advantage kit on a HD-1 analyzer (Quanterix, Billerica, MA). Based on triplicate measurement, coefficient of variance (CV)%of QC samples were 11%, 3%, 1%, and 9%at 3.3, 10.8, 114.3, and 433.4 pg/mL, respectively. This study was approved by the University’s Institutional Review Board (IRB: #1508M77566).
Main outcomes and measures
Cognition and ADL were measured at baseline (before randomization), 3, 6, 9, and 12 months. The primary outcome of the FIT-AD Trial was global cognition measured by the AD Assessment Scale-Cognition (ADAS-Cog) which has a total score of 0–70 (higher score indicating worse function) [19]. Discrete cognitive domains included: 1) episodic memory measured by the Wechsler Memory Scale–Revised Logical Memory subtest [20] and Hopkins Verbal Learning Test–Revised [HVLT-R]) [21]; 2) executive function assessed with the Trail Making Test (TMT) Part B [22], Exit Interview-25 (EXIT-25) [23], and Executive Clock Drawing Task (CLOX] [24]; 3) attention measured with the Wechsler Adult Intelligence Scale Revised (WAIS-R) Digit Span tests [25]; 4) processing speed assessed with the WAIS–Third Edition Digit Symbol test [20], Golden Stroop [26], and TMT Part A [22]; and 5) language measured with the Controlled Oral Word Association test (COWAT) [27], Category Fluency test [28], and Boston Naming Test (BNT) [27]. ADL was measured by the Disability Assessment for Dementia (DAD) [29].
Statistical analyses
Z-scores were calculated for each test of each discrete cognitive domain using the mean and SD at baseline in the whole FIT-AD sample (n = 96). The directions of z-scores were reversed for TMT Part A, TMT Part B, and EXIT-25, so higher z-scores represent better cognition, similar to the other tests of discrete cognitive domains. A composite z-score for each discrete cognitive domain was generated by averaging all tests for a discrete domain, following the established procedure [30]. Ordinary one-way ANOVA was used to determine whether baseline, 3- and 6-month plasma NfL levels differed between cycling and stretching groups. Since aerobic exercise did not affect plasma NfL, this study combined the 26 participants in exercise and stretching groups in subsequent analyses similar to Raket et al. [14]. Linear mixed effects models were used to test associations between baseline/3-month changes of NFL and outcome changes. To test baseline NFL effect, the regression models have the response to be the outcome measures at different time points, predictors including subject-level intercept, age, sex, time, baseline NFL, and time-by-baseline-NFL interaction, and autocorrelated residuals modeled with AR(1) model (see Equation (1)).
(1)
To test effect of 0–3-month NFL change, the regression models have the responses to be the from-baseline-changes of outcome measures at different time points (in this case, 3 month was used as baseline to calculate 3–6 m or 3–12 m changes in outcomes), predictors including subject-level intercept, age, sex, time, baseline outcome measure, 3-month NFL change, and time-by-NFL-change interaction, and autocorrelated residuals modeled with AR(1) model (see Equation (2)).
(2)
All analyses were performed using R Version 3.5.1 (R Foundation for Statistical Computing, Vienna, Austria) and two-sided tests with p < 0.05 indicating statistical significance. No adjustment for multiple testing/comparison was performed.
RESULTS
Table 1 lists the 26 participants’ baseline characteristics with a mean age (SD) of 77.6 (7.0) years, 65.4%men, a mean (SD) education of 15.4 (3.0) years, and an ADAS-Cog (SD) of 18.1 (7.8). The baseline characteristics of these 26 participants were consistent with the full cohort of the FIT-AD Trial, except that the percent of men were higher (65.4%versus 55%in the 96 participants) [16].
Table 1
Participants baseline characteristics
| Characteristics | N | Mean (SD) or n (%) |
| Age (y) | 26 | 77.6 (7.0) |
| Male | 26 | 17 (65.4%) |
| Education | 26 | 15.4 (3.0) |
| Plasma NfL (pg/mL) | 26 | 32.0 (17.7) |
| ADL (DAD) | 26 | 74.4 (19.3) |
| Global cognition (ADAS-Cog) | 26 | 18.1 (7.8) |
| Cognitive z score | ||
| Attention | 26 | 0.10 (0.95) |
| Executive function | 26 | 0.11 (0.67) |
| Language | 26 | 0.38 (0.77) |
| Episodic memory | 26 | 0.20 (0.88) |
| Processing | 26 | 0.20 (0.89) |
Figure 1 displays change in each participant’s plasma NfL over time as well as change in plasma NfL from 0 to 3 or 6 months for cycling and stretching groups. Changes of plasma NfL over time were not statistically significant. We calculated within- and between-subject variability (i.e., coefficient of variance [CV%]) of plasma NfL using the square root of the variance component estimate divided by the overall mean. The within-subject CV%of plasma NfL in older adults with AD dementia was 12%over 6 months and between-subject CV%was 92%. We also found associations of baseline NfL with age and with sex. The correlation between baseline NfL and age was 0.44 (p = 0.023). The two-sample t test comparing baseline NfL between sex had a mean difference 12.8 pg/mL (men’ levels were higher than women) and standard error of 5.56 (p = 0.03).
Fig. 1
Distributions of plasma NfL at baseline, 3, and 6 months (A) and change in plasma NfL from baseline to 3 months and from baseline to 6 months in the cycling and stretching groups (B). Plasma NfL at baseline, 3, and 6 months were not significantly different from each other (p value of 0.9791 of ordinary one-way ANOVA).
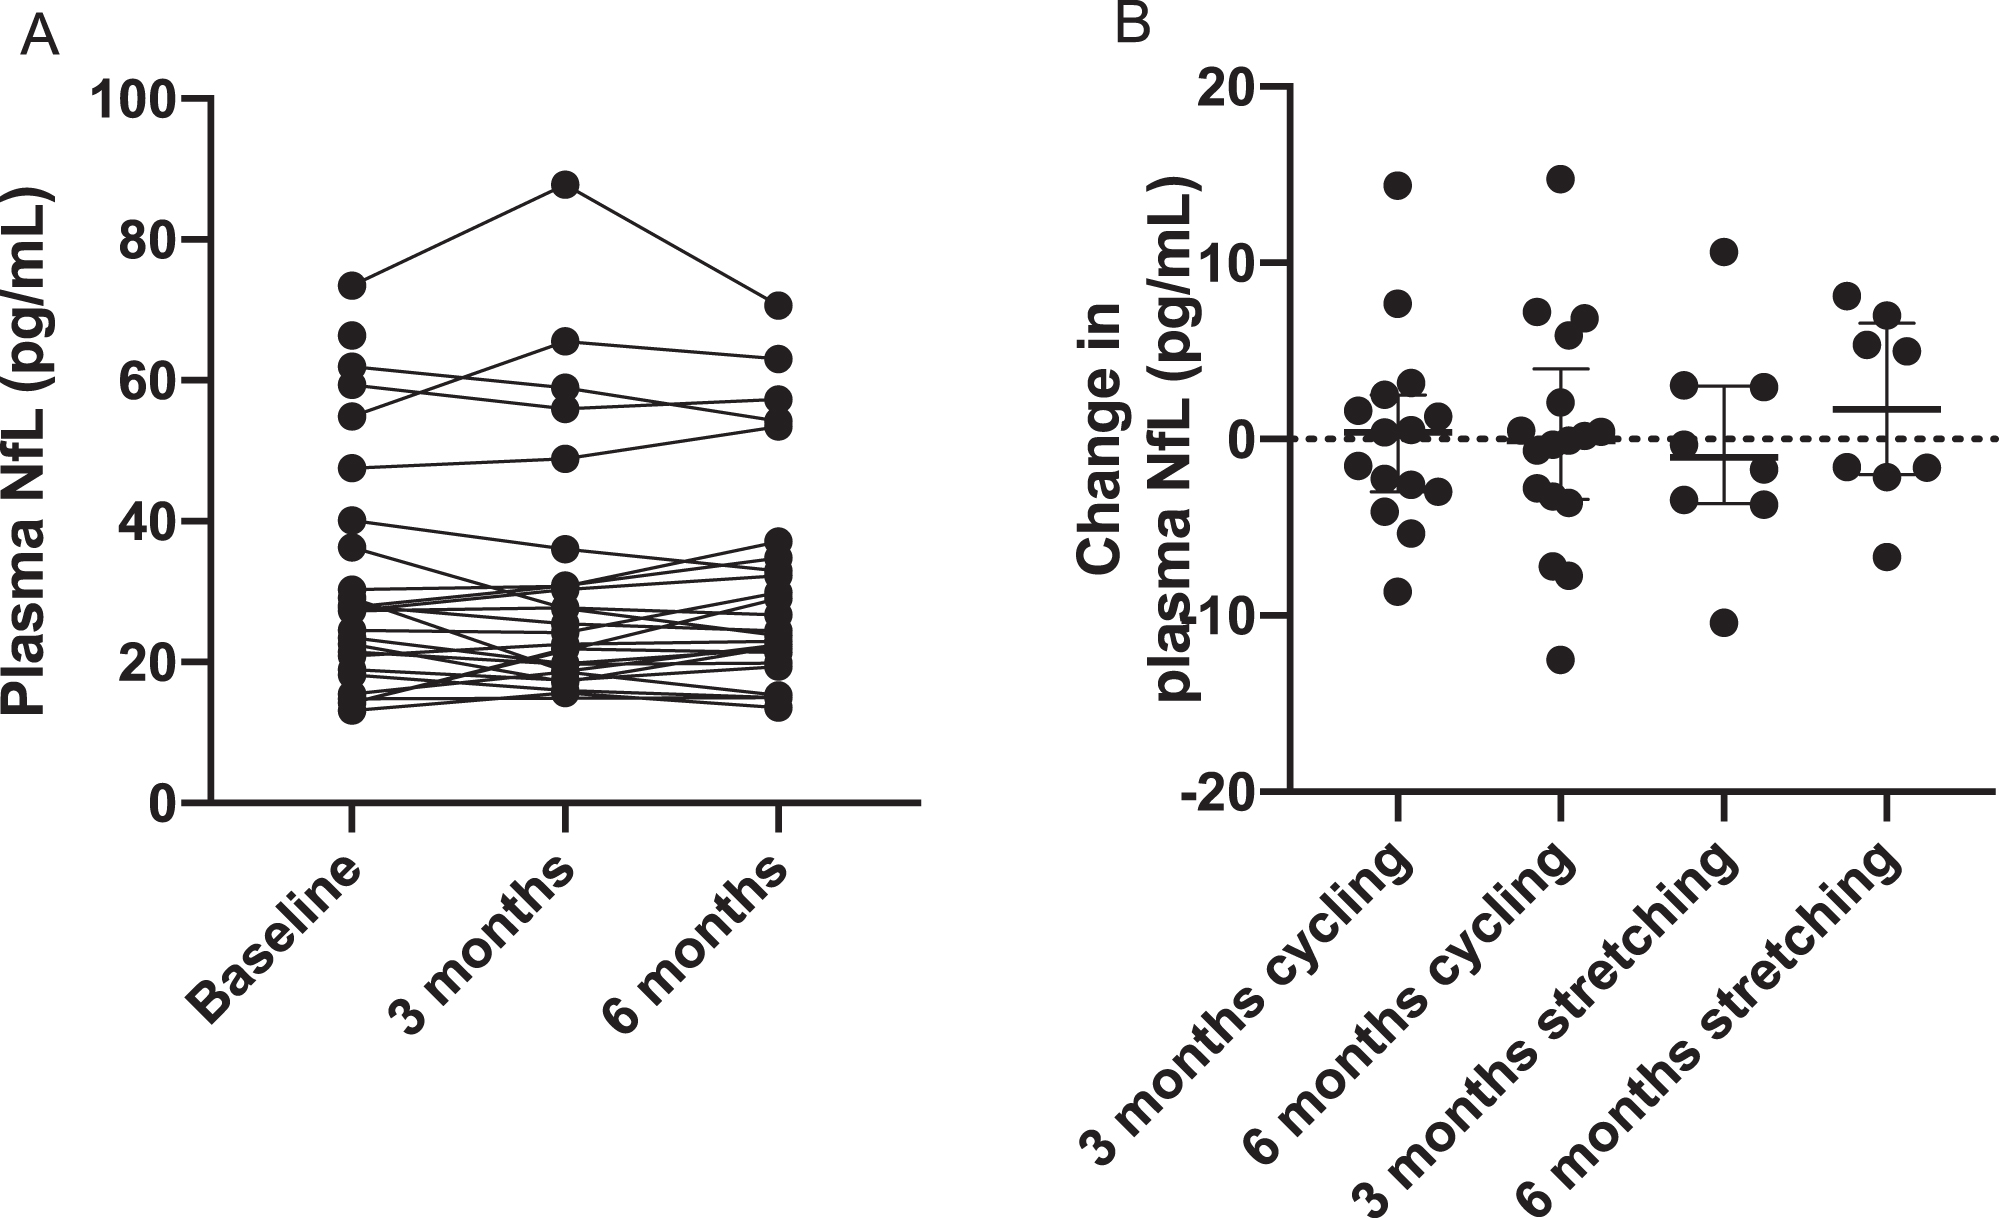
Table 2 displays the standardized coefficient estimates from linear mixed effects models that examined the associations between baseline plasma NfL and monthly rate of change in in global cognition, discrete cognitive domains, and ADL from 0–6 m or from 0–12 m, adjusted for age and sex (see Fig. 2 for scatter plots). Higher baseline plasma NfL was associated with greater 0–6 m monthly rates of decline in ADAS-Cog (standardized estimate of 0.00462, p = 0.02853) and greater 0–12 m monthly rate of decline in ADL (standardized estimate of –0.00284, p = 0.03338), but not with composite z-scores for discrete cognitive domains. As shown in the scatter plots, the associations of baseline NfL with 0–6 m rate of decline in ADAS-Cog and with 0–12 m rate of decline in ADL may be influenced by certain data points (see Fig. 2A1 and Fig. 2G2). After we performed sensitivity analysis by removing these influential points, these associations were no longer statistically significant.
Table 2
Association of baseline plasma NfL and 0–6 m or 0–12 m monthly rate of change in cognitive and functional outcomes
| Outcome | Value | Baseline plasma NfL versus 0–6 m rate of change | Baseline plasma NfL versus 0–12 m rate of change |
| ADAS-Cog | Std.Est (= Est/SD) | 0.00462 | 0.00097 |
| T.stat (= Est/SEM) | 2.25526 | 0.72216 | |
| pval | 0.02853 | 0.47191 | |
| Attention | Std.Est (= Est/SD) | 0.00118 | 0.00091 |
| T.stat (= Est/SEM) | 0.41809 | 0.69618 | |
| pval | 0.67771 | 0.48800 | |
| Executive | Std.Est (= Est/SD) | 0.00095 | 0.00036 |
| T.stat (= Est/SEM) | 0.35036 | 0.26396 | |
| pval | 0.72757 | 0.79237 | |
| Language | Std.Est (= Est/SD) | 0.00281 | 0.00163 |
| T.stat (= Est/SEM) | 1.03356 | 1.18036 | |
| pval | 0.30642 | 0.24077 | |
| Memory | Std.Est (= Est/SD) | 0.00098 | 0.00103 |
| T.stat (= Est/SEM) | 0.53602 | 0.75440 | |
| pval | 0.59437 | 0.45245 | |
| Processing | Std.Est (= Est/SD) | –0.00333 | –0.00073 |
| T.stat (= Est/SEM) | –1.17760 | –0.52483 | |
| pval | 0.24464 | 0.60091 | |
| DAD | Std.Est (= Est/SD) | –0.00085 | –0.00284 |
| T.stat (= Est/SEM) | –0.32108 | –2.15789 | |
| pval | 0.74949 | 0.03338 |
DAD, Disability Assessment for Dementia.
Fig. 2
Scatter plots between baseline plasma NfL and 0–6 m or 0–12 m monthly rates of change in ADAS-Cog (A1-2), attention (B1-2), executive function (C1-2), language (D1-2), memory (E1-2), processing function (F1-2), and DAD (G1-2).
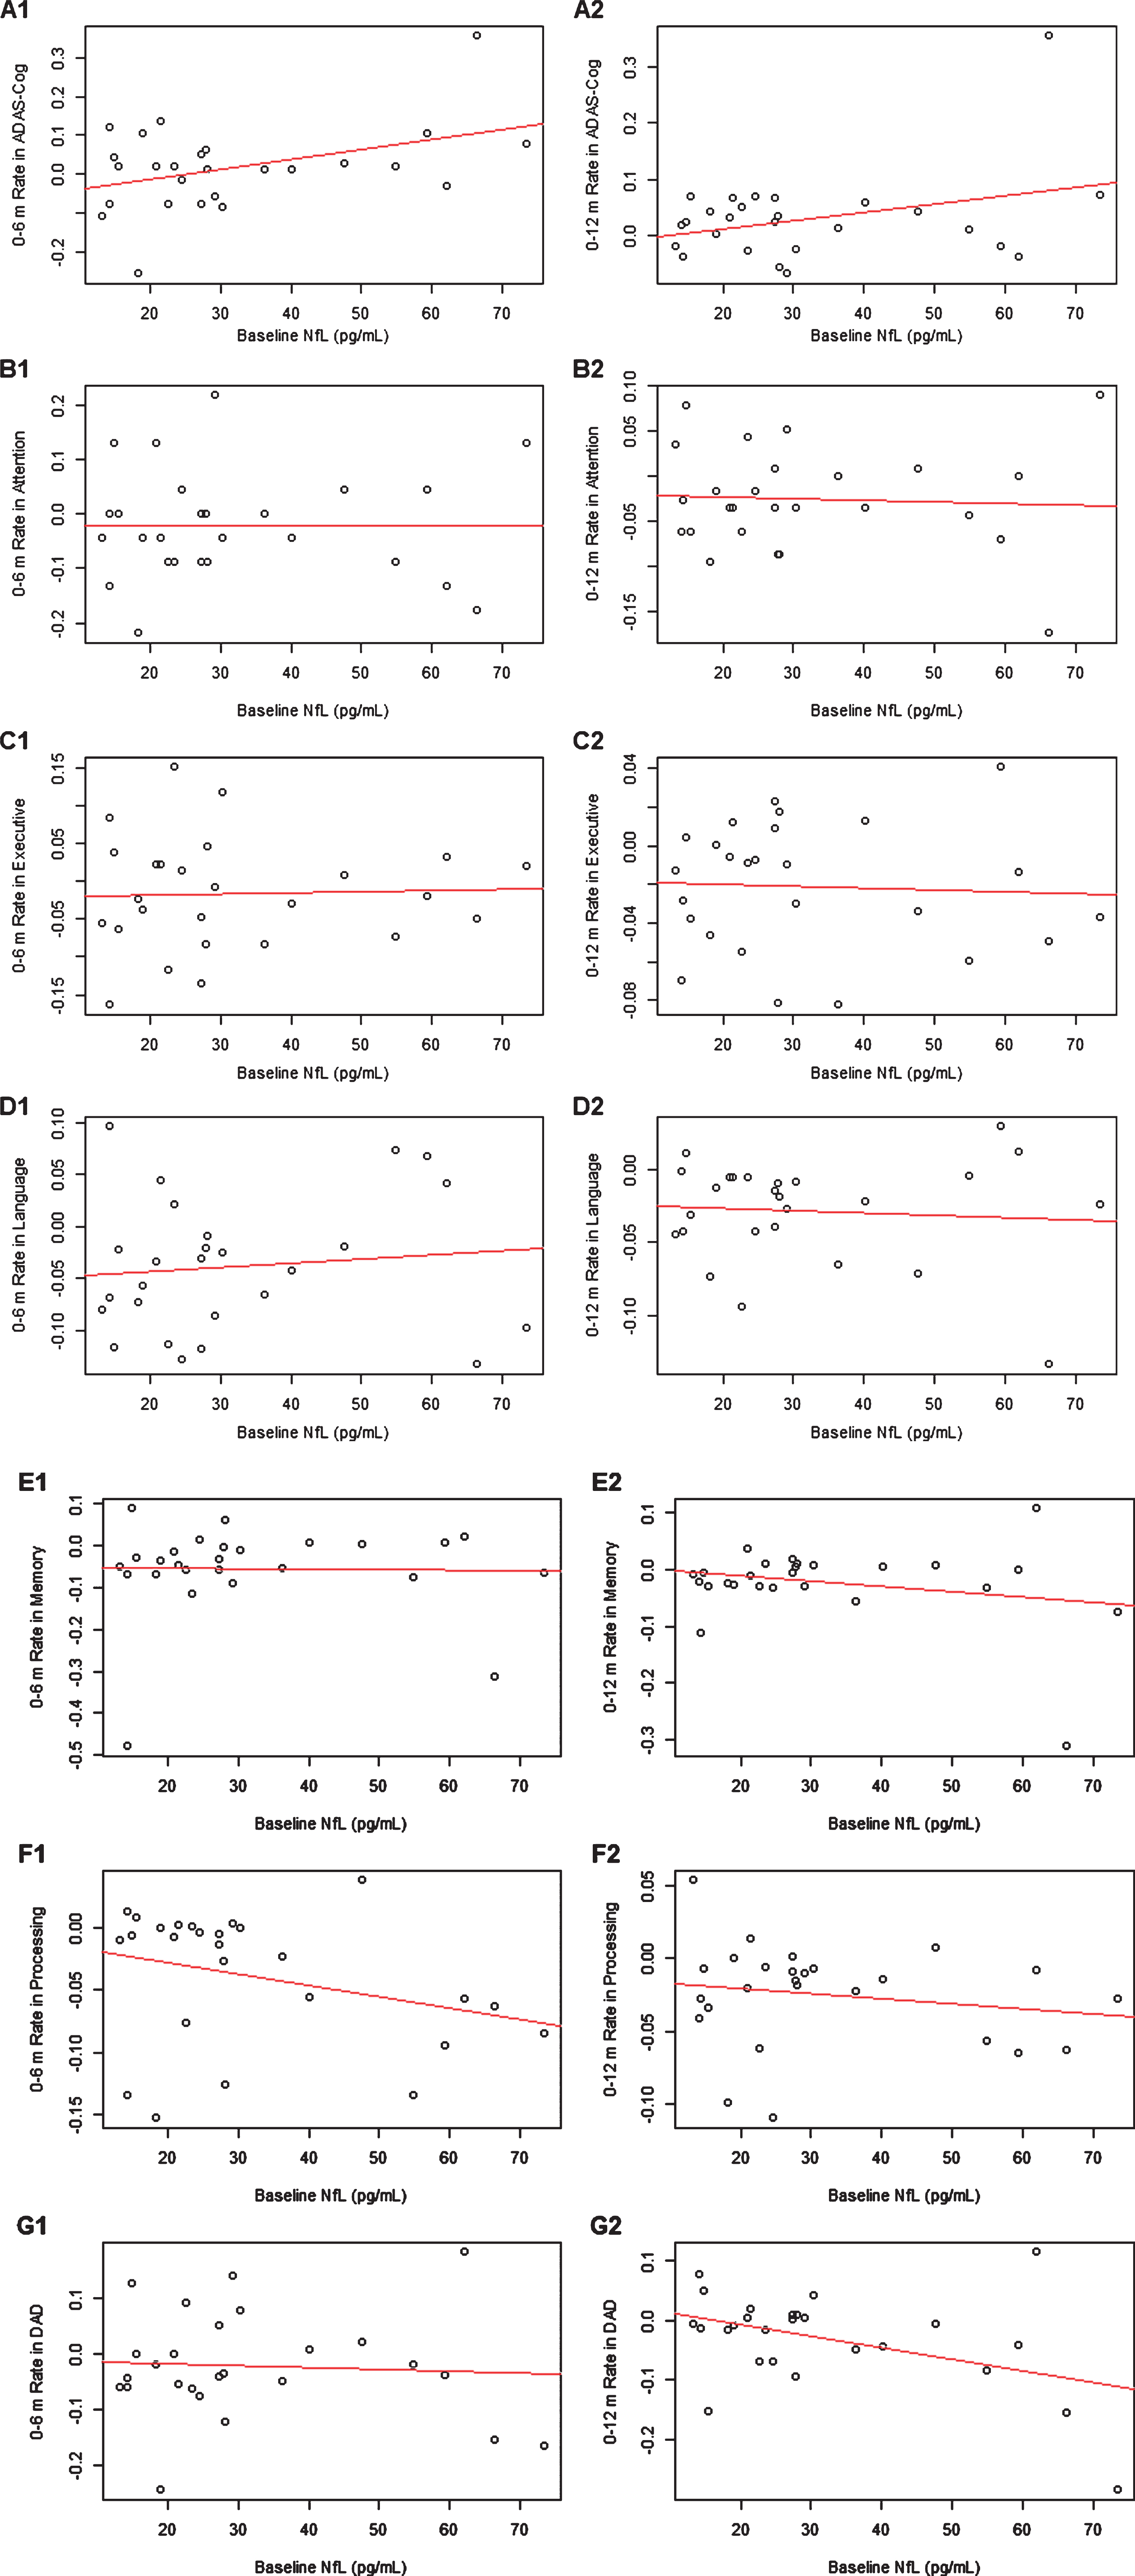
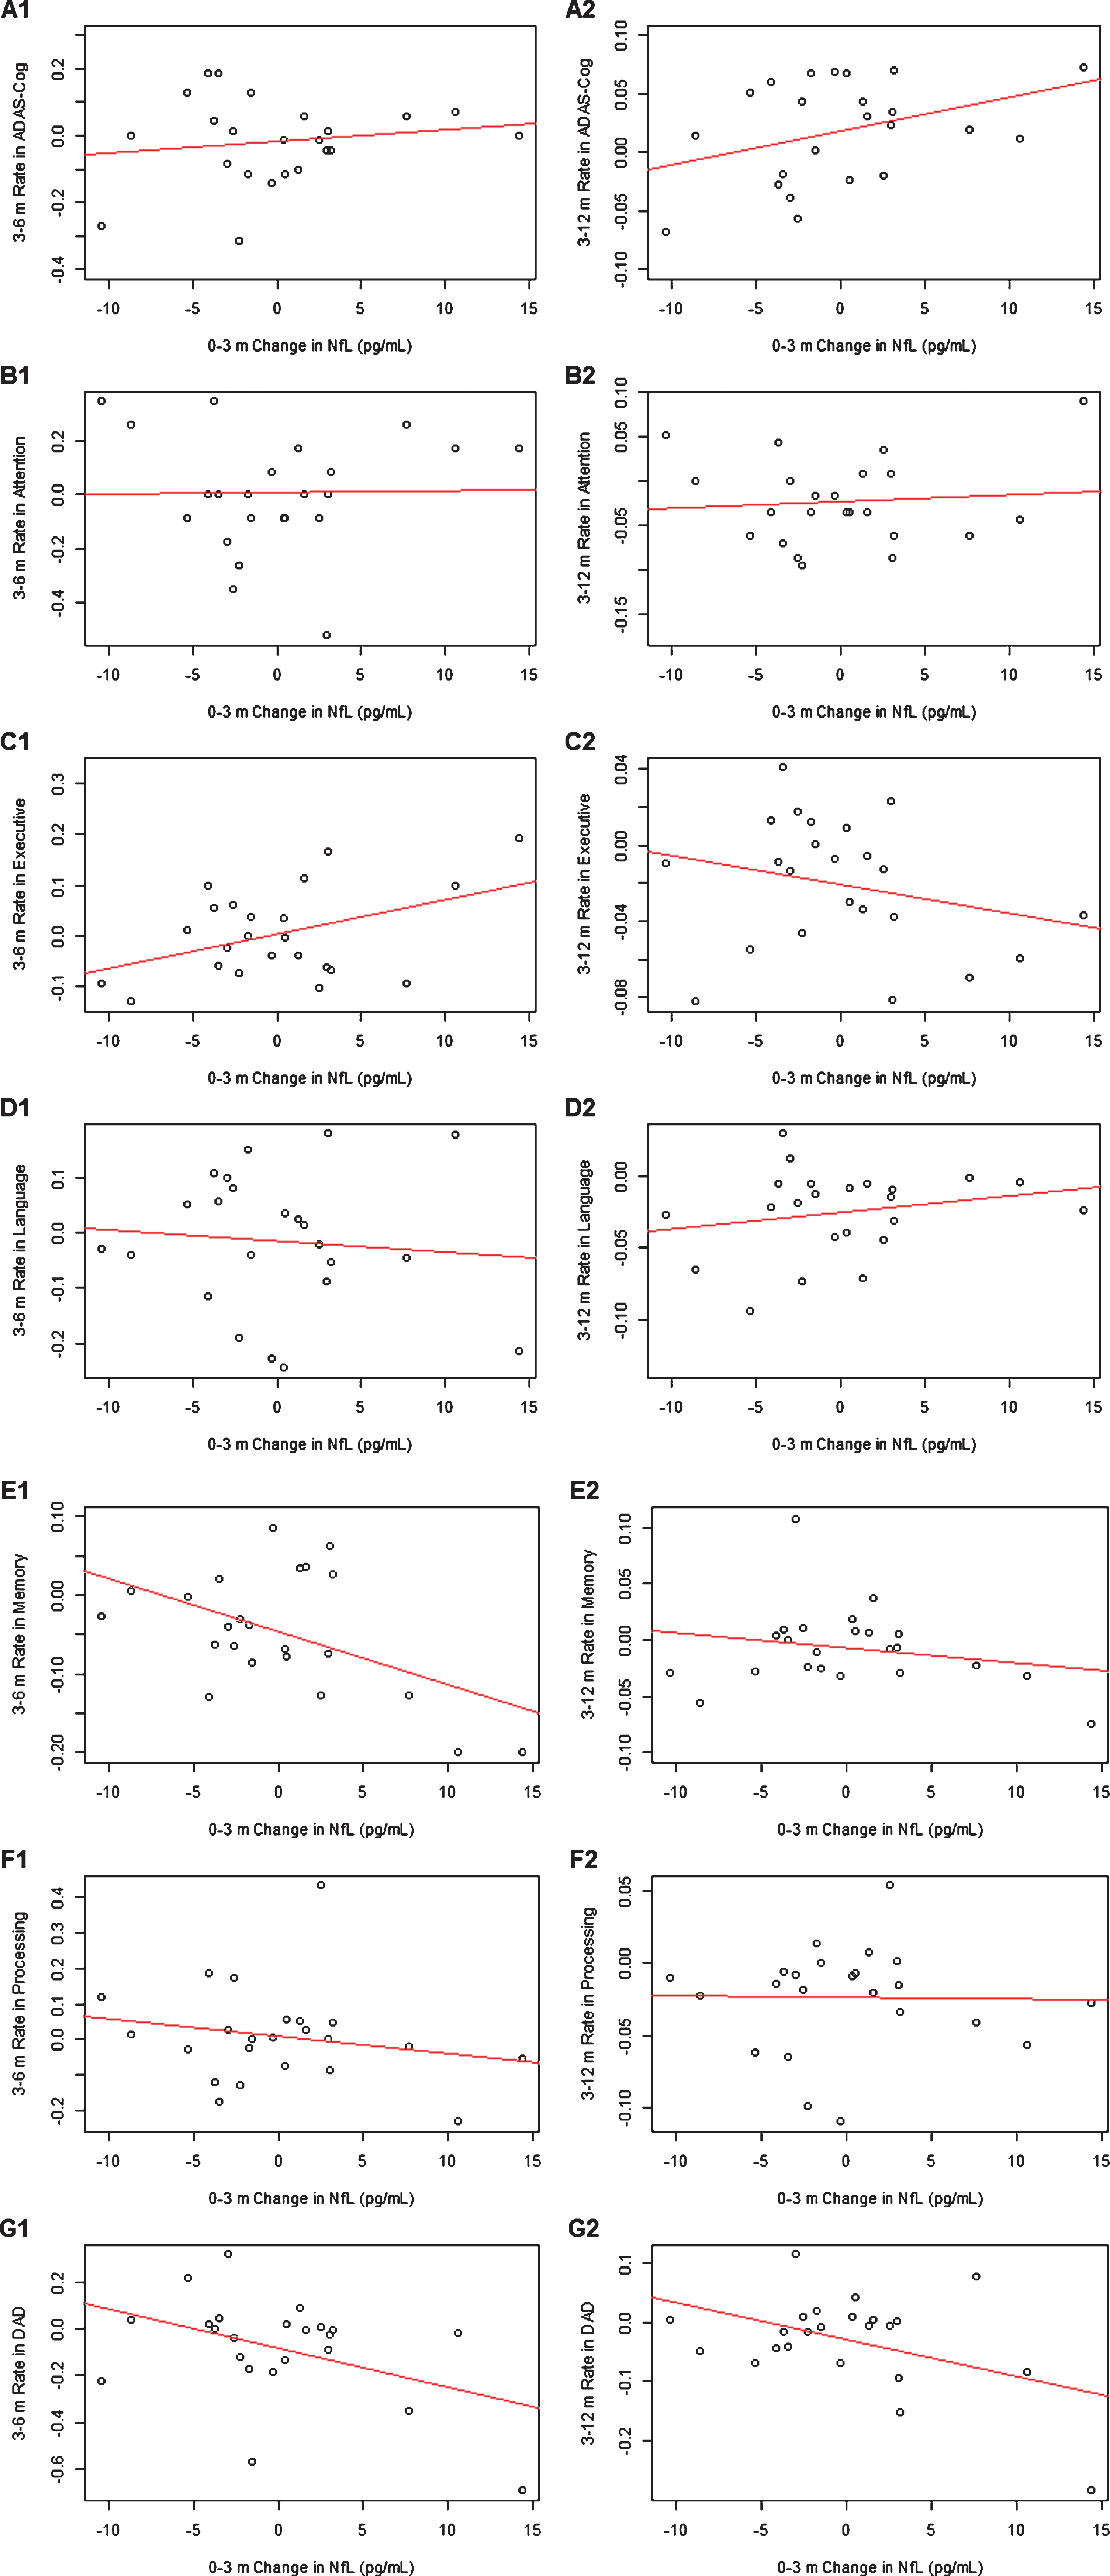
Table 3 displays the standardized coefficient estimates between 0–3 m change in plasma NfL and 3–6 m or 3–12 m monthly change in cognitive and functional outcomes, adjusted for age and sex (see Fig. 3 for scatter plots). Greater increase in 0–3 m plasma NfL was associated with greater increase in 3–6 m rate of change in executive function, and greater decrease in 3–6 m rates of change in memory and ADL (standardized estimate of 0.03932, p =0.03815; standardized estimate of –0.4638, p =0.01635; standardized estimate of –0.03818, p = 0.0435, respectively), as well as with greater increase in 3–12 m rates of change in ADL (standardized estimate of –0.01492, p = 0.01082). Greater 0–3 m increase in plasma NfL had a trend of association with greater 3–12 m rate of decline in memory (standardized estimate of –0.01180, p = 0.05196). No influential data point was identified for the associations between 0–3 m change in plasma NfL versus 3–6 m rates of change in executive function or memory. After removing one influential point, the association between 0–3 m plasma NfL change versus 3–6 m or 3–12 m rate of change in total ADL were no longer statistically significant.
Table 3
Association of 0–3-month change in plasma NfL and 3–6 m or 3–12 m monthly rate of change in cognitive and functional outcomes
| Outcome | Value | 0–3 m change in plasma NfL versus 3–6 m Rate of change | 0–3 m change in plasma NfL versus 3–12 m Rate of change |
| ADAS-Cog | Std.Est (= Est/SD) | 0.01269 | 0.00845 |
| T.stat (= Est/SEM) | 0.71434 | 1.39912 | |
| pval | 0.48288 | 0.16653 | |
| Attention | Std.Est (= Est/SD) | 0.00126 | 0.00186 |
| T.stat (= Est/SEM) | 0.07106 | 0.31188 | |
| pval | 0.94403 | 0.75615 | |
| Executive | Std.Est (= Est/SD) | 0.03932 | –0.00124 |
| T.stat (= Est/SEM) | 2.21250 | –0.20852 | |
| pval | 0.03815 | 0.83549 | |
| Language | Std.Est (= Est/SD) | –0.00758 | 0.00266 |
| T.stat (= Est/SEM) | –0.42667 | 0.43825 | |
| pval | 0.67396 | 0.66268 | |
| Memory | Std.Est (= Est/SD) | –0.04638 | –0.01180 |
| T.stat (= Est/SEM) | –2.61011 | –1.98044 | |
| pval | 0.01635 | 0.05196 | |
| Processing | Std.Est (= Est/SD) | –0.01681 | 0.00011 |
| T.stat (= Est/SEM) | –0.94569 | 0.02220 | |
| pval | 0.35506 | 0.98236 | |
| DAD | Std.Est (= Est/SD) | –0.03818 | –0.01492 |
| T.stat (= Est/SEM) | –2.14841 | –2.62399 | |
| pval | 0.04350 | 0.01082 |
DAD, Disability Assessment for Dementia.
Fig. 3
Scatter plots between 0–3 month change in plasma NfL and 3–6 m or 3–12 m monthly rates of change in ADAS-Cog (A1-2), attention (B1-2), executive function (C1-2), language (D1-2), memory (E1-2), processing function (F1-2), and DAD (G1-2).
Finally, we compared whether baseline plasma NfL levels differed between decliners non decliners defined by their 0–12 m rate of ASAS-Cog> = 0 or < 0, respectively. Two-sample t test and F tests showed no difference of mean and variance of baseline plasma NfL, 0–3 m or 0–6 m change in plasma NfL, between decliners versus non-decliners.
DISCUSSION
There is much interest in using NfL for selecting study participants and for monitoring efficacy of treatment in clinical trials [14]. This study evaluated the potential of baseline plasma NfL and 3-month changes in plasma NfL for serving as surrogate endpoints in clinical trials. Our findings reported significant associations between higher baseline plasma NfL and greater 0–6 m rate of decline in ADAS-Cog or greater 0–12 m rate of decline in ADL. More importantly, we reported significant associations between greater 0–3 m increase in plasma NfL with greater 3–6 m rate of decline in memory (3–12 m rate of decline in memory had a trend of association, p = 0.05196) and greater 3–6 and 3–12 m rate of declines in ADL.
Emerging evidence suggested the associations between baseline plasma NfL and cognitive decline in epidemiological studies and clinical trials across the AD clinical spectrum [9, 12–14]. For example, Mattsson et al. demonstrated the associations between baseline plasma NfL (i.e., expressed in quintile) and changes in MMSE, ADAD-Cog, discrete cognitive domain measures, and neuroimaging measures in an epidemiological study of cognitively healthy controls, MCI and AD dementia who were followed up yearly over 4 years [9]. Mielke et al. found baseline plasma NfL was associated with imaging AD biomarkers (except for PET amyloid) and global cognition in a cognitive unimpaired cohort that was followed every 15 months in the Mayo Clinic Study of Aging [12]. Recently, data from an 18-month phase III clinical trial reported associations between baseline plasma NfL and short-term changes (i.e., 3- to 6-month) in cognitive and functional outcomes in participants with mild AD [14]. Our findings are also consistent with the previous phase 3 clinical trial that higher baseline plasma NfL was linked to greater 0–6 m cognitive decline and 0–12 m functional decline in AD dementia.
To our knowledge, our study is the first to report on 0–3 m change in plasma NfL in association with 3–6 m and 3–12 m monthly rates of change in cognitive and function outcomes (i.e., memory and ADL) in AD dementia. Raket et al. only measured plasma NfL every 9 months in their clinical trial [14]. Mattsson et al. reported correlations between slopes of longitudinal changes in plasma NfL levels and slopes of longitudinal changes in ASAD-Cog in older adults with AD dementia with annual follow-ups in ADNI [13]. The stronger association between 0–3 m change in NfL with monthly rate of change in memory than other discrete cognitive domains is consistent with the observation that patients with AD dementia exhibit most cognitive decline in memory domain [31].
Another interesting finding from our study is the associations of the changes in NfL with ADL as measured by DAD. DAD measures both instrumental and basic ADL based on caregiver reports, focusing on executive tasks such as initiating, planning, and organization of an activity [32]. It will be important to evaluate in future studies if the associations between NfL and ADL might be attributable to a mediating or moderating effect of executive function or could persist when using performance-based measures of ADL. Our sample size was too small to do such a testing.
Because greater increases in 0–3 m in plasma NfL had consistent associations with 3–6 m and 3–12 m rates of decline in memory and ADL whereas baseline NfL did not have consistent patterns for 0–6 m and 0–12 m rates of change in any outcomes, the change in plasma NfL might have stronger associations with changes in cognitive and functional outcomes than baseline plasma NfL. This is consistent with our findings that plasma NfL has a low within-subject variability of 12%and a high between-subject variability of 92%, suggesting that serial monitoring NfL levels within a subject is more informative. Lastly, it is unexcepted that greater increase in 0–3 m plasma NfL was associated with greater increase, not decrease, in 3–6 m rate of change in executive function. Since 0–3 m change in plasma NfL was not associated with 3–12 m rate of change in executive function, suggesting that the association with 3–6 m rate of change might be random and due to small sample size.
The study strengths include frequent assessment of plasma NfL every 3 months, functional outcomes, and domain-specific cognition. Our findings are limited by a small sample size, the homogeneous sample of predominately White and very well-educated participants, a greater representation of mild than moderate AD dementia, and lack of ability to detect subgroup differences by age or sex. Lastly, the study did not adjust for multiple testing/comparison.
CONCLUSIONS
This study provided initial evidence that baseline plasma NfL and its 3-month changes are associated with the rates of changes in cognition and ADL, although these relations were influenced by a couple influence data points. Therefore, future studies that include bigger sample sizes are still needed to evaluate whether plasma NfL has the potential to serve as surrogate endpoints for predicting treatment responses in clinical trials of AD dementia.
ACKNOWLEDGMENTS
We thank the staff and participants of the FIT-AD Trial. The research study reported in this publication was supported by the Alzheimer’s Association NIRG (#NIRG-15-362393) and by the National Institute on Aging of the National Institutes of Health under Award Number R01AG059654. The FIT-AD Trial was supported by the National Institute on Aging of the National Institutes of Health under Award Number R01AG043392-01A1. The content is solely the responsibility of the authors and does not necessarily present the official review of the National Institutes of health.
CONFLICT OF INTEREST
The authors have no conflict of interest to report.
REFERENCES
[1] | Vellas B , Andrieu S , Sampaio C , Coley N , Wilcock G ((2008) ) Endpoints for trials in Alzheimer’s disease: A European task force consensus. Lancet Neurol 7: , 436–450. |
[2] | Hampel H , Wilcock G , Andrieu S , Aisen P , Blennow K , Broich K , Carrillo M , Fox NC , Frisoni GB , Isaac M ((2011) ) Biomarkers for Alzheimer’s disease therapeutic trials. Prog Neurobiol 95: , 579–593. |
[3] | Hoffman PN , Cleveland DW , Griffin JW , Landes PW , Cowan NJ , Price DL ((1987) ) Neurofilament gene expression: A major determinant of axonal caliber. Proc Natl Acad Sci U S A 84: , 3472–3476. |
[4] | Norgren N , Rosengren L , Stigbrand T ((2003) ) Elevated neurofilament levels in neurological diseases. Brain Res 987: , 25–31. |
[5] | Scherling CS , Hall T , Berisha F , Klepac K , Karydas A , Coppola G , Kramer JH , Rabinovici G , Ahlijanian M , Miller BL , Seeley W , Grinberg LT , Rosen H , Meredith J Jr. , Boxer AL ((2014) ) Cerebrospinal fluid neurofilament concentration reflects disease severity in frontotemporal degeneration. Ann Neurol 75: , 116–126. |
[6] | Teunissen CE , Dijkstra C , Polman C ((2005) ) Biological markers in CSF and blood for axonal degeneration in multiple sclerosis. Lancet Neurol 4: , 32–41. |
[7] | Shahim P , Gren M , Liman V , Andreasson U , Norgren N , Tegner Y , Mattsson N , Andreasen N , Ost M , Zetterberg H , Nellgard B , Blennow K ((2016) ) Serum neurofilament light protein predicts clinical outcome in traumatic brain injury. Sci Rep 6: , 36791. |
[8] | Hansson O , Janelidze S , Hall S , Magdalinou N , Lees AJ , Andreasson U , Norgren N , Linder J , Forsgren L , Constantinescu R , Zetterberg H , Blennow K ((2017) ) Blood-based NfL: A biomarker for differential diagnosis of parkinsonian disorder. Neurology 88: , 930–937. |
[9] | Mattsson N , Andreasson U , Zetterberg H , Blennow K ((2017) ) Association of plasma neurofilament light with neurodegeneration in patients with Alzheimer disease. JAMA Neurol 74: , 557–566. |
[10] | Mielke MM , Hagen CE , Xu J , Chai X , Vemuri P , Lowe VJ , Airey DC , Knopman DS , Roberts RO , Machulda MM , Jack CR Jr. , Petersen RC , Dage JL ((2018) ) Plasma phospho-tau181 increases with Alzheimer’s disease clinical severity and is associated with tau- and amyloid-positron emission tomography. Alzheimers Dement 14: , 989–997. |
[11] | Preische O , Schultz SA , Apel A , Kuhle J , Kaeser SA , Barro C , Graber S , Kuder-Buletta E , LaFougere C , Laske C , Voglein J , Levin J , Masters CL , Martins R , Schofield PR , Rossor MN , Graff-Radford NR , Salloway S , Ghetti B , Ringman JM , Noble JM , Chhatwal J , Goate AM , Benzinger TLS , Morris JC , Bateman RJ , Wang G , Fagan AM , McDade EM , Gordon BA , Jucker M , Dominantly Inherited Alzheimer Network ((2019) ) Serum neurofilament dynamics predicts neurodegeneration and clinical progression in presymptomatic Alzheimer’s disease. Nat Med 25: , 277–283. |
[12] | Mielke MM , Syrjanen JA , Blennow K , Zetterberg H , Vemuri P , Skoog I , Machulda MM , Kremers WK , Knopman DS , Jack C Jr. , Petersen RC , Kern S ((2019) ) Plasma and CSF neurofilament light: Relation to longitudinal neuroimaging and cognitive measures. Neurology 93: , e252–e260. |
[13] | Mattsson N , Cullen NC , Andreasson U , Zetterberg H , Blennow K ((2019) ) Association between longitudinal plasma neurofilament light and neurodegeneration in patients with Alzheimer disease. JAMA Neurol 76: , 791–799. |
[14] | Raket LL , Kühnel L , Schmidt E , Blennow K , Zetterberg H , Mattsson-Carlgren N ((2020) ) Utility of plasma neurofilament light and total tau for clinical trials in Alzheimer’s disease. Alzheimers Dement (Amst) 12: , e12099. |
[15] | Yu F , Bronas UG , Konety S , Nelson NW , Dysken M , Jack C Jr. , Wyman JF , Vock D , Smith G ((2014) ) Effects of aerobic exercise on cognition and hippocampal volume in Alzheimer’s disease: Study protocol of a randomized controlled trial (The FIT-AD trial). Trials 15: , 394. |
[16] | Yu F , Vock DM , Zhang L , Salisbury D , Nelson NW , Chow LS , Smith G , Barclay TR , Dysken M , Wyman JF ((2021) ) Cognitive effects of aerobic exercise in Alzheimer’s disease: A pilot randomized controlled trial. J Alzheimers Dis 80: , 233–244. |
[17] | McKhann GM , Knopman DS , Chertkow H , Hyman BT , Jack CR , Kawas CH , Klunk WE , Koroshetz WJ , Manly JJ , Mayeux R ((2011) ) The diagnosis of dementia due to Alzheimer’s disease: Recommendations from the National Institute on Aging-Alzheimer’s Association workgroups on diagnostic guidelines for Alzheimer’s disease. Alzheimers Dement 7: , 263–269. |
[18] | Li D , Thomas R , Tsai MY , Li L , Vock DM , Greimel S , Yu F ((2016) ) Vascular biomarkers to predict response to exercise in Alzheimer’s disease: The study protocol. BMJ Open 6: , e011054. |
[19] | Rosen WG , Mohs RC , Davis KL ((1984) ) A new rating scale for Alzheimer’s disease. Am J Psychiatry 141: , 1356–1364. |
[20] | Wechsler D ((1997) ) Wechsler Adult Intelligence Scale (WAIS-III). The Psychological Corporation, San Antonio, TX. |
[21] | Benedict R , Schretlen D , Brandt J ((1997) ) Hopkins Verbal Learning Test-Revised: Instructions for administration and scoring. Psychological Assessment Resources, Odessa, FL. |
[22] | Reitan RM , Wolfson D ((2004) ) The Trail Making Test as an initial screening procedure for neuropsychological impairment in older children. Arch Clin Neuropsychol 19: , 281–288. |
[23] | Royall DR , Mahurin RK , Gray KF ((1992) ) Bedside assessment of executive cognitive impairment: The executive interview. J Am Geriatr Soc 40: , 1221–1226. |
[24] | Royall DR , Cordes JA , Polk M ((1998) ) CLOX: An executive clock drawing task. J Neurol Neurosurg Psychiatry 64: , 588–594. |
[25] | Wechsler D ((2008) ) Wechsler adult intelligence scale–Fourth Edition (WAIS–IV). NCS Pearson, San Antonio, TX. |
[26] | Golden CJ , Freshwater SM (2002) Stroop Color and Word Test Kit for Adults. Stoelting. |
[27] | Ivnik RJ , Malec JF , Smith GE , Tangalos EG , Petersen RC ((1996) ) Neuropsychological tests’ norms above age 55: COWAT, BNT, MAE token, WRAT-R reading, AMNART, STROOP, TMT, and JLO. Clin Neuropsychol 10: , 262–278. |
[28] | Lucas JA , Ivnik RJ , Smith GE , Bohac DL , Tangalos EG , Graff-Radford NR , Petersen RC ((1998) ) Mayo’s older Americans normative studies: Category fluency norms. J Clin Exp Neuropsychol 20: , 194–200. |
[29] | Gélinas I , Gauthier L , McIntyre M , Gauthier S ((1999) ) Development of a functional measure for persons with Alzheimer’s disease: The disability assessment for dementia. Am J Occup Ther 53: , 471–481. |
[30] | Cosentino SA , Stern Y , Sokolov E , Scarmeas N , Manly JJ , Tang MX , Schupf N , Mayeux RP ((2010) ) Plasma beta-amyloid and cognitive decline. Arch Neurol 67: , 1485–1490. |
[31] | Ferreira D , Nordberg A , Westman E ((2020) ) Biological subtypes of Alzheimer disease: A systematic review and meta-analysis. Neurology 94: , 436–448. |
[32] | Feldman H , Sauter A , Donald A , Gelinas I , Gauthier S , Torfs K , Parys W , Mehnert A ((2001) ) The disability assessment for dementia scale: A 12-month study of functional ability in mild to moderate severity Alzheimer disease. Alzheimer Dis Assoc Disord 15: , 89–95. |


