
Reaction Time Decomposition as a Tool to Study Subcortical Ischemic Vascular Cognitive Impairment
Abstract
Background:
The study of reaction time (RT) and its intraindividual variability (IIV) in aging, cognitive impairment, and dementia typically fails to investigate the processing stages that contribute to an overall response. Applying “mental chronometry” techniques makes it possible to separately assess the role of processing components during environmental interaction.
Objective:
To determine whether RT and IIV-decomposition techniques can shed light on the nature of underlying deficits in subcortical ischemic vascular cognitive impairment (VCI). Using a novel iPad task, we examined whether VCI deficits occur during both initiation and movement phases of a response, and whether they are equally reflected in both RT and IIV.
Methods:
Touch cancellation RT and its IIV were measured in a group of younger adults (n = 22), cognitively healthy older adults (n = 21), and patients with VCI (n = 21) using an iPad task.
Results:
Whereas cognitively healthy aging affected the speed (RT) of response initiation and movement but not its variability (IIV), VCI resulted in both slowed RT and increased IIV for both response phases. Furthermore, there were group differences with respect to response phase.
Conclusion:
These results indicate that IIV can be more sensitive than absolute RT in separating VCI from normal aging. Furthermore, compared to cognitively healthy aging, VCI was characterized by significant deficits in planning/initiating action as well as performing movements. Such deficits have important implications for real life actions such as driving safety, employment, and falls risk.
INTRODUCTION
The overall speed with which a response is made to a stimulus within the visual environment has long been used as a sensitive probe into brain function. Coupled with the appropriate behavioral analysis and/or imaging techniques, reaction time (RT) measures can be used to identify functional deficits at any of the various stages of processing thought to contribute to even the most basic, everyday actions [1]. For example, deciding whether to swat or gently remove an insect that lands on your leg involves at least: detection (something just landed on my leg), recognition (it was a mosquito, ladybird, bee?), action selection (swat or brush), action preparation, action initiation and finally, online movement control. Additional factors, such as knowledge about one’s own motor capabilities and/or the presence of other objects (that expensive wine glass on the table near your leg), may also influence the speed and nature of the movement performed.
By designing appropriate tasks and task manipulations that “decompose” overall RT, the contribution of individual processing stages or components can be directly assessed [1–8]. The strength of the sensory signal can be altered, to affect detection. Similarly, the identity of the stimulus, the nature of available responses, the presence or absence of “go” signals, the stability of the target once a movement has been made, the quality of feedback, and the inclusion of additional distractors, can all be manipulated, and the consequences for overall RT and thus behavior, measured. The starting point for the current work is the observation that the study of RT in aging and in clinical populations (such as individuals living with mild cognitive impairment or dementia) often does not make use of such a “mental chronometry” approach. This makes it hard to assess the integrity of specific processing components that could provide information about the integrity of many aspects of brain processing and thus the integrity of behaviours related to environmental interaction and response, everyday life, the experience of living with cognitive impairment and factors potentially contributing to signs and symptoms. Here, we begin to apply the idea of RT decomposition in the context of subcortical ischemic vascular cognitive impairment (VCI), a condition in which slowed RT is a commonly described clinical and research characteristic [9, 10]. Note however, that the information we gather is likely to be germane to the examination and study of many etiologies of cognitive impairment in which the measurement of RT forms a component of diagnostic and follow-up test batteries. Furthermore, as some evidence suggests that measuring the intraindividual variability of RT [IIV] in response to repeated trials may be more representative of or sensitive to pathological change in many disorders including dementia [8, 9], we also measure both RT and IIV in this study per se and with respect to component decomposition.
Subcortical ischemic VCI (herein referred to as VCI), ranging from mild cognitive impairment to vascular dementia (i.e., with minor and major neurocognitive impairment respectively, reflecting DSM V definition [11] and current diagnostic criteria [12]), is the most common and homogenous subtype of vascular cognitive impairment [8]. There is increasing evidence that VCI is the result of pathological changes affecting a considerably wider array and depth of function and network connectivity than previously recognized, and that the characteristic white matter ‘markers’ of VCI (e.g., those seen on neuroimaging) alone do not fully represent disease load or predict cognitive and functional integrity [9–17], nor all signs and symptoms. It is crucial therefore to identify additional techniques to those typically used in clinical diagnosis that can shed further light on the nature and impact of underlying deficits.
VCI is characterized by the disproportionate slowing (RT) and increased intra-individual variability (IIV) of behavioral responses compared to cognitively healthy aging [9, 10, 14, 16, 18–20]. However, it is also clear that individuals with ostensibly the same extent of disease can vary widely in RT and IIV [9, 10]. While such variation in these measures may represent individual differences in disease load and distribution, and methodological and demographic factors per se, it may also reflect variation in damage to specific information processing and motor components [9, 10, 20–24] that contribute to the RT and IIV outcome. The functional integrity of these may vary with respect to disease etiology, stage, and progression, which may contribute to the individual variation in signs and symptoms and thus behavior.
To date, the potential impact of disease-related abnormality in such component processes has been little considered. That is, RT and IIV are treated as complete measures, without the need for further decomposition. Our suggestion is that by exploiting established techniques for separating component processes, we might not only further our understanding of why behavioral responses vary with disease compared to cognitively healthy aging, but also gain insight into individual differences, how problems with specific components affect aspects of real life, their contribution to signs and symptoms, and personal experience of VCI.
The iPad-based RT task we introduce in the current paper is quick and easy to administer under research and clinical conditions and can be modified to isolate any of the component processes discussed above (see Methods section for full details). In this initial study, we focus simply on separating those components occurring up to and including the initiation of an action from those involved with the execution and control of the movement itself.
Compared to simple key-press RT tasks, here we asked participants to make directed finger movements to spatially distributed onscreen targets, thus including an extended motor phase which more closely approximates behaviorally-relevant everyday actions. Our goal was thus to separately assess the more cognitive from the purely motor-control components of the observed RT functions in three groups of participants; younger adult controls (YA), cognitively healthy older adult controls (CH) (the comparison of which will allow us to determine typical healthy aging-related changes), and patients with VCI.
We had three specific research questions. First, would VCI be associated with slowed RT and raised IIV using this test? Second, would deficits be observed in both initiation and movement phases of the response? Third, would deficits be equally reflected in RT and IIV, or would one or other of the measures be more sensitive to the pathological changes of VCI?
MATERIALS AND METHODS
Ethical approval
The study protocol was approved by the NHS Health and Research Authority Wales Research Ethics Committee 6, and Research and Development, Cardiff and Vale University Health Board. Written informed consent was obtained from all participants and all were fully debriefed at the end of the research session.
Participants
Patients with VCI, diagnosed according to Skrobot et al. 2017 [12], (n = 21) were recruited on an incident patient basis from the Memory Clinic at University Hospital Llandough, Wales, UK. An invitation letter which included a participant information sheet, researcher contact details, an opt-in form and pre-paid envelope, was sent to all individuals who expressed an interest in participation. All were diagnosed with minor or major neurocognitive disorder associated with lacunar infarcts, and most displayed ischemic white matter lesions, located predominantly subcortically. The minor and major terminology reflects DSM V definition and criteria [11] and inevitably there was a range of severity (as demonstrated by Montreal Cognitive Assessment (MoCA) range), though as all had capacity to consent, and no very low MoCA scores were present, those with major neurocognitive disorder/dementia were not severe.
Diagnosis was made after comprehensive assessment according to normal clinical practice. This included neuroimaging (normally CT scans, or MRI scans if requested), detailed clinical history, routine laboratory tests, and a battery of neuropsychological tests assessing executive function, attention, memory, language, visuospatial function (Addenbrooke’s Cognitive Examination III [25]) and MoCA [26], National Adult Reading Test (NART) [27], and mood (Hospital Anxiety and Depression Scale (HADS) [28]). Inclusion criteria included capacity to provide informed consent, mild to moderate cognitive impairment (MoCA score between 12 and 25 and/or ACE-III score between 50 and 90), normal or corrected-to-normal vision and hearing, and physical ability to perform the research tasks. Exclusion criteria included evidence of large vessel stroke, other significant contributory cause of cognitive impairment (e.g., clinically significant neurological, psychiatric, psychological, or medical conditions), use of psychoactive drugs, substance or alcohol dependency, and motor/manual dexterity problems. The CT and MRI scans examined as part of this study were those performed for diagnostic purposes and were examined with respect to the presence of subcortical and cortical infarcts and leukoaraiosis, mass lesion, focal atrophy, or other significant pathology. The extent of periventricular leukoaraiosis was assessed using the age-related white matter changes rating scale (ARWMC) [29]. Assessment was undertaken by two experienced professionals in the field (AB and AT) who independently rated each scan, yielding a 19 out of 21 scan consensus-rate. The remaining two scores were agreed by consensus.
The cognitively healthy older adult control group (CH) (n = 21) were recruited from relatives of patients attending the Llandough Memory Clinic and participating in this study, and from research volunteers from the Centre for Innovative Ageing (CIA), the Centre for Ageing and Dementia Research (CADR), and the older adult research volunteer database at Swansea University. Inclusion criteria included capacity to provide informed consent, MoCA score of >25, normal or corrected-to-normal vision and normal color vision and hearing, and physical ability to perform the research tasks. Exclusion criteria included self-reported cognitive change or impairment and/or past visits to their general practitioner or memory services regarding such concerns, clinical levels of anxiety and/or depression, significant neurological, psychiatric, or medical history (including stroke or transient ischemic attack), self-reported medication use likely to influence cognitive function, and current or history of substance or alcohol dependency. The CH group was age-matched as closely as possible to the VCI group (see demographic information in Table 1). Neuroimaging was not available for the control group.
Table 1
Demographics. Mean results. Standard deviation in parenthesis
| VCI n = 21 | CH n = 21 | Young n = 22 | |
| Mean Age (y) | 75.95 (4.72) | 74.19 (5.61) | 21.09 (1.93) |
| Age range | 68–83 | 69–86 | 20–27 |
| Gender | Male 57% | Male 19% | Male 32% |
| Female 43% | Female 81% | Female 68% | |
| Mean full time education (y) | 13.14 (2.65) | 16.29 (4.06) | 16.36 (1.65) |
| Educational range | 10–21 | 10–24 | 12–20 |
| Mean MoCA Score | 20.71 (3.04) | 28.57 (1.29) | 28.59 (1.05) |
| Mean HADS score: Anxiety | 5.85 (3.57) | 5.10 (3.87) | 7.36 (3.26) |
| Mean HADS score: Depression | 4.35 (3.27) | 2.05 (2.5) | 3.18 (3.61) |
MoCA, Montreal Cognitive Assessment; HADS, Hospital Anxiety and Depression Scale.
The young adult group (YA) [n = 22] were recruited from the Swansea University student population, family members of those with VCI recruited into this study, social media, and local newspapers. The inclusion and exclusion criteria were the same as for the cognitively healthy older adult control group.
Payment was not provided for participation. Travelling expenses were however reimbursed.
Task
The iREACT app used to measure RT implements a speeded touch cancellation task. The app was custom written by the research team and is freely available upon request.
On each trial, a target object flashes and changes color, and the participant must move their finger from a home button to touch and thereby cancel the change animation. Target objects themselves always remain visible, and a successful tap simply returns the object to its default, non-flashing state. The basic layout of the response collection screen is shown in Fig. 1. Note that each target is equidistant from the home button.
Fig. 1
A) The initial state of the response screen before the index finger is placed on the red home button. B) When the index finger (not shown) is placed on the home button, it turns green, and after a random interval one of the orange targets turns blue and begins to blink. The participants’ task is to move from the home button and touch the target as quickly as possible.
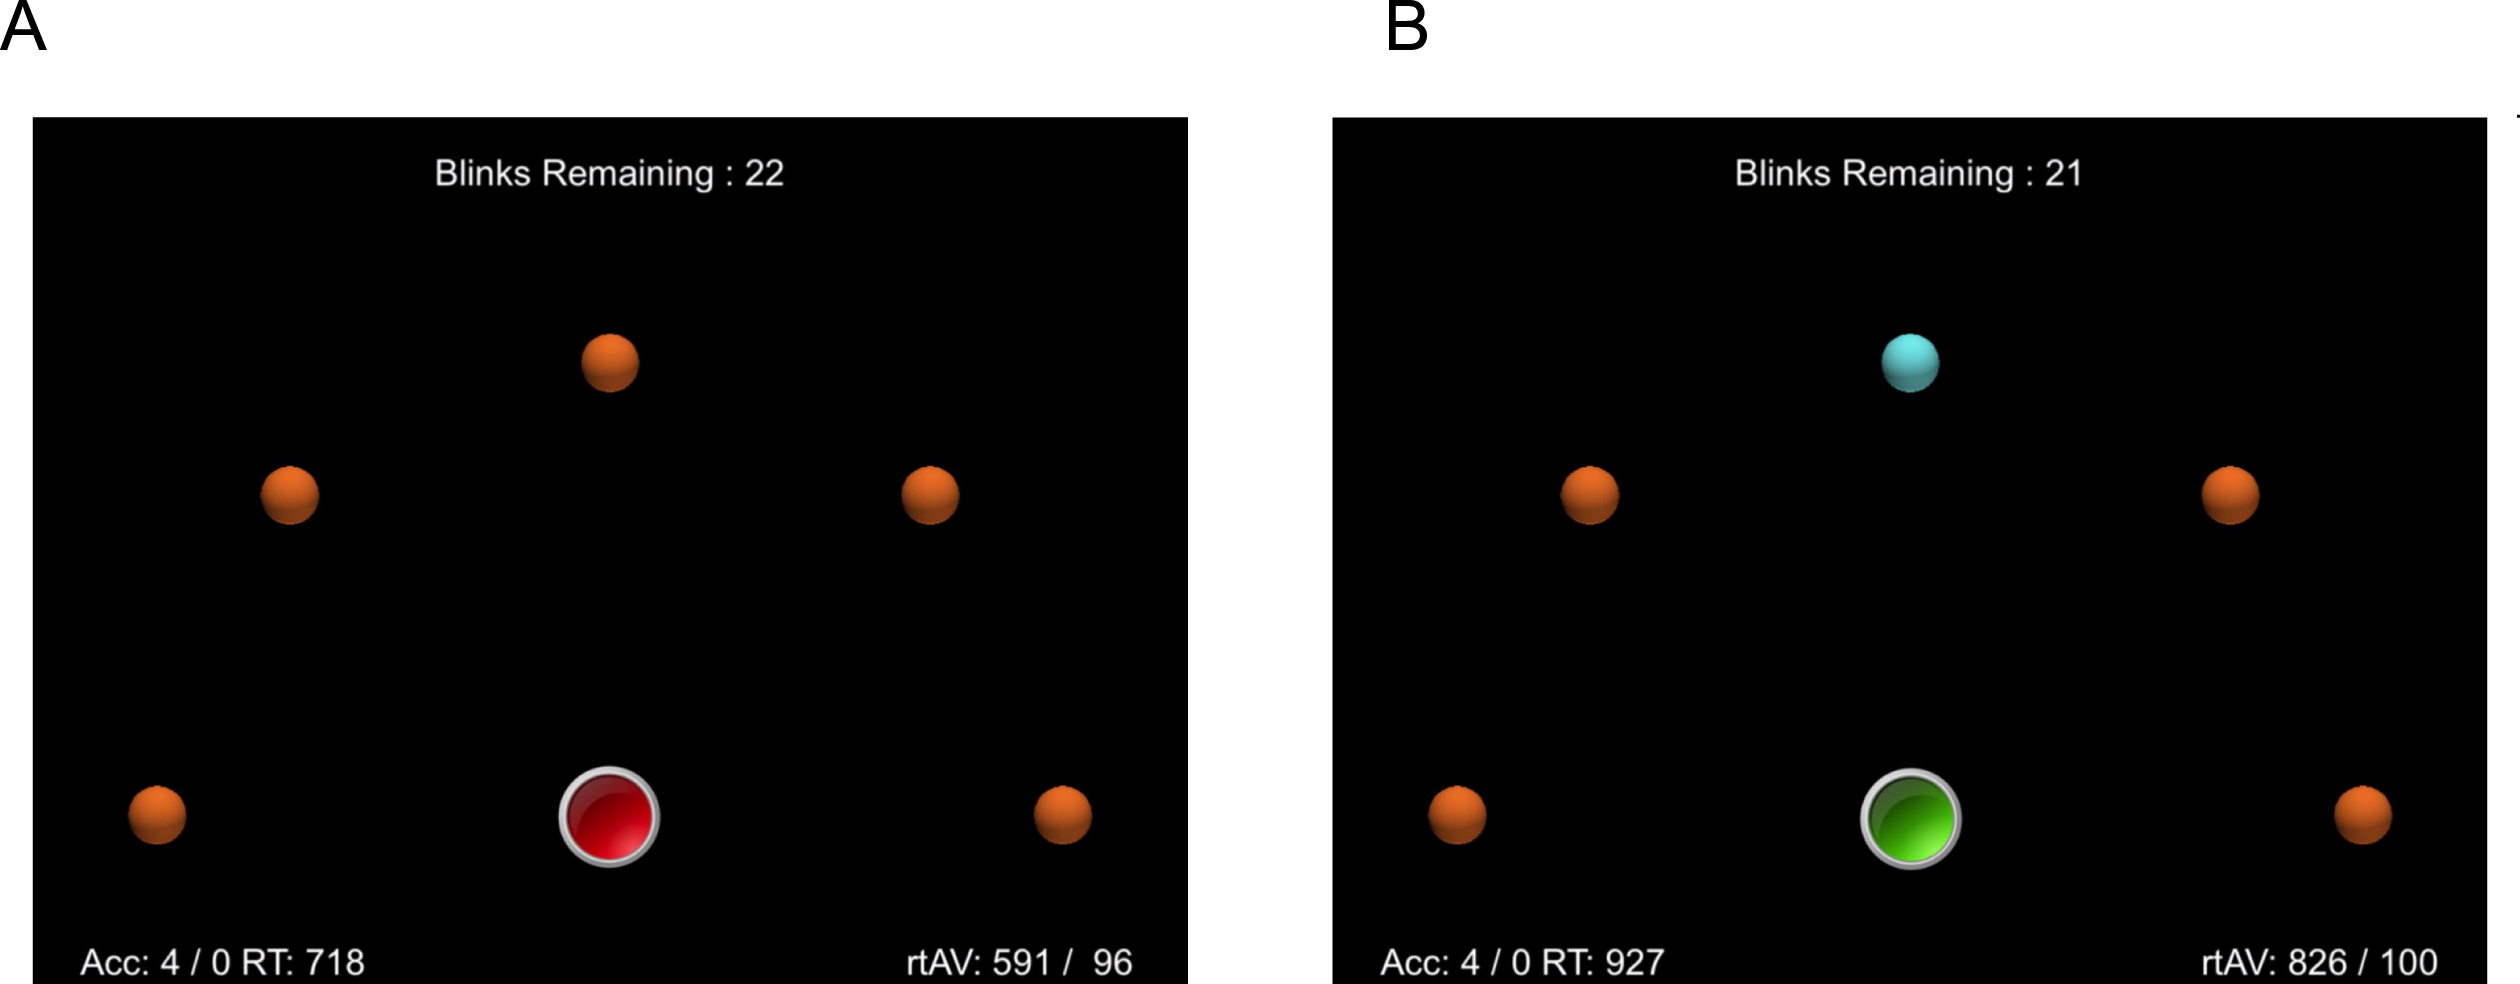
At the bottom center of the display is a large home button, which is drawn in red before the participant places their finger on the button. When pressed, the button turns green, signaling that the response phase has begun. Pressing the button starts a timer function that randomly selects an onset-target delay period. This period ranges from 500 ms to 2.0 s. When this period has run to completion, one of the target objects that form a semi-circle in the middle of the screen changes color (from orange to blue) and begins to “blink”. The participants’ task is to remove their finger from the home button and to move and touch the flashing target as quickly as possible. If a response is not initiated, the flashing terminates after 2.0 s, but the color remains blue, until the object is touched.
This task provides two main RT measures of interest. First, a lift-RT, defined as the period from flash onset until the finger is removed from the home button. Second, a movement-RT, defined as the period from finger-lift until the target object is touched. We also include a third measure, touch-precision, in order to explore possible speed/accuracy tradeoffs. Touch-precision is defined as the Euclidean distance between the center of the flashing object and the point of contact.
In the task variant used here, the number of target items was fixed at five. Each trial required 15 responses, three to each of the five object positions, selected at random. After each trial, a pause screen appeared, and participants could self-pace before continuing. Even during a trial, participants can self-pace, as the app is essentially paused until the home key is pressed to initiate the next event.
Display details
The iPad display has an effective resolution of 1024×768 pixels. The visible display area measures approximately 20×15 cm, meaning that each pixel occupies 0.0195 cm, or 0.195 mm. Each target object is an orange sphere with a bounding box of 52×52 pixels. On screen, these objects have an approximate diameter of 1 cm. The target objects are organized in a semi-circle with a radius of 400 pixels (7.8 cm). The leftmost and rightmost objects are on the same level as the home button, and the remaining objects are equally spaced, 45° apart (see Fig. 1). The home button itself has a bounding box of 90×90 pixels, with an onscreen diameter of approximately 1.8 cm.
Data file format
Data is stored on the iPad as simple tab-delimited text files. These files were extracted from the app using the iTunes File Sharing interface, and then viewed in any spreadsheet package (e.g., Microsoft Excel) and/or processed by appropriate analysis software.
Study procedure
Each participant was given a demonstration by the researcher on how to perform the task. Following this they received a practice trial of 15 responses to ensure they were physically able to see and to describe fully (including their colour) the stimuli to which they were expected to respond; that they were able to hear and understand the instructions and that they were able to tap the screen. There were four test trials, giving a total of 60 responses per participant. Each participant received a standardized set of verbal instructions. Practice trial data were excluded from data analysis. During practice and testing the iPad was placed flat on a table at which the participant sat.
Data availability
The raw data and supplementary materials are available on the OSF page associated with this paper at https://osf.io/fztbu/.
Data analysis
The raw RT distributions for the lift and move measures were initially filtered to remove extreme outliers (i.e., responses falling beyond +/– 2.5 SD from the mean of the respective groups). For the lift measure, the proportion of extreme outliers removed was comparable across groups (VCI = 1.8%, CH = 2.1%, YA = 2.7%). For the move measure, the VCI group had noticeably more data points excluded than the other groups, although still comparable with the VCI lift measure (VCI = 1.8%, CH = 0.7%, YA = 0.3%). The subsequent analysis with and without outlier exclusion gave qualitatively identical patterns of results. Nevertheless, we included these exclusion steps as such data points are by definition likely to reflect anticipations or other unusual trial events, rather than the underlying processes of interest.
Following extreme outlier exclusion, we used the median as our basic point-estimate of the underlying RT distributions and IQR as our index of IIV. These measures were calculated for each participant and then averaged as a function of measure, group, and object position. We note that there is ongoing debate as to whether the mean or median provide the best (i.e., least biased) point-estimate of underlying reaction time behavior (see Miller, 2020 [30] and Rousselet & Wilcox, 2020 [31] for recent discussion). However, we report the latter here as the use of IQR is standard practice when examining reaction time IIV [9, 10] and as already noted, overall patterns were not affected in parallel analyses based on mean and SD.
We also included measures of spatial precision to check for possible speed-accuracy trade-offs. Precision was computed by calculating the Euclidean Distance between the landing point on an object and the physical center of that object (in pixels). As responses were only registered if an object was physically touched, we did not include additional spatial exclusion criteria. Rather, responses were filtered out if they met the RT exclusion criteria for either the lift or move measures. In addition to the mean distance, we also report the respective standard deviations as a measure of intra-individual variation of IIV.
We used the same 3 (Group)×5 (Object) mixed ANOVA for all dependent measures. However, as initial examination revealed that RT patterns were not clearly modulated as a function of spatial position, in the main text we report only the main effect of Group. Full analysis of RT and IIV patterns are provided as supplementary analysis in the OSF materials. We report the full 3×5 ANOVA for the spatial precision analysis section as object position is clearly very relevant in this context. Violations of the sphericity assumption were corrected by adjusting the relevant degrees of freedom using the Greenhouse-Geisser method. We used a default alpha level of 0.05 throughout and adjusted this level with a Bonferroni correction for all post-hoc comparisons. For the RT measures, we also conducted correlations to examine for possible relationships between the response phases and response measures. Pre-empting the results below, as educational level was lower in the VCI compared to the other groups, we also examined whether education was correlated with Move and Lift RT and IIV. After Bonferroni correction there were no significant correlations [all p-values > 0.05]. Full details of the raw RT distributions as well as pre -and post-exclusion patterns can be found in the OSF supplementary material.
RESULTS
Lift measure
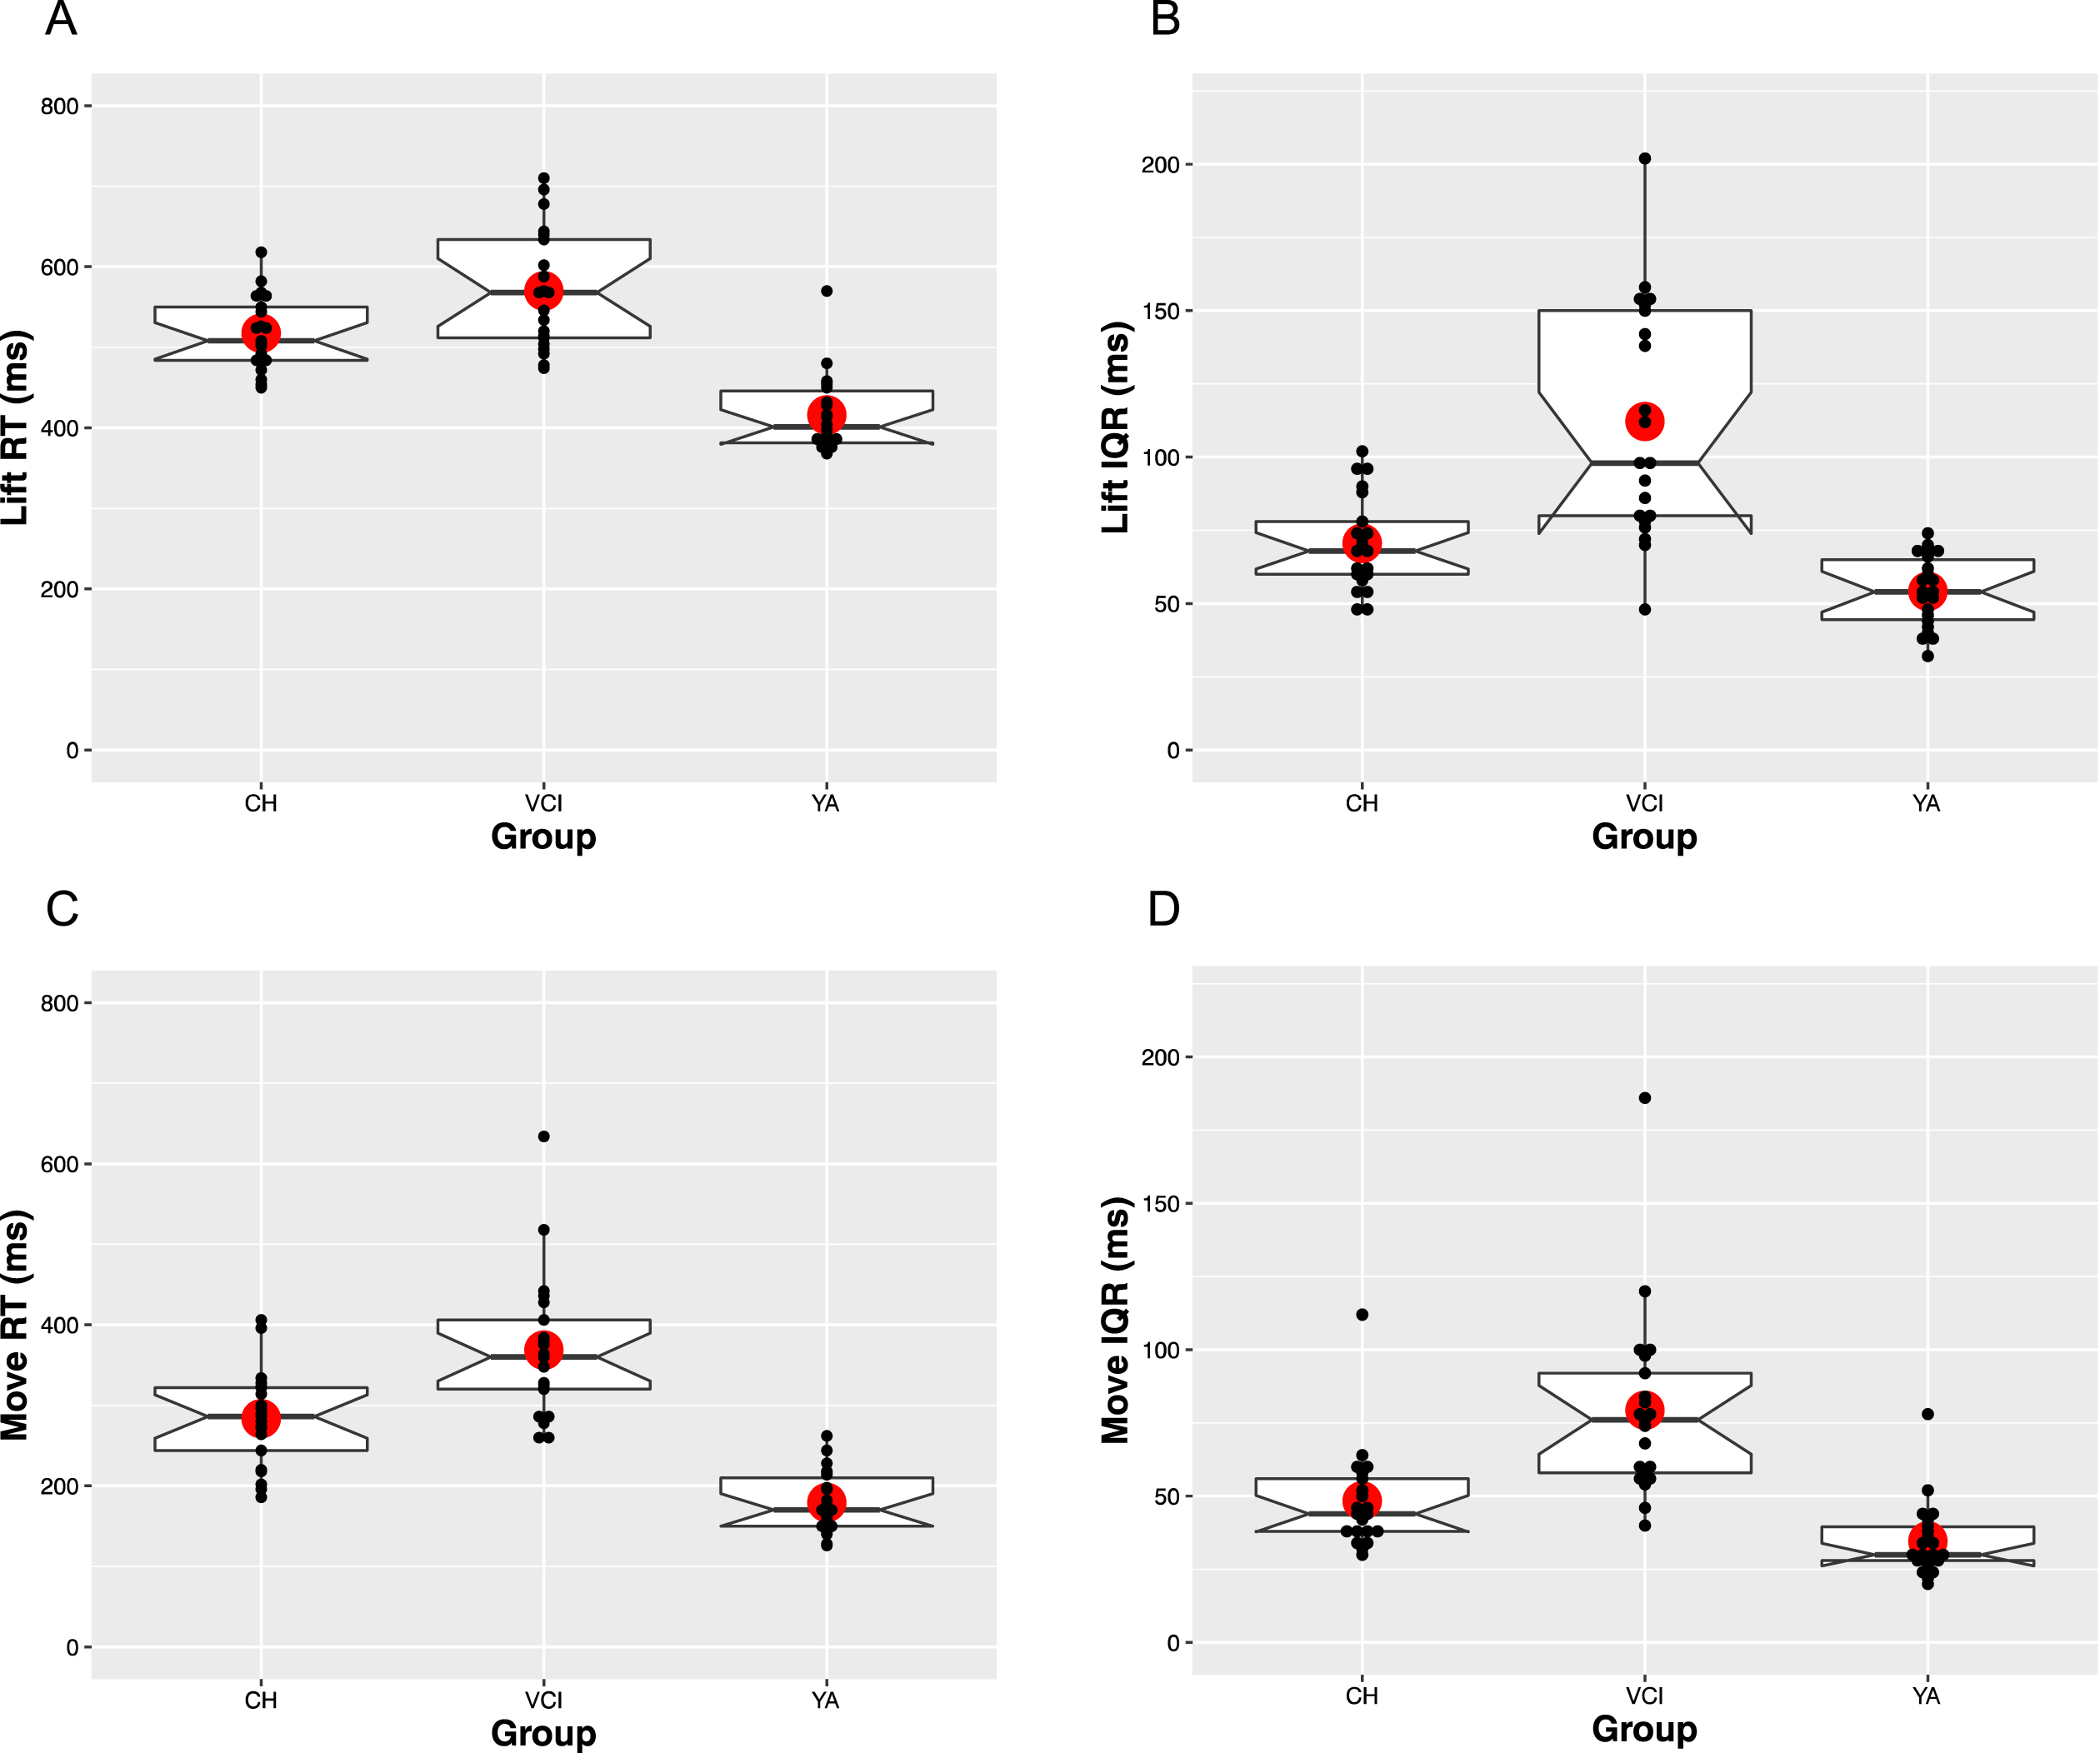
The upper panels of Fig. 2 show the median and IQR patterns for the Lift RT measure. In terms of overall speed (Fig. 2A), both CH [M = 517 ms, SE = 12] and VCI [M = 570 ms, SE = 12] participants were consistently slower to respond than YA participants [M = 416 ms, SE = 12]. Consistent with these patterns, there was a main effect of Group [F(2,61) = 40.6, MSE = 0.02, p < 0.001,
Fig. 2
RT and IQR patterns for both the lift and move measures, averaged across participants as a function of group. Horizontal lines show the median and large circle the mean of each distribution, with notches indicating 95%confidence intervals. Boxes identify the upper (75%) and lower (25%) quartiles, with the whiskers indicating maximum and minimum values, excluding outlier values. Individual participant median values are plotted as small black dots.
Move measure
The lower panels of Fig. 2 show the median and IQR patterns for the Move RT measure. The overall patterns appear to closely mirror that seen with Lift RT. Specifically, in terms of overall speed (Fig. 2C), the YA group [M = 179 ms, SE = 14], were fastest, followed by the CH [M = 284 ms, SE = 14], and the VCI groups [M = 368 ms, SE = 14], giving rise to a main effect of Group [F(2,61) = 44.6, MSE = 0.02, p < 0.001,
Correlation between move and lift RT and IQR functions for each group
For the YA and VCI groups, Pearson correlational analysis revealed Lift RT was significantly correlated with Move RT ([r = 0.553, p = 0.008] and [r = 0.476, p = 0.029] respectively), but Lift IQR was not significantly correlated with Move IQR ([r = 0.261, p = 0.240] and [r = 0.117, p = 0.612] respectively). In the CH group, Lift RT was not significantly correlated with Move RT [r = 0.120, p = 0.605] and Lift IQR was not significantly correlated with Move IQR [r = 0.033, p = 0.889]. See OSF supplementary material for full correlation tables.
Spatial precision and variability across object positions
Figure 3 shows the pattern of spatial precision and variability across object positions, which we included to check for possible speed-accuracy trade-offs. The finding of interest in the upper panel appears to be that the CH group [M = 20.3 pixels, SE = 1.4] were consistently more precise than either the YA group [M = 25.7 ms, SE = 1.4] or the VCI group [M = 25.5 ms, SE = 1.4]. There was a significant main effect of Group [F(2,61) = 4.8, MSE = 202, p < 0.05,
Fig. 3
Touch precision in terms of Euclidean distance (pixels) from centre of target objects averaged across participants as a function of group and object position. Note that object positions are numbered sequentially from left to right as they would appear on screen. Error bars indicated the standard error of the mean.
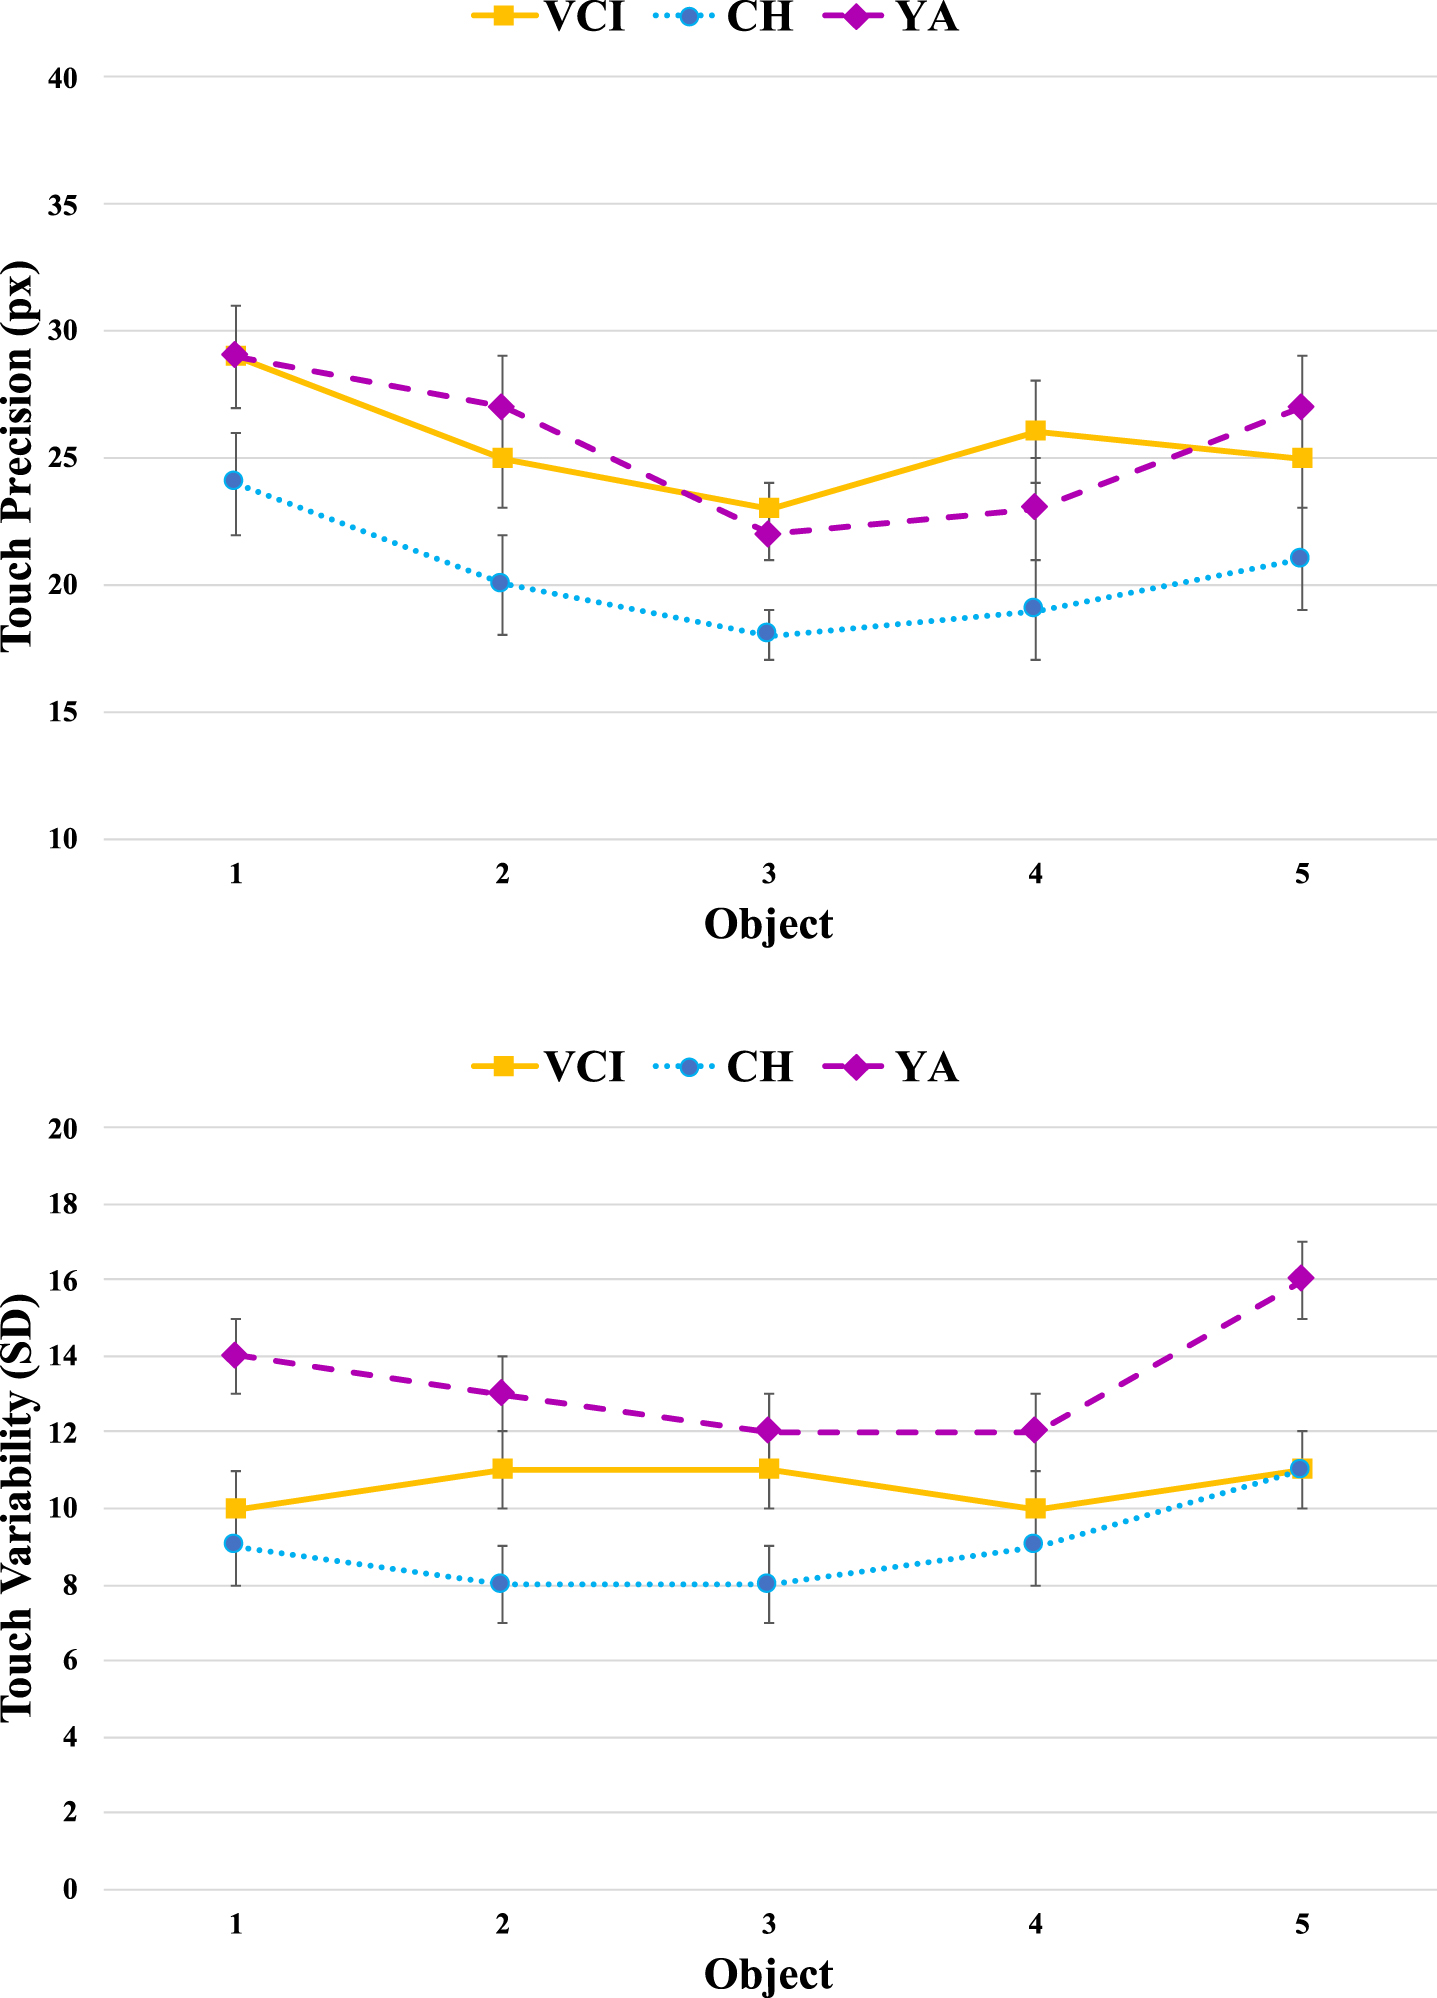
The variability measures shown in the lower panel again clearly separate the YA and CH groups, with the latter complementing their increased precision with more consistent responding. The variability within the VCI group now appears to straddle those of the other two groups, being more clearly modulated by object position. There was a main effect of Group [F(2,61) = 11.1, MSE = 40.0, p < 0.001,
As the percentage of male and female participants varied within in each group, we performed further post hoc analysis to determine how this may have influenced study outcome. For the YA group, whereas Lift IQR [F(1,21) = 8.6, p = 0.008] did vary with respect to gender, with males less variable than females, Lift RT [F(1, 21) = 2.34, p = 0.141], Move RT [F(1, 21) = = 0.194, p = 0.664]; Move IQR [F(1, 21) = 0.347, p = 0.562] and distance [F(1, 21] = 0.502, p = 0.487] did not vary with respect to gender (note however the disparity between male and female numbers in this analysis; 7 males compared to 15 females).
For the CH group there were no significant differences with respect to gender: Lift RT [F(1, 20) =0.807, p = 0.38]; Lift IQR [F(1,20) = 0.938, p =0.345]; Move RT [F(1, 20) = 1.276, p = 0.273]; Move IQR [F(1, 20) = 0.251, p = 0.622] and distance [F(1, 20] = 1.513, p = 0.234] (note however the disparity between male and female numbers in this analysis; 4 males compared to 17 females). Finally there were no significant gender-related differences for the VCI group: Lift RT [F(1, 20) = 0.249, p =0.623]; Lift IQR [F(1,20) = 0.001, p = 0.982]; Move RT [F(1, 20) = 0.819 p = 0.377]; Move IQR [F(1, 20) = 0.863 p = 0.365] and distance [F(1, 20] = 0.210, p = 0.652] (note however some disparity between male and female numbers in this analysis; 12 males compared to 9 females).
Pearson correlation also revealed that for the VCI group there were no significant correlations between white matter (ARWMC) [29] score and MoCA score [r = –0.196, p = 0.393], Lift RT [r = –0.099, p = 0.668], Lift IQR [r = –0.284, p = 0.212], Move RT [r = –0.12, p = 0.605], or Move IQR [r = 0.051, p = 0.828].
There were also no significant correlations for the VCI group between MoCA score and Lift RT [r = –0.099, p = 0.668], Lift IQR [r = –0.284, p = 0.212], Move RT [r = –0.12, p = 0.605], or Move IQR [r = 0.051, p = 0.825].
Similarly, for the CH group there were no significant correlations between MoCA score and Lift RT [r = 0.068, p = 0.771]; Lift IQR [r = 0.08, p = 0.730], Move RT [r = 0.116, p = 0.616], or Move IQR [r = –0.113, p = 0.625] and for the YA group there were no significant correlations between MoCA score and Lift RT [r = 0.18, p = 0.423], Lift IQR [r = –0.242, p = 0.279], Move RT [r = 0.208 p = 0.354], or Move IQR [r = 0.023, p = 0.918].
DISCUSSION
The aim of this study was to determine whether RT-decomposition techniques have the potential to shed light on the nature of underlying deficits in VCI, beyond what can be achieved with existing tests that use overall response time. Here, we simply separated the overall RT into two components: those up to and including movement initiation from those involved with later movement control.
To reiterate, we had three specific questions. First, compared to cognitively healthy aging, would VCI be associated with slowed RT and raised IIV using this test? Second, would deficits be observed in both initiation and movement phases of the response? Third, would deficits be equally reflected in RT and IIV, or would one or other of the measures be more sensitive to the pathological changes of VCI? In the remainder of this Discussion, we address each of our specific questions in turn, before considering other aspects of the data and possible future directions.
Response initiation and movement in aging and VCI
We were able to answer our first two questions in the affirmative. The VCI group were slower and more variable than either of the two control groups, and this was true in both response phases. Closer examination of the patterns across all groups, however, reveals a number of interesting findings.
While both the Lift (movement-initiation) and Move (movement-control) components of RT were significantly slower in older compared to younger adults, the respective IIV did not differ significantly between the two groups. Cognitively healthy aging, therefore, appears to affect the speed of response initiation and movement but not their variability. Raised variability therefore appears more specific or sensitive to pathological change.
In contrast, while both the Lift and Move components of RT were also significantly slower in individuals with VCI compared to cognitively healthy older adults, the IIV was also significantly greater for both components. This indicates that both the ability to initiate movement and the later control of movement are significantly compromised in VCI. However, the abnormality in the Lift component (see Fig. 2B) is particularly large, indicating a predominant abnormality in the processing up to and including initiation of a movement response in VCI. The IIV results show the extent to which, over a short period of time and /or over several trials of a test individuals with VCI can vary in performance. This is likely also to translate to variation/fluctuation in behavior and task performance throughout the day, or even during particular tasks or actions. This has important implications for safely and reliably undertaking many everyday activities.
The finding of abnormal IIV in VCI compared to healthy aging is in line with previous research in which raised IIV is associated with disease [32–35] and emphasizes again that this measure can be more sensitive than absolute RT in separating normal and abnormal aging. This finding also indicates that a ‘normal’ RT measure might in fact be masking functional abnormality to which IIV measurement is more sensitive and that abnormally raised IIV in VCI is the result of changes in at least two component processes of a behavioral response. The fact that further analysis failed to reveal any significant correlation between white matter (ARWMC) [29] score and any of the RT or IQR measures indicates the possibility that using visible white matter rating scales in isolation may lead to the under estimation of disease level in VCI [10].
The fact that IIV differences between VCI and CH groups were present in both response phases would seem to rule out the possibility that increased variability is purely a consequence of compromised online motor control. Although we must be cautious as our lift phase does contain the time taken to physically initiate the action, IIV abnormalities are clearly not only restricted to the later movement phase, which could well have been a possibility. A deficit in both planning/initiating an action as well as performing movements can clearly have important implications for many real-world scenarios (e.g., falls risk, driving safety, some forms of employment), implications which we discuss further below.
Correlation between Lift RT and Move RT
Examination of patterns of response across the lift and move phases yielded two particular findings of interest. First was the finding that for all three groups, there was no correlation between the IIV patterns in the two phases. While this finding clearly requires replication and further exploration, if it does prove to be a reliable signature of different underlying processes, then it may be possible to use the current decomposition approach to try to further separate/modulate variability occurring before and after movement initiation, both in VCI and other relevant clinical conditions (e.g., Parkinson’s disease, spatial neglect).
The second finding of interest concerned the pattern of RTs. For the YA and VCI groups, Lift RT was significantly correlated with Move RT. In contrast, for the CH group, Lift RT was not significantly correlated with Move RT. Our best explanation for this finding is to suggest that the CH group may have been strategically slowing their movements to increase the precision with which they touched the targets.
Figure 3 clearly shows that the CH participants had the most precise and least variable touch patterns. It is possible that concerns about loss of dexterity with age made the older adults compensate in this way during the movement phase, breaking the link between the earlier planning and initiation phase. That fact that the older VCI participants have the same pattern as the YA group, both in terms of the RT correlations and the precision of their touches, would then suggest that they are unwilling or unable to compensate in this way. We need to be cautious with this explanation, however, as we also note that the CH group had a much less balanced gender profile than the other two groups, which could conceivably have also impacted on the response strategies adopted.
Future directions
In this initial study, we used our iPad task to make the most basic decomposition into early and late phases of a response. This approach would seem to have promise in the context of VCI, as above we have already identified a number of potentially interesting findings. Here we would like to stress that the task and approach can easily be extended to explore other component processes. For example, a decision phase could easily be added, by using a color-cue to distinguish go from no-go events. If an object turns red, ignore it, if it turns green, respond to it (or vice versa). Comparing performance under such conditions to the current (go-all) variant would make it possible to isolate purely cognitive components of a response [1, 3]. Having the lift-responses coordinated with an independent timing signal (e.g., visual or auditory go-signal) would make it possible to separate early perceptual, cognitive, and planning components, from the physical initiation and control of the movement itself [35]. Objects can be made to move, either continuously or once the finger has lifted, changing the planning and online-control demands, respectively [36]. The number of objects and their distance from the home button can also be systematically varied to further explore the spatial position effects identified in the current data set. In general, then, we hope it is clear, that both the decomposition approach, and the use of simple spatial-response tasks can be applied in very flexible ways.
Potential real-life relevance for the individual living with VCI
Receiving a diagnosis of VCI will often result in a range of emotions that lead patients and their families to ask what it will be like living with this disease. Educating patients about the effects VCI can have on brain function and thus behavior that they and others may notice, at different stages, can forewarn them of what to expect and prepare for. Information may reduce the impact of such effects and associated stress and anxiety. Such knowledge can also help the patient and their family to build a repertoire of tools or adjustments. Understanding that the individual may experience a delay in movement or initiating movement (as we have found in this study), and that this may vary not only day-by-day but second-by-second may help patients to plan daily activities and adapt their lifestyle to account for this; for example, possibly with respect to driving ability and falls risk. Like the knowledge gained from our previous study [37], evidence from the current study can facilitate a greater understanding of deficits in information processing and environmental interaction, and thus everyday actions in VCI which in turn can help to predict problems with specific behaviors faced by people living with VCI. Such measures may also help to inform personalized profiles of abnormal and normal function, thus facilitating effective, stratified health care, disease monitoring, and intervention.
Potential study limitations
For this iPad-based test, the trials are split into four blocks. At the beginning of each block the participant was asked to select ‘continue’ for the block of trials to start. This feature design allowed participants to take a break if needed sometime between each trial, a good feature for those who mentally tire easily. However not all participants took the breaks between the trials, some immediately moved on to the next set of trials, while others voluntarily took short breaks. Within the VCI group it was noted that many of these participants took short breaks, and some had to be prompted to press continue in order to start a new block of trials. The effects of rest on performance were not recorded and it is possible that this factor may have influenced outcome and needs to be investigated in future studies. The inclusion of a test assessing motor function of the dominant hand could have helped in the interpretation of the results. Future studies will include such a measure.
Future studies will also include greater participant numbers, in order to determine replicability and potential clinical application, and to allow for gender stratification for all measures and analyses. In the present study we also performed post hoc analyses to determine whether RT and IQR for each group varied with respect to gender. Only the Lift IQR in the young group differed significantly with respect to gender, with females showing more variability. For the CH and VCI groups, different numbers of male and female participants appeared not to have influenced the results. Note however that these results must be interpreted with significant caution because of the low and often disparate numbers of participants within each male and female group (e.g., on the CH group there are only four males compared to seventeen females).
ACKNOWLEDGMENTS
The authors would like to thank all the participants for taking part in this study.
CONFLICT OF INTEREST
The authors have no conflict of interest to report.
REFERENCES
[1] | Posner MI ((2005) ) Timing the brain: mental chronometry as a tool in neuroscience. PLoS Biol 3: , e51. |
[2] | Brenner E , Smeets JBJ ((2019) ) How can you best measure reaction times? J Motor Behav 51: , 486–495. |
[3] | Donders FC (1969) On the speed of mental processes. Acta Psychol 30, 412-431. [Translation of: Die Schnelligkeit psychischer Processe, first published in 1868]. |
[4] | Medina JM , Wong W , Diaz JA , Colonius H ((2015) ) Advances in modern mental chronometry, Front Hum Neurosci 9: , 256. |
[5] | Sigman M , Dehaene S ((2005) ) Parsing a cognitive task: a characterization of the mind’s bottleneck, PLoS Biol 3: , e37. |
[6] | Sternberg S ((2001) ) Separate modifiability, mental modules, and the use of pure and composite measures to reveal them, Acta Psychol 106: , 147–246. |
[7] | Kramer MR , Cox PH , Yu AB , Kravitz DJ , Mitroff SR ((2021) ) Moving beyond the keypress: As technology advances so should psychology response time measurements, Perception 50: , 555–565. |
[8] | van der Flier WM , Skoog J , Schneider JA , Pantoni L , Mok V , Chen CLH , Scheltens P ((2018) ) Vascular cognitive impairment, Nat Rev Dis Primers 4: , 18003. |
[9] | Richards E , Bayer A , Tree J , Hanley C , Norris JE , Tales A ((2019) ) Subcortical ischaemic vascular cognitive impairment: Insights from reaction time measures, J Alzheimers Dis 72: , 845–857. |
[10] | Richards E , Bayer A , Hanley C , Norris JE , Tree JJ , Tales A ((2019) ) Reaction time and visible white matter lesions in subcortical ischemic vascular cognitive impairment, J Alzheimers Dis 72: , 859–865. |
[11] | American Psychiatric Association (2013) Diagnostic and Statistical Manual of Mental Disorders, Fifth Edition. Arlington, VA. |
[12] | Skrobot OA , Black SE , Chen C , DeCarli C , Erkinjuntti T , Ford GA , Kalaria RNF , O’Brien J , Pantoni L , Pasquier F , Roman GC , Wallin A , Sachdev P , Skoog I , VICCCS group, Ben-Shlomo Y , Passmore AP , Love S , Kehoe PG ((2018) ) Progress toward standardized diagnosis of vascular cognitive impairment: Guidelines from the vascular impairment of Cognition classification consensus study, Alzheimers Dement 14: , 280–292. |
[13] | Bonnici-Mallia AM , Barbara C , Rao R ((2018) ) Vascular cognitive impairment and vascular dementia, InnovAiT 11: , 249–155. |
[14] | Diciotti S , Orsolini S , Salvadori E , Giorgio A , Toschi N , Ciulli S , Ginestroni A , Poggesi A , De Stefano N , Pantoni L , Inzitari D , Mascalchi M ((2017) ) Resting state fMRI regional homogeneity correlates with cognition measures in subcortical vascular cognitive impairment, J Neurolog Sci 373: , 1–6. |
[15] | Shi Y , Wardlaw JM ((2016) ) Update on cerebral small vessel disease: a dynamic whole-brain disease, Stroke Vasc Neurol 1: , 83–92. |
[16] | Wiggins MW , Tanner J , Schwab N , Crowly SJ , Schmalfus I , Brumback B , Libon DJ , Heilman K , Price CC ((2019) ) Regional leukoaraiosis and cognition in non-demented older adults, Brain Imaging Behav 13: , 1246–1254. |
[17] | Biesbroek JM , Weaver NA , Hilal S , Kuijf HJ , Ikram MK , Xu X , Tan BY , Venketasubramanian N , Postma A , Biessels GJ , Chen CPLH ((2016) ) Impact of strategically located white matter hyperintensities on cognition in memory clinic patients with small vessel disease, PLoS One 11: , e0166261. |
[18] | Williams OA , Zeestraten EA , Banjamin P , Lambert C , Lawrence AJ , Mackinnon AD , Morris RG , Markus HS , Charlton RA , Barrick TR ((2017) ) Diffusion tensor image segmentation of the cerebrum provides a single measure of cerebral small vessel disease severity related to cognitive change, Neuroimage Clin 16: , 330–342. |
[19] | Prins ND , Scheltens P ((2015) ) White matter hyperintensities, cognitive impairment and dementia: an update, Nat Rev Neurol 11: , 157–164. |
[20] | Reijmer YD , Fotiadis P , Martinez-Ramirez S , Salat DH , Schultz A , Shoamanesh A , Ayres AM , Vashkevich A , Rosas D , Schwab K , Leemans A , Biessels G-J , Rosand J , Johnson KA , Viswanathan A , Gurol ME , Greenberg SM ((2015) ) Structural network alterations and neurological dysfunction in cerebral amyloid angiopathy, Brain 138: , 179–188. |
[21] | Bayer A , Phillips M , Porter G , Leonards U , Bompas A , Tales A ((2014) ) Abnormal inhibition of return in mild cognitive impairment: is it specific to the presence of prodromal dementia? J Alzheimers Dis 40: , 177–189. |
[22] | Phillips M , Rogers P , Haworth J , Bayer A , Tales A ((2013) ) Intra-individual reaction time variability in mild cognitive impairment and Alzheimer’s disease: Gender, processing load and speed factors, PLoS One 8: , e65712. |
[23] | Basoudan N , Torrens-Burton A , Jenkins A , Thornton IM , Hanley CH , Tree J , Thomas S , Tales A ((2019) ) Sequential information processing: The elevated first response effect Can contribute to exaggerated intra-individual variability in older adults, Yale J Biol Med 92: , 13–20. |
[24] | Moretti R , Torre P , Antonelllo RM , Esposito F , Bellini G ((2011) ) Gait and equilibrium in subcortical vascular dementia, Curr Gerontol Geriatr Res 2011: , 263507. |
[25] | Hsieh S , Schubert S , Hoon C , Mioshi E , Hodges JR ((2013) ) Validation of the Addenbrooke’s Cognitive Examination III in frontotemporal dementia and Alzheimer’s disease, Dement Geriatr Cogn Disord 36: , 242–250. |
[26] | Nasreddine ZS , Phillips NA , Bedirian V , Charbonneau S , Whitehead V , Collin I , Cummings JL , Chertkow H ((2005) ) The Montreal Cognitive Assessment, MoCA: A brief screening tool for mild cognitive impairment, J Am Geriatr Soc 53: , 695–699. |
[27] | Nelson H , Willison J National adult reading test (NART). Test manual including new data supplement. NFER-Nelson, Windsor. |
[28] | Zigmond AS , Snaith RP ((1983) ) The hospital anxiety and depression scale, Acta Psychiatr Scand 67: , 361–370. |
[29] | Wahlund LO , Barkhof F , Fazekas F , Bronge L , Augustin M , Sjögren A , Wallin A , Ader H , Leys D , Pantoni L , Pasquier F , Erkinjuntti T , Scheltens P ((2001) ) A new rating scale for age-related white matter changes applicable to MRI and CT, Stroke 32: , 1318–1322. |
[30] | Miller J (2020) Another warning about median reaction time–Version of 11 Feb 2020, https://doi.org/10.31219/osf.io/3q5np. |
[31] | Rousselet GA , Wilcox RR Reaction times and other skewed distributions. Meta-Psychology 4: , https://doi.org/10.15626/MP.2019.1630. |
[32] | Nilsson J , Thomas AJ , O’Brien JT , Gallagher P ((2014) ) White matter and cognitive decline in aging: A focus on processing speed and variability, J Int Neuropsychol Soc 20: , 262–267. |
[33] | Kuznetsova KA , Maniega SM , Ritchie SJ , Cox SR , Storkey AJ , Starr JM , Wardlaw JM , Deary IJ , Bastin ME ((2016) ) Brain white matter structure and information processing speed in healthy older age, Brain Struct Funct 221: , 3223–3235. |
[34] | Duering M , Gonik M , Malik R , Zieren N , Reyes S , Jouvent E , Hervé D , Gschwendtner A , Opherk C , Chabriat H , Dichgans M ((2013) ) Identification of a strategic brain network underlying processing speed deficits in vascular cognitive impairment, Neuroimage 66: , 177–183. |
[35] | Haith AM , Pakpoor J , Krakauer JW ((2016) ) Independence of movement preparation and movement initiation, J Neurosci 36: , 3007–3015. |
[36] | Brouwer AM , Smeets JB , Brenner E ((2005) ) Hitting moving targets: effects of target speed and dimensions on movement time, Exp Brain Res 165: , 28–36. |
[37] | Richards E , Thornton IM , Bayer A , Tales A ((2021) ) Inhibitory control deficits in vascular cognitive impairment revealed using the MILO task, Neuropsychologia 155: , 107794. |


