
Quality of Life and Caregiver Burden of Alzheimer’s Disease Among Community Dwelling Patients in Europe: Variation by Disease Severity and Progression
Abstract
Background:
Alzheimer’s disease (AD) is a significant burden on patients and caregivers. How this burden increases as disease progresses has not been well researched.
Objective:
To assess the association of caregiver burden and quality of life with Alzheimer’s disease severity and disease progression in community-dwelling patients in Germany, Spain, and the UK.
Methods:
This was a prospective observational longitudinal study of mild-to-moderate AD patients (assessed by Mini-Mental State Examination, MMSE), and their caregivers. The humanistic burden was assessed using these instruments: [Rapid Assessment of Physical Activity (RAPA), EuroQoL-5-Dimension Level (EQ-5D-5L)] and caregiver-reported [Dependence Scale (DS), EQ-5D-5L, Zarit Burden Interview (ZBI)]. Caregiver-reported healthcare resource use was assessed using the Resource Use in Dementia (RUD) and ad-hoc questions.
Results:
Of 616 patients recruited, 338 and 99 were followed-up at 12 and 18 months, respectively. The caregiver-reported EQ-5D-5L scores of patients’ health-related quality of life (HRQoL) showed a negative trend over time (baseline: 0.76; 18 months: 0.67) while patient-reported HRQoL remained at 0.85. DS scores tended to worsen. Disease progression was an independent predictor of HRQoL and increased dependence.
Mean ZBI score increased over time reflecting an increase in caregiver burden; MMSE being an independent predictor for caregiver burden. Patient resource utilization and caregiver time for caregiving tended to increase over time.
Conclusion:
We found significant association between disease progression and caregiver and patient burden. Independently, both disease-specific outcomes and disease burden measures increased over time, but as disease progresses, we also found incremental burden associated with it.
INTRODUCTION
Dementia is characterized by memory loss and cognitive impairment; it covers a wide range of specific neurologic conditions including Alzheimer’s disease (AD), the most frequent type of dementia. The etiology of AD is not yet well understood [1].
Approximately 60–70%of incident cases of dementia are related to AD [2, 3]. It has been esti-mated that 0.40%of the world population (approximately 26.6 million people) was suffering from AD in 2006, and that the prevalence rate would triple and the absolute number would quadruple by 2050 [4]. The worldwide prevalence of AD and other dementias results in a high burden to society [5], which increases in direct proportion to the number of older people (aged 65 years or older) in the population [6, 7].
The global cost of the AD was estimated in 2018 to be about a trillion US dollars per year and the yearly cost of AD, including the caregiver cost, is forecasted to double by 2030 [8]. An increasing number of patients with AD require transition—from living at home to long term care facilities, where the help of a formal/professional caregiver is needed, would also have an impact on the global cost. Gustavsson and colleagues in 2011, in a multinational study including over 1,000 AD patients, estimated the societal costs to be about € 14,500 per year per patient in patients living at home and enjoying a high level of autonomy, rising to € 72,500 per year for patients who needed nursing home care [9].
In Europe, many cohort studies have collected valuable information on the progression of AD, caregiver burden, and associated comorbidity but few studies have provided longitudinal information on costs, institutionalization, and health-related quality of life (HRQoL) associated with AD [10, 11]. The GERAS Study found significant differences in societal costs per patient by AD severity, and also among the countries explored [11]. Long-term information on country-specific costs of care are needed because care arrangements and resource use patterns change over time and are dependent on the culture, and the health and social care systems in each country [10, 12].
This observational study, conducted in AD patients from three European countries (Germany, Spain, and the UK), aimed to assess the progression of patient dependence on assistance over time, and changes in resource utilization with caregiver time spent for informal care. The study also sought to assess changes in patient HRQoL, caregiver HRQoL, and caregiver burden over time.
MATERIALS AND METHODS
Study design
A prospective cohort study of community-dwell-ing patients (aged ≥50 years) with an established clinical diagnosis of mild to moderate AD, who attended to specialized care, and conducted in Germany (21 sites), Spain (25 sites), and the UK (23 sites). Institutional review boards (IRBs) approved the research protocol and written informed consent was collected from each patient/caregiver dyad. Participants were enrolled along with their primary caregivers (defined as spending at least 7 hours a week caring for the patient) by neurologists, psychiatrists, and other specialists who were regularly managing AD patients. Incident and prevalent AD patients were included in the study between October 2016 and December 2017. Patients included in the study were treated as per their physician routine clinical practice, the study did not interfere in their clinical management. Study inclusion required that a reliable informant/caregiver agreed to attend study visits with the patient and complete some questionnaires. Additionally, to be eligible, patients had to be fluent and literate in the main language of the country of residence. Patients with mild cognitive impairment (MCI), non-AD dementia, without a regular caregiver, or who were institutionalized at the time of study initiation were excluded from participation. Patients were followed for a period of between 6 and 24 months after the enrolment of the first patient in their country. The follow-up period in each country was finalized once the first patient included in that country had reached 24 months of follow-up. The patient flow has been published elsewhere [13].
Study participants
The diagnosis of AD was made according to phy-sicians’ routine clinical practice and classification of AD severity was made according to the National Institute for Health and Clinical Excellence (NICE) clinical guideline’s classification [14] based on the Mini-Mental State Examination (MMSE) score (categorized as mild AD: 21–26 points; moderate AD: 10–20 points) [15, 16]. The Standardized MMSE incorporated explicit guidelines and instructions for administration and scoring of each item which improved reliability by reducing test-retest variance and inter-observer variance [17, 18].
The primary informal caregiver in the study was defined as a non-professional person (spouse, family member, or other) mostly responsible for providing care and support to the patient during seven hours or more per week.
Data collection
Data was collected from three sources: reported by the patient, reported by the primary caregiver, and from patient medical chart (Table 1).
Table 1
Main variables and associated domain along with the source of information
| Mode of completion | Investigator | Patient | Caregiver | Domain | |
| Demographics | Interview –Medical Chart | X | X | X | |
| MMSE | Interview | X | X | Cognitive status | |
| ADAS-Cog | Interview | X | X | Cognitive status | |
| DS | Self-completed | X | Dependence | ||
| RAPA | Self-completed | X | Physical activity | ||
| EQ-5D-5L | Self-completed and Caregiver as a proxy | X | X | Patient Quality of life | |
| EQ-5D-5L | Self-completed | X | Caregiver Quality of life | ||
| ZBI | Self-completed | X | Caregiver subjective burden | ||
| RUD | Self-completed | X | Caregiver time on assisting the patient | ||
| Hospitalizations | Medical Chart | X | Resource utilization |
MMSE, Mini-Mental State Examination; ADAS-Cog, Alzheimer’s Disease Assessment Scale–Cognitive subscale; DS, Dependence Scale; RAPA, Rapid Assessment of Physical Activity; EQ-5D-5L, EuroQoL-5 Dimension- Level; ZBI, Zarit Burden Interview, RUD, Resource Utilization in Dementia.
Baseline data collection encompassed socio-demographic information (for both patients and caregivers), including age at inclusion, gender, composition of the patient’s household and smoking habits. AD severity and duration was also collected. In addition to the MMSE score, the AD Assessment Scale-Cognitive subscale (ADAS-Cog) was used to measure cognitive impairment. The relationship of the caregiver with the patient, whether the caregiver lived with the patient and the caregiver’s employment status were also recorded.
All the participant healthcare professionals received standardized training in assessing clinical measures such as MMSE and ADAS-COG prior to participation in the study.
Healthcare resource use and patient reported outcomes
Data on patient’s dependence, resource utilization, patient and caregiver HRQoL, patient levels of physical activity, and perceived caregiver burden were collected at baseline and at approximately six-monthly intervals up for a maximum of two years after the first patient was enrolled in each country.
An assessment of patient dependence on assistance was performed using the Dependence Scale (DS), which was completed by the caregiver [14]. The total DS score is the sum of all 13 items, rated from 0 to 15, where higher scores indicate greater patient dependence (i.e., loss of independence).
The Rapid Assessment of Physical Activity (RAPA) questionnaire was self-completed by patients and was used to assess their level of physical activity [15]. The RAPA consists of items that determine whether the patient engages in light (e.g., leisurely walking, gardening, house cleaning, stretching), moderate (e.g., brisk walking or swimming), or vigorous physical activities (sports), as well as the frequency and time per week spent on each of these activities in a typical week. On a scale of 1–7, a score of 5 or below signifies sub-optimal physical activity and that of 6 or above signifies optimal physical activity.
The EuroQoL-5 Dimension-Level (EQ-5D-5L) and visual analogue scale (VAS) were completed by both patients and their caregivers to assess their own HRQoL [16]. The EQ-5D-5L provides a simple descriptive profile and the weighted index a single value for patients’ health status (where higher values correspond to better HRQoL); each dimension (mobility, self-care, usual activities, pain/discomfort, and anxiety/depression) has five levels of response. The VAS records the respondent’s self-rated health on a vertical VAS where the endpoints are labelled ‘Best imaginable health state’ and ‘Worst imaginable health state’. In addition to rating their own HRQoL, caregivers also gave a proxy rating of pa-tient’s HRQoL.
The Zarit Burden Interview (ZBI) was self-com-pleted by the caregivers and was used to assess their self-perceived burden [17]. It is a self-administered 22-item scale that examines the burden associated with functional/behavioral impairments and the home care situation. This scale ranges from 0 (never) to 4 (nearly always), with the sum of scores ranging between 0–88; higher scores indicate greater burden.
Finally, patient healthcare resource utilization was assessed at each study visit, collecting the number of visits in terms of primary care physician visits, medical specialist visits, other specialist visit; emergency room visits and hospitalizations during the full follow-up period in an ad-hoc set of questions. Additionally, the caregivers also completed the Resource Utilization in Dementia (RUD) which was administered through an interview and provided information on formal and informal care requirements as well as the caregiver’s productivity loss [19–21].
Statistical analysis
Continuous variables are reported as means and standard deviations (SD) or as medians and 25th and 75th percentiles, as appropriate. Categorical variables are reported as percentages. For each study visit, bivariate analysis was performed to compare characteristics of the two cohorts of patients with mild AD (21–26 MMSE points) and moderate AD (10–20 MMSE points). Bivariate comparisons involved using the t test for normally distributed variables, the Wilcoxon test for continuous parameters that were not normally distributed, or the χ2 test for categorical variables.
Change from baseline across the AD severity groups was assessed for the EQ-5D-5L weighted index, the VAS score, DS, RAPA, and the ZBI total score by using the Wilcoxon test. The healthcare resource utilization variables were compared across AD severity.
Multivariable regression including mixed models were developed to explore the relationship between changes in the outcomes including patients’ HRQoL (patients’ EQ-5D index score assessed by caregivers), patients’ dependence (DS) and burden of caregiver (ZBI) during the first year of follow-up and several independent variables. The difference between baseline and 12-month outcomes was considered as the dependent variable in multivariable regression. This involved use of longitudinal data during the first year of data collection. Data after 12-month of follow-up were used for descriptive analysis but not included in the models due to low number of patients. The models adjusted for some time-invariant variables (e.g., age, gender, country, etc.) and clinical variables to examine the relationship between clinical variables and health outcomes. Even though first differences would eliminate the effects of time-invariant covariates, we kept some of the variables in the regression to take into account interaction between those covariates and time. The clinical variables included changes between baseline and the 12-month visit in MMSE score and ADAS-COG score, age (by terciles), gender, country, education level, (former) occupation, main (former) working status, height, relationship with caregivers and AD severity (mild versus moderate). A 12-month timeframe was used to ensure that sufficient patients were included in the follow-up analysis. Only those variables with p-value < 0.20 remained in the adjusted multivariate regression models. Akaike information criterion (AIC) was used to select the most appropriate models.
All analyses implemented were conducted by using SAS statistics software (SAS Institute Inc., Cary, NC), SAS enterprise guide, version 9.4. Statistical significance was set at p < 0.05.
RESULTS
In total, 69 centers (21 from Germany, 25 from Spain, and 23 from the UK) enrolled patients. Overall, 616 patient and caregiver dyads were enrolled at baseline; 144 from Germany, 227 from Spain, and 245 from the UK. Study follow-up in each country was stopped when the first patient in the corresponding country completed the 24 months of follow-up according to the study protocol.
Five hundred out of 616 patients (81.2%) completed 6-month follow-up visit, 338 (54.9%) completed the 12-month follow-up, 99 (16.1%) completed the 18-month follow-up, and 14 patients completed the 24-month follow-up visit; the latest were not considered for further analysis. Overall, the discontinuation rate reported in the study was 21%which occurred at different time points. The most common reasons for discontinuation were withdrawal of patient/legal representative consent (25%), loss to follow-up (18%), permanent institutionalization (17%), and death (16%).
Baseline characteristics of patients and caregivers
The demographic characteristics of included AD patients and their caregivers are listed in Tables 2 and 3 respectively. Overall, the mean patient age (SD) was 77.5 (7.0) years and around half (53.4%) of the population was female. Of the 616 patients recruited, 362 (58.8%) had mild AD and 254 (41.2%) had moderate AD. The majority of the population was not employed or was retired (86.0%) and lived with their spouse/partner (75.3%). 50.2%had completed secondary or technical education (7–13 years duration) with the highest percentage (57.5%) among mild AD patients (Table 2). There was a significantly different distribution by gender, when analyzed by disease severity 58.0%of moderate AD patients were female, while 46.9%of mild AD patients were female. As expected, patients with moderate AD had a significatively higher ADAS-Cog and lower MMSE scores and also a longer disease duration compared to the mild AD group (Table 2).
Table 2
Baseline characteristics of patients in the study
| Moderate [10–20] | Mild [21–26] | Overall Population | p | ||
| (N = 362) | (N = 254) | (N = 616) | |||
| Age (y) | Mean (SD) | 77.43 (7.26) | 77.47 (6.71) | 77.45 (7.03) | 0.8052 |
| Gender | Female | 210 (58.01%) | 119 (46.85%) | 329 (53.41%) | 0.0063 |
| Disease duration: Time since first cognitive symptoms (y) | Median [Q1, Q3] | 2.45 [0.97, 4.65] | 1.89 [0.89, 3.56] | 2.19 [0.93, 4.13] | < 0.0001* |
| MMSE | Mean (SD) | 16.65 (2.83) | 23.33 (1.68) | 19.40 (4.09) | < 0.0001* |
| ADAS-Cog | Mean (SD) | 33.82 (8.37) | 24.65 (6.47) | 30.04 (8.87) | < 0.0001* |
| Main Working status | Full-time | 33 (9.12%) | 29 (11.42%) | 62 (10.06%) | 0.5664 |
| Part-time | 7 (0.93%) | 8 (3.15%) | 15 (2.44%) | ||
| Not employed/Retired | 316 (87.29%) | 214 (84.25%) | 530 (86.04%) | ||
| Declined to answer | 3 (0.83%) | 3 (1.18%) | 6 (0.97%) | ||
| Other persons living with the patient (including caregiver if relevant)* | None, patient lives alone | 44 (12.15%) | 41 (16.14%) | 85 (13.80%) | 0.1578 |
| Spouse or partner | 270 (74.59%) | 194 (76.38%) | 464 (75.32%) | 0.6115 | |
| Other adults | 53 (14.64%) | 26 (10.24%) | 79 (12.82%) | 0.1075 | |
| Children < 18 years of age | 7 (1.93%) | 3 (1.18%) | 10 (1.62%) | 0.4669 | |
| Smoking Status | Current smoker | 7 (1.93%) | 10 (3.94%) | 17 (2.76%) | 0.2709 |
| Ex-smoker | 109 (30.11%) | 79 (31.10%) | 188 (30.52%) | ||
| Non-smoker | 236 (65.19%) | 155 (61.02%) | 391 (63.47%) |
*p < 0.05 was considered significant. Values may not add up to the total study population considering values for missing data.
Table 3
Baseline characteristics of caregivers in the study
| Moderate [10–20] | Mild [21–26] | Overall Population | p | ||
| (n = 362) | (n = 254) | (n = 616) | |||
| Age (y) | Mean (SD) | 67.32 (12.97) | 68.18 (12.91) | 67.68 (12.94) | 0.3942 |
| Gender | Female | 211 (58.29%) | 163 (64.17%) | 374 (60.71%) | 0.1409 |
| Current work status | Working full-time | 55 (15.19%) | 30 (11.81%) | 85 (13.80%) | 0.3375 |
| Working part-time | 31 (8.56%) | 26 (10.24%) | 57 (9.25%) | ||
| Working part-time due to caregiver responsibilities | 8 (2.21%) | 9 (3.54%) | 17 (2.76%) | ||
| Retired | 209 (57.73%) | 163 (64.17%) | 372 (60.39%) | ||
| Full-time student | 1 (0.28%) | 0 (0.00%) | 1 (0.16%) | ||
| Part-time student due to caregiver responsibilities | 0 (0.00%) | 1 (0.39%) | 1 (0.16%) | ||
| Not working for pay or attending school due to caregiver responsibilities | 14 (3.87%) | 5 (1.97%) | 19 (3.08%) | ||
| Not working for pay or attending school due to other reasons | 28 (7.73%) | 14 (5.51%) | 42 (6.82%) | ||
| Declined to answer | 12 (3.31%) | 6 (2.36%) | 18 (2.92%) | ||
| Does the caregiver live with the patient? | Yes | 291 (80.39%) | 203 (79.92%) | 494 (80.19%) | 0.9864 |
| Part-time | 3 (0.83%) | 2 (0.79%) | 5 (0.81%) | ||
| Nature of relationship with patient | Spouse/partner | 247 (68.23%) | 182 (71.65%) | 429 (69.64%) | 0.0489* |
| Adult child | 94 (25.97%) | 51 (20.08%) | 145 (23.54%) | ||
| Adult grandchild | 2 (0.55%) | 2 (0.79%) | 4 (0.65%) | ||
| Sibling | 9 (2.49%) | 6 (2.36%) | 15 (2.44%) | ||
| Distant relative | 0 (0.00%) | 2 (0.79%) | 2 (0.32%) | ||
| Close friend | 0 (0.00%) | 5 (1.97%) | 5 (0.81%) | ||
| Other | 10 (2.76%) | 6 (2.36%) | 16 (2.60%) |
*p < 0.05 was considered significant. Values may not add up to the total considering missing data.
Across the three countries, patients did not differ in age, had a similar employment status (74–88%were not employed/retired) and living situation (70–80%lived with their spouse/partner), the gender ratio was similar in Spain and Germany, however in the UK more males were recruited (56.3%versus 43.7%). Similarly, the patients’ cognitive impairment did not differ across countries, with MMSE mean scores ranging from 3.80 to 4.20 points and mean ADAS-Cog score from 28.0 to 32.6 points.
The mean age (SD) of caregivers enrolled in the study was 67.7 (12.9) years. The proportion of female caregivers was similar in the moderate AD group (58.3%) and in the mild AD group (64.7%); the main caregiver was the patients’ spouse or partner in the majority (69.6%) of cases. Most caregivers lived with the patient (80.2%) and were retired (60.4%), and 345 (56.0%) were diagnosed with at least one chronic disease themselves (Table 3). The caregivers form the three countries had similar characteristics in terms of age, gender distribution, and relationship with the patient, mostly living with the patient and were retired themselves.
Patient’s dependence upon assistance
Along the follow-up, the mean change in DS scores increased at each 6-month follow-up and was reported to be highest at month 18. No statistically significant differences were found when compared changes at each follow-up point versus baseline between the mild and moderate AD groups (Table 4). However, at baseline visit there were statistically significant differences in DS scores between mild and moderate AD patients. Baseline significant differences were maintained when the baseline DS scores were analyzed by AD severity among the subset of patients retained at 6, 12, and 18 months (p < 0.0001 respectively; data not presented).
Table 4
Change versus baseline in DS scores during the follow-up period
| Time Points | Moderate AD [10–20] | Mild AD [21–26] | Overall population | p | |
| DS scores and change over time | |||||
| Baseline | N | 351 | 244 | 595 | < 0.0001* |
| Mean (SD) | 6.68 (2.68) | 5.23 (2.70) | 6.09 (2.78) | ||
| 6 months (±3 months) | N | 272 | 194 | 466 | 0.1736 |
| Mean change (SD) | 0.76 (2.09) | 0.95 (2.38) | 0.84 (2.22) | ||
| 12 months (±3 months) | N | 179 | 133 | 312 | 0.7629 |
| Mean change (SD) | 1.03 (2.45) | 0.85 (2.69) | 0.95 (2.55) | ||
| 18 months (±3 months) | N | 40 | 48 | 88 | 0.4506 |
| Mean change (SD) | 1.27 (3.03) | 1.61 (2.38) | 1.45 (2.68) |
SD, standard deviation; DS, dependence scale. *p < 0.05 was considered significant. DS, Higher values mean more dependence. Values may not add up to the total considering values for missing data.
Scores of the DS across countries were similar at baseline and during the study follow-up.
For the cohort of patients with 12 months follow-up, the multivariable regression results predicted change in DS as a function of change in ADAS-Cog as a significant predictor, suggesting disease progression leading to higher levels of dependence. Neither change in MMSE nor the other baseline variables in the model appeared significant in the regression model to predict DS (Table 5).
Table 5
Multivariable regression model using changes in DS during the first year of follow-up
| Parameter | Class | Estimate | Standard Error | p |
| Intercept | 0.0727 | 0.2482 | 0.7699 | |
| Gender (Reference group: Male) | Female | 0.3609 | 0.2795 | 0.1976 |
| Changes in ADAS-COG | 0.0898 | 0.0181 | < 0.0001* |
Number of observations used: 312. *p < 0.05 was considered significant.
Assessment of physical activity
Overall, RAPA scores reduced over time for both categories (aerobic and strength and flexibility; Table 6). The RAPA aerobic index score resulted significantly higher in mild AD patients at baseline than in moderate patients (p < 0.01). The change in mean RAPA score across the mild and moderate groups also showed a decline at the subsequent 6 months follow-up visit, resulting statistically significant at the 6-month follow-up for the aerobic index. The decline in aerobic index continued to be observed at visits after the 6 months visit, with the lowest score at 18-month, but there were no statistically significant differences in RAPA changes by severity after 6 months. Similarly, no significant differences were found in the other domains across all time points (Table 6). Baseline RAPA scores, overall and both categories, were analyzed among the subset of patients retained at 6, 12, and 18 months, without differences on the data presented herein.
Table 6
Change versus baseline in RAPA scores during the follow-up period
| Time Points | Moderate AD [10–20] | Mild AD [21–26] | Overall Population | p | |
| RAPA scores and change | |||||
| Baseline | Total Score - RAPA Aerobic (N) | 341 | 234 | 575 | 0.0094* |
| Mean (SD) | 3.38 (1.56) | 3.73 (1.57) | 3.52 (1.57) | ||
| Total Score - RAPA Strength &Flexibility (N) | 327 | 219 | 546 | 0.4040 | |
| Mean (SD) | 0.31 (0.77) | 0.36 (0.80) | 0.33 (0.78) | ||
| 6 months (±3 months) | Total Score - RAPA Aerobic (N) | 252 | 188 | 440 | 0.0278* |
| Mean change (SD) | –0.10 (1.45) | –0.14 (1.60) | –0.12 (1.52) | ||
| Total Score - RAPA Strength &Flexibility (N) | 237 | 172 | 409 | 0.4333 | |
| Mean change (SD) | –0.08 (0.78) | 0.11 (0.99) | 0.00 (0.88) | ||
| 12 months (±3 months) | Total Score - RAPA Aerobic (N) | 159 | 125 | 284 | 0.0931 |
| Mean change (SD) | –0.24 (1.49) | –0.46 (1.56) | –0.33 (1.52) | ||
| Total Score - RAPA Strength &Flexibility (N) | 134 | 105 | 239 | 0.9085 | |
| Mean change (SD) | –0.04 (0.82) | –0.09 (0.83) | –0.06 (0.83) | ||
| 18 months (±3 months) | Total Score - RAPA Aerobic (N) | 39 | 43 | 82 | 0.0969 |
| Mean change (SD) | –0.67 (1.94) | –0.79 (1.86) | –0.73 (1.89) | ||
| Total Score - RAPA Strength &Flexibility (N) | 33 | 36 | 69 | 0.9643 | |
| Mean change (SD) | 0.03 (1.07) | –0.06 (0.86) | –0.01 (0.96) |
SD, standard deviation; RAPA, Rapid Assessment of Physical Activity. *p < 0.05 was considered significant. RAPA, Higher values more optimal physical activity intensity levels. Values may not add up to the total considering values for missing data.
Health-related quality of life
Patients’ self-reported HRQoL versus Caregiver-reported patient’s HRQoL through EQ-5D-5L
The patient self-reported EQ-5D-5L index score at baseline was a mean (SD) of 0.85 (0.18) and was maintained in subsequent follow-up visits without significant change (Table 7).
Table 7
Change in patients’ EQ-5D-5L index and VAS scores reported by patients and caregivers during the follow-up period
| Time Points | Moderate AD [10–20] | Mild AD [21–26] | Overall Population | p | |
| Self-reported EQ-5D-5L index scores of patients and change over time | |||||
| Baseline | N | 337 | 235 | 572 | 0.7724 |
| Mean (SD) | 0.85 (0.18) | 0.85 (0.17) | 0.85 (0.18) | ||
| 6 months (±3 months) | N | 248 | 188 | 436 | 0.9550 |
| Mean change (SD) | 0.00 (0.13) | 0.00 (0.13) | 0.00 (0.13) | ||
| 12 months (±3 months) | N | 159 | 125 | 284 | 0.5120 |
| Mean change (SD) | 0.01 (0.14) | –0.01 (0.17) | 0.00 (0.16) | ||
| 18 months (±3 months) | N | 37 | 44 | 81 | 0.7935 |
| Mean change (SD) | –0.00 (0.22) | 0.01 (0.13) | 0.00 (0.18) | ||
| Self-reported EQ-5D-5L VAS scores of patients and change over time | |||||
| Baseline | N | 346 | 239 | 585 | 0.7352 |
| Mean (SD) | 72.45 (18.73) | 73.05 (17.85) | 72.69 (18.36) | ||
| 6 months (±3 months) | N | 263 | 196 | 459 | 0.0990 |
| Mean change (SD) | 0.36 (20.01) | –3.01 (19.62) | –1.08 (19.89) | ||
| 12 months (±3 months) | N | 161 | 131 | 292 | 0.3597 |
| Mean change (SD) | 0.65 (21.47) | –1.72 (19.73) | –0.41 (20.70) | ||
| 18 months (±3 months) | N | 35 | 44 | 79 | 0.5195 |
| Mean change (SD) | –6.66 (22.83) | –2.39 (17.36) | –4.28 (19.95) | ||
| Patients’ EQ-5D-5L index scores reported by caregivers and change over time | |||||
| Baseline | N | 316 | 228 | 544 | 0.0112 |
| Mean (SD) | 0.74 (0.22) | 0.78 (0.20) | 0.76 (0.21) | ||
| 6 months (±3 months) | N | 228 | 174 | 402 | 0.1953 |
| Mean change (SD) | –0.04 (0.19) | –0.02 (0.16) | –0.03 (0.18) | ||
| 12 months (±3 months) | N | 145 | 117 | 262 | 0.7060 |
| Mean change (SD) | –0.06 (0.20) | –0.05 (0.19) | –0.06 (0.19) | ||
| 18 months (±3 months) | N | 34 | 45 | 79 | 0.0199 |
| Mean change (SD) | –0.13 (0.21) | –0.05 (0.17) | –0.09 (0.19) | ||
| Patients’ EQ-5D-5L VAS scores reported by caregivers and change over time | |||||
| Baseline | N | 331 | 234 | 565 | 0.1076 |
| Mean (SD) | 62.46 (20.56) | 65.65 (19.21) | 63.78 (20.06) | ||
| 6 months (±3 months) | N | 246 | 185 | 431 | 0.5930 |
| Mean change (SD) | –1.43 (21.79) | –2.84 (17.90) | –2.04 (20.20) | ||
| 12 months (±3 months) | N | 159 | 124 | 283 | 0.4088 |
| Mean change (SD) | –2.18 (19.82) | –5.60 (21.08) | –3.68 (20.41) | ||
| 18 months (±3 months) | N | 35 | 45 | 80 | 0.6790 |
| Mean change (SD) | –6.09 (21.44) | –7.09 (18.59) | –6.65 (19.76) | ||
SD, standard deviation; EQ-5D-5L, EuroQoL-5 Dimension- Level; VAS, visual analogue scale. EQ-5D-5L, Higher values more optimal quality of life. Values may not add up to the total considering values for missing data.
The patient self-reported index score of EQ-5D-5L was compared with the proxy index score, reported by their caregivers, over the follow-up visits. No significant differences were found for any of the measurements although the caregiver reported was consistently lower than the patient self-reported HRQoL at each follow-up time point. Moreover, the negative trend over time reported by the caregivers regarding the HRQoL of their corresponding patients is noteworthy.
Patient self-reported EQ-5D-5L index scores and the caregiver-reported scores were analyzed by AD severity over time. No significant differences were found in the comparisons of patients self-reported EQ-5D-5L by AD severity. On the contrary, significant differences were found on the caregiver-reported EQ-5D-5L index between mild and moderate AD at baseline and 18 months of follow-up. The negative trend over the follow-up period reported by the caregivers was seen for both, mild and moderate patients.
Overall, for the self-reported EQ-5D-5L dimensions, a large proportion of patients reported not perceiving as problematic performing several activities: namely walking (374 [60.7%]), washing or dressing themselves (478 [77.6%]), or performing their usual activities (367 [59.6%]). Furthermore, most patients did not feel anxious or depressed (341 [55.4%]) at baseline. Just under half of the patients also reported no pain or discomfort (296 [48.1%]), and under a third of patients reported slight pain or discomfort (165 [26.8%]). A small decrease was seen in several subjective measures at month 6, 12, and 18 months in the EQ-5D-5L dimensions compared to baseline. Caregivers perceived higher levels of problematic performance of some routine activities (384 [70.62%]) and with mobility (296 [56.01%]).
For the cohort of patients with 12 months follow-up, the multivariable regression results predicted change in caregiver-reported patient HRQoL as a function of change in ADAS-Cog as a significant predictor, suggesting disease progression leading to worse HRQoL (Table 8). Interestingly, the multivariable regression model also revealed the degree of relation with the caregiver as an independent predictor for EQ-5D-5L index score (patient HRQoL according to caregiver), distant relative caregivers reported a higher deterioration of HRQoL over the 12 months period (Table 8).
Table 8
Multivariable regression model analysis of patients’ EQ-5D-5L index score reported by caregivers over time by AD severity
| Parameter | Class | Estimate | Standard Error | p |
| Intercept | –0.0334 | 0.0314 | 0.2895 | |
| Age (Reference group: Age > 82 | 73–82 | 0.0488 | 0.0285 | 0.0887 |
| < 73 | 0.0022 | 0.0351 | 0.9496 | |
| Relation with caregiver (Reference group: Adult child) | Adult grandchild | 0.1687 | 0.1852 | 0.3631 |
| Close friend | –0.0324 | 0.0946 | 0.7324 | |
| Distant relative | –0.4434 | 0.1845 | 0.0170* | |
| Other | –0.1268 | 0.0859 | 0.1412 | |
| Sibling | –0.0167 | 0.0739 | 0.8211 | |
| Spouse/partner | –0.0102 | 0.0290 | 0.7259 | |
| Hypertension (Reference group: No) | Yes | 0.0418 | 0.0237 | 0.0796 |
| Changes in ADAS-Cog | –0.0068 | 0.0015 | < 0.0001* |
Number of observations used: 262. *p < 0.05 was considered significant.
Finally, the patient self-reported EQ-5D-5L VAS score was also compared with the caregiver-reported patient EQ-5D-5L VAS score. No significant differences were found in this analysis. It is noted that the EQ-5D-5L VAS score decreased over the follow-up period for both self and caregiver-reported patient’s EQ-5D-5L VAS. Similarly, across the mild and moderate groups, the mean VAS score was highest at baseline, and the change in the mean VAS score demonstrated a statistically insignificant decrease over time.
The self-reported index scores and VAS scores across countries were similar and the scores were maintained over the follow-up. The caregiver-repor-ted index scores and VAS at baseline were also similar in the three countries and showed a similar decline pattern over time.
Caregivers’ self-reported HRQoL
Overall, at baseline, a large proportion of the 616 caregivers reported that they did not experience problems walking (394 [64.0%]), washing or dressing (514 [83.4%]), doing their usual activities (446 [72.4%]), furthermore most caregivers reported that they were not anxious or depressed (348 [55.4%]). Just under a half of the caregivers reported that they did not have pain (267 [43.3%]). The self-reported HRQoL based on the five dimensions of EQ-5D-5L, analyzed by AD severity of the patients was highest at baseline and decreased over time from baseline to the follow-up at month 18.
Based on self-reported HRQoL of caregivers, no significant mean change from baseline was observed in EQ-5D-5L index score over time by AD severity (Table 9). The self-reported mean VAS score for caregivers was highest at baseline compared to subsequent follow-up periods, none of the changes was statistically significant (Table 9). Across countries, similar results were obtained for caregiver self-reported index scores at baseline and over time.
Table 9
Change versus baseline in caregivers’ EQ-5D-5L index and VAS scores during the follow-up period
| Self-reported EQ-5D-5L index scores reported by caregivers and change over time | |||||
| Baseline | N | 314 | 209 | 523 | 0.5427 |
| Mean (SD) | 0.88 (0.16) | 0.88 (0.14) | 0.88 (0.15) | ||
| 6 months (±3 months) | N | 227 | 162 | 389 | 0.9274 |
| Mean change (SD) | –0.00 (0.15) | –0.00 (0.12) | –0.00 (0.14) | ||
| 12 months (±3 months) | N | 146 | 111 | 257 | 0.3203 |
| Mean change (SD) | 0.00 (0.19) | 0.00 (0.13) | 0.00 (0.16) | ||
| 18 months (±3 months) | N | 33 | 40 | 73 | 0.7253 |
| Mean change (SD) | –0.07 (0.21) | –0.03 (0.14) | –0.05 (0.17) | ||
| Self-reported EQ-5D-5L VAS scores reported by caregivers and change over time | |||||
| Baseline | N | 334 | 221 | 555 | 0.6072 |
| Mean (SD) | 76.12 (17.57) | 76.99 (17.00) | 76.46 (17.33) | ||
| 6 months (±3 months) | N | 253 | 173 | 426 | 0.4233 |
| Mean change (SD) | –2.24 (19.55) | –3.62 (16.56) | –2.80 (18.39) | ||
| 12 months (±3 months) | N | 163 | 122 | 285 | 0.8450 |
| Mean change (SD) | –1.90 (17.85) | –2.96 (16.71) | –2.36 (17.35) | ||
| 18 months (±3 months) | N | 37 | 41 | 78 | 0.4837 |
| Mean change (SD) | –6.84 (19.61) | –6.34 (19.10) | –6.58 (19.22) | ||
SD, standard deviation; EQ-5D-5L, EuroQoL-5 Dimension- Level; VAS, visual analogue scale. EQ-5D-5L, Higher values more optimal quality of life. Values may not add up to the total considering values for missing data.
The baseline scores of self-reported HRQOL for patients and for caregivers. were compared according to the patients retained at 6, 12, and 18 months without showing statistically significant differences from the data presented above.
Caregiver burden
The ZBI indicates the subjective burden among caregivers of adults with dementia. Both mild and moderate groups showed a decline in their caregiver’s mean ZBI score over time (Table 10). However, no significant differences were found over these bivariate comparisons. These results did not vary significantly when analyzed for caregivers responding at the 6-, 12-, and 18-month time points. The multivariable regression model showed that changes in the patient’s MMSE predict changes in their caregiver’s ZBI score over time, for those with 12 months follow-up (Table 11). Other predictors were not identified in the model.
Table 10
Change versus baseline in caregiver burden scores during the follow-up period
| Time points | Moderate AD [10–20] | Mild AD [21–26] | Overall population | p | |
| Self-reported Zarit scores of caregivers and change over time | |||||
| Baseline | N | 311 | 209 | 520 | 0.0029* |
| Mean (SD) | 27.42 (14.34) | 23.85 (14.35) | 25.98 (14.44) | ||
| 6 months (±3 months) | N | 209 | 144 | 353 | 0.4117 |
| Mean change (SD) | 2.21 (10.61) | 1.25 (10.49) | 1.82 (10.56) | ||
| 12 months (±3 months) | N | 132 | 105 | 237 | 0.2930 |
| Mean change (SD) | 4.57 (10.74) | 2.66 (11.56) | 3.72 (11.13) | ||
| 18 months (±3 months) | N | 32 | 35 | 67 | 0.9000 |
| Mean change (SD) | 7.41 (11.11) | 7.31 (13.78) | 7.36 (12.48) | ||
SD, standard deviation. *p < 0.05 was considered significant. Zarit, Lower values better emotional feelings taking care of patient. Values may not add up to the total considering values for missing data.
Table 11
Multivariable regression models of changes in ZARIT score over time
| Parameter | Class | Estimate | Standard Error | p |
| Intercept | 4.4146 | 1.4719 | 0.0030* | |
| Gender (Reference group: Male) | Female | –2.5250 | 1.4346 | 0.0797 |
| Country (Reference group: UK) | Spain | 1.8133 | 1.6764 | 0.2806 |
| Germany | 3.9643 | 1.9573 | 0.0440* | |
| AD Severity (Reference group: Mild) | Moderate | –2.0968 | 1.4540 | 0.1506 |
| Hypertension (Reference group: No) | Yes | –2.7167 | 1.4607 | 0.0642 |
| Changes in MMSE | –0.5560 | 0.1782 | 0.0020* |
Number of observations used: 235. *p < 0.05 was considered significant.
Patient resource utilization
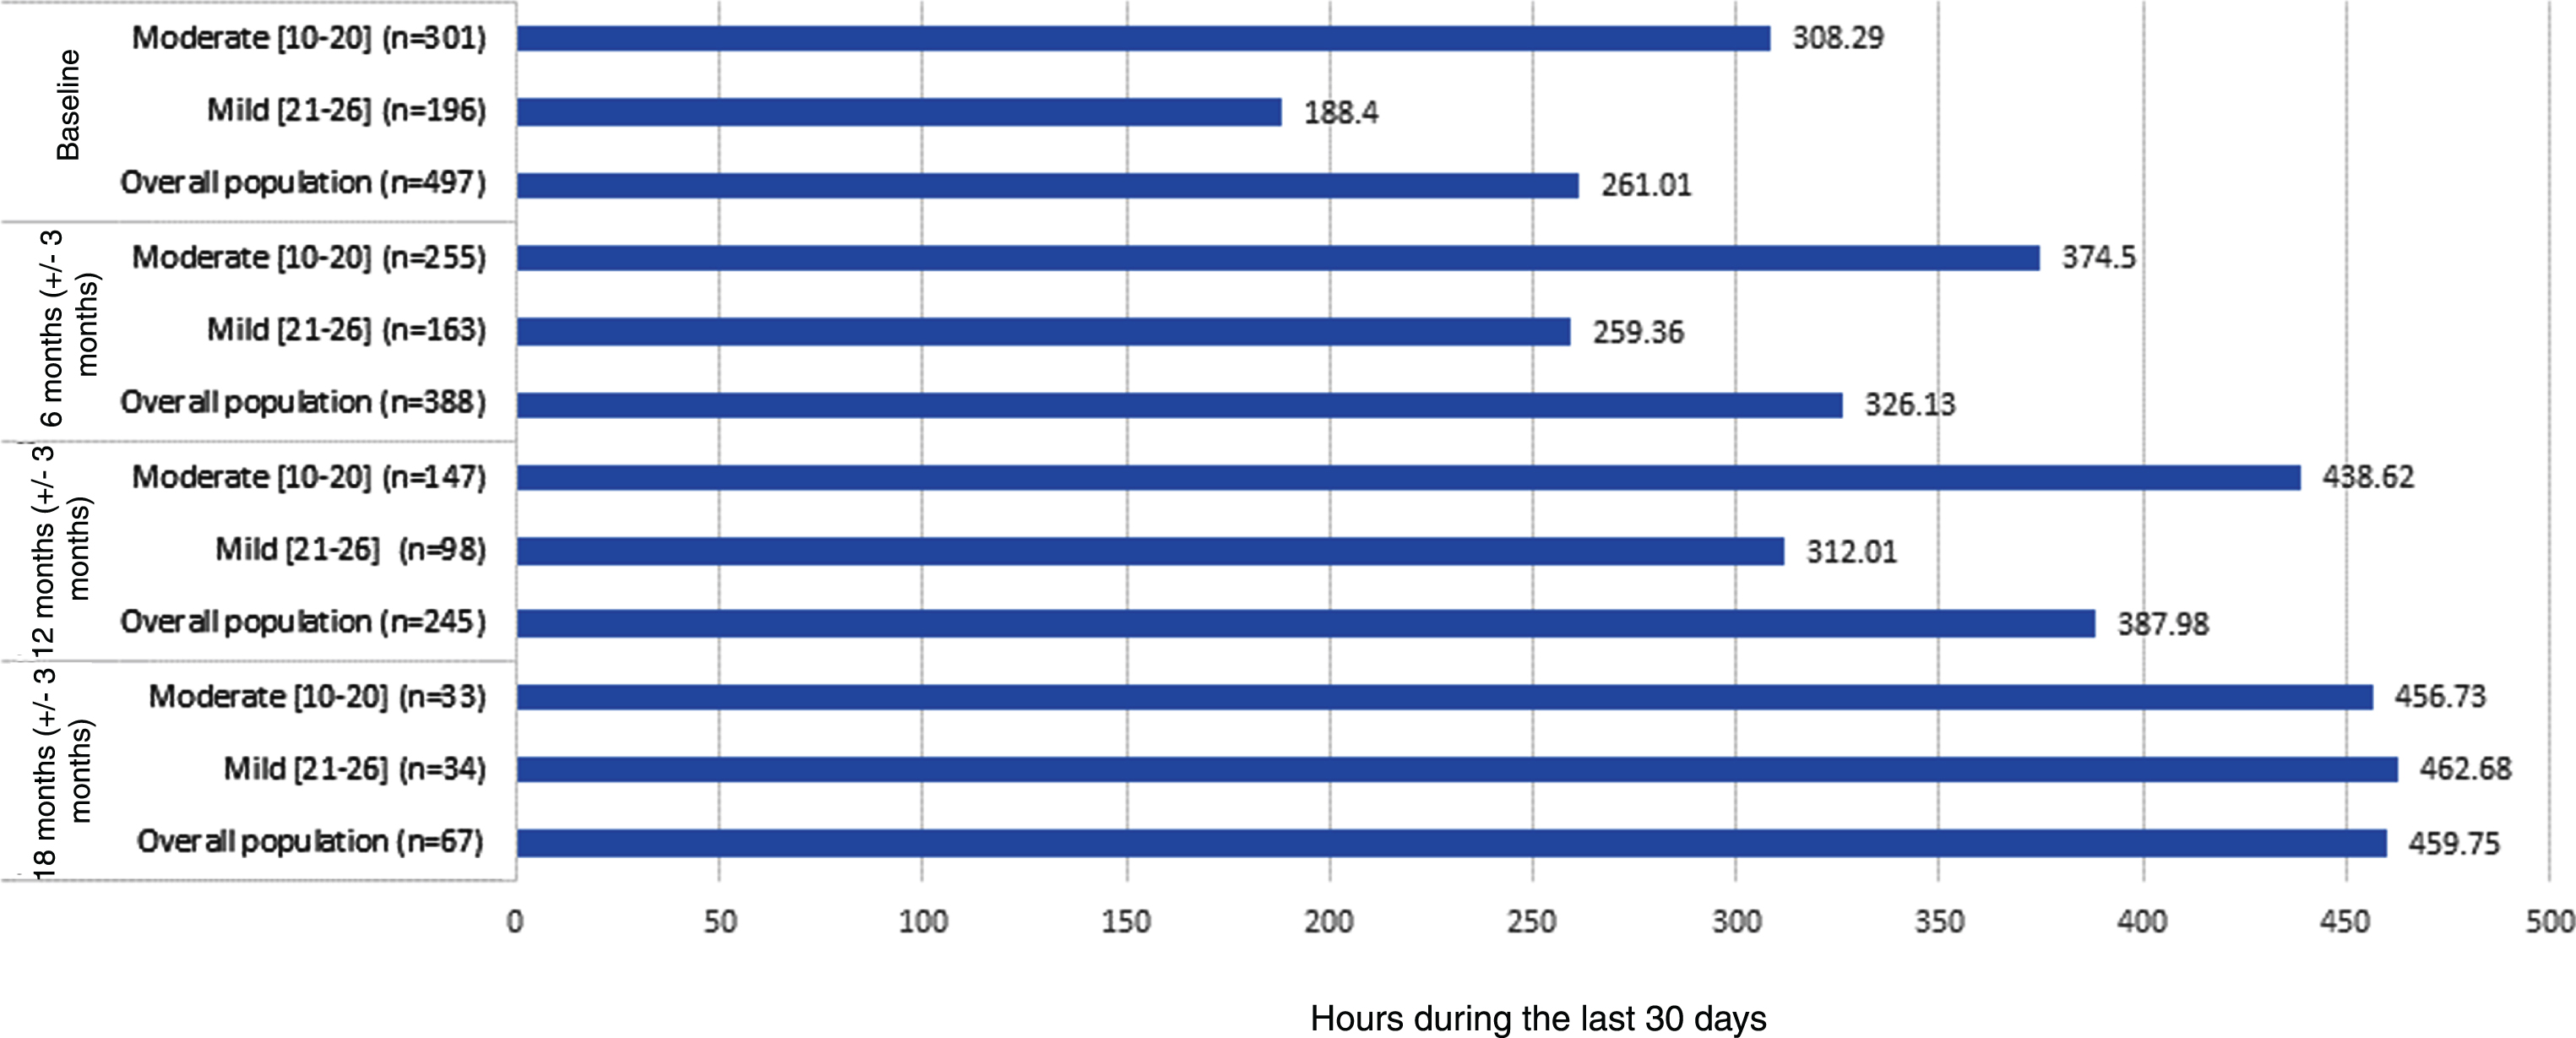
Figure 1 presents the results of the time that the primary caregiver contributed to personal activities of daily life, instrumental activities of daily life, and supervision. The time dedicated to care for these three categories was significantly higher for moderate AD patients than the time dedicated to mild AD patients at baseline. These differences have a tendency to narrow over time.
Fig. 1
Caregiver time and productivity loss based on RUD questionnaire.
The patient resource utilization was compared by bivariate comparisons among mild and moderate AD patients over the follow-up period, but the utilization rates were very low providing comparisons with limited relevance (data not shown). No significant differences among both patient groups were found either for physician visits (including primary care physician visits; medical specialist visits and other specialist visits) or hospital visits (including emergency room visits and general hospitalizations). However, these analyses showed a trend to increasing resource utilization over the follow-up period of this study.
The patient resource utilization across countries was heterogeneous, with a higher number of primary care physician and medical specialist visits in Germany and Spain than in the UK. However, the number of hospital visits (including emergency room visits and general hospitalizations) were similar in the three study countries.
DISCUSSION
This study aimed to assess HRQoL, caregiver burden, and use of healthcare resources associated with mild to moderate AD in community-dwelling patients who attend to specialized health care across three European countries.
Both the mild and moderate AD groups had more female than male patients. This is reflective of the fact that a substantially larger number of women than men suffer from AD worldwide, with ratios as high as two female patients for every male patients in some studies [18]. Overall, the demographic characteristics of the patients included in this study cohort are similar to previous studies; however, the cohort may not be fully representative of the AD population due to the eligibility criteria used in this study [22].
The study results showed discrepancies between patient-reported and proxy-reported HRQoL for AD patients when compared with results from previous studies [23, 24]. Caregiver perceptions of HRQoL decreased over time, while patient self-reported HRQoL did not change. Additionally, for all time points, the index scores of caregiver reported HRQoL were lower than those self-reported by the patients. Orgeta et al. have previously reported lower scores for patient HRQoL when reported by the caregiver were compared with those patient self-reported, being the impairment on the activities of daily life and depression the main contributors to the lower scores [24]. Similarly, our study showed increasing dependence for the patients over time, meaning that they were less able to perform the activities of their daily life. The lower scores reported by the caregivers suggest that caregivers are more aware of the impaired patient HRQoL than the patients themselves. Both caregiver factors and cognitive impairment were predictors of HRQoL. The multivariable model demonstrates the dependence of HRQoL on disease progression (as measured by change in ADAS-Cog) and provides a numeric magnitude of unit changes in ADAS-Cog as a predictor of EQ-5D (caregiver as proxy). A “distant relative” (acting as a caregiver) was identified as a negative independent predictor of HRQoL scores suggesting that emotionally more involved relatives, when acting as caregivers, may rate changes in patient HRQoL more positively, due to a deeper emotional attachment, while a distant relative acting as a caregiver may rate HRQoL more objectively [24].
In this study, both the self-reported and proxy-rated EQ-5D values (Table 9) were higher than the utility expected for the MMSE levels based on previous studies [34]. Our results in a prospective cohort differ from prior cross-sectional studies that did not identify patient cognitive impairment as predictors of caregivers’ HRQoL [25, 26]. As expected, caregiver burden increased from mild to moderate AD. These findings highlight the importance of evaluating not only the patient-reported HRQoL, but also the caregiver self-reported HRQoL in AD in order to make a more comprehensive assessment of the complex dynamics between HRQoL in patients and caregivers and the associated caregiver burden in AD.
No major differences were observed between mild and moderate AD patients, over the follow-up period, in terms of patient dependence on assistance. On the contrary, the DADE study found significant associations between DS and AD severity, including measures of cognitive decline such as MMSE [28]. The differences in the study design between this prospective study and the DADE cross-sectional study could explain the different results. While the statistical models developed in our study did not find a relationship between DS and cognitive impairment as assessed by the MMSE, the DS score showed a significant and positive association with the cognitive function changes as per the ADAS-Cog score. This would reflect the fact that the ADAS-Cog score may constitute a more sensitive performance-based measure for cognition and disease progression in AD patients compared to MMSE as previously reported [26].
This study examined changes in clinical variables such as MMSE and ADAS-Cog reflecting disease severity and disease progression and their contribution to explaining the changes in health outcomes and disease burden, such as changes in DS, ZBI, and EQ-5D. By using a change model, the study corroborated the hypothesis that disease progression and associated changes in severity indeed increases patient and caregiver burden and HRQoL in a significant way.
Physical activity declined from mild to moderate AD, potentially due to decline in physical fitness and/or increase in apathy as the disease progresses [27]. The patient’s activity level is an important outcome parameter for measuring disease progression, and an effective intervention together with cognitive stimulation for the protection and rescue of cognitive decline in AD [28]. Thus, physicians need to monitor and encourage physical activity more actively over the course of AD.
Caregiver burden showed a gradual increase over disease progression. These findings are very consistent with previous studies [29, 30]. Similar to physical activity, caregiver burden is an important outcome and provision of support to caregivers is effective for preventing or delaying nursing home placement. This shows the practical importance monitoring caregiver emotional distress and caregiver burden.
The results from the RUD questionnaire also showed differences in the time the caregivers spend caring for AD patients between both severity groups. These differences tend to decrease over time, indicating that as the disease progresses the caregivers invest more time in caring for AD patients.
Additionally, most of the caregivers did not receive any income or other compensation for the time spent caring for the AD patient which is consistent with the caregiver profile who mostly are retired and related to the AD patient. This is in line with the results presented by Ydstebø et al. [31] in an observational study of AD patients about to be admitted in a nursing home. That study showed that the main caregiver provides unpaid informal care and is usually a family member. Both studies indicate that the main burden for AD patients care is borne by close family members who are not paid for this burdensome task.
The analysis of patient resource utilization showed a tendency to increase over the follow-up of this study. However, no significant differences were found for patient resource utilization, emergency room visits and hospitalizations between mild and moderate AD patients. This could be explained by the short follow-up period for most of the patients in this study compared to other studies and/or by selective drop-outs [11]. It is noteworthy to mention that those patients who were institutionalized where dropped off the study and that the institutionalization costs were not considered among the healthcare resources use estimations for the study.
The country-specific differences in the resource utilization for treating AD patients observed are analogous of those reported in other studies [11]. The analysis of resource utilization showed a trend to increasing usage over the follow-up period in this study. However, no significant differences were found for some resource utilization, such as emergency room visits and hospitalizations between mild and moderate AD patients. This could be explained by a shorter follow-up period for most of the patients in this study compared to other studies [11].
The present study has some limitations. The patient and caregiver relationship could be considered as a dyad. To the extent that the characteristics of that dyad was time invariant, the first difference approach used in the multivariate analysis eliminated any source of bias resulting from the omission of the dyad. However, for some patients, caregivers changed, and sometimes patient characteristics that we did not observe in the data could also change. In these situations, the estimates generated from the model could be imprecise. The low number of patients with follow-up visit at 18-month is linked to the study design (termination when the first patient in each country reached the follow-up of 24 months) and did not alter sociodemographic or clinical characteristics of patients reaching longer follow-up periods; therefore, it is not expected to bias the study results. Baseline scores obtained by mild and moderate AD groups in all questionnaires used in the study to assess disease progression and outcomes were maintained among the subset of patients retained at 6, 12, and 18 months, reflecting non-selective drop-outs along the study. A high attrition rate is typical for longitudinal observational AD studies [32]. Different factors attributed to aging and disease progression are the main reasons of attrition at long-term AD studies and reflect that AD is a progressive condition that mainly affects geriatric patients [33]. Real world clinical studies follow patients in routine clinical practice which may result in higher attrition rates.
In conclusion, the study shows that negative impact on patients’ and caregivers’ quality of life and caregiver burden increase over time. The discrepancy of patient-reported HRQoL and caregiver-reported HRQoL needs to be considered in the management of AD patients. Further research is needed to fully understand the interaction of AD symptomatology with patients’ and caregivers’ quality of life, especially over the course of disease. A longer follow-up period would allow many of the questions raised in this piece of research to be answered.
ACKNOWLEDGMENTS
The authors thank the physicians involved in this project that contributed with data which made this study possible.
CONFLICT OF INTEREST
Funding for this research was provided by Merck Sharp & Dohme Corp., a subsidiary of Merck & Co., Inc., Kenilworth, NJ, USA.
REFERENCES
[1] | Winblad B , Amouyel P , Andrieu S , Ballard C , Brayne C , Brodaty H , Cedazo-Minguez A , Dubois B , Edvardsson D , Feldman H , Fratiglioni L , Frisoni GB , Gauthier S , Georges J , Graff C , Iqbal K , Jessen F , Johansson G , Jönsson L , Kivipelto M , Knapp M , Mangialasche F , Melis R , Nordberg A , Rikkert MO , Qiu C , Sakmar TP , Scheltens P , Schneider LS , Sperling R , Tjernberg LO , Waldemar G , Wimo A , Zetterberg H ((2016) ) Defeating Alzheimer’s disease and other dementias: A priority for European science and society. Lancet Neurol 15: , 455–532. |
[2] | Lobo A , Launer L , Fratiglioni L , Andersen K , Di Carlo A , Breteler M , Copeland J , Dartigues J , Jagger C , Martinez-Lage J , Soininen H , Hofman A ((2000) ) Prevalence of dementia and major subtypes in Europe: A collaborative study of population-based cohorts. Neurologic Diseases in the Elderly Research Group. Neurology 54: , S4–9. |
[3] | van der Flier W , Scheltens P ((2005) ) Epidemiology and risk factors of dementia. J Neurol Neurosurg Psychiatry 76: (Suppl 5), v2–7. |
[4] | Brookmeyer R , Johnson E , Ziegler-Graham K , Arrighi HM ((2007) ) Forecasting the global burden of Alzheimer’s disease. Alzheimers Dement 3: , 186–191. |
[5] | Bacigalupo I , Mayer F , Lacorte E , Di Pucchio A , Marzolini F , Canevelli M , Di Fiandra T , Vanacore N ((2018) ) A systematic review and meta-analysis on the prevalence of dementia in Europe: Estimates from the highest-quality studies adopting the DSM IV diagnostic criteria. J Alzheimers Dis 66: , 1471–1481. |
[6] | GBD 2016 Dementia Collaborators ((2019) ) Global, regional, and national burden of Alzheimer’s disease and other dementias, 1990-2016: A systematic analysis for the Global Burden of Disease Study 2016. Lancet Neurol 18: , 88–106. |
[7] | Niu H , Alvarez-Alvarez I , Guillen-Grima F , Aguinaga-Ontoso I ((2017) ) Prevalence and incidence of Alzhei-mer’s disease in Europe: A meta-analysis. Neurologia 32: , 523–532. |
[8] | Patterson C ((2018) ) World Alzheimer’s Report 2018. The state of the art of dementia research: New frontiers. Alzheimer’s Disease International, London. |
[9] | Gustavsson A , Brinck P , Bergvall N , Kolasa K , Wimo A , Winblad B , Jönsson L ((2011) ) Predictors of costs of care in Alzheimer’s disease: A multinational sample of 1222 patients. Alzheimers Dement 7: , 318–327. |
[10] | Gustavsson A , Jonsson L , Rapp T , Reynish E , Ousset P , Andrieu S , Cantet C , Winblad B , Vellas B , Wimo A ((2010) ) Differences in resource use and costs of dementia care between European countries: Baseline data from the ICTUS study. J Nutr Health Aging 14: , 648–654. |
[11] | Jones RW , Lebrec J , Kahle-Wrobleski K , Dell’Agnello G , Bruno G , Vellas B , Argimon JM , Dodel R , Haro JM , Wimo A , Reed C ((2017) ) Disease progression in mild dementia due to Alzheimer disease in an 18-month observational study (GERAS): The impact on costs and caregiver outcomes. Dement Geriatr Cogn Disord Extra 7: , 87–100. |
[12] | Lillo-Crespo M , Riquelme J , Macrae R , De Abreu W , Hanson E , Holmerova I , Cabañero M , Ferrer R , Tolson D ((2018) ) Experiences of advanced dementia care in seven European countries: Implications for educating the workforce. Glob Health Action 11: , 1478686. |
[13] | Lladó A , Froelich L , Khandker RK , Roset M , Black CM , Lara N , Chekani F , Baishali Ambegaonkar M. ((2021) ) Assessing the progression of Alzheimer’s disease in real-world settings in three European countries. J Alzheimers Dis 80: , 749–759. |
[14] | Stern Y , Albert S , Sano M , Richards M , Miller L , Folstein M , Albert M , Bylsma F , Lafleche G ((1994) ) Assessing patient dependence in Alzheimer’s disease. J Gerontol 49: , M216–222. |
[15] | Topolski T , LoGerfo J , Patrick D , Williams B , Walwick J , Patrick M ((2006) ) The Rapid Assessment of Physical Activity (RAPA) among older adults. Prev Chronic Dis 3: , A118. |
[16] | EuroQol Group ((1990) ) EuroQol–a new facility for the measurement of health-related quality of life. Health Policy 16: , 199–208. |
[17] | Zarit S , Reever K , Bach-Peterson J ((1980) ) Relatives of the impaired elderly: Correlates of feelings of burden. Gerontologist 20: , 649–655. |
[18] | Ferretti MT , Iulita MF , Cavedo E , Chiesa PA , Schumacher Dimech A , Santuccione Chadha A , Baracchi F , Girouard H , Misoch S , Giacobini E , Depypere H , Hampel H ((2018) ) Sex differences in Alzheimer disease - the gateway to precision medicine. Nat Rev Neurol 14: , 457–469. |
[19] | Wimo A , Nordberg G , Jansson W , Grafström M ((2000) ) Assessment of informal services to demented people with the RUD instrument. Int J Geriatr Psychiatry 15: , 969–671. |
[20] | Wimo A , Jonsson L , Zbrozek A ((2010) ) The Resource Utilization in Dementia (RUD) instrument is valid for assessing informal care time in community living patients with dementia. J Nutr Health Aging 14: , 685–690. |
[21] | Wimo A , Gustavsson A , Jönsson L , Winblad B , Hsu MA , Gannon B ((2013) ). Application of Resource Utilization in Dementia (RUD) instrument in a global setting. Alzheimers Dement 9: , 429–435. |
[22] | Henneges C , Reed C , Chen Y-F , Dell’Agnello G , Lebrec J ((2016) ) Describing the sequence of cognitive decline in Alzheimer’s disease patients: Results from an observational study. J Alzheimers Dis 52: , 1065–1080. |
[23] | Hounsome N , Orrell M , Edwards R ((2011) ) EQ-5D as a quality of life measure in people with dementia and their carers: Evidence and key issues. Value Health 14: , 390–399. |
[24] | Orgeta V , Edwards R , Hounsome B , Orrell M , Woods B ((2015) ) The use of the EQ-5D as a measure of health-related quality of life in people with dementia and their carers. Qual Life Res 24: , 315–324. |
[25] | Hurt CS , Banerjee S , Tunnard C , Whitehead DL , Tsolaki M , Mecocci P , Kloszewska I , Soininen H , Vellas B , Lovestone S ((2010) ) Insight, cognition and quality of life in Alzheimer’s disease. J Neurol Neurosurg Psychiatry 81: , 331–336. |
[26] | Naglie G , Hogan DB , Krahn M , Black SE , Beattie BL , Patterson C , Macknight C , Freedman M , Borrie M , Byszewski A , Bergman H , Streiner D , Irvine J , Ritvo P , Comrie J , Kowgier M , Tomlinson G ((2011) ) Predictors of family caregiver ratings of patient quality of life in Alzheimer disease: Cross-sectional results from the Canadian Alzheimer’s Disease Quality of Life Study. Am J Geriatr Psychiatry 19: , 891–901. |
[27] | Watts AS , Mortby ME , Burns JM ((2018) ) Depressive symptoms as a barrier to engagement in physical activity in older adults with and without Alzheimer’s disease. PLoS One 13: , e0208581. |
[28] | Shen Y , Li R ((2016) ) What do we know from clinical trials on exercise and Alzheimer’s disease? J Sport Health Sci 5: , 397–399. |
[29] | Coen R , Swanwick G , O’Boyle C , Coakley D ((1997) ) Behaviour disturbance and other predictors of carer burden in Alzheimer’s disease. Int J Geriatr Psychiatry 12: , 331–336. |
[30] | Springate B , Tremont G ((2014) ) Dimensions of caregiver burden in dementia: Impact of demographic, mood, and care recipient variables. Am J Geriatr Psychiatry 22: , 294–300. |
[31] | Ydstebø AE , Benth JS , Bergh S , Selbæk G , Vossius C ((2020) ) Informal and formal care among persons with dementia immediately before nursing home admission. BMC Geriatr 20: , 296. |
[32] | Herdman M , Gudex C , Lloyd A , Janssen M , Kind P , Parkin D , Bonsel G , Badia X ((2011) ) Development and preliminary testing of the new five-level version of EQ-5D (EQ-5D-5L). Qual Life Res 20: , 1727–1736. |
[33] | Mohs RC , Schmeidler J , Aryan M ((2000) ) Longitudinal studies of cognitive, functional and behavioural change in patients with Alzheimer’s disease. Stat Med 19: , 1401–1409. |
[34] | Jönsson L , Andreasen N , Kilander L , Soininen H , Waldemar G , Nygaard H , Winblad B , Jönhagen ME , Hallikainen M , Wimo A ((2006) ) Patient-and proxy-reported utility in Alzheimer disease using the EuroQoL. Alzheimer Dis Assoc Disord 20: , 49–55. |


