
Alzheimer’s Disease Progressively Reduces Visual Functional Network Connectivity
Abstract
Background:
Postmortem studies of brains with Alzheimer’s disease (AD) not only find amyloid-beta (Aβ) and neurofibrillary tangles (NFT) in the visual cortex, but also reveal temporally sequential changes in AD pathology from higher-order association areas to lower-order areas and then primary visual area (V1) with disease progression.
Objective:
This study investigated the effect of AD severity on visual functional network.
Methods:
Eight severe AD (SAD) patients, 11 mild/moderate AD (MAD), and 26 healthy senior (HS) controls undertook a resting-state fMRI (rs-fMRI) and a task fMRI of viewing face photos. A resting-state visual functional connectivity (FC) network and a face-evoked visual-processing network were identified for each group.
Results:
For the HS, the identified group-mean face-evoked visual-processing network in the ventral pathway started from V1 and ended within the fusiform gyrus. In contrast, the resting-state visual FC network was mainly confined within the visual cortex. AD disrupted these two functional networks in a similar severity dependent manner: the more severe the cognitive impairment, the greater reduction in network connectivity. For the face-evoked visual-processing network, MAD disrupted and reduced activation mainly in the higher-order visual association areas, with SAD further disrupting and reducing activation in the lower-order areas.
Conclusion:
These findings provide a functional corollary to the canonical view of the temporally sequential advancement of AD pathology through visual cortical areas. The association of the disruption of functional networks, especially the face-evoked visual-processing network, with AD severity suggests a potential predictor or biomarker of AD progression.
INTRODUCTION
Alzheimer’s disease (AD) progressively causes impairment in many aspects of cognitive function. Of the two primary neuropathological hallmarks of AD, amyloid-beta (Aβ) plaques and neurofibrillary tangles (NFT), it is only the development and spread of the latter that are proximate in time to the development of serious neuronal and cognitive loss [1–7]. Composed of aggregates of hyperphosphorylated tau protein [8, 9], intraneuronal NFT activate astrocytes and microglia, inducing production of proinflammatory factors such as interleukins and nitric oxide, and ultimately result in excessive neuroinflammation, oxidative stress, neuronal damage, and cell death [9–12]. Although Aβ plaques may play a key role in AD pathogenesis, the severity of cognitive impairment correlates best with the burden of NFT [4].
The AD staging scheme of Braak & Braak focuses only on examination of tau-related pathology, and correlates closely with the stage of cognitive decline [13]. In contrast, the spread of Aβ largely occurs prior to the onset of cognitive decline and correlates poorly with NFT burden [14]. Early-stage AD pathology (Braak stage 3) begins in higher-order heteromodal association cortices such as Brodmann Area (BA) 20, where both tangle and plaque burden are very high in later stages of the disease [15]. Interestingly, although NFT are initially absent from primary somatosensory regions, by Braak stage 6, even these regions contain NFT as demonstrated by postmortem examinations of primary visual cortex pyramidal and non-pyramidal cells (BA 17, also known as area V1) [16, 17]. NFT levels increase 20-fold in adjacent visual association cortex (BA 18) and from there double further in BA 20, the higher-order visual cortex of the inferior temporal gyrus [17]. NFT aggregations in these visual areas may alter not only local neuronal activation but also visual neural network activity. Indeed, neuropsychological and neuroimaging findings show impaired visual cortical activation during the progression of AD [18–22]. Clinicopathological studies demonstrate strong associations of Braak NFT stage with severity of cognitive decline [1–5]. The NFT progression initially appears in areas of the temporal lobe, spreads into parietal and occipital higher-order sensory association areas and prefrontal areas, then into lower-order sensory association areas and premotor areas, and in the last stage, into the primary areas for the visual system [15, 23–25]. Accordingly, the NFT stage may progressively disrupt sensory and motor functional networks. We thus hypothesize that the progression of AD alters the visual functional network progressively.
Visual information reaches the primary visual area V1 and is then processed along both dorsal and ventral visual pathways, forming the visual information-processing network. Blood oxygenation level dependent (BOLD) functional magnetic resonance imaging (fMRI) provides a non-invasive neuroimaging tool to study cortical activation in the human brain evoked by visual stimulation [26–28]. Cortical areas activated by visual stimulation are characterized by a strong correlation between the time courses of the BOLD signal in these co-activated areas with the stimulation paradigm, which can be utilized to identify the stimulus-processing network using Pearson correlation coefficient analysis. We recently developed a novel method to identify brain functional areas of unitary pooled activity (FAUPAs) using fMRI that provided a novel method to identify task-evoked functional networks [29, 30]. A FAUPA is defined as an area in which the temporal variation of the activity is the same across the entire area. FAUPA determination is objective and automatic with no a priori knowledge. It is based on the assumption that the temporal variation of the activity is the same across the entire area of the FAUPA and involves an iterative aggregation of voxels dependent upon their intercorrelation. This method enables us to identify FAUPAs that are associated with specific tasks and examine dynamic activity of task-specific networks [31]. In a recent task-fMRI study of AD patients with the task of viewing face photos, we applied this method to investigate the effect of AD on the face-evoked visual-processing network [32]. In that study, a task-associated FAUPA was first identified in the primary visual area (V1) for each individual subject, and then, using that FAUPA’s signal time course as the reference function, a correlation analysis yielded a face-evoked visual-processing network for that subject. For healthy senior (HS) controls, the identified group-mean visual-processing network in the ventral pathway started from V1 and ended within the fusiform gyrus, an essential extra-striate location involved in face perception and recognition [33]. This face-evoked visual-processing network was disrupted and reduced in the AD patients in a disease-severity dependent manner: the network integrity of mild/moderate AD (MAD) patients was significantly impaired mainly in the higher-order visual association areas. However, both higher and lower-order visual association network functions were substantially impaired or even totally lost in severe AD (SAD) patients. These findings provide a functional corollary to the canonical view of the temporally sequential advancement of AD pathology through visual cortical areas from heteromodal association cortex (BA 20) to primary association regions (BA 18–19) and in SAD, even into primary visual cortex (BA 17), suggesting the potential of using functional network connectivity changes as a predictor of AD severity. However, task-based studies, even passive viewing tasks, can be challenging to accomplish in patients with cognitive impairment, particularly in advanced AD. Thus, in searching for neuroimaging biomarkers of AD progression, ‘simpler’ fMRI paradigms may be more advantageous in this population.
The operations of the brain are mainly intrinsic, involving the acquisition and maintenance of information for interpreting, responding to, and predicting environmental demands [34]. The brain’s intrinsic activity accounts for 20% of all the energy consumed by the body and may reflect the essence of brain function at rest [34]. This on-going intrinsic activity, as measured with the resting-state fMRI (rs-fMRI), exhibits a large spontaneous temporal fluctuation with a high degree of spatial organization across the whole brain [35, 36]. Functional connectivity (FC) analyses demonstrate the existence of large-scale brain FC networks, including a visual FC network [37]. Our FAUPA method is similar to the seed-based FC analysis of intrinsic activity measured with rs-fMRI [35], providing a novel approach to decode both rs- and task-fMRI timeseries in a consistent way for identifying their corresponding functional networks. Though related to each other, the intrinsic visual FC network is different from the visual stimulation-evoked FC network [38]. Additionally, a resting-state paradigm, which does not require active attentional engagement, represents a ‘simpler’ method for assessing functional network integrity, thus potentially disease progression, in AD.
Here we approach this question by comparing our prior task-based (face-evoked) visual paradigm to that of rs-fMRI in the same group of HS controls and AD patients of varying severities. The proposed approach enabled us to compare the brain’s intrinsic activity with the activity evoked by tasks at several levels of analysis from a task-associated FAUPA in a cortical area to the whole brain [39]. To investigate and compare the effect of AD on both the intrinsic visual FC network and the FC network evoked by face pictures (called “face-evoked visual-processing network” in this paper), subject-specific task-associated FAUPAs in area V1 may serve as unbiased seeds for conducting intrinsic (resting-state) FC analyses; one may then compare resting and task-based networks and examine disease specific effects on them, e.g., by AD. In this study, we applied this method to investigate the effect of AD on the intrinsic visual FC network and compare the result with that for the face-evoked visual-processing network.
METHODS AND MATERIALS
This is a follow-up study of our previous two studies [32, 40]. One of the studies examined the associations of behavioral and autonomic pain responses with resting-state connectivity in AD patients compared to HS controls, using rs-fMRI [40]. The other investigated the effect of AD on the face-evoked visual-processing network in the same participants, using a task-based approach via passive viewing of faces [32]. Using the same approach, the present study analyzed the same sets of fMRI data: one from the rs-fMRI study and the other from the task-fMRI study. Both data sets were acquired in the same fMRI session for each participant.
Participants
Eight SAD patients [6 female, ages from 55 to 85 years old with mean (MN)±standard deviation (SD) = 71.3±13.2], 11 MAD (8 female, ages from 67 to 86 with MN±SD = 77.6±6.2), and 26 HS controls (18 female, ages from 55 to 89 with MN±SD = 74.0±6.2) participated in this study. HS subjects had no subjective memory complaints. Diagnosis of probable AD was based on the criteria of the fourth edition of the diagnostic and statistical manual of mental disorders (DSM-IV) [41] and the National Institute of Neurological and Communicative Diseases and Stroke/Alzheimer’s Disease and Related Disorders Association (NINCDS-ADRDA) [42]. Each participant took two neuropsychological tests of Mini-Mental State Examination (MMSE) and Cornell Scale for Depression in Dementia (CSDD) [43]. No subjects had a CSDD score indicative of probable depression (> 12) [44]. We defined MAD as MMSE 11–23 and SAD as MMSE≤10. The MMSE test results: 29.1±1.1 for HS; 20.2±3.8 for MAD; and 5.6±3.9 for SAD. For further details please refer to our previous papers describing our methods [45, 46]. Testing took place in accordance with the Declaration of Helsinki and all protocols were approved by the Michigan State University Internal Review Board. Written informed consent was obtained personally or via named guardians or health care power of attorney for all HS as well as AD subjects. Verbal assent was obtained from participants before all testing procedures.
fMRI sessions
Subjects underwent two 7 min rs-fMRI runs and three 6 min task-fMRI runs. Prior to each resting-state scan subjects were instructed to hold still as much as possible, with their eyes open, and stay awake. (One AD subject was unable to complete the second resting-state scan.) The task paradigm consisted of a total of 9 trials divided into 3 different conditions: viewing unfamiliar faces, familiar faces and recent self-photos taken from different angles. Each trial was comprised of a 25 s task period followed by a 15 s rest period. During the task period, one face photo was presented for 5 s with a total of 5 photos presented, and participants passively viewed each presented photo. The order of trial presentation was pseudo-randomized for the three runs. During the 15 s rest period, participants were asked to focus their eyes on a fixation cross mark at the center of the blank screen and were asked to try not to think of anything in particular. (One HS control’s task-fMRI images were disrupted and unanalyzable, and consequently this HS subject’s data were removed from further analysis.) A live-view eye camera was used to ensure participants stayed awake during each of these five runs, and those who started to drowse were instructed to remain awake via the intercom microphone on the scanner operator’s console. For more details, please refer to our previous studies [32, 40].
Image acquisition
Functional brain images were acquired on a GE 3T Signa® HDx MR scanner (GE Healthcare, Waukesha, WI) with an 8-channel head coil using a gradient echo Echo-Planar-Imaging pulse sequence with these parameters: 38 contiguous axial slices, slice thickness = 3 mm, TE (time of echo) /TR (time of repetition) = 28/2500 ms, flip angle 80°, FOV (field of view) = 220 mm, matrix size = 64×64, and first 4 time points discarded. To identify anatomical regions, 180 sagittal T1-weighted 1 mm3 isotropic volumetric inversion recovery fast spoiled gradient-recalled images (10-min scan time), with cerebrospinal fluid (CSF) suppressed, were obtained to cover the whole brain with the following parameters: TE/TR = 3.8/8.6 ms, time of inversion = 831 ms, TR of inversion = 2332 ms, flip angle = 8°, FOV =25.6 cm×25.6 cm, matrix size = 256×256, slice thickness = 1 mm, receiver bandwidth =±20.8 kHz). For more details, please refer to our previous studies [32, 40].
Image preprocessing
A standard image preprocessing stream was performed using AFNI [29, 47]. It included removing spikes, slice-timing correction, motion correction, spatial filtering with a Gaussian kernel with a full-width-half-maximum of 4.0 mm, computing the mean volume image, band-passing the signal intensity time course to the range of 0.009 Hz –0.08 Hz, and computing the relative signal change ΔS (%) of the band-passed signal intensity time course for each of the five runs of each subject. ΔS = [S(t)-S0]×100/S0 (%), where S(t) is the signal time course and S0 is the mean of S(t). After these preprocessing steps, the three signal time courses from the three task-fMRI runs were sorted according to the three face categories, and a concatenated signal time course was reconstructed for each face category. Further image analysis was carried out using in-house developed Matlab-based software algorithms.
FAUPA identification
A statistical model and algorithms were developed and implemented in Matlab to identify FAUPA [29]. The determination of a FAUPA is based on the assumption that the signal time course is the same across the entire area within a FAUPA, and its determination involved an iterative aggregation of voxels dependent upon the inter-correlation of their signal time courses. The determination consisted of two major procedures: (a) the algorithm, with an initial statistical criterion, identified a stable region-of-interest (ROI) in which the signal time courses of all voxels showed a similar temporal behavior; and (b) using a second statistical criterion the algorithm then compared the temporal behavior of the signal time course of the voxels within the ROI with those bordering it, to determine whether this stable ROI satisfied the condition of being a FAUPA. (For further details, please refer to [29].)
Identification of task-associated FAUPAs in area V1 and the task-evoked visual-processing network
For each participant and each face category, a task-associated FAUPA in the putative primary visual area (V1) was identified first, and then its signal time course was used as the reference function to compute the Pearson correlation coefficient (R) map in the original subject space (Fig. 1). (Please refer to our previous study for details of how those FAUPAs were identified [32].) Our previous study demonstrated a similar face-evoked visual-processing network for all three face categories for each subject group, and also showed no effect of face differences on the network for each of the three subject groups [32]. Accordingly, for each individual participant, a mean R map averaged over the three face categories was computed and used to represent the face-evoked R map for that participant. This resulted in 8 face-evoked R maps for SAD, 11 R maps for MAD and 25 R maps for HS, respectively, and each R map was an independent measure. Then, for group analysis, this face-evoked R map of each individual subject was converted to a standard template space (icbm452) using AFNI’s “@auto_tlrc” with that subject’s anatomic dataset as the input, with “adwarp” applied to each R map with the affine transform and resampling mode set to “nearest neighbor”. We then computed group-mean R maps (Fig. 2, top panel, right). In our previous study we thresholded group mean R maps at R > 0.7 to reflect the high co-activity within the task-evoked FC network [32]. The strength of co-activity within an intrinsic FC network, however, is relatively weak, which necessitates a lower threshold R [38]. In this study, to compare the effects of AD on both the intrinsic and task-evoked FC networks, we thresholded group-mean R maps at R > 0.6 (total time points N = 144, p < 6.1×10⁻¹³) to yield face-evoked visual-processing networks (Fig. 2, bottom panel, right). This also enabled us to test whether the results depend on the choice of threshold R; similar results from both thresholds would be confirmatory.
Fig. 1
Illustration of the selected task-associated FAUPA for a representative SAD patient and using this FAUPA as seed to conduct a seed-based visual functional connectivity analysis for the resting-state data. The red clusters in the three images represent the selected task-associated FAUPAs in the putative V1, identified with the task-fMRI data for the unfamiliar face category [32]. The FAUPA’s signal time course was the mean signal time course averaged over that of all voxels within the FAUPA (a). Task-induced, time-locked signal changes are conspicuous for each of the nine task trials. The two plots in (b) and (c) show the seed-mean signal time courses for the two resting-state time series, respectively. (d): Comparison of the group-mean signal time courses of the selected FAUPAs for the three participant groups. HS, healthy senior; MAD, mild/moderate AD; SAD, severe AD. The error bar indicates the standard error of the means.
![Illustration of the selected task-associated FAUPA for a representative SAD patient and using this FAUPA as seed to conduct a seed-based visual functional connectivity analysis for the resting-state data. The red clusters in the three images represent the selected task-associated FAUPAs in the putative V1, identified with the task-fMRI data for the unfamiliar face category [32]. The FAUPA’s signal time course was the mean signal time course averaged over that of all voxels within the FAUPA (a). Task-induced, time-locked signal changes are conspicuous for each of the nine task trials. The two plots in (b) and (c) show the seed-mean signal time courses for the two resting-state time series, respectively. (d): Comparison of the group-mean signal time courses of the selected FAUPAs for the three participant groups. HS, healthy senior; MAD, mild/moderate AD; SAD, severe AD. The error bar indicates the standard error of the means.](https://content.iospress.com:443/media/adr/2021/5-1/adr-5-1-adr210017/adr-5-adr210017-g001.jpg)
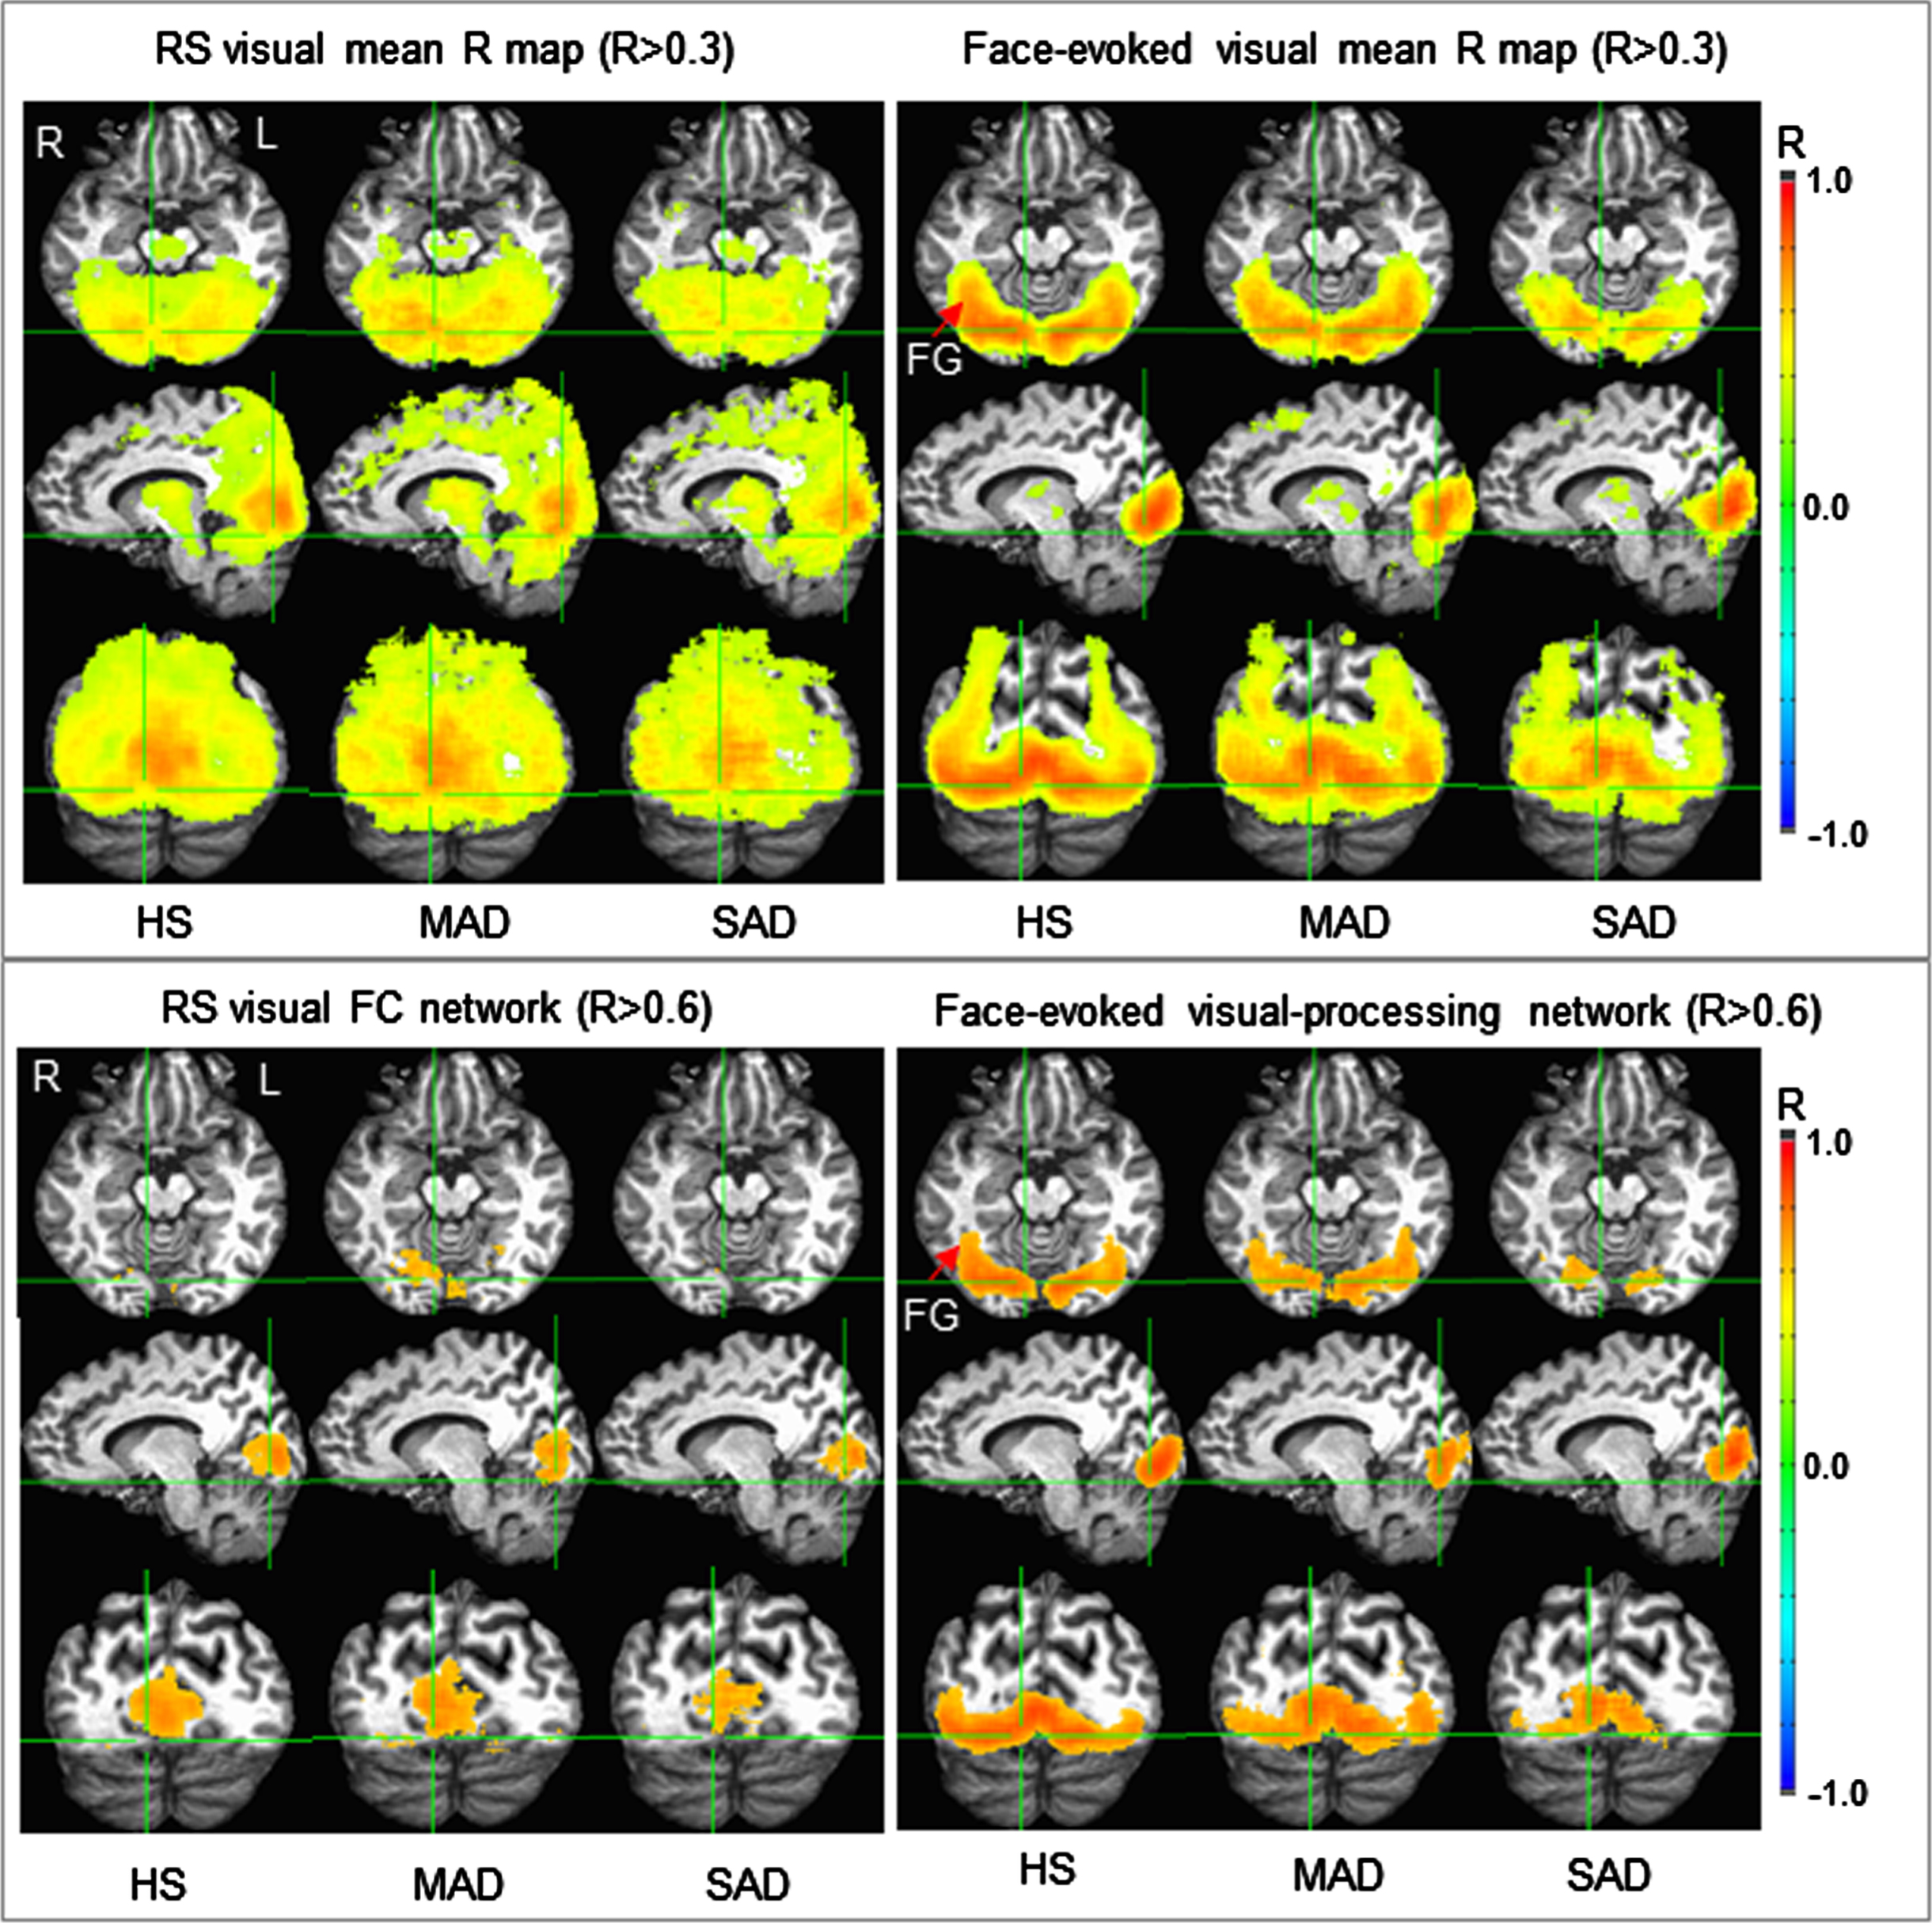
Fig. 2
Illustration of the two visual group-mean R maps identified for the three subject groups (top panel) and their corresponding functional networks (bottom panel). (Note that these R maps were thresholded with R > 0.3 for better visual comparison between the resting and task states.) The face-evoked visual-processing network was mainly confined within the visual cortex for the severe AD (SAD), but extended to the fusiform gyrus (FG) for the healthy senior (HS) controls and mild/moderate AD (MAD). In contrast, the resting-state visual functional connectivity (FC) network was located mainly within and around area V1 for the SAD patients, but substantially extended for the MAD patients and HS controls.
Determination of the resting-state visual FC network
For each participant, the identified task-associated FAUPA in area V1 for the unfamiliar face category was arbitrarily selected as seed to compute seed-mean signal time course. This seed time course was then used as the reference function to compute the R map in the original subject space for each resting-state run (Fig. 1). A mean R map averaged over the two resting-state runs was computed for each participant. This resulted in 8 mean resting-state R maps for SAD, 11 mean R maps for MAD and 25 mean R maps for HS, respectively, with each R map serving as an independent measure. Then, for group analysis, mean resting-state R maps were converted to standard template space in the same way of converting those face-evoked R maps to the standard space. For each subject group, we first computed the group-mean R map averaged over all subjects within that group (Fig. 2, top panel, left). Based on the visual examination of these group-mean R maps, they were thresholded at R > 0.6 (total time points N = 168, p < 7.5×10⁻¹⁵) to yield resting-state visual FC networks for each group (Fig. 2, bottom panel, left).
Group statistical analysis
We undertook two separate analyses to examine the effect of AD on the visual functional networks. First, for each functional network type (i.e., task-evoked versus resting-state), we used the HS-specific network as a mask and computed the total number of voxels with R > 0.6 within that mask for each subject. Voxel numbers were then compared among the HS, MAD, and SAD to determine the effect of AD on the spatial extent of the visual functional network. Using the same HS-based mask, we also computed the mask-mean R value across all voxels within the mask for each subject. These R values were compared among these three subject groups to determine the effect of AD on the connectivity of the visual functional network. ANOVA testing was utilized for statistical comparisons, with significant group-level differences followed up with Tukey HSD post-hoc testing. For all R-related group statistical tests, the R values were converted to Z values through Fisher’s Z transformation to improve the normality of the distribution.
Next, we performed a similar analysis, though utilizing an inverse process to create highly group-specific masks for each of the six visual functional networks for examining the effect of AD severity on these networks. Specifically, we created six, network type specific, masks in which: 1) two SAD masks with each one composed of its SAD-specific network; 2) two MAD masks with each one composed of the part of its MAD-specific network that was distinct from its corresponding SAD mask, i.e., the part not shared by the SAD-specific network; and 3) two HS masks with each one composed of the part of its HS-specific network that was distinct from both masks of MAD and SAD, i.e., the part not shared by neither the MAD- nor SAD-specific networks. For each of these six masks, we computed the mask-mean R value across all voxels within that mask for each subject. Resultant R values were compared amongst groups for each mask using ANOVA, with significant group-level differences followed up with Tukey HSD post-hoc testing.
Finally, we assessed the association of the disrupted visual functional network with the disease severity measured with a commonly used clinical cognitive screen (MMSE), for each functional network type. To do this, we generated a mask composed of that portion of the HS-specific network that was distinct from the SAD-specific network, i.e., the largest part of the functional network affected by the disease. We then computed the mask-mean R across all voxels within the mask for each subject and conducted a correlation analysis of these R values with the MMSE scores for each functional network type to test the potential of using functional network changes as a biomarker for predicting AD progression.
RESULTS
The two identified visual functional networks are visualized in the bottom panel in Fig. 2; on the left are the resting-state visual FC networks for the HS, MAD, and SAD patients, respectively, and at right are the face-evoked visual-processing networks. Of note, the three face-evoked visual-processing networks of the three subject groups were similar to those determined with threshold R > 0.7 and reported in our previous study [32]. For the HS, in the ventral pathway the face-evoked visual-processing network started from area V1 and ended within the fusiform gyrus. This face-evoked network appeared partially disrupted and reduced in the MAD patients, and substantially disrupted and reduced in the SAD patients. This gradual disruption to the visual-processing network from the HS to the SAD patients was the same observation reported in our previous study [32]. In contrast, the resting-state visual FC network was mainly limited to the visual cortex for all three subject groups. This FC network appeared comparable in size for the HS and MAD patients, but reduced in size in the SAD patients.
For the HS controls, the resting-state visual FC network contained 14,277 voxels (voxel size 1×1×1 mm3) and the face-evoked visual-processing network contained 47,376 voxels. Using the size (14,277 voxels) of this HS-specific intrinsic FC network as the comparator reference, the relative size of the two networks for the three subject groups are illustrated in the top panel of Fig. 3 (left: resting-state FC network; right: face-evoked network). Both resting and task states showed same trend; the HS had the largest voxel number, SAD had the smallest number, and MAD was in the middle. The corresponding ANOVA showed a significant group effect for the task state [F(2,41) = 8.0, p = 0.001], but not the resting-state. For the face-evoked network, post hoc Tukey HSD testing showed significant differences between the HS and SAD (p = 0.001) and between the MAD and SAD (p = 0.041), but no difference between the HS and MAD (p = 0.43). These results demonstrate an AD-reduced network size to the face-evoked visual-processing network that was driven by reduced activation in SAD patients.
Fig. 3
Group comparisons of the visual functional networks for the three subject groups with respect to the spatial extent of these networks and the R values within each network. Top panel: the relative size of resting-state visual FC network (left) and of face-evoked visual-processing network (right) for the HS, MAD, and SAD, respectively. The size of the resting-state visual FC network of the HS (the red clusters in the 1st column of the bottom panel in Fig. 2) was chosen as the reference for network size comparisons between the two functional states and among the three subject groups. Bottom panel: group-mean R values for the two functional networks and the three subject groups. The error bar indicates the standard deviation.
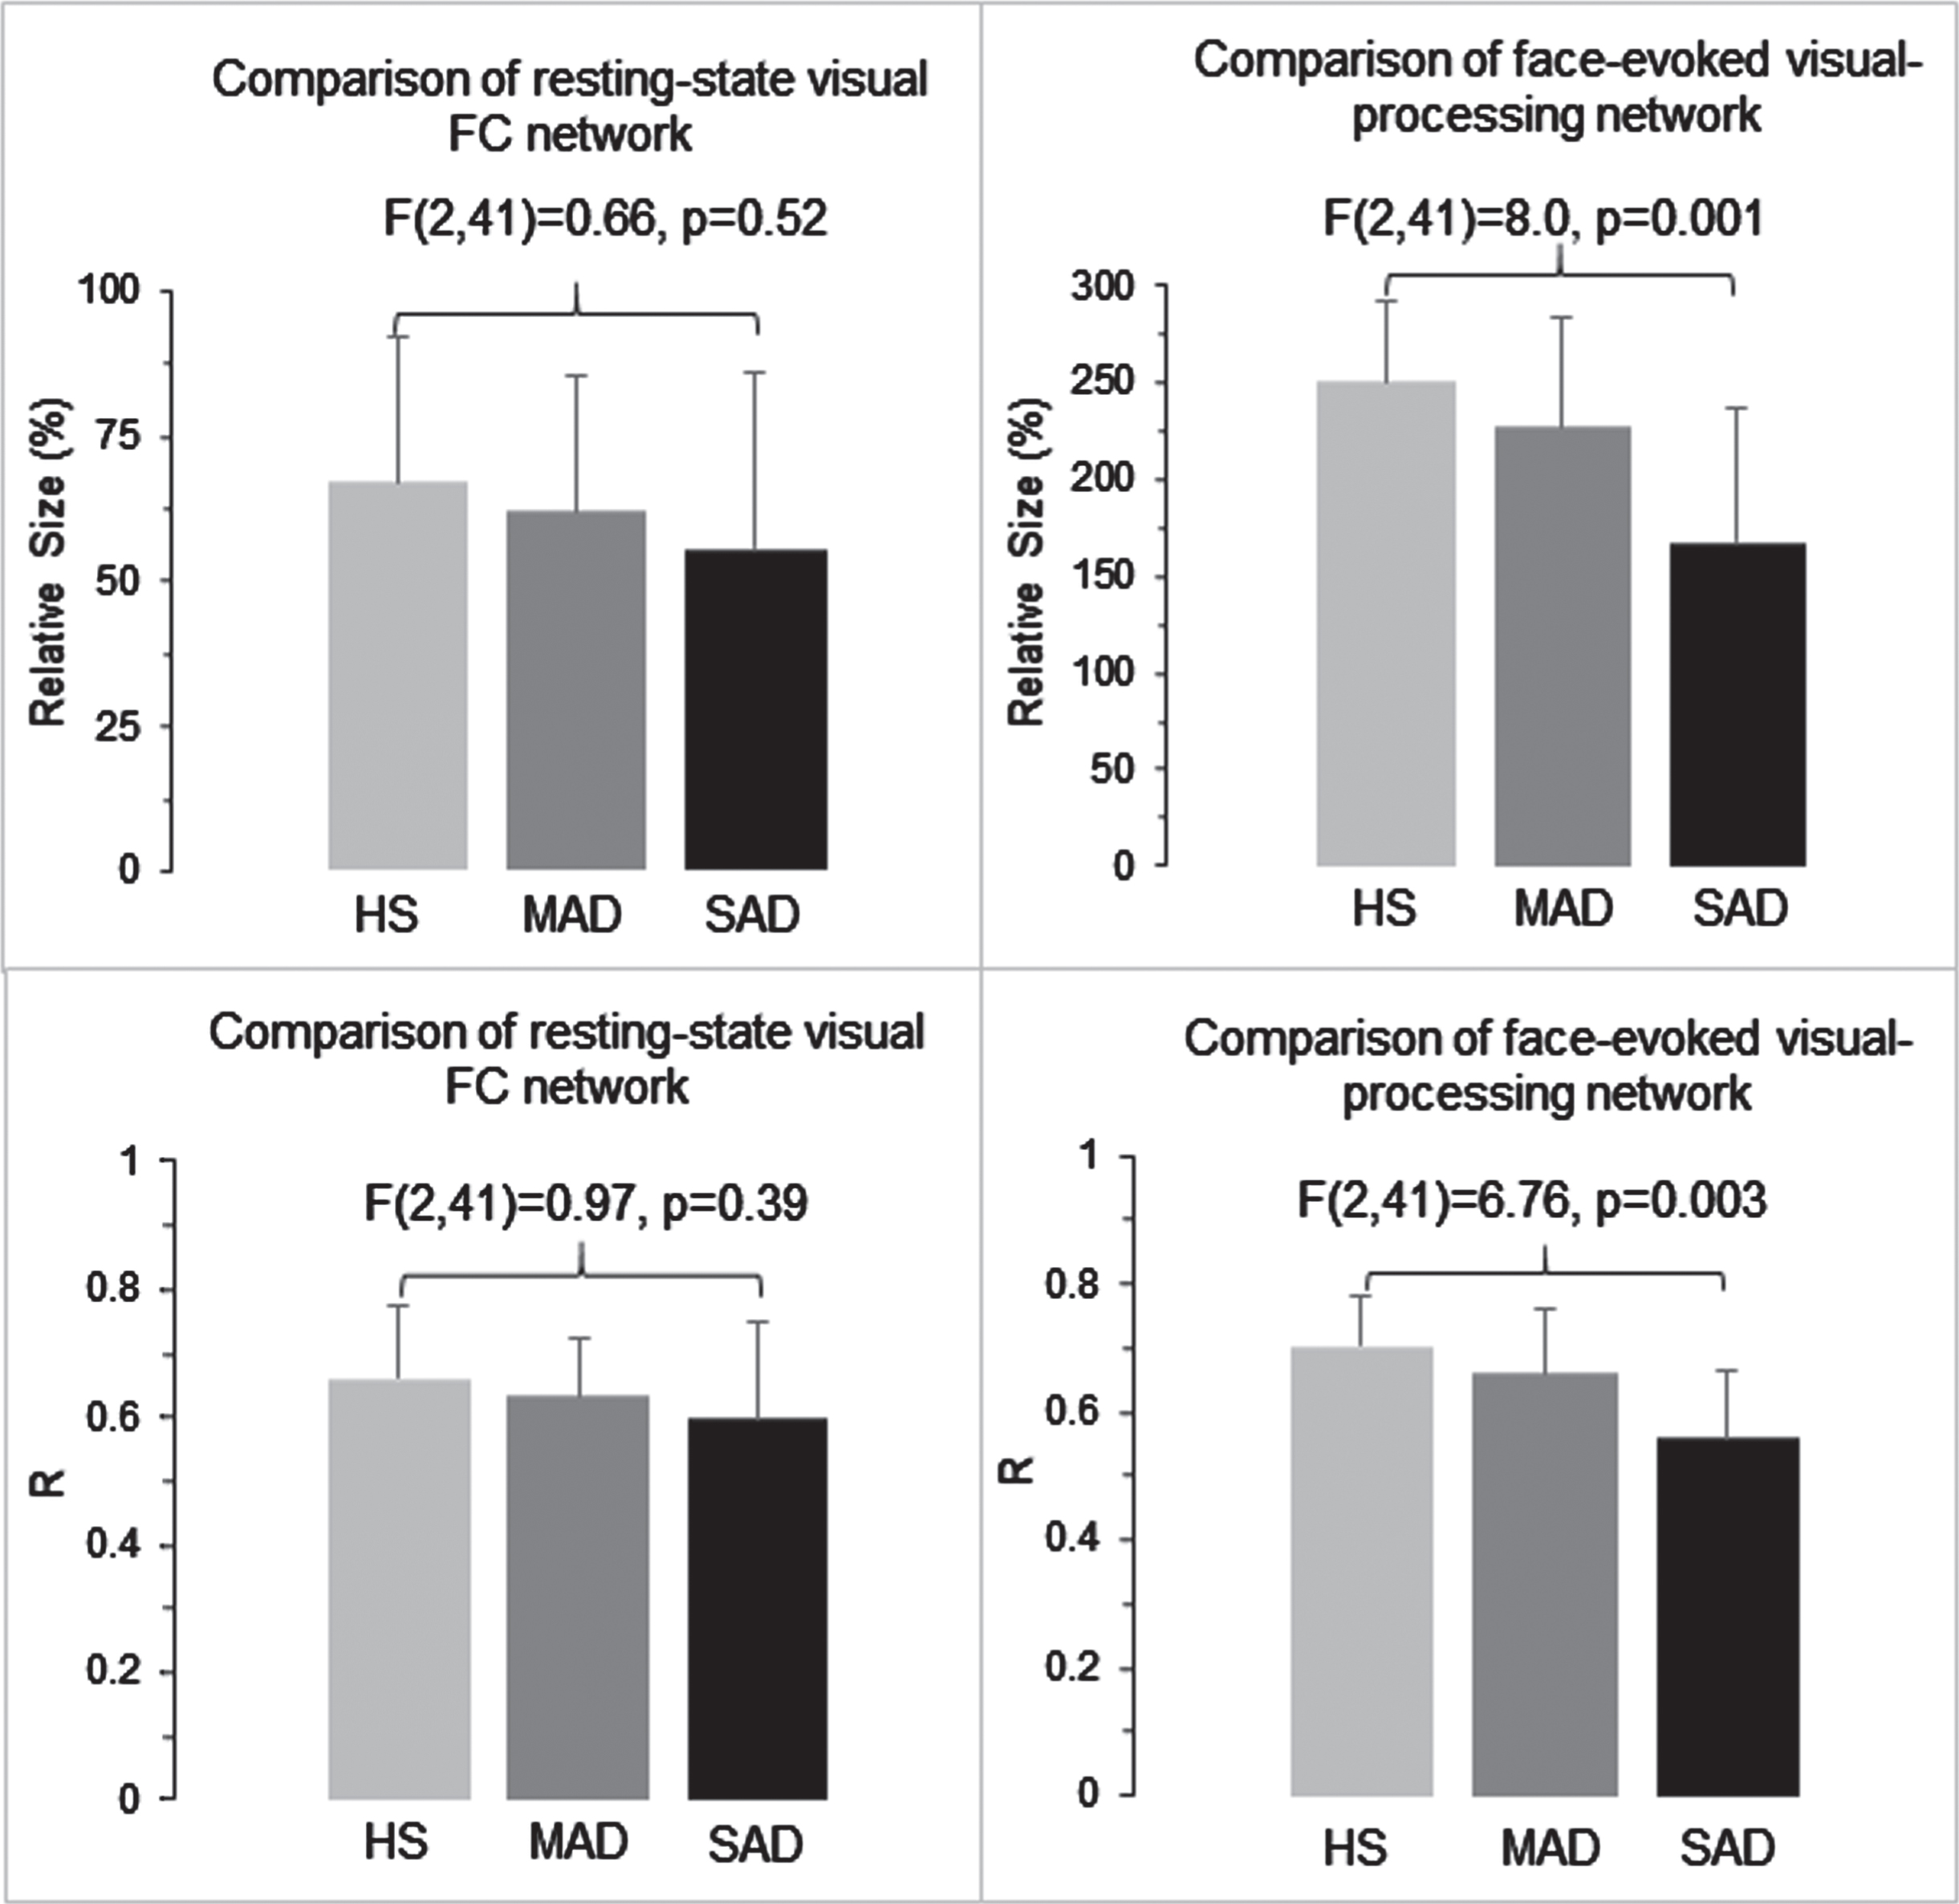
The effect of AD on the connectivity (R) within each HS-specific functional network is illustrated in the bottom panel of Fig. 3 (left: resting-state FC network; right: face-evoked network). As in the spatial extent results, both resting and task states showed same overall trend; the HS had the largest R, SAD had the smallest R, and MAD was in the middle. Corresponding ANOVA of the Z values showed a significant group effect for the task-based network [F(2,41) = 6.76, p = 0.003], but not for the resting-state. For the face-evoked network, post hoc Tukey HSD testing showed a significant difference between the HS and SAD (p = 0.002), no difference between the HS and MAD (p = 0.43), and a trend toward significance between the MAD and SAD (p = 0.078). These results showed an AD-reduced connectivity to the face-evoked visual-processing network, again driven by decremental activation-based connectivity in SAD patients.
The top panel in Fig. 4 illustrates the three group-specific masks for each functional network, which allowed further examinations of the effect of AD severity on these networks. For the face-evoked visual-processing network, the SAD mask covered an area that was mainly within the visual cortex. The mean R within this mask showed a similar value for all three subject groups [F(2,14) = 0.40, p = 0.67] (Fig. 4B, left). Thus, connectivity within the SAD subjects’ face-evoked visual-processing network was just as strong as in MAD and HS. The MAD mask, excluding the area covered by the SAD mask, covered an area that extended both within and outside the visual cortex substantially. The mean R was substantially smaller for the SAD in comparison to the HS and MAD. Their corresponding ANOVA of the Z values showed a significant difference among the three groups [F(2,41) = 9.73, p < 0.001] (Fig. 4B, middle). Post hoc Tukey HSD testing showed significant differences between the SAD and HS (p = 0.001) and between the SAD and MAD (p = 0.001), but no difference between the MAD and HS (p = 0.77). The mean R values of the MAD and HS were at the same level as that within the SAD mask, showing that the visual areas in this MAD mask were activated in both the MAD and HS as strongly as that in the SAD mask. This area, however, was not activated in the SAD, reflected in its significantly reduced R. The HS mask, excluding the areas covered by the MAD and SAD masks, covered an area that further extended outside the MAD mask. The mean R was substantially smaller not only for the SAD but also for the MAD in comparison to the HS, and their corresponding ANOVA of the Z values also showed a significant difference among the three groups [F(2,41) = 12.01, p < 0.001] (Fig. 4B, right). Post hoc Tukey HSD testing showed significant differences between the HS and SAD (p < 0.001) and between the HS and MAD (p = 0.012), but no difference between the SAD and MAD (p = 0.24). The mean R value of the HS was at the same level as that within the SAD mask, showing that the cortical area of this HS mask was activated in the HS. This area, however, was not activated in both the MAD and SAD, reflected in their significantly reduced R values. These results demonstrated a progressive reduction to the face-evoked visual-processing network based on AD severity.
Fig. 4
Illustration of the three group-specific network masks for the two functional states (A), and their corresponding group comparisons for the three subject groups: the face-evoked visual-processing network (B) and the resting-state visual FC network (C). For each functional network, the SAD mask is the cortical area of the corresponding functional network of the SAD patients alone. The MAD mask is the cortical area of the corresponding functional network of the MAD patients, excluding the corresponding SAD mask, i.e., the part of the MAD network distinct from the SAD network. The HS mask is the cortical area of the corresponding functional network of the HS controls, excluding both MAD and SAD masks. The error bar indicates the standard deviation.
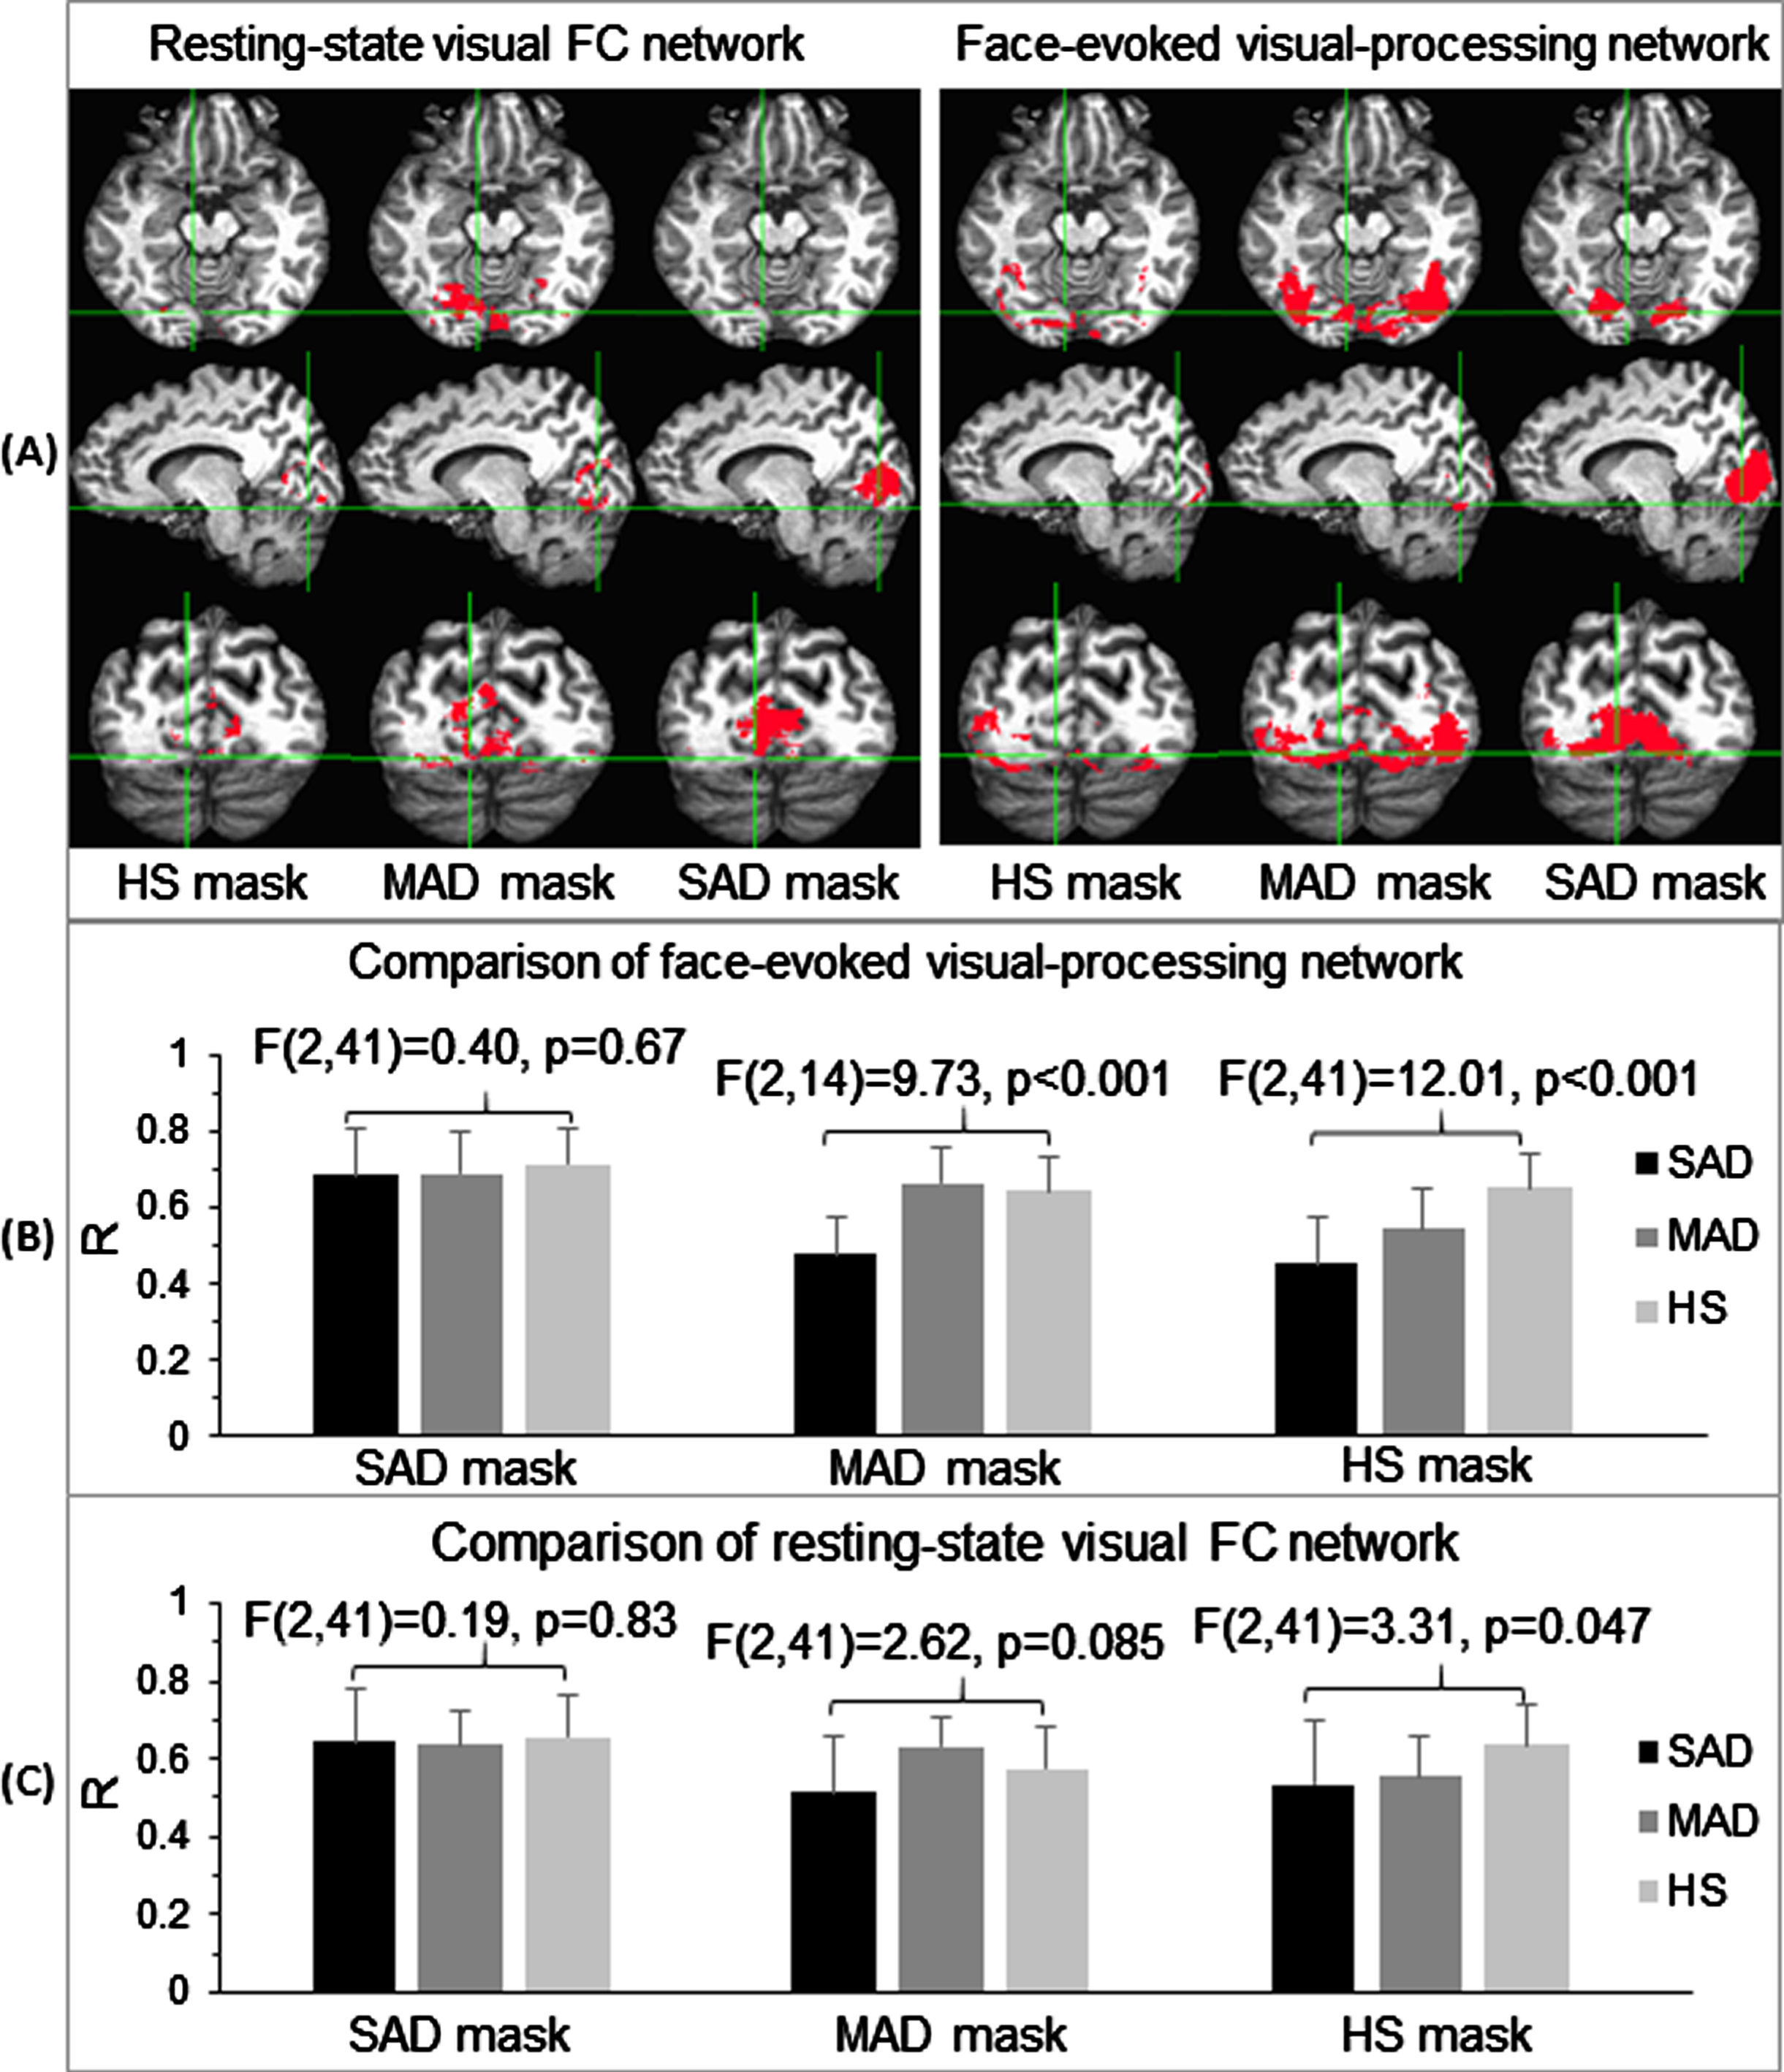
For the resting-state visual FC network, the SAD mask covered an area centered at area V1 (Fig. 4A, 3rd column). The mean R within this mask again showed a similar value for all three subject groups [F(2,14) = 0.19, p = 0.83] (Fig. 4C, left). The MAD mask substantially extended outside this SAD mask, and the HS mask further extended outside this MAD mask in some degree. Within the MAD mask, although the mean R of the SAD was the smallest one and showed a similar behavior to that of the face-evoked visual-processing network, the three mean R values of the three groups showed no statistically significant difference [F(2,41) = 2.62, p = 0.085)] (Fig. 4C, middle). Within the HS mask, the three mean R values of the three groups also showed a similar behavior to that of the face-evoked visual-processing network, and their corresponding group-level ANOVA of the Z values also showed a significant difference [F(2,41) = 3.31, p = 0.047] (Fig. 4C, right). Post hoc Tukey HSD testing, however, did not show any specific significant differences for the three-paired comparisons among the HS, MAD, and SAD. These results suggested a much smaller effect of AD on the resting-state visual FC network in comparison to that on the face-evoked visual-processing network.
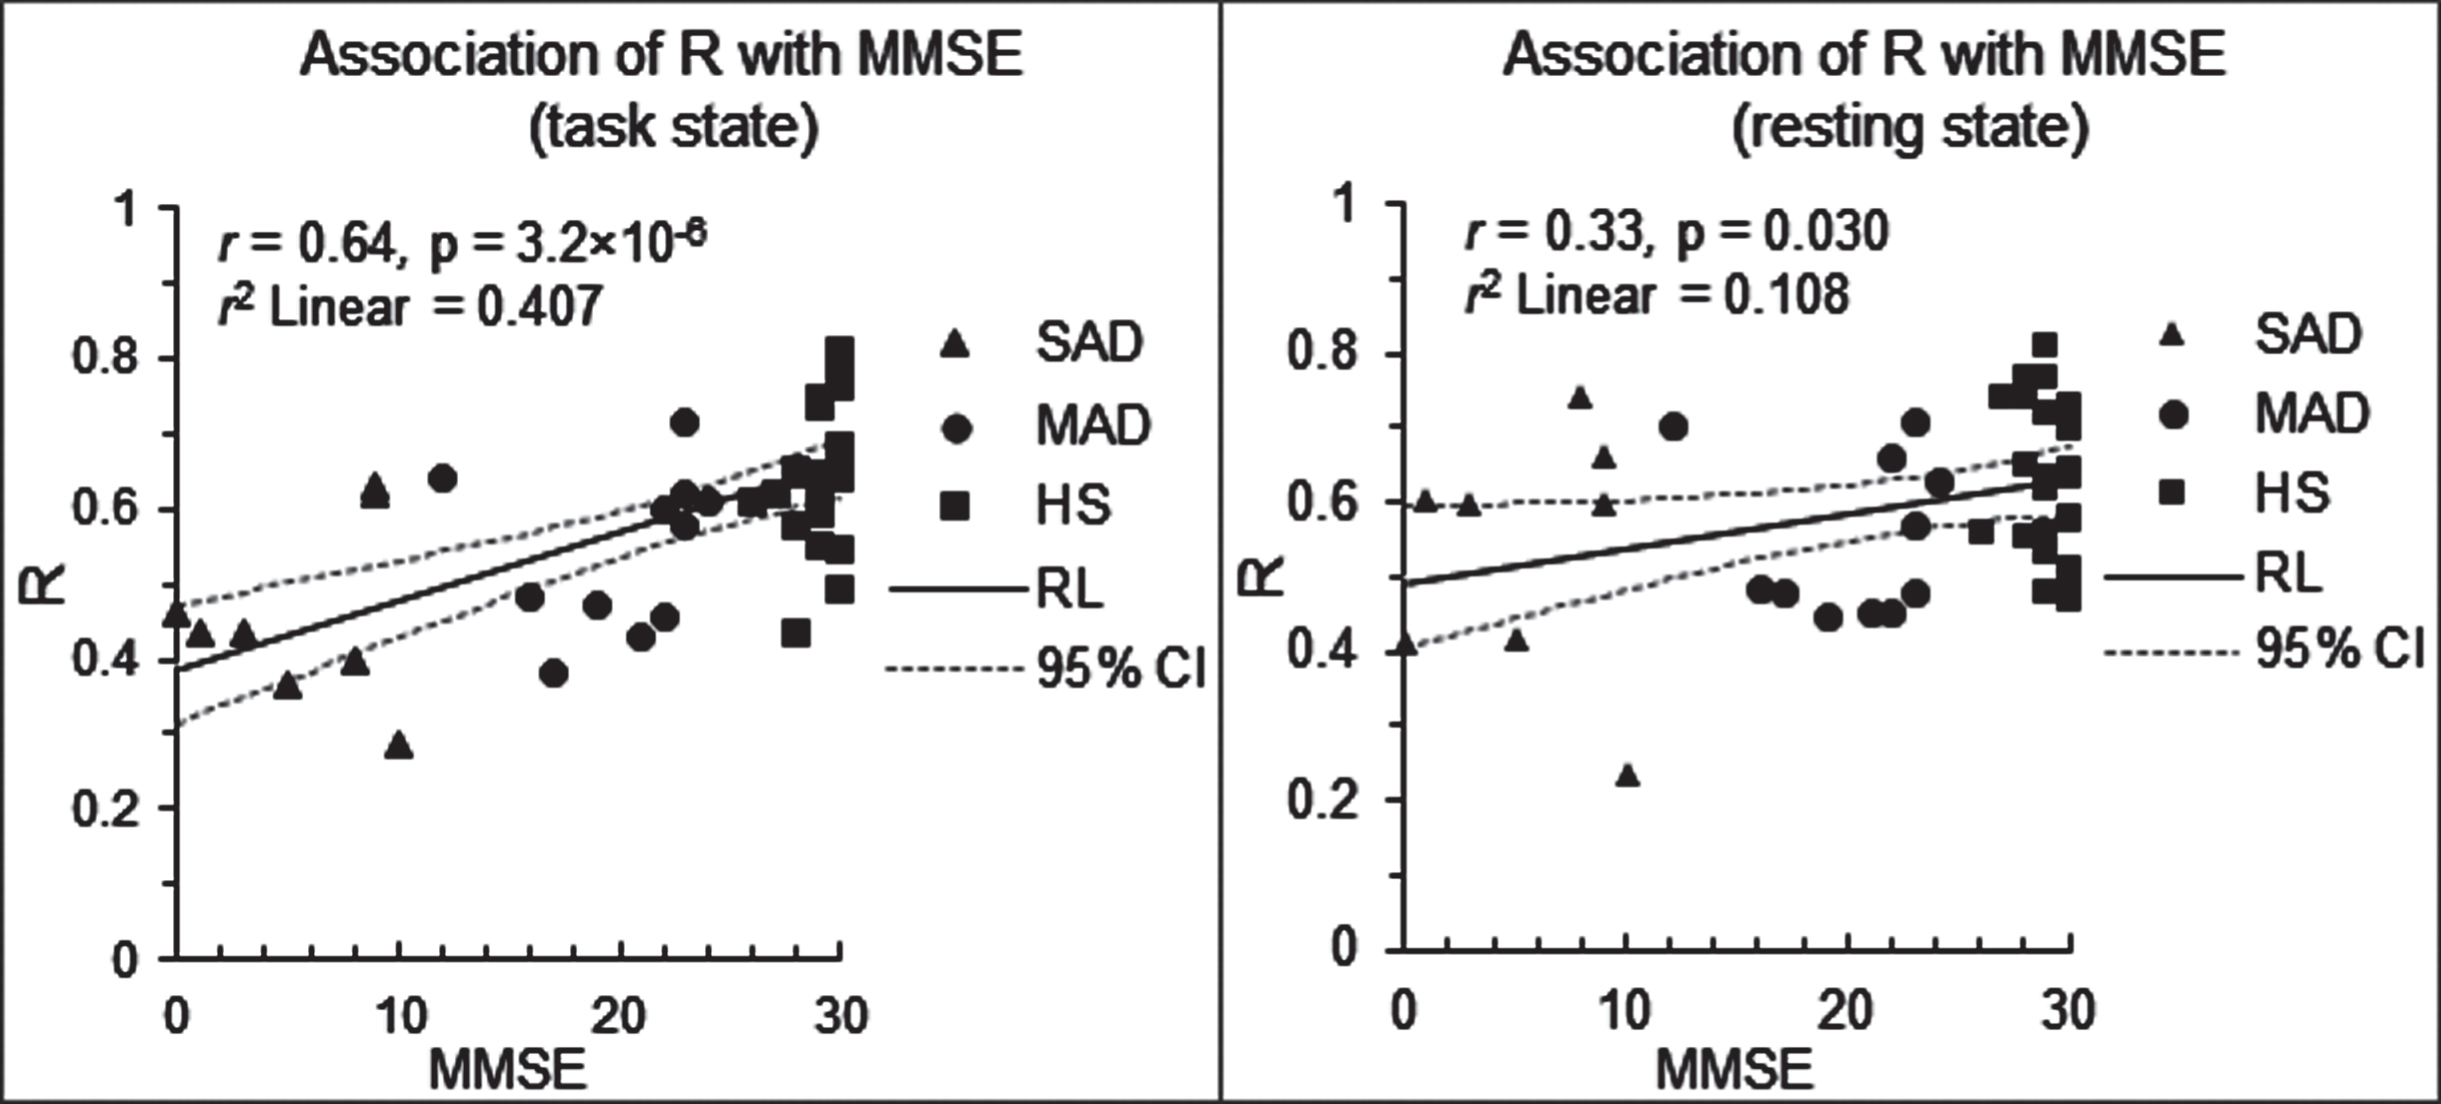
For each functional network type, using the part of the HS-specific network that was distinct from the SAD-specific network as a mask, the mask-mean R was computed for each subject. Correlation analyses of these R values with MMSE scores showed a strong association between these two measures for the face-evoked visual-processing network (R = 0.64, p = 3.2×10⁻⁶), but a weaker correlation for the resting-state visual FC network (R = 0.33, p = 0.030) (Fig. 5), suggesting the potential of using particularly task-based network disruption as a predictor or biomarker of AD progression.
Fig. 5
Association of the disrupted network with the disease severity. Left: scatter plot of R versus MMSE for the face-evoked visual-processing network. Right: scatter plot of R versus MMSE for the resting-state visual FC network. MMSE, Mini-Mental State Examination; and r, the correlation of R with MMSE over all subjects (N = 44); RL, regression line; and CI, confidence interval.
DISCUSSION
A task-associated FAUPA is defined as one that is activated when the task is performed [29]. In this study, the task was to view the visually presented face photos. For the representative subject, the signal time course of the identified task-associated FAUPA in area V1 showed the task-induced signal changes from trial to trial (Fig. 1, top plot), and these variations characterized this individual’s response for each task trial. Using the signal time course of a task-associated FAUPA as the reference function, a correlation analysis with all voxels across the brain may yield a functional network specific for the task, i.e., a task-processing network. Using the signal time course of a task-associated FAUPA to identify the task-processing network may have advantages over using an expected ideal response in the general linear model [48, 49] because it takes into account response variations from trial to trial and from participant to participant, potentially yielding a more objectively identified task-processing network for each individual. This may be particularly important for patients with difficulty in performing a task properly as demonstrated in our previous study [32]. To that end, in a previous task-based study of passive face viewing, we found that face-evoked visual-processing network was disrupted and reduced in the AD patients in a disease-severity dependent manner. However, task-based studies, even passive viewing tasks, can be challenging for cognitively impaired patients. We thus set out to compare intrinsic visual network FC, vis a vis resting-state fMRI, compared with respect to our prior task-based approach in probing robust visual network-based markers of AD progression.
The face-evoked visual-processing network determined with R > 0.6 in this study was similar to that determined with R > 0.7 in our previous study [32]. Both studies produced similar results with all conclusions remained the same, demonstrating that these results were independent of the chosen thresholds. This identified face-evoked visual-processing network in the ventral pathway started from area V1 and ended within the fusiform gyrus for the HS (Fig. 2, bottom panel, right), consistent with the fact that the fusiform gyrus is an essential extra-striate location involved in face perception and recognition [33]. In contrast, with the same threshold R > 0.6, the identified resting-state visual FC network was mainly confined within the visual cortex (Fig. 2, bottom panel, left). The total volume of the face-evoked visual-processing network was about 3 times larger than that of the resting-state visual FC network and was consistent across all our three subject groups (Fig. 3, top panel). In general, for each functional network type (face-evoked versus intrinsic FC), HS had the largest network volume followed by MAD and then SAD; this AD-reduced network size was statistically different across groups only for the face-evoked visual-processing network. The connectivity within each network of the HS was also generally reduced in AD (Fig. 3, bottom panel), though again only the face-evoked visual-processing network met threshold for statistical significance. The same trend of reduction in both the network size and R value for both functional networks suggested a progressively reduced visual functional network with AD severity, though the effect was significantly more robust for the face-evoked network in comparison to the resting-state network.
This study further examined the effect of AD severity on face-evoked and resting-state visual functional networks in a different way, with three highly group-specific masks per network type (Fig. 4A). For the two SAD masks specific to spatial extent of face-evoked activation and intrinsic activity in SAD subjects, mask-mean R values were similar for all three subject groups, and these R values were comparable between the two functional networks (Fig. 4B and C, left). Thus, there remained a core of residual, “normally” functioning, lower-order visual network activity and FC in SAD. However, outside this core area, AD generally disrupted these two network types in a severity dependent manner. This was the case particularly for the face-evoked visual-processing network (Fig. 4B, middle and right). Here, MAD disrupted and reduced the network mainly in the higher-order visual association areas, and SAD further reduced the network to the lower-order visual association areas (Fig. 2, bottom panel, right). To a lesser extent, resting-state FC within the HS-specific mask (Fig. 4C, far right) showed evidence of AD-mediated dysfunction in intrinsic visual network FC. These results demonstrated a severity dependent reduction in visual functional network integrity, primarily with respect to response to visual cortical face processing. Similar findings with respect to significant correlation of network R-values with MMSE (again face-evoked more robustly than intrinsic FC) provides further evidence of an association between network disruption and AD severity (Fig. 5). These results are consistent with our hypothesis regarding AD’s temporally sequential pathologic effects on higher to lower-order visual association areas prior to affecting primary visual cortex [13, 17, 50–53]. The MMSE-related findings may additionally reflect the AD’s temporally sequential pathological effect on the cognitive function, which is consistent with the progressive disintegration of overall cognitive processing in later-stage AD [54, 55].
Overall, these findings suggest the potential of using functional network changes as a predictor or biomarker of AD progression. However, at least based on this current study in the visual system, an activation-based visual network would likely be a more sensitive marker of AD progression, in contrast to our intrinsic/resting-state visual FC network. The latter makes sense based on neuropathological findings in AD, as early-stage AD pathology (Braak stage 3) begins in higher-order heteromodal association cortices such as BA 20. To that end, candidate networks to evaluate AD progression—or risk of progression—would likely need to involve tasks specific to AD-associated cognitive impairments that could effectively provoke higher-order heteromodal association cortical activation. The FAUPA method could then be utilized to identify task-specific networks and test their sensitivity and specificity for predicting AD progression in comparison to existing neuropsychological gold standards. Alternatively, resting-state intrinsic networks involving heteromodal cortices, such as default mode or salience networks [37], could be another viable candidate for future investigation in this regard.
Our FAUPA based comparison of task and resting-state connectivity was based on seed selection using task-based data. This method can provide useful information about the integrity of visual functional networks with respect to rest-stimulus interactions in healthy conditions and disease states like AD [38]. However, our approach did rely on prior completion of a task for seed selection, and could result with different connectivity maps from analyses based on resting-state data alone, including independent component analysis [56]. Further comparisons between different approaches will be valuable in future research.
CONCLUSION
The functional connectivity of the two identified visual functional networks for rest and task states was disrupted and reduced in a similar severity-dependent manner: the more severe the cognitive impairment, the greater reduction in network connectivity. However, findings were far more robust with respect to face-evoked visual network connectivity. The pattern of this network connectivity disruption and reduction is also consistent with the canonical view of the temporally sequential advancement of AD pathology through visual cortical areas. The observed association between the functional network disruption and AD severity suggests the potential of using functional network changes as a predictor or biomarker of AD progression.
ACKNOWLEDGMENTS
The authors thank scanning support from MR technologist Scarlett Doyle. This work was supported by the Michigan State University (MSU) Radiology Pilot Scan Program.
This study was partially supported by the MSU Department of Family Medicine Pearl Aldrich Graduate Student Fellowship (Grant: RT083166-F5015) and the Blue Cross Blue Shield of Michigan Foundation (Grant: 1981.SAP).
CONFLICT OF INTEREST
All authors declare no competing interests.
REFERENCES
[1] | Duyckaerts C , Bennecib M , Grignon Y , Uchihara T , He Y , Piette F , Hauw JJ ((1997) ) Modeling the relation between neurofibrillary tangles and intellectual status. Neurobiol Aging 18: , 267–273. |
[2] | Bennett DA , Schneider JA , Wilson RS , Bienias JL , Arnold SE ((2004) ) Neurofibrillary tangles mediate the association of amyloid load with clinical Alzheimer disease and level of cognitive function. Arch Neurol 61: , 378–384. |
[3] | Sabbagh MN , Cooper K , DeLange J , Stoehr JD , Thind K , Lahti T , Reisberg B , Sue L , Vedders L , Fleming SR , Beach TG ((2010) ) Functional, global and cognitive decline correlates to accumulation of Alzheimer’s pathology in MCI and AD. Curr Alzheimer Res 7: , 280–286. |
[4] | Nelson PT , Alafuzoff I , Bigio EH , Bouras C , Braak H , Cairns NJ , Castellani RJ , Crain BJ , Davies P , Del Tredici K , Duyckaerts C , Frosch MP , Haroutunian V , Hof PR , Hulette CM , Hyman BT , Iwatsubo T , Jellinger KA , Jicha GA , Kovari E , Kukull WA , Leverenz JB , Love S , Mackenzie IR , Mann DM , Masliah E , McKee AC , Montine TJ , Morris JC , Schneider JA , Sonnen JA , Thal DR , Trojanowski JQ , Troncoso JC , Wisniewski T , Woltjer RL , Beach TG ((2012) ) Correlation of Alzheimer disease neuropathologic changes with cognitive status: A review of the literature. J Neuropathol Exp Neurol 71: , 362–381. |
[5] | Murray ME , Lowe VJ , Graff-Radford NR , Liesinger AM , Cannon A , Przybelski SA , Rawal B , Parisi JE , Petersen RC , Kantarci K , Ross OA , Duara R , Knopman DS , Jack CR Jr. , Dickson DW ((2015) ) Clinicopathologic and 11C-Pittsburgh compound B implications of Thal amyloid phase across the Alzheimer’s disease spectrum. Brain 138: , 1370–1381. |
[6] | Jagust W ((2016) ) Is amyloid-beta harmful to the brain? Insights from human imaging studies. Brain 139: , 23–30. |
[7] | Malpas CB , Saling MM , Velakoulis D , Desmond P , O’Brien TJ , Alzheimer’s Disease Neuroimaging Initiative ((2015) ) Tau and amyloid-beta cerebrospinal fluid biomarkers have differential relationships with cognition in mild cognitive impairment. J Alzheimers Dis 47: , 965–975. |
[8] | Bloom GS ((2014) ) Amyloid-beta and tau: The trigger and bullet in Alzheimer disease pathogenesis. JAMA Neurol 71: , 505–508. |
[9] | Cerquera-Jaramillo MA , Nava-Mesa MO , Gonzalez-Reyes RE , Tellez-Conti C , de-la-Torre A ((2018) ) Visual features in Alzheimer’s disease: From basic mechanisms to clinical overview. Neural Plast 2018: , 2941783. |
[10] | Gonzalez-Reyes RE , Nava-Mesa MO , Vargas-Sanchez K , Ariza-Salamanca D , Mora-Munoz L ((2017) ) Involvement of astrocytes in Alzheimer’s disease from a neuroinflammatory and oxidative stress perspective. Front Mol Neurosci 10: , 427. |
[11] | Hou L , Liu Y , Wang X , Ma H , He J , Zhang Y , Yu C , Guan W , Ma Y ((2011) ) The effects of amyloid-beta42 oligomer on the proliferation and activation of astrocytes in vitro. In Vitro Cell Dev Biol Anim 47: , 573–580. |
[12] | Lindberg C , Selenica ML , Westlind-Danielsson A , Schultzberg M ((2005) ) Beta-amyloid protein structure determines the nature of cytokine release from rat microglia. J Mol Neurosci 27: , 1–12. |
[13] | Braak H , Braak E ((1995) ) Staging of Alzheimer’s disease-related neurofibrillary changes. Neurobiol Aging 16: , 271-–278; discussion 278-284. |
[14] | Serrano-Pozo A , Qian J , Muzikansky A , Monsell SE , Montine TJ , Frosch MP , Betensky RA , Hyman BT ((2016) ) Thal amyloid stages do not significantly impact the correlation between neuropathological change and cognition in the Alzheimer disease continuum. J Neuropathol Exp Neurol 75: , 516–526. |
[15] | Braak H , Braak E ((1991) ) Neuropathological stageing of Alzheimer-related changes. Acta Neuropathol 82: , 239–259. |
[16] | Leuba G , Saini K ((1995) ) Pathology of subcortical visual centres in relation to cortical degeneration in Alzheimer’s disease. Neuropathol Appl Neurobiol 21: , 410–422. |
[17] | Lewis DA , Campbell MJ , Terry RD , Morrison JH ((1987) ) Laminar and regional distributions of neurofibrillary tangles and neuritic plaques in Alzheimer’s disease: A quantitative study of visual and auditory cortices. J Neurosci 7: , 1799–1808. |
[18] | Adlington RL , Laws KR , Gale TM ((2009) ) Visual processing in Alzheimer’s disease: Surface detail and colour fail to aid object identification. Neuropsychologia 47: , 2574–2583. |
[19] | Mandal PK , Joshi J , Saharan S ((2012) ) Visuospatial perception: An emerging biomarker for Alzheimer’s disease. J Alzheimers Dis 31: (Suppl 3), S117–135. |
[20] | Kavcic V , Vaughn W , Duffy CJ ((2011) ) Distinct visual motion processing impairments in aging and Alzheimer’s disease. Vision Res 51: , 386–395. |
[21] | Deng Y , Shi L , Lei Y , Liang P , Li K , Chu WC , Wang D , Alzheimer’s Disease Neuroimaging Initiative ((2016) ) Mapping the “what” and “where” visual cortices and their atrophy in Alzheimer’s disease: Combined activation likelihood estimation with voxel-based morphometry. Front Hum Neurosci 10: , 333. |
[22] | Delbeuck X , Van der Linden M , Collette F ((2003) ) Alzheimer’s disease as a disconnection syndrome? Neuropsychol Rev 13: , 79–92. |
[23] | Braak H , Del Trecidi K ((2015) ) Neuroanatomy and pathology of sporadic Alzheimer’s disease. Adv Anat Embryol Cell Biol 215: , 1–162. |
[24] | Alafuzoff I , Arzberger T , Al-Sarraj S , Bodi I , Bogdanovic N , Braak H , Bugiani O , Del-Tredici K , Ferrer I , Gelpi E , Giaccone G , Graeber MB , Ince P , Kamphorst W , King A , Korkolopoulou P , Kovacs GG , Larionov S , Meyronet D , Monoranu C , Parchi P , Patsouris E , Roggendorf W , Seilhean D , Tagliavini F , Stadelmann C , Streichenberger N , Thal DR , Wharton SB , Kretzschmar H ((2008) ) Staging of neurofibrillary pathology in Alzheimer’s disease: A study of the BrainNet Europe Consortium. Brain Pathol 18: , 484–496. |
[25] | Braak H , Del Tredici K ((2018) ) Spreading of tau pathology in sporadic Alzheimer’s disease along cortico-cortical top-down connections. Cereb Cortex 28: , 3372–3384. |
[26] | Ogawa S , Lee TM , Kay AR , Tank DW ((1990) ) Brain magnetic resonance imaging with contrast dependent on blood oxygenation. Proc Natl Acad Sci U S A 87: , 9868–9872. |
[27] | Kwong KK , Belliveau JW , Chesler DA , Goldberg IE , Weisskoff RM , Poncelet BP , Kennedy DN , Hoppel BE , Cohen MS , Turner R ((1992) ) Dynamic magnetic resonance imaging of human brain activity during primary sensory stimulation. Proc Natl Acad Sci U S A 89: , 5675–5679. |
[28] | Logothetis NK ((2008) ) What we can do and what we cannot do with fMRI. Nature 453: , 869–878. |
[29] | Huang J ((2018) ) Human brain functional areas of unitary pooled activity discovered with fMRI. Sci Rep 8: , 2388. |
[30] | Huang J Method and system for determining brain state dependent functional areas of unitary pooled activity and associated dynamic networks with functional magnetic resonance imaging. United States Patent and ™ Office, US-20200069237, Published March 5. |
[31] | Huang J ((2020) ) Dynamic activity of human brain task-specific networks. Sci Rep 10: , 7851. |
[32] | Huang J , Beach P , Bozoki A , Zhu DC ((2020) ) Alzheimer’s disease progressively alters the face-evoked visual-processing network. J Alzheimers Dis 77: , 1025–1042. |
[33] | Kanwisher N , McDermott J , Chun MM ((1997) ) The fusiform face area: A module in human extrastriate cortex specialized for face perception. J Neurosci 17: , 4302–4311. |
[34] | Raichle ME ((2010) ) Two views of brain function. Trends Cogn Sci 14: , 180–190. |
[35] | Biswal B , Yetkin FZ , Haughton VM , Hyde JS ((1995) ) Functional connectivity in the motor cortex of resting human brain using echo-planar MRI. Magn Reson Med 34: , 537–541. |
[36] | Raichle ME ((2011) ) The restless brain. Brain Connect 1: , 3–12. |
[37] | Yeo BT , Krienen FM , Sepulcre J , Sabuncu MR , Lashkari D , Hollinshead M , Roffman JL , Smoller JW , Zollei L , Polimeni JR , Fischl B , Liu H , Buckner RL ((2011) ) The organization of the human cerebral cortex estimated by intrinsic functional connectivity. J Neurophysiol 106: , 1125–1165. |
[38] | Xiong Z , Tian C , Zeng X , Huang J , Wang R ((2020) ) The relationship of functional connectivity of the sensorimotor and visual cortical networks between resting and task states. Front Neurosci 14: , 592720. |
[39] | Huang J ((2019) ) Greater brain activity during the resting state and the control of activation during the performance of tasks. Sci Rep 9: , 5027. |
[40] | Beach PA , Huck JT , Zhu DC , Bozoki AC ((2017) ) Altered behavioral and autonomic pain responses in Alzheimer’s disease are associated with dysfunctional affective, self-reflective and salience network resting-state connectivity. Front Aging Neurosci 9: , 297. |
[41] | American Psychiatric Association ((2013) ) Diagnostic and Statistical Manual of Mental Disorders, 5th Edition. American Psychiatric Association, Washington, DC. |
[42] | McKhann G , Drachman D , Folstein M , Katzman R , Price D , Stadlan EM ((1984) ) Clinical diagnosis of Alzheimer’s disease: Report of the NINCDS-ADRDA Work Group under the auspices of Department of Health and Human Services Task Force on Alzheimer’s Disease. Neurology 34: , 939–944. |
[43] | Folstein MF , Folstein SE , McHugh PR ((1975) ) “Mini-Mental State”: A practical method for grading the cognitive state of patients for the clinician. J Psychiatr Res 12: , 189–198. |
[44] | Alexopoulos GS , Abrams RC , Young RC , Shamoian CA ((1988) ) Cornell Scale for Depression in Dementia. Biol Psychiatry 23: , 271–284. |
[45] | Beach PA , Huck JT , Miranda MM , Foley KT , Bozoki AC ((2016) ) Effects of Alzheimer disease on the facial expression of pain. Clin J Pain 32: , 478–487. |
[46] | Beach PA , Huck JT , Miranda MM , Bozoki AC ((2015) ) Autonomic, behavioral, and subjective pain responses in Alzheimer’s disease. Pain Med 16: , 1930–1942. |
[47] | Cox RW ((1996) ) AFNI: Software for analysis and visualization of functional magnetic resonance neuroimages. Comput Biomed Res 29: , 162–173. |
[48] | Friston K , Holmes A , Worsley K , Poline J-B , Frith C , Frackowiak R ((1995) ) Statistical parametric maps in functional imaging: A general linear approach. Hum Brain Mapp 2: , 189–210. |
[49] | Worsley KJ Statistical analysis of activation images. In Functional MRI: An Introduction to Methods, Jezzard P, Matthews PM, Smith SM, eds. Oxford University Press, New York, USA, pp. 251–270. |
[50] | Brun A , Gustafson L ((1976) ) Distribution of cerebral degeneration in Alzheimer’s disease. A clinico-pathological study. Arch Psychiatr Nervenkr (1970) 223: , 15–33. |
[51] | Arnold SE , Hyman BT , Flory J , Damasio AR , Van Hoesen GW ((1991) ) The topographical and neuroanatomical distribution of neurofibrillary tangles and neuritic plaques in the cerebral cortex of patients with Alzheimer’s disease. Cereb Cortex 1: , 103–116. |
[52] | Albers MW , Gilmore GC , Kaye J , Murphy C , Wingfield A , Bennett DA , Boxer AL , Buchman AS , Cruickshanks KJ , Devanand DP , Duffy CJ , Gall CM , Gates GA , Granholm AC , Hensch T , Holtzer R , Hyman BT , Lin FR , McKee AC , Morris JC , Petersen RC , Silbert LC , Struble RG , Trojanowski JQ , Verghese J , Wilson DA , Xu S , Zhang LI ((2015) ) At the interface of sensory and motor dysfunctions and Alzheimer’s disease. Alzheimers Dement 11: , 70–98. |
[53] | Cho H , Choi JY , Hwang MS , Kim YJ , Lee HM , Lee HS , Lee JH , Ryu YH , Lee MS , Lyoo CH ((2016) ) In vivo cortical spreading pattern of tau and amyloid in the Alzheimer disease spectrum. Ann Neurol 80: , 247–258. |
[54] | Mograbi DC , Brown RG , Morris RG ((2009) ) Anosognosia in Alzheimer’s disease–the petrified self. Conscious Cogn 18: , 989–1003. |
[55] | Weiler M , Northoff G , Damasceno BP , Balthazar MLF ((2016) ) Self, cortical midline structures and the resting state: Implications for Alzheimer’s disease. Neurosci Biobehav Rev 68: , 245–255. |
[56] | Beckmann CF , DeLuca M , Devlin JT , Smith SM ((2005) ) Investigations into resting-state connectivity using independent component analysis. Philos Trans R Soc Lond B Biol Sci 360: , 1001–1013. |


