
Dysregulation of Insulin-Linked Metabolic Pathways in Alzheimer’s Disease: Co-Factor Role of Apolipoprotein E ɛ4
Abstract
Background:
Brain insulin resistance and deficiency are well-recognized abnormalities in Alzheimer’s disease (AD) and likely mediators of impaired energy metabolism. Since apolipoprotein E (APOE) is a major risk factor for late-onset AD, it was of interest to examine its potential contribution to altered insulin-linked signaling networks in the brain.
Objective:
The main goal was to evaluate the independent and interactive contributions of AD severity and APOE ɛ4 dose on brain expression of insulin-related polypeptides and inflammatory mediators of metabolic dysfunction.
Methods:
Postmortem fresh frozen frontal lobe tissue from banked cases with known APOE genotypes and different AD Braak stages were used to measure insulin network polypeptide immunoreactivity with a commercial multiplex enzyme-linked immunosorbent assay (ELISA).
Results:
Significant AD Braak stage and APOE genotype-related abnormalities in insulin, C-peptide, gastric inhibitory polypeptide (GIP), glucaton-like peptide-1 (GLP-1), leptin, ghrelin, glucagon, resistin, and plasminogen activator inhibitor-1 (PAI-1) were detected. The main factors inhibiting polypeptide expression and promoting neuro-inflammatory responses included AD Braak stage and APOE ɛ4/ɛ4 rather than ɛ3/ɛ4.
Conclusion:
This study demonstrates an expanded role for impaired expression of insulin-related network polypeptides as well as neuroinflammatory mediators of brain insulin resistance in AD pathogenesis and progression. In addition, the findings show that APOE has independent and additive effects on these aberrations in brain polypeptide expression, but the impact is decidedly greater for APOE ɛ4/ɛ4 than ɛ3/ɛ4.
INTRODUCTION
Growing evidence supports the concept that Alz-heimer’s disease (AD) is mechanistically linked to impairments in brain energy metabolism [1] marked by reduced glucose uptake and utilization from pre-symptomatic stages of disease [2]. Furthermore, in the prospective Baltimore Longitudinal Study, impairments in brain glucose uptake were correlated with reduced expression of the glucose transporter 3 (GLUT3) and subsequent development of AD [3]. Since glucose uptake and utilization in the brain and neuronal cells are stimulated by insulin [4–7], insulin deficiency or insulin resistance could dysregulate energy metabolism and contribute to the pathogenesis of AD [8–10]. Besides regulating energy metabolism, insulin stimulates working memory, cognition [11–14], and neuronal plasticity, and its receptors are abundantly expressed in brain regions that are most susceptible to AD-type neurodegeneration [15, 16]. Correspondingly, experimental inhibition of insulin-related signaling networks causes neurodegeneration with AD features [17–19]. Altogether, these findings point to dysregulation of insulin signaling networks as a fundamental mediator of neurodegeneration.
Human postmortem [9, 20] and clinical [10, 21, 22] studies have demonstrated brain insulin deficiency and insulin resistance in AD. Insulin deficiency is mainly manifested by reduced insulin levels in brain and cerebrospinal fluid (CSF), whereas insulin resistance is associated with reduced expression, tyrosine phosphorylation, and binding of the insulin receptor, activation of insulin receptor substrate downstream signaling through phosphoinositol-3-kinase (PI3K)-Akt pathways, and brain glucose levels [9, 16, 20, 23]. Disruption of these insulin-related networks adversely impacts neuronal survival, oligodendrocyte function, neuronal plasticity, and energy metabolism, and promotes neuro-inflammation, oxi-dative, nitrosative, and endoplasmic reticular stress, lipid peroxidation and cell death [8, 24–26]. In addition, impairments in brain insulin signaling have been linked to increased tau phosphorylation and amyloid-β 1–42 (Aβ1–42) accumulation/toxicity [20, 25, 27–29]. Therefore, apart from the specific AD-associated outcomes, the molecular, biochemical, and cytopathological consequences of insulin deficiency/resistance in the brain closely resemble those that occur in diabetes mellitus and other insulin resistance diseases [8, 30].
The steadily increasing prevalence of AD over the past several decades and across all age groups [31] indicates that factors other than genetics can mediate AD neurodegeneration. Furthermore, the parallel increases in rates of diabetes mellitus and other insulin resistant states, the higher rates of cognitive impairment and AD in people with obesity or type 2 diabetes mellitus [31], and the increased risk of developing mild cognitive impairment (MCI) or AD in non-obese, non-diabetic people with elevated blood glucose [32, 33] suggest the drivers and mechanisms of peripheral insulin resistance and AD may be shared. Another way to consider the problem is that perhaps insulin resistant disease states are fundamentally related but differentially manifested due to variation in tissues, organs and systems targeted. For example, atherosclerosis is a single pathologic process that causes different diseases based on compromised flow through specific arteries. If AD is truly one of the progressive insulin resistance/insulin deficiency diseases in which the brain is selective or prominently involved, then therapeutic interventions developed for other related diseases may be extendable to AD. Already this concept has some validity since cognitive impairment in MCI and AD are positively responsive to intranasal insulin, insulin sensitizers, incretins, and lifestyle modifications that enhance insulin responsiveness [8, 11, 14, 34–38]. Furthermore, intranasal insulin has been shown in humans to increase brain energy, including levels of ATP and phosphocreatine using 31-P magnetic resonance spectroscopy to assess cerebral energy metabolism [39]. To delve deeper into the overarching question concerning insulin network dysfunction versus insulin resistance/deficiency as mediators of neurodegeneration, in this study we measured broad indices of insulin-regulated metabolic integrity in postmortem frontal cortex samples from controls and AD human subjects. The primary objective was to assess the presence and characteristics of central nervous system (CNS) dysregulated metabolic networks.
This study examined the contributions of both Braak stage histopathological grade of AD and apolipoprotein E (APOE) genotype on frontal cortex expression of insulin-related polypeptides in postmortem human brains using a commercial multiplex gut hormone panel. Previously, we used this approach to demonstrate insulin-related metabolic abnormalities in CSF and serum from patients with MCI or AD [40–43]. Furthermore, this study extends earlier work characterizing AD grade and APOE genotype (ɛ3/ɛ3, ɛ3/ɛ4, ɛ4/ɛ4) effects on brain expression of insulin degrading enzyme (IDE) and regulator of calcineurin 1 (RCAN1) [44]. That study demonstrated AD severity and APOE ɛ4 dose-dependent reductions in IDE and increases in RCAN1 expression. Those findings are relevant to the present study because IDE is a 110 kD thiol zinc metalloendopeptidase that degrades insulin and other small polypeptides including atrial natriuretic peptide, transforming growth factor-alpha, amylin, bradykinin, kallidin and Aβ, and RCAN1 inhibits calcineurin causing increased glycogen synthase kinase 3β activation with attendant hyperphosphorylation of tau and neurofibrillary tangle formation. The present work broadens the analysis of dysregulated brain metabolic networks and the co-factor role of APOE4 dose as mediators of neurodegeneration in the pathogenesis of AD.
METHODS
Human subjects
Human postmortem fresh frozen frontal cortex samples from Brodmann Area 8/9 were provided by the Duke Kathleen Price Bryan Brain Bank and Biorepository (Durham, NC). The standardized brain banking protocol ensures storage of high-quality tissue for molecular and biochemical analyses and systematic review by neuropathologists to assign diagnoses and disease stage. In addition, all cases were APOE genotyped [ɛ3/ɛ3, ɛ3/ɛ4, ɛ4/ɛ4] (https://neurology.duke.edu/research/research-centers/joseph-and-kathleen-bryan-alzheimers-disease-research-center/brain-bank). However, apart from standard demographics, case de-identification precludes detai-led correlative analysis of clinical data in relation to research findings. For this project, we obtained 72 fresh frozen brain samples from men and women who were grouped based on their Braak stage scores for AD severity (Braak 0–2; B0–2 = normal aging; B3–4 = moderate AD; B5–6 = severe or advanced AD) and APOE genotypes. The Lifespan Hospitals Institutional Review Board (IRB) approved the use of human postmortem de-identified brains for this research.
Multiplex human gut hormone enzyme-linked immunosorbent assay (ELISA)
For these studies, we used a Human Gut Hormone 10-Plex ™ Assay (Bio-Rad, Hercules, CA), which is based on a magnetic bead-based format for simultaneously measuring immunoreactivity to insulin, C-peptide, gastric inhibitory polypeptide (GIP), glucagon-like peptide-1 (GLP-1), leptin, ghrelin, glucagon, resistin, plasminogen activator inhibitor-1 (PAI-1), and visfatin in tissue homogenates. This assay was utilized to investigate a fuller spectrum of potential polypeptide abnormalities that could contribute to impairments in energy balance within the CNS (Table 1). The assays were performed in accordance with the manufacturer’s protocol. In brief, captured antigens were detected with biotinylated secondary antibodies followed by a streptavidin-phycoery-thrin reporter conjugate. Fluorescence intensity was measured in a MAGPIX (Bio-Rad, Hercules, CA) and hormone concentrations (pg/mL) were determined from standard curves using MAGPIX software.
Table 1
Insulin-Related Metabolic Peptides and Their Functions
| Polypeptide | Functions |
| Insulin | Reduces blood glucose; regulates metabolism by increasing cell permeability to monosaccharides, amino acids and fatty acids; accelerates the pentose phosphate cycle and glycogen synthesis in the liver. |
| C-peptide: Connecting peptide | Stable by-product of pro-insulin cleavage to generate insulin; mediates efficient assembly, folding, and processing of insulin in the ER. |
| GIP1: Gastric inhibitory polypeptide | Potent stimulator of insulin secretion; stimulates lipoprotein lipase; modulates fatty acid metabolism; poor inhibitor of gastric acid secretion |
| GLP-1: Glucagon-like peptide-1 | Potent stimulator of glucose-dependent insulin release; stimulates glucose disposal, independent insulin actions; suppresses plasma glucagon; modulates gastric motility; may suppress satiety; promotes growth of intestinal epithelium. neuroprotective. |
| Leptin | Critical regulator of energy balance by inhibiting food intake and promoting energy expenditure; helps regulate fat depots. |
| Ghrelin | Ligand for growth hormone secretagogue receptor type 1; induces growth hormone release from the pituitary-regulates growth; stimulates appetite; induces adiposity; stimulates gastric acid secretion. |
| Glucagon | Regulates glucose metabolism and homeostasis by increasing gluconeogenesis and decreasing glycolysis and counterregulatory to insulin; raises plasma glucose in response to insulin-induced hypoglycemia; initiates and maintains hyperglycemic conditions in diabetes mellitus. |
| Resistin | Promotes insulin resistance; suppresses insulin-stimulated glucose uptake in adipocytes; potentially links obesity to diabetes; increases hepatic production of LDL and degradation of LDL receptors, increasing risk of cardiovascular disease; promotes cytokine inflammatory responses and DNA transcription. |
| PAI-1: Plasminogen activator inhibitor-1 | Serine protease inhibitor that acts as a ‘bait’ for tissue plasminogen activator, urokinase, protein C and matriptase-3/TMPRSS7; regulates fibrinolysis. |
| Visfatin | Increases insulin sensitivity; promotes cytokine activation. However, more typically known to regulate circadian clock functions, promotes B-cell maturation, and inhibits neutrophil apoptosis. |
Statistics
Results are graphed using scatter plots to depict median (horizontal bars) and within-group and between-group variability. Inter-group statistical comparisons were made by repeated measures two-way ANOVA tests with 1% false discovery corrections and post-hoc Tukey tests (GraphPad Prism 8 software, San Diego, CA). Statistical significance was defined as p < 0.05. Statistical trend was defined as 0.05 < p<0.10.
RESULTS
Study groups
Among the 72 cases evaluated, 38 were genotyped as APOE ɛ3/ɛ3, 25 as APOE ɛ3/ɛ4, and 9 as APOE ɛ4/ɛ4 (Table 2). The gender distributions were balanced across APOE genotypes, except for APOE ɛ3/ɛ4 which had 30% more males than females with B3–4 AD, and 2.5 times as many females as males with B5–6 AD. Mean ages ranged from 72 to 84 years within each subgroup. There were no significant differences in mean age among the sub-groups, except for APOE ɛ3/ɛ4, B0–2 controls which were significantly younger than the corresponding AD groups (p < 0.05), but not APOE ɛ3/ɛ3 controls. None of the B0–2 controls had an APOE ɛ4/ɛ4 genotype. Post-hoc inter-group statistical comparisons made with respect to APOE ɛ3/ɛ3 B0–2 controls are depicted in the figures, while all inter-group significant differences and trends are listed in Tables 3–11.
Table 2
Human Subject Groups: Apolipoprotein E (APOE) Genotype and Braak Stage Severity of AD
| Genotype | Braak Stage AD | # Cases | Age (Mean±S.D.) | Sex |
| APOE ɛ3/ɛ3 | 0–2 | 18 | 78.33±11.16 | 9 M; 9 F |
| 3–4 | 14 | 81.57±6.81 | 6 M; 8 F | |
| 5–6 | 6 | 84.01±2.45 | 3 M; 3 F | |
| APOE ɛ3/ɛ4 | 0–2 | 3 | 72.33±14.15 | 2 M; 1 F |
| 3–4 | 15 | 84.13±4.02 | 9 M; 6 F | |
| 5–6 | 7 | 83.71±5.47 | 2 M; 5 F | |
| APOE ɛ4/ɛ4 | 0–2 | 0 | ||
| 3–4 | 3 | 84.03±3.60 | 2 M; 1 F | |
| 5–6 | 6 | 81.11±4.47 | 3 M; 3 F |
Fresh frozen frontal cortex samples from 72 de-identified banked brains with known APOE genotypes were studied. The B0–2 APOE ɛ3/ɛ4 cases were significantly younger than the B3–4 and B5–6 AD APOE ɛ3/ɛ4 cases (p < 0.05). There were no control subjects with an APOE ɛ4/ɛ4 genotype.
Table 3
INSULIN: Two-way ANOVA Results
| Control | APOE | Braak Stage | APOE AD | p |
| B0–2 | ɛ3/ɛ3 | B5–6 | ɛ3/ɛ3 | p = 0.01 |
| B0–2 | ɛ3/ɛ3 | B3–4 | ɛ4/ɛ4 | p = 0.004 |
| B0–2 | ɛ3/ɛ3 | B5–6 | ɛ4/ɛ4 | p = 0.01 |
| B0–2 | ɛ3/ɛ4 | B5–6 | ɛ3/ɛ3 | p = 0.001 |
| B0–2 | ɛ3/ɛ4 | B3–4 | ɛ4/ɛ4 | p = 0.0005 |
| B0–2 | ɛ3/ɛ4 | B5–6 | ɛ4/ɛ4 | p = 0.001 |
| Alzheimer | APOE | Braak Stage | APOE AD | p |
| B3–4 | ɛ3/ɛ3 | B3–4 | ɛ4/ɛ4 | p = 0.004 |
| B3–4 | ɛ3/ɛ3 | B5–6 | ɛ3/ɛ3 | p = 0.01 |
| B3–4 | ɛ3/ɛ3 | B5–6 | ɛ4/ɛ4 | p = 0.01 |
| B3–4 | ɛ3/ɛ4 | B3–4 | ɛ4/ɛ4 | p = 0.0003 |
| B3–4 | ɛ3/ɛ4 | B5–6 | ɛ3/ɛ3 | p = 0.0006 |
| B3–4 | ɛ3/ɛ4 | B5–6 | ɛ4/ɛ4 | p = 0.0006 |
| B3–4 | ɛ4/ɛ4 | B5–6 | ɛ3/ɛ4 | p = 0.03 |
| B5–6 | ɛ3/ɛ3 | B5–6 | ɛ3/ɛ4 | p = 0.01 |
| B5–6 | ɛ3/ɛ4 | B5–6 | ɛ4/ɛ4 | p = 0.01 |
Table 4
C-PEPTIDE: Two-way ANOVA Results
| Control | APOE | Braak Stage | APOE AD | p |
| B0–2 | ɛ3/ɛ3 | B5–6 | ɛ3/ɛ3 | p = 0.06 |
| B0–2 | ɛ3/ɛ3 | B3–4 | ɛ4/ɛ4 | p = 0.001 |
| B0–2 | ɛ3/ɛ3 | B5–6 | ɛ4/ɛ4 | p = 0.006 |
| B0–2 | ɛ3/ɛ4 | B3–4 | ɛ4/ɛ4 | p = 0.03 |
| Alzheimer | APOE | Braak Stage | APOE AD | p |
| B3–4 | ɛ3/ɛ3 | B3–4 | ɛ4/ɛ4 | p = 0.018 |
| B3–4 | ɛ3/ɛ4 | B3–4 | ɛ4/ɛ4 | p = 0.03 |
| B3–4 | ɛ4/ɛ4 | B5–6 | ɛ3/ɛ3 | p = 0.07 |
| B3–4 | ɛ4/ɛ4 | B5–6 | ɛ3/ɛ4 | p = 0.002 |
| B5–6 | ɛ3/ɛ4 | B5–B6 | ɛ4/ɛ4 | p = 0.01 |
Table 5
GIP-1 Two-way ANOVA Results
| Control | APOE | Braak Stage | APOE AD | p |
| B0–2 | ɛ3/ɛ3 | B5–6 | ɛ3/ɛ3 | p = 0.006 |
| B0–2 | ɛ3/ɛ3 | B3–4 | ɛ4/ɛ4 | p = 0.01 |
| B0–2 | ɛ3/ɛ3 | B5–6 | ɛ4/ɛ4 | p = 0.01 |
| B0–2 | ɛ3/ɛ4 | B3–4 | ɛ4/ɛ4 | p = 0.008 |
| B0–2 | ɛ3/ɛ4 | B5–6 | ɛ3/ɛ3 | p = 0.005 |
| B0–2 | ɛ3/ɛ4 | B5–6 | ɛ4/ɛ4 | p = 0.009 |
| Alzheimer | APOE | Braak Stage | APOE AD | p |
| B3–4 | ɛ3/ɛ4 | B3–4 | ɛ4/ɛ4 | p = 0.004 |
| B3–4 | ɛ3/ɛ4 | B5–6 | ɛ3/ɛ3 | p = 0.0009 |
| B3–4 | ɛ3/ɛ4 | B5–6 | ɛ4/ɛ4 | p = 0.003 |
| B3–4 | ɛ4/ɛ4 | B5–6 | ɛ3/ɛ4 | p = 0.08 |
| B5–6 | ɛ3/ɛ3 | B5–6 | ɛ3/ɛ4 | p = 0.07 |
Table 6
GLP-1 Two-way ANOVA Results
| Control | APOE | Braak Stage | APOE AD | p |
| B0–2 | ɛ3/ɛ3 | B3–4 | ɛ4/ɛ4 | p = 0.002 |
| B0–2 | ɛ3/ɛ3 | B5–6 | ɛ3/ɛ3 | p = 0.07 |
| B0–2 | ɛ3/ɛ3 | B5–6 | ɛ4/ɛ4 | p = 0.0006 |
| B0–2 | ɛ3/ɛ4 | B3–4 | ɛ4/ɛ4 | p = 0.03 |
| B0–2 | ɛ3/ɛ4 | B5–6 | ɛ4/ɛ4 | p = 0.03 |
| Alzheimer | APOE | Braak Stage | APOE AD | p |
| B3–4 | ɛ3/ɛ3 | B3–4 | ɛ4/ɛ4 | p = 0.018 |
| B3–4 | ɛ3/ɛ3 | B5–6 | ɛ4/ɛ4 | p = 0.01 |
| B3–4 | ɛ3/ɛ4 | B3–4 | ɛ4/ɛ4 | p = 0.004 |
| B3–4 | ɛ3/ɛ4 | B5–6 | ɛ4/ɛ4 | p = 0.002 |
| B3–4 | ɛ4/ɛ4 | B5–6 | ɛ3/ɛ4 | p = 0.002 |
| B5–6 | ɛ3/ɛ4 | B5–6 | ɛ4/ɛ4 | p = 0.0008 |
Table 7
LEPTIN Two-way ANOVA Results
| Control | APOE | Braak Stage | APOE AD | p |
| B0–2 | ɛ3/ɛ3 | B0–2 | ɛ3/ɛ4 | p < 0.0001 |
| B0–2 | ɛ3/ɛ3 | B0–2 | ɛ4/ɛ4 | p < 0.0001 |
| B0–2 | ɛ3/ɛ3 | B3–4 | ɛ3/ɛ3 | p < 0.0001 |
| B0–2 | ɛ3/ɛ3 | B3–4 | ɛ3/ɛ4 | p < 0.0001 |
| B0–2 | ɛ3/ɛ3 | B3–4 | ɛ4/ɛ4 | p < 0.0001 |
| B0–2 | ɛ3/ɛ3 | B5–6 | ɛ3/ɛ3 | p < 0.0001 |
| B0–2 | ɛ3/ɛ3 | B5–6 | ɛ3/ɛ4 | p < 0.0001 |
| B0–2 | ɛ3/ɛ3 | B5–6 | ɛ4/ɛ4 | p < 0.0001 |
| B0–2 | ɛ3/ɛ4 | B3–4 | ɛ3/ɛ4 | p = 0.047 |
| B0–2 | ɛ3/ɛ4 | B5–6 | ɛ3/ɛ3 | p = 0.02 |
| Alzheimer | APOE | Braak Stage | APOE AD | p |
| B3–4 | ɛ3/ɛ3 | B5–6 | ɛ3/ɛ3 | p = 0.02 |
| B5–6 | ɛ3/ɛ3 | B5–6 | ɛ3/ɛ4 | p = 0.07 |
Table 8
GHRELIN Two-way ANOVA Results
| Control | APOE | Braak Stage | APOE AD | p |
| B0–2 | ɛ3/ɛ3 | B3–4 | ɛ4/ɛ4 | p = 0.002 |
| B0–2 | ɛ3/ɛ3 | B5–6 | ɛ4/ɛ4 | p = 0.03 |
| B0–2 | ɛ3/ɛ4 | B3–4 | ɛ4/ɛ4 | p = 0.001 |
| B0–2 | ɛ3/ɛ4 | B5–6 | ɛ4/ɛ4 | p = 0.016 |
| Alzheimer | APOE | Braak Stage | APOE AD | p |
| B3–4 | ɛ3/ɛ3 | B3–4 | ɛ4/ɛ4 | p = 0.002 |
| B3–4 | ɛ3/ɛ3 | B5–6 | ɛ4/ɛ4 | p = 0.04 |
| B3–4 | ɛ3/ɛ4 | B3–4 | ɛ4/ɛ4 | p = 0.0005 |
| B3–4 | ɛ3/ɛ4 | B5–6 | ɛ4/ɛ4 | p = 0.008 |
| B3–4 | ɛ4/ɛ4 | B5–6 | ɛ3/ɛ3 | p = 0.014 |
| B3–4 | ɛ4/ɛ4 | B5–6 | ɛ3/ɛ4 | p = 0.0007 |
| B5–6 | ɛ3/ɛ4 | B5–6 | ɛ4/ɛ4 | p = 0.01 |
130665419 case# claim: ACH 3–5.
Table 9
GLUCAGON Two-way ANOVA Results
| Control | APOE | Braak Stage | APOE AD | p |
| B0–2 | ɛ3/ɛ3 | B5–6 | ɛ3/ɛ3 | p = 0.09 |
| B0–2 | ɛ3/ɛ3 | B3–4 | ɛ4/ɛ4 | p = 0.0007 |
| B0–2 | ɛ3/ɛ3 | B5–6 | ɛ4/ɛ4 | p = 0.009 |
| B0–2 | ɛ3/ɛ4 | B3–4 | ɛ4/ɛ4 | p = 0.009 |
| B0–2 | ɛ3/ɛ4 | B5–6 | ɛ4/ɛ4 | p = 0.08 |
| Alzheimer | APOE | Braak Stage | APOE AD | p |
| B3–4 | ɛ3/ɛ3 | B3–4 | ɛ4/ɛ4 | p = 0.002 |
| B3–4 | ɛ3/ɛ3 | B5–6 | ɛ4/ɛ4 | p = 0.02 |
| B3–4 | ɛ3/ɛ4 | B5–6 | ɛ3/ɛ3 | p = 0.06 |
| B3–4 | ɛ3/ɛ4 | B3–4 | ɛ4/ɛ4 | p = 0.0004 |
| B3–4 | ɛ3/ɛ4 | B5–6 | ɛ4/ɛ4 | p = 0.005 |
| B3–4 | ɛ4/ɛ4 | B5–6 | ɛ3/ɛ3 | p = 0.03 |
| B3–4 | ɛ4/ɛ4 | B5–6 | ɛ3/ɛ4 | p = 0.0007 |
| B5–6 | ɛ3/ɛ3 | B5–6 | ɛ3/ɛ4 | p = 0.09 |
| B5–6 | ɛ3/ɛ4 | B5–6 | ɛ4/ɛ4 | p = 0.009 |
Table 10
RESISTIN Two-way ANOVA Results
| Control | APOE | Braak Stage | APOE AD | p |
| B0–2 | ɛ3/ɛ3 | B3–4 | ɛ4/ɛ4 | p = 0.01 |
| B0–2 | ɛ3/ɛ3 | B5–6 | ɛ3/ɛ3 | p = 0.003 |
| B0–2 | ɛ3/ɛ4 | B3–4 | ɛ3/ɛ4 | p = 0.029 |
| Alzheimer | APOE | Braak Stage | APOE AD | p |
| B3–4 | ɛ3/ɛ3 | B3–4 | ɛ3/ɛ4 | p = 0.006 |
| B3–4 | ɛ3/ɛ4 | B3–4 | ɛ4/ɛ4 | p = 0.0004 |
| B3–4 | ɛ3/ɛ4 | B5–6 | ɛ3/ɛ3 | p < 0.0001 |
| B3–4 | ɛ3/ɛ4 | B5–6 | ɛ3/ɛ4 | p = 0.009 |
| B3–4 | ɛ3/ɛ4 | B5–6 | ɛ4/ɛ4 | p = 0.006 |
| B5–6 | ɛ3/ɛ3 | B5–6 | ɛ3/ɛ4 | p = 0.09 |
Table 11
PAI-1 Two-way ANOVA Results
| Control | APOE | Braak Stage | APOE AD | p |
| B0–2 | ɛ3/ɛ3 | B0–2 | ɛ3/ɛ4 | p = 0.008 |
| B0–2 | ɛ3/ɛ3 | B3–4 | ɛ3/ɛ3 | p = 0.01 |
| B0–2 | ɛ3/ɛ3 | B3–4 | ɛ3/ɛ4 | p = 0.036 |
| B0–2 | ɛ3/ɛ3 | B5–6 | ɛ3/ɛ3 | p = 0.008 |
| B0–2 | ɛ3/ɛ3 | B5–6 | ɛ3/ɛ4 | p = 0.08 |
| B0–2 | ɛ3/ɛ3 | B5–6 | ɛ4/ɛ4 | p = 0.003 |
| B0–2 | ɛ3/ɛ4 | B3–4 | ɛ4/ɛ4 | p = 0.025 |
| Alzheimer | APOE | Braak Stage | APOE AD | p |
| B3–4 | ɛ3/ɛ3 | B3–4 | ɛ4/ɛ4 | p = 0.048 |
| B3–4 | ɛ4/ɛ4 | B5–6 | ɛ3/ɛ3 | p = 0.036 |
| B3–4 | ɛ4/ɛ4 | B5–6 | ɛ4/ɛ4 | p = 0.018 |
Insulin
Insulin promotes glucose uptake into cells, de-creasing its concentrations in peripheral blood (Table 1). Two-way ANOVA revealed significant effects of Braak stage AD severity (F = 8.78; p =0.0007), APOE genotype (F = 7.27; p = 0.002), and interactions between AD severity and APOE (F =2.83; p = 0.036). Post hoc multiple comparison tests revealed significant reductions in frontal cortex insulin immunoreactivity in B5–6 APOE ɛ3/ɛ3, and both B3–4 and B5–6 APOE ɛ4/ɛ4 relative to B0–2 APOE ɛ3/ɛ3 (Fig. 1A) and B0–2 APOE ɛ3/ɛ4 controls (Table 3). In addition, post hoc testing revealed significant inhibitory effects of APOE ɛ4 dose and AD severity on brain insulin expression, and within B5–6, APOE dose-dependent inhibition of insulin expression (Table 3).
Fig. 1
Insulin and C-Peptide: A commercial magnetic bead-based multiplex ELISA was used to measure A) insulin and B) C-peptide immunoreactivity in 72 human postmortem frontal cortical tissue from patients with established APOE genotypes (APOE ɛ3/ɛ3; APOE ɛ3/ɛ4; APOE ɛ4/ɛ4). Standardized formalin fixed paraffin-embedded histological sections were used to assign Braak stage (B) severities of AD: B0–2 corresponds to normal aging; B3–4 represents moderate AD; B5–6 is severe AD. The graphs depict the mean±S.E.M. levels (pg/mL) of immunoreactivity. Two-way ANOVA with post-hoc Tukey multiple comparison tests were used for intergroup comparisons. *p < 0.05; **p < 0.01; ***p < 0.005; ****p < 0.0001 relative to B0–2 APOE ɛ3/ɛ3 controls. Other significant inter-group differences are provided in Tables 3 and 4.
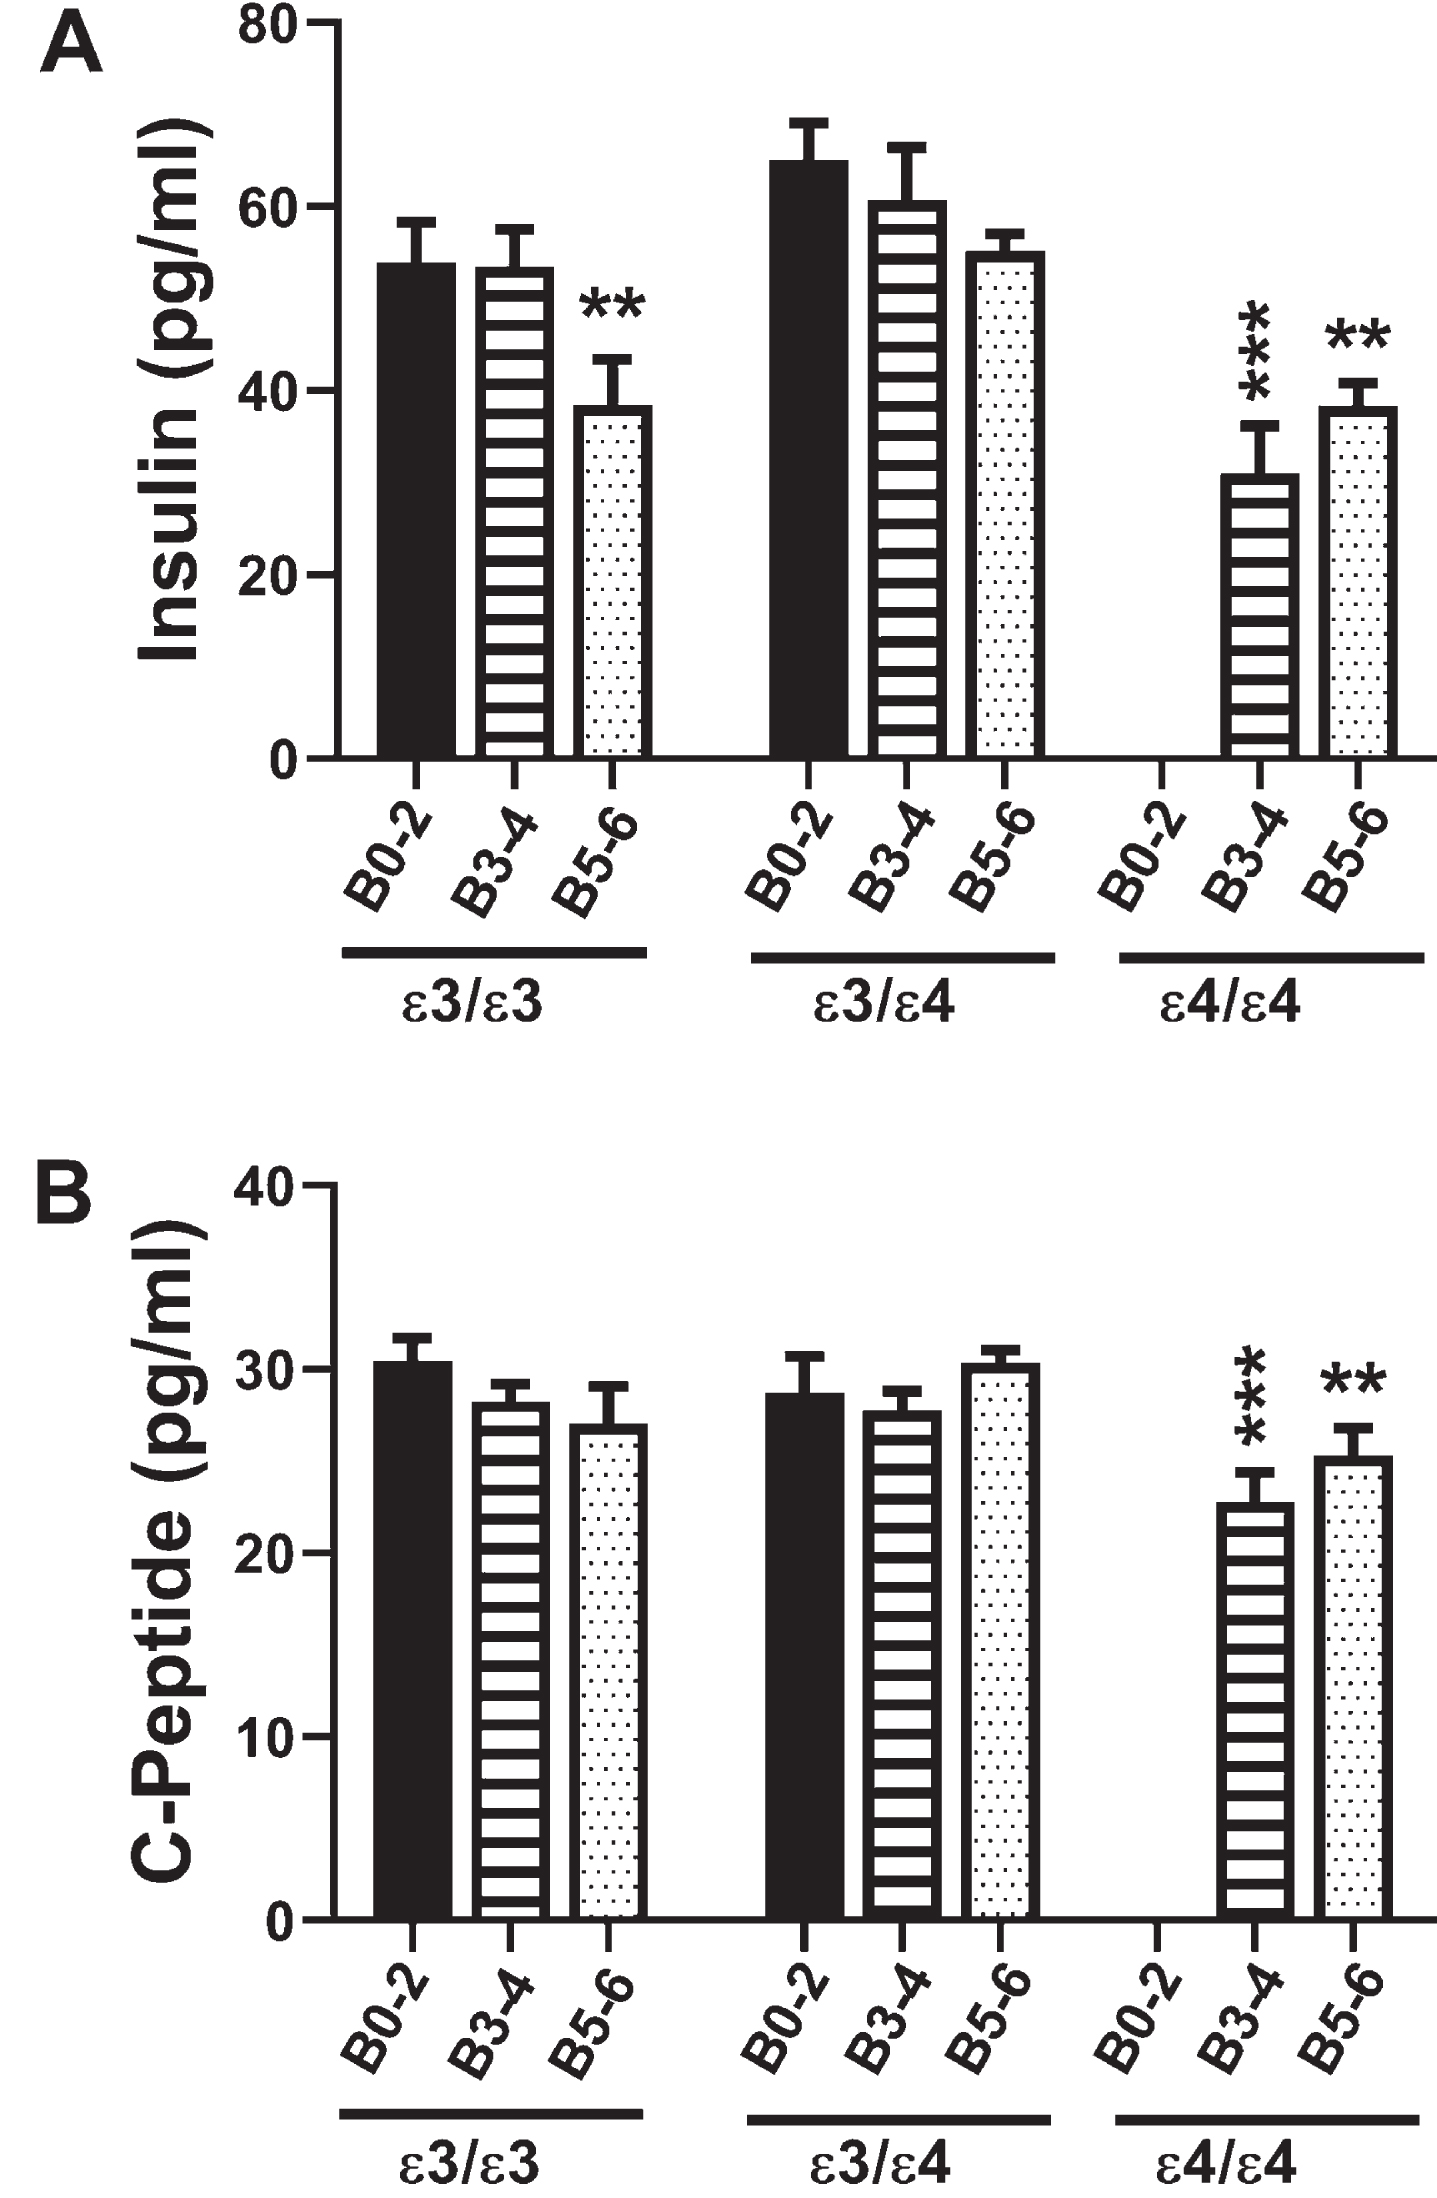
C-peptide
C-peptide is a component of pro-insulin that is co-generated with insulin upon cleavage of the precursor protein (Table 1). Due to its stability, C-peptide is often used to gauge insulin concentration and insulin resistance over time along with current glucose levels in peripheral blood. Two-way ANOVA demonstrated significant effects of APOE genotype (F = 3.76; p = 0.03) and a trend effect for AD severity (F = 2.76; p = 0.07) on C-peptide expression. Post hoc multiple comparisons testing demonstrated trend reductions in C-peptide in B5–6 APOE ɛ3/ɛ3 relative to corresponding controls (Table 4), and significant reductions in C-peptide in both B3–4 and B5–6 APOE ɛ4/ɛ4 relative to B0–2 APOE ɛ3/ɛ3 (Fig. 1B), and B3–4 APOE ɛ4/ɛ4 versus B3–4 APOE ɛ3/ɛ4, i.e., an APOE dose effect (Fig. 1B and Table 4). These findings partially mimicked the insulin responses and demonstrated that APOE ɛ4 dose and Braak stage severity of AD had significant inhibitory effects on C-peptide expression in the brain.
Gastric inhibitory peptide 1 (GIP-1)
GIP-1 is an incretin with potent stimulatory effects on insulin secretion and a modulator of fatty acid metabolism (Table 1). Two-way ANOVA revealed significant effects of AD Braak stage (F = 8.0; p = 0.001) and APOE genotype (F = 3.94; p = 0.026), but no significant AD×APOE interactions. The major response observed with respect to APOE ɛ3/ɛ3 were progressive declines in GIP-1 with AD severity, resulting in significantly reduced GIP-1 in B5–6 compared with B0–2 (Fig. 2A). For APOE ɛ3/ɛ4, although the trends followed those of APOE ɛ3/ɛ3, the differences between B5–6 and B0–2 did not reach statistical significance. AD, AD severity, and APOE4 dose all significantly inhibited GIP-1 expression relative to APOE ɛ3/ɛ3 and APOE ɛ3/ɛ4 controls (Table 5).
Fig. 2
Incretins (GIP-1 and GLP-1): A multiplex ELISA measured A) GIP and B) GLP-1 immunoreactivity in 72 postmortem human frontal cortex samples from patients with established APOE genotypes (APOE ɛ3/ɛ3; APOE ɛ3/ɛ4; APOE ɛ4/ɛ4). Routine histological studies were used to grade Braak stage (B) severities of AD: B0–2 corresponds to normal aging; B3–4 represents moderate AD; B5–6 is severe AD. Graphs depict the mean±S.E.M. levels (pg/mL) of immunoreactivity. Two-way ANOVA with post-hoc Tukey multiple comparison tests were used for intergroup comparisons. **p < 0.01l ***p < 0.005; ****p < 0.0001 relative to B0–2 APOE ɛ3/ɛ3 controls. Other significant inter-group differences are provided in Tables 5 and 6.
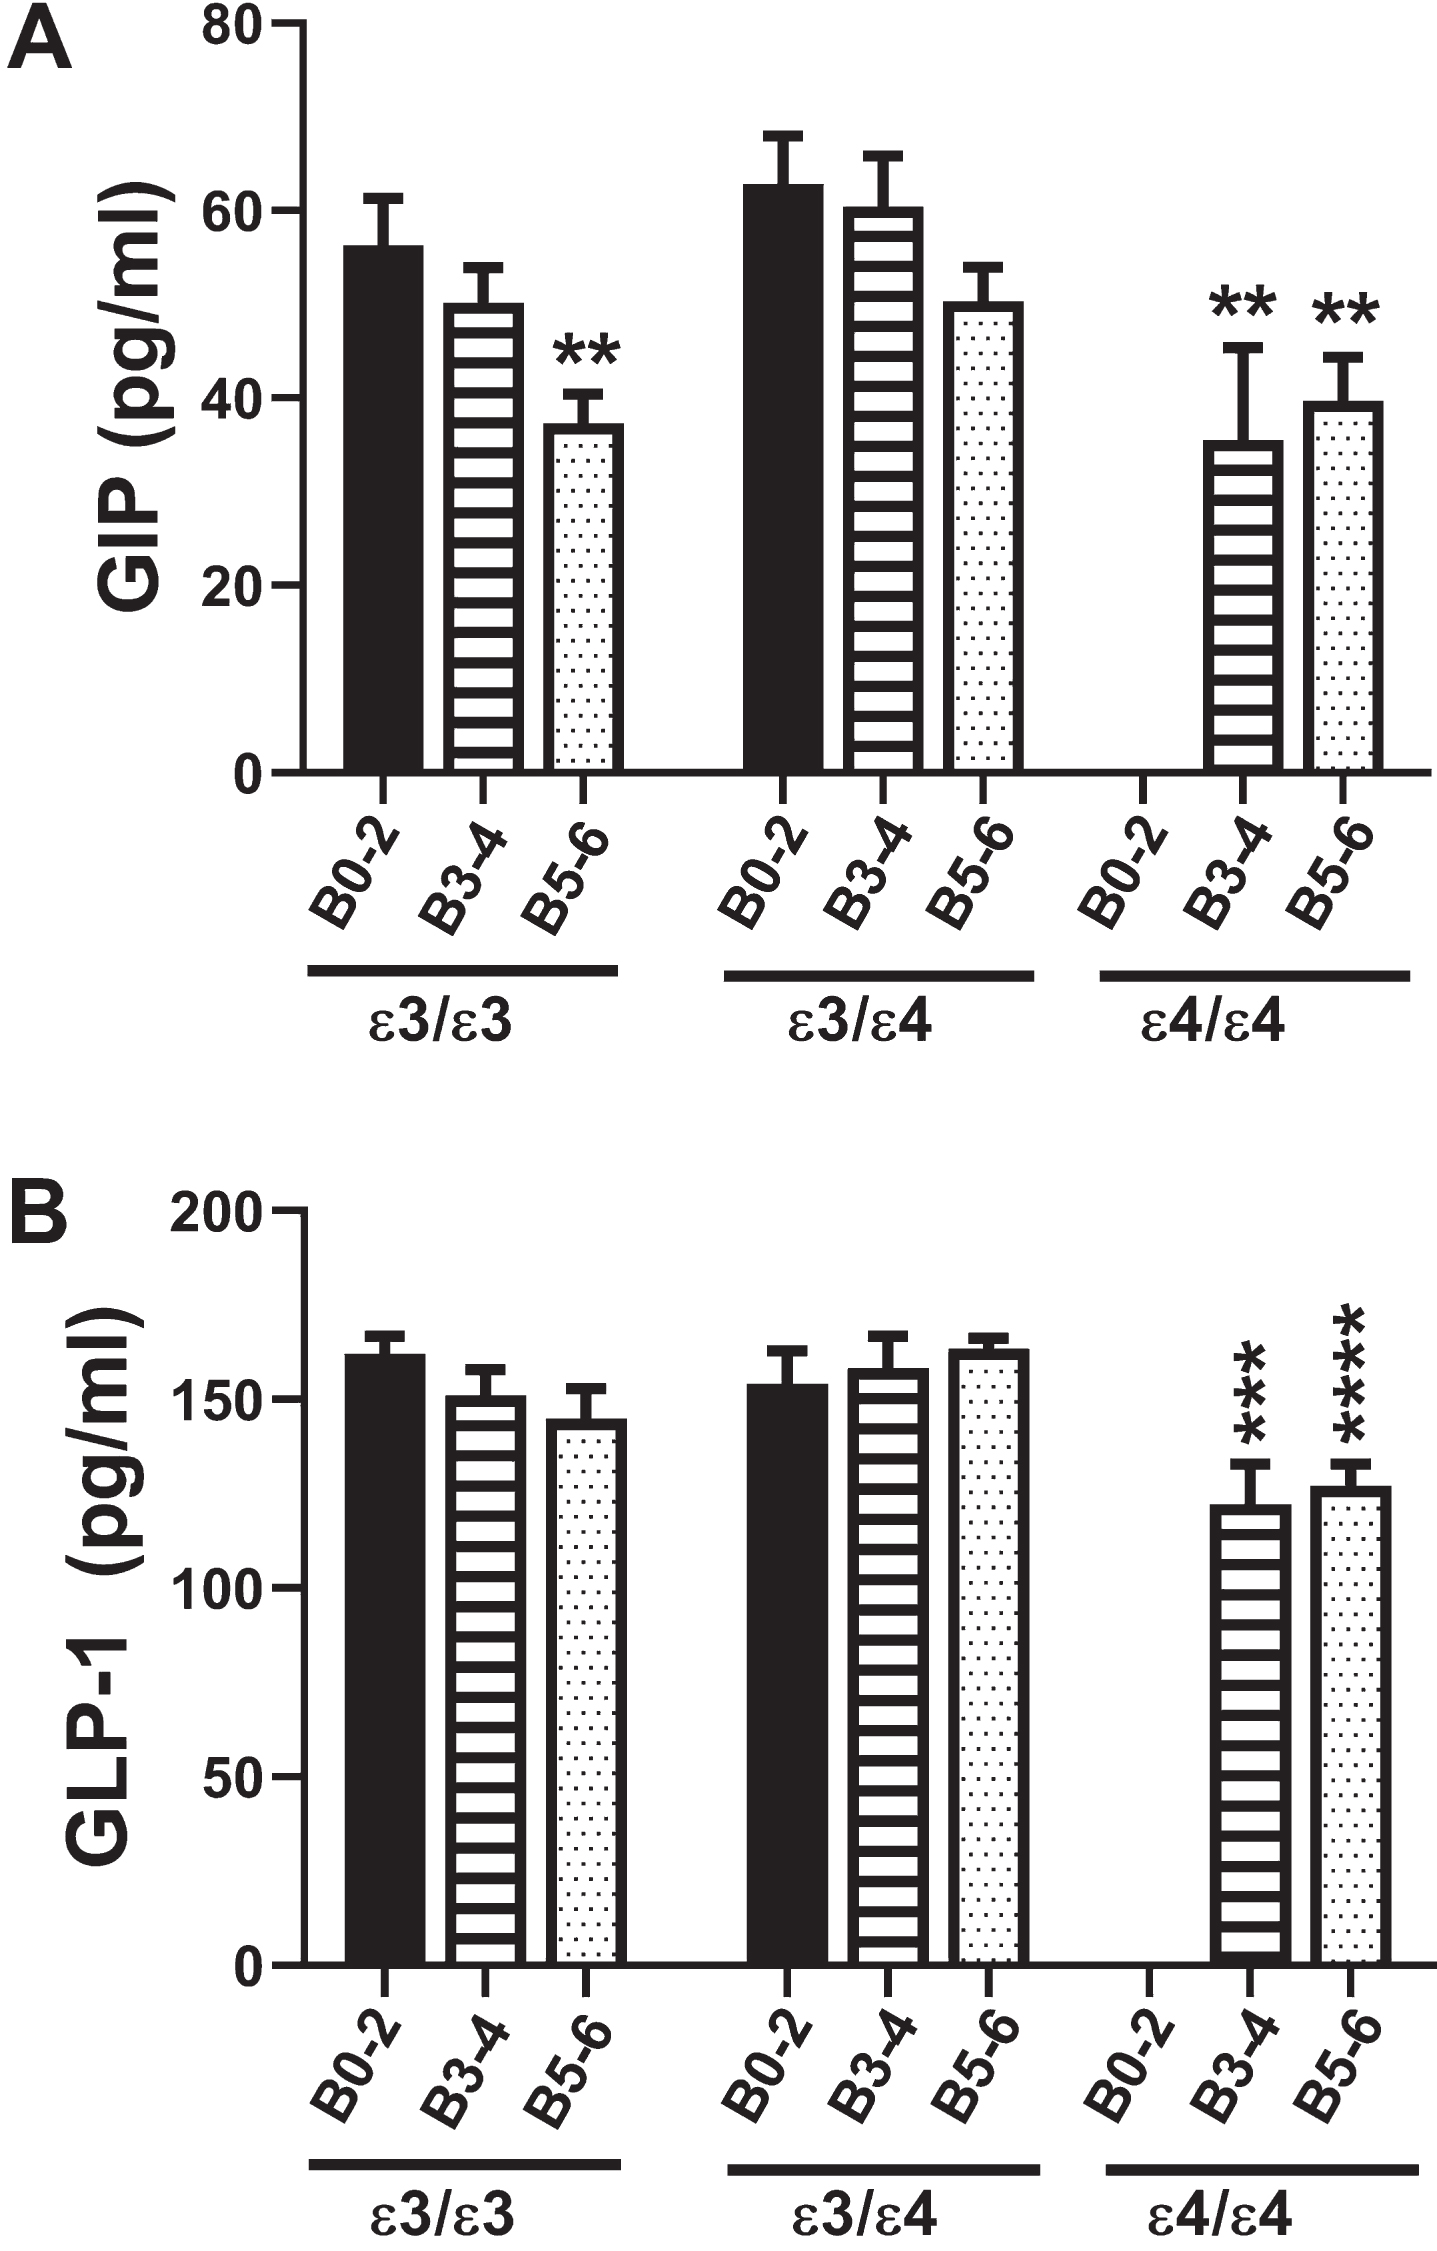
Glucagon-like peptide 1 (GLP-1)
The GLP-1 incretin has potent stimulatory effects on glucose-dependent insulin release leading to increased glucose disposal and suppression of plasma glucagon (Table 1). Two-way ANOVA demonstrated significant effects of APOE genotype (F = 6.34; p = 0.004) but not AD severity or AD×APOE interactions. Figure 2B clearly depicts how GLP-1 was modulated with APOE dose in AD. The main effects were that GLP-1 expression was significantly reduced in B3–4 and B5–6 APOE ɛ4/ɛ4 relative to B0–2 and B3–4 APOE ɛ3/ɛ3 and APOE ɛ3/ɛ4. In addition, GLP-1 expression was significantly lower in B5–6 APOE ɛ4/ɛ4 than in B5–6 APOE ɛ3/ɛ4, reflecting an inhibitory impact of APOE4 dose (Table 6).
Leptin
Leptin inhibits food intake and promotes energy expenditure (Table 1). Two-way ANOVA revealed significant effects of AD Braak stage (F = 19.84; p < 0001), APOE (F = 7.19; p = 0.002), and Braak stage×APOE interactions (F = 9.0; p < 0.0001). As shown in Fig. 3A, the mean frontal lobe levels of leptin were significantly reduced in all groups relative to B0–2 APOE ɛ3/ɛ3 (p < 0.0001) (also see Table 7). In addition, within the APOE ɛ3/ɛ3, Leptin expression was lower in B5–6 than B3–4 (p = 0.02) reflecting an AD Braak stage severity effect.
Fig. 3
Leptin and Ghrelin: A multiplex ELISA was used to measure A) leptin and B) ghrelin immunoreactivity in 72 postmortem human frontal cortex samples from patients with known APOE genotypes (APOE ɛ3/ɛ3; APOE ɛ3/ɛ4; APOE ɛ4/ɛ4). Formalin fixed paraffin-embedded histological sections were used to assign Braak stage (B) severities of AD: B0–2 corresponds to normal aging; B3–4 represents moderate AD; B5–6 is severe AD. The graphs depict the mean±S.E.M. levels (pg/mL) of immunoreactivity. Two-way ANOVA with post-hoc Tukey multiple comparison tests were used for intergroup comparisons. ***p < 0.005; ****p < 0.0001 relative to B0–2 APOE ɛ3/ɛ3 controls. Other significant inter-group differences are provided in Tables 7 and 8.
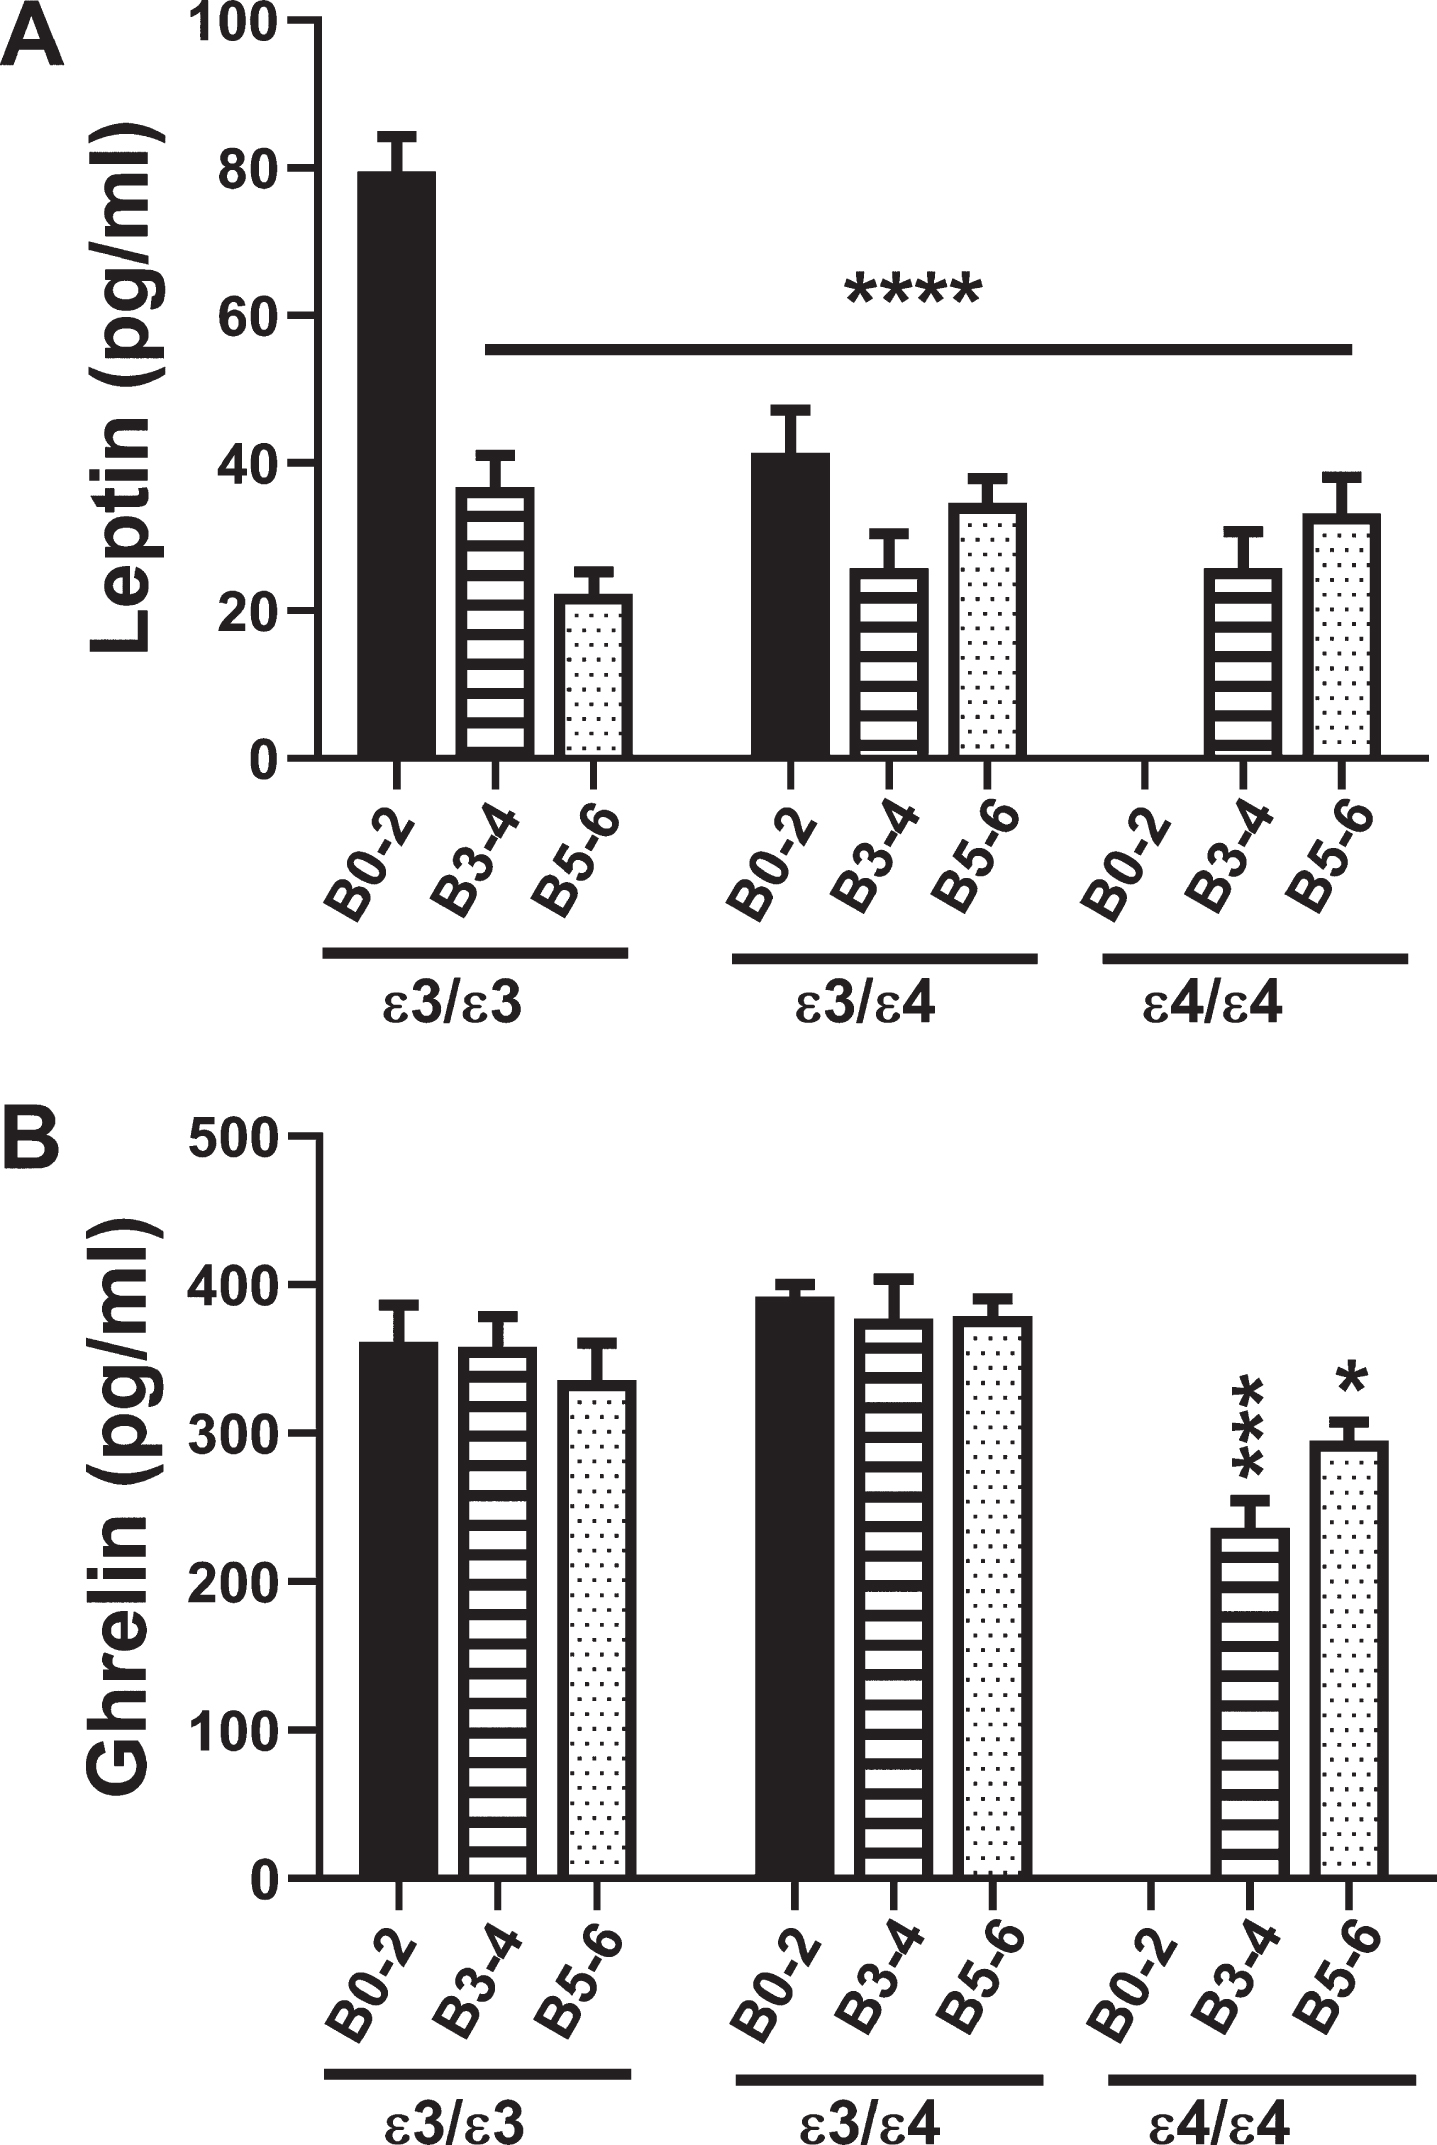
Ghrelin
Ghrelin increases food intake and reduces energy expenditure, opposing the actions of leptin (Table 1). Two-way ANOVA demonstrated significant effects of Braak stage (F = 3.9; p = 0.02) and APOE (F = 5.74; p = 0.006), and trend effects of Braak stage×APOE (F = 2.25; p = 0.08). Figure 3B and Table 8 show the main effects of AD severity and APOE4 dose, namely that ghrelin expression was significantly reduced in B3–4 and B5–6 APOE ɛ4/ɛ4 relative to B0–2 and B3–4 APOE ɛ3/ɛ3 and APOE ɛ3/ɛ4. Furthermore, the negative impact of APOE4 dose is shown by the lower levels of ghrelin in B3–4 and B5–6 APOE ɛ4/ɛ4 relative to B3–4 and B5–6 APOE ɛ3/ɛ3 or APOE ɛ3/ɛ4 (Table 8).
Glucagon
Glucagon mediates gluconeogenesis, raising blood glucose levels and opposing the actions of insulin. Two-way ANOVA showed that the main significant effect was APOE genotype (F = 6.3; p = 0.004). Post hoc Tukey tests demonstrated a trend reduction in brain glucagon levels in B5–6 APOE ɛ3/ɛ3 relative to B0–2 APOE ɛ3/ɛ3, and significant reductions in B3–4 and B5–6 APOE ɛ4/ɛ4 relative to B0–2 APOE ɛ3/ɛ3 (p = 0.0007 and p = 0.009, respectively) (Fig. 4A, Table 9). Similarly, brain glucagon expression was lower in B3–4 APOE ɛ4/ɛ4 than in B0–2 APOE ɛ3/ɛ4 (p = 0.009), reflecting an AD effect, and lower in B3–4 and B5–6 APOE ɛ4/ɛ4 than in APOE ɛ3/ɛ3 and APOE ɛ3/ɛ4 with the same Braak stage severities of AD, reflecting an APOE dose effect.
Fig. 4
Glucagon and Resistin: A commercial multiplex ELISA was used to measure A) glucagon and B) resistin immunoreactivity in 72 human postmortem frontal cortex tissue samples from patients with known APOE genotypes (APOE ɛ3/ɛ3; APOE ɛ3/ɛ4; APOE ɛ4/ɛ4). Standardized formalin fixed paraffin-embedded histological sections were used to assign Braak stage (B) severities of AD: B0–2 represents normal aging; B3–4 represents moderate AD; B5–6 is severe AD. The graphs depict the mean±S.E.M. levels (pg/mL) of immunoreactivity. Two-way ANOVA with post-hoc Tukey multiple comparison tests were used for intergroup comparisons. *p < 0.05; **p < 0.01; ***p < 0.005; ****p < 0.0001 relative to B0–2 APOE ɛ3/ɛ3 controls. Other significant inter-group differences are provided in Tables 9 and 10.
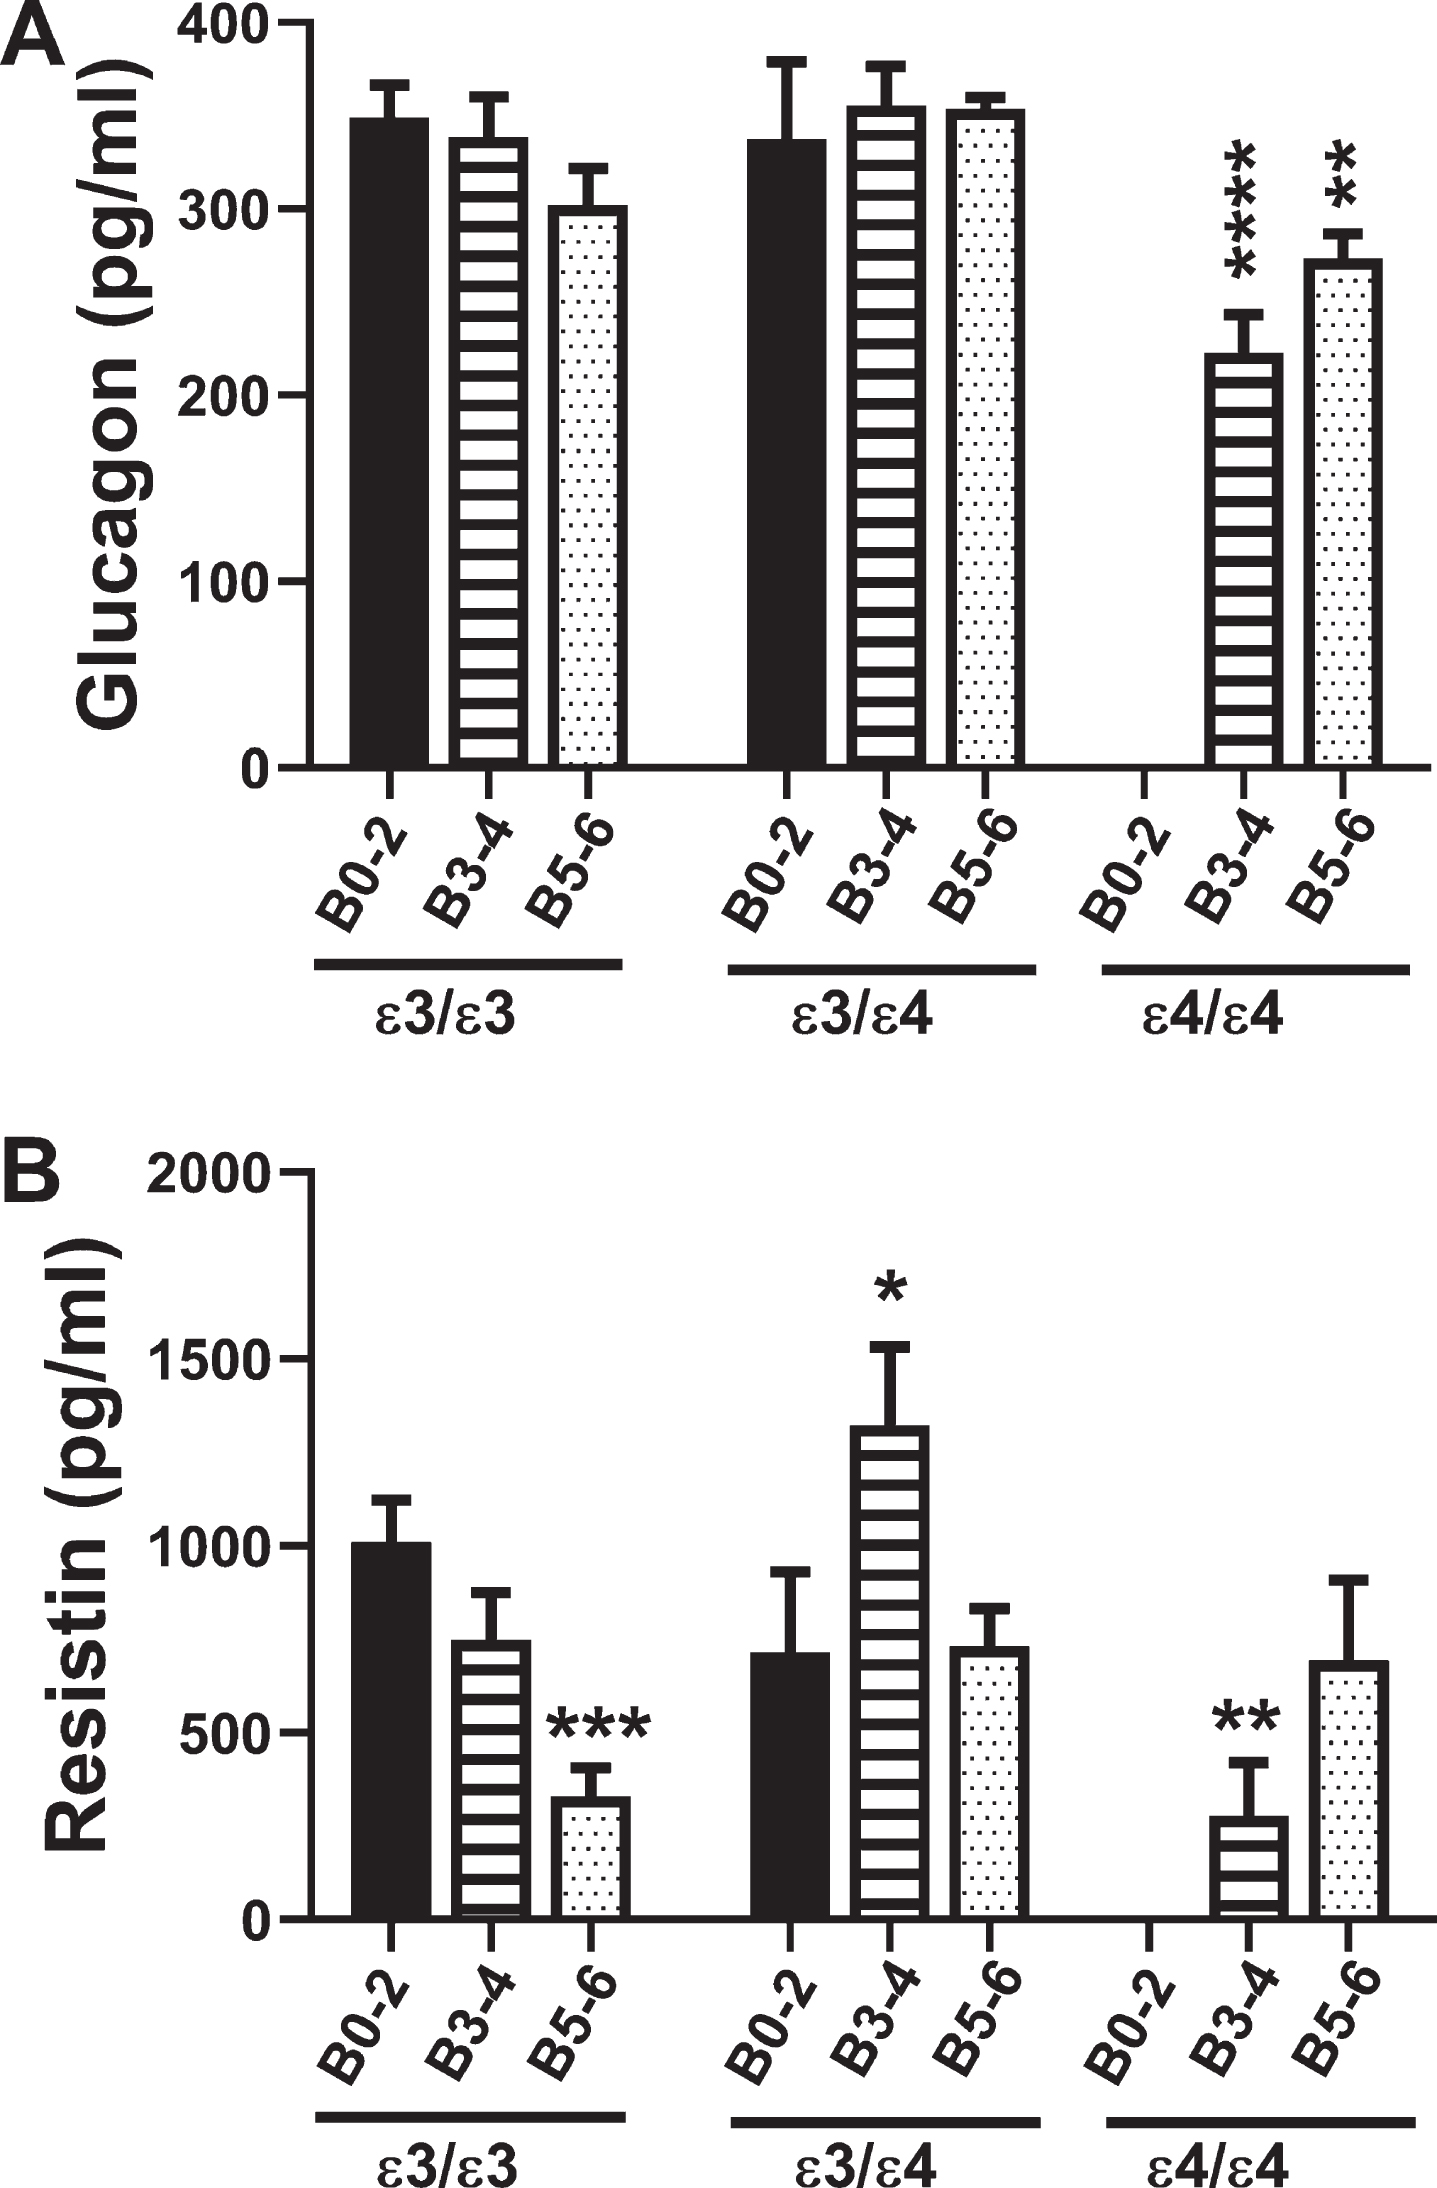
Resistin
Resistin promotes insulin resistance by suppressing insulin-stimulated glucose uptake into adiopo-cytes (Table 1). Two-way ANOVA demonstrated significant AD Braak stage×APOE interactive effects (F = 3.83; p < 0.01) and a trend effect for APOE (F = 2.74; p = 0.08). For APOE ɛ3/ɛ3, resistin expression declined with increasing AD Braak stage resulting in significantly reduced levels in B5–6 relative to B0–2 (p = 0.003) (Fig. 4B, Table 10). In addition, resistin expression was significantly reduced in B3–4 APOE ɛ4/ɛ4 relative to B0–2 APOE ɛ3/ɛ3 (p = 0.01) (Fig. 4B, Table 10). B3–4 APOE ɛ3/ɛ4 had sharply elevated levels of resistin compared with all other groups (Fig. 4B), accounting for many of the significant differences detected (Table 10).
Plasminogen activator inhibitor-1 (PAI-1)
PAI-1 is a multi-functional serine protease inhi-bitor that regulates fibrinolysis, and therefore, may be critical for preventing vascular occlusions and ischemic injury (Table 1). Two-way ANOVA demonstrated significant AD Braak stage×APOE effects (F = 4.28; p = 0.005). In contrast to polypeptides that modulate insulin or insulin-related actions, PAI-1 expression in cases with an APOE ɛ3/ɛ3 genotype was elevated in B3–4 (p = 0.01) and B5–6; p = 0.008) relative to B0–2. In addition, the levels in B0–2 and B3–4 with an APOE ɛ3/ɛ4 genotype, and B5–6 with an APOE ɛ4/ɛ4 genotype were elevated compared with B0–2 APOE ɛ3/ɛ3 (Fig. 5A, Table 11), reflecting AD stage and APOE genotype effects. For APOE ɛ3/ɛ3 and APOE ɛ3/ɛ4, PAI-1 expression was similarly elevated by B3–4 and B5–6, whereas for APOE ɛ4/ɛ4, PAI-1 was significantly higher in B5–6 than B3–4, reflecting AD x APOE4 dose interactive effects on PAI-1 expression.
Fig. 5
PAI-1 and Visfatin: A multiplex ELISA platform was used to measure PAI-1 and Visfatin in human postmortem frontal cortex tissue from AD and aged control banked cases. Standardized formalin-fixed, paraffin-embedded histological sections were use to stratify Braak stage (B) severity of AD: B0–2 (normal aging), B3–4 (moderate AD), or B5–6 (severe AD). All 72 cases included in the study had known APOE genotypes (APOE ɛ3/ɛ3; APOE ɛ3/ɛ4; APOE ɛ4/ɛ4). Graphs depict the mean±S.E.M. levels (pg/mL) of immunoreactivity. Two-way ANOVA with post-hoc Tukey tests were used for intergroup comparisons. *p < 0.05 and **p < 0.01 relative to B0–2 APOE ɛ3/ɛ3 controls. Other significant inter-group differences are provided in Table 11.
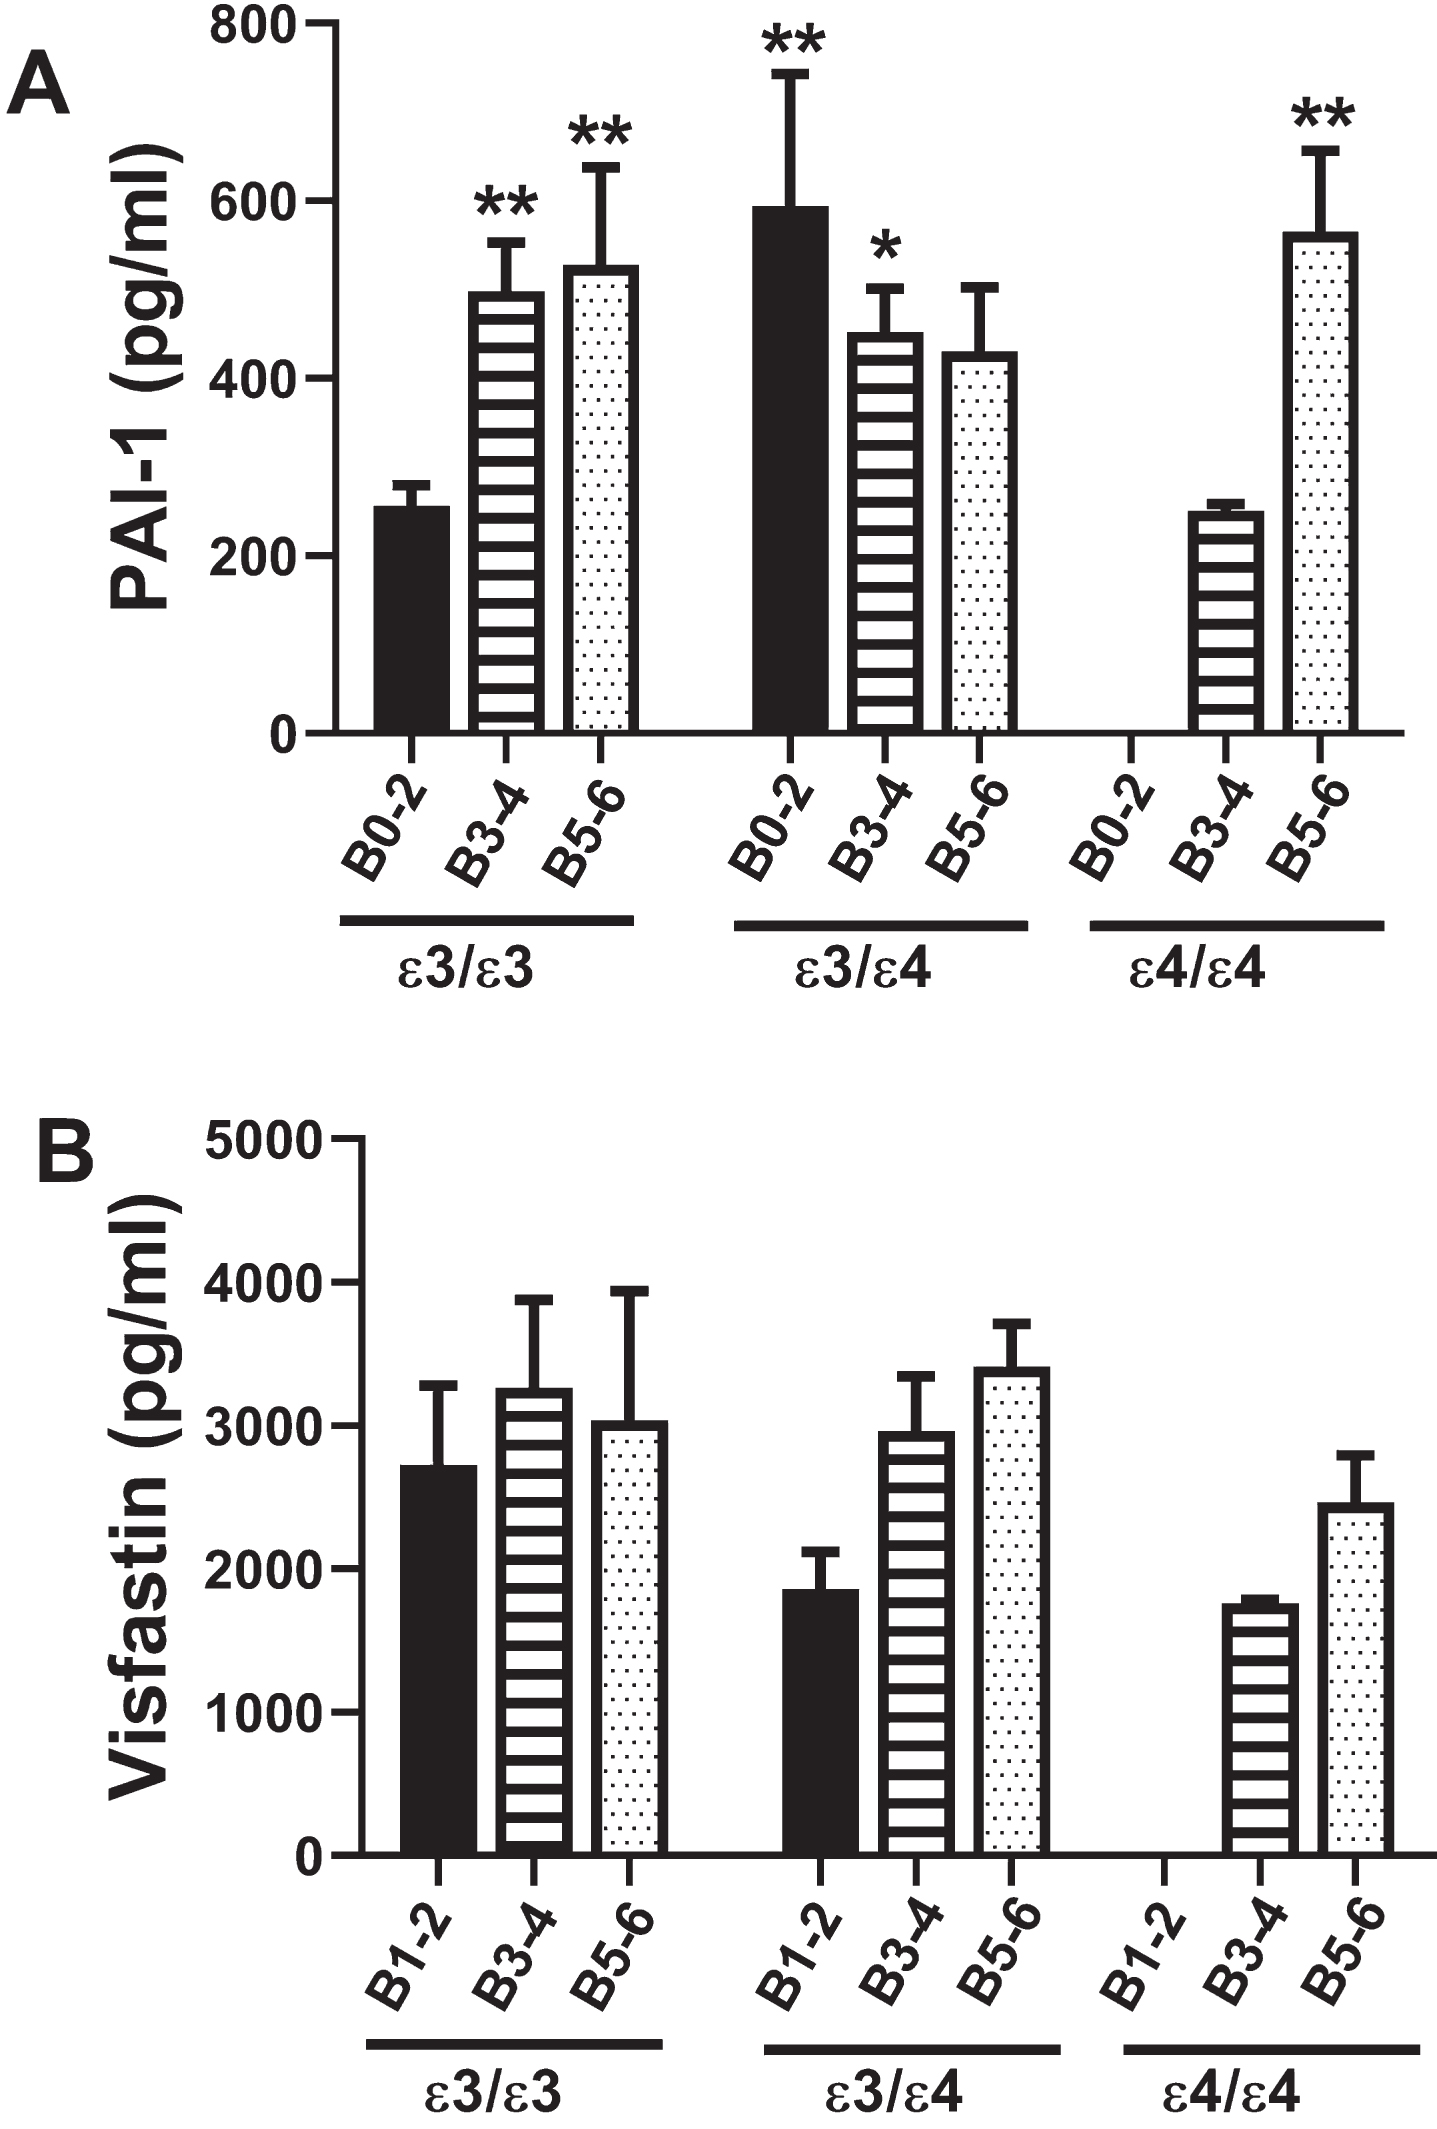
Visfatin
Visfatin is a peripheral blood adipokine that like PAI-1, impacts vascular function and ultimately tissue perfusion. Visfatin promotes vascular smooth muscle cell maturation and has insulin-mimetic effects that improve insulin sensitivity (Table 1). Two-way ANOVA demonstrated no statistically significant effects of APOE, AD Braak stage severity, or APOE x AD interactions. Correspondingly, post hoc Tukey tests were negative (Fig. 5B).
DISCUSSION
This study utilized human postmortem brains to examine the independent and interactive relationships between AD severity and APOE4 on frontal lobe expression of insulin-related polypeptides and inflammatory mediators that impact insulin responsiveness. The premise was that, although impairments in insulin expression and signaling have been solidly linked to many aspects of AD pathogenesis and progression, growing evidence suggests that the entire network mediating insulin-related metabolic functions is impaired. The significance of this concept is that more than one target should be considered for effective disease remediation. This work builds on our prior investigations that demonstrated significant and early AD-associated abnormalities in CSF and serum levels of insulin-related polypeptides [40–43], and interactive effects of APOE and AD severity on IDE and RCAN1 expression in the brain [44].
ApoE, a 34 kDa protein, has three major isoforms (e2, e3, e4) that differ by single amino acid substitutions at residues 112 and 158 [45]. The inclusion of APOE genotype as a variable in these analyses was prompted by the facts that: 1) the ɛ4 allele is the strongest genetic risk factor for late onset sporadic AD [46]; 2) ɛ4 carriers account for over 50% of AD cases [47]; 3) AD risk is increased by 3- or 4-fold among ɛ4 carriers and 15-fold in homozygous individuals (ɛ4/ɛ4); and 4) besides its role in Aβ accumulation, APOE4 is associated with reduced brain glucose metabolism in the pre-clinical stages of disease [48], ultimately impairing signal transduction through the insulin receptor with attendant reduction of Aβ clearance and increased Aβ aggregation [49]. In addition, APOE ɛ4’s contribution to AD pathogenesis is likely linked to the associated impairments in synaptic plasticity mediated by alterations in endocytic recycling [50]. The mechanism may involve the inhibition of Reelin signaling through APOE and attendant regulation of N-methyl-D-aspartate (NMDA) receptor activity, stabilization of microtubules, and prevention of neurofibrillary tangle-associated tau hyperphosphorylation [51].
Although it is not known how APOE4 impairs insulin signaling, the mechanism may involve alterations in cholesterol homeostasis since APOE is an important regulator of cholesterol synthesis and receptor-mediated uptake [52], and previous studies showed that alterations in neuronal membrane cholesterol content lead to impaired insulin signaling and glucose uptake [53]. Correspondingly, experimental over-loading of neuronal membranes with cholesterol increases amyloid-β protein precursor (AβPP) internalization and Aβ generation [54]. In addition to its roles in lipoprotein metabolism, synaptic maintenance, and clearance of Aβ, the low-density lipoprotein receptor-related protein 1 (LRP1) ApoE receptor interacts with the insulin receptor beta subunit and regulates insulin-mediated signaling and glucose uptake [55]. Therefore, APOE4-associated reduction in brain LRP1 expression [56] is an important potential mechanistic link between APOE4 genotype and brain insulin resistance in AD. Furthermore, the finding that hyperglycemia also suppresses LRP1 expression and further exacerbates insulin resistance, glucose intolerance, and AD pathology [55] helps link diabetes mellitus to AD-type neurodegeneration [8, 57]. Due to its adverse effects on energy metabolism and insulin signaling [58], we hypothesized that APOE4 exacerbates AD-associated impairments in insulin-regulated functions in a dose-dependent manner.
This study included postmortem brain specimens from 72 men and women with histopathological diagnoses of normal aging or very early AD (B0–2), moderate AD (B3–4), or severe AD (B5–6), with an APOE ɛ3/ɛ3, ɛ3/ɛ4, or ɛ4/ɛ4 genotype. There were no normal aged brains from APOE ɛ4/ɛ4 cases, perhaps due to the strong propensity for such individuals to have developed AD by the time they reach 70–90 years of age. It is also noteworthy that a skewed percentage of the APOE ɛ4/ɛ4 cases had B5–6 AD whereas those with an APOE ɛ3/ɛ3 or ɛ3/ɛ4 genotype predominantly (68% or 70%) had B3–4 stage AD. One limitation of this study was the lack or APOE ɛ4/ɛ4 controls for comparison with AD cases of the same genotype. Nonetheless, using two-way ANOVA tests with post hoc comparisons it was possible to ascertain APOE ɛ4 dose effect in relation to AD severity.
Insulin decreases blood glucose, increases cell permeability to monosaccharides, and accelerates glycolysis, the pentose phosphate cycle, and glycogen synthesis. The decline in brain insulin with increasing severity of AD in the APOE ɛ3/ɛ3 group corresponds with previous observations made without knowledge of APOE status [16, 20, 41]. The absence of an APOE ɛ3/ɛ4 effect suggests that APOE4 carrier status does not adversely impact brain insulin expression. In contrast, homozygous APOE ɛ4/ɛ4 was associated with significantly reduced brain insulin expression such that the mean levels in B3–4 and B5–6 were comparable to that measured in B5–6 APOE ɛ3/ɛ3. Therefore, APOE ɛ4/ɛ4 was associated with earlier Braak stage reductions in brain insulin expression, suggesting that a contribution to AD neurodegeneration is exacerbation of brain metabolic dysfunction via insulin deficiency.
Although it has been suggested that AD-associated reductions in brain insulin could be attributed to increased expression of IDE [59], a previous analysis of these cases revealed primarily reduced expression of IDE mRNA and protein [44]. Alternatively, impairments in local synthesis of insulin [16, 20] or its uptake from the peripheral circulation [60] could account for the reduced CNS levels of insulin with AD progression. One argument in favor of AD and APOE ɛ4-mediated impairments in local insulin synthesis was the finding of reduced C-peptide expression in patterns that mimicked changes in insulin. C-peptide is a cleavage product of pro-insulin and generated with insulin. Its longer half-life provides a more reliable in vivo index of insulin production.
Incretins, including GIP-1 and GLP-1, are potent stimulators of glucose-dependent insulin secretion and modulators of fatty acid metabolism [61]. GLP-1 suppresses plasma glucagon, stimulates glucose disposal, and has neuroprotective actions that may benefit individuals with AD [62, 63]. In the APOE ɛ3/ɛ3 cases, GIP expression was reduced with AD severity whereas GLP-1 was not, but with an APOE ɛ4/ɛ4, frontal lobe GIP and GLP-1 were similarly reduced in B3–4 and B5–6 relative to B0–2 controls. Again, the presence of a single ɛ4 allele was not associated with significantly altered incretin expression in either control or AD cases, supporting the concept that APOE ɛ4/ɛ4 is the principal driver of brain metabolic dysfunction, and that its adverse effects include impairments in brain incretin expression and function.
Leptin and ghrelin have opposing effects in that leptin regulates fat depots by inhibiting food intake and regulating energy expenditure while ghrelin stimulates appetite and induces adiposity in addition to inducing growth hormone release from the pituitary gland [64]. This study demonstrated that frontal lobe leptin was strikingly reduced in moderate and severe AD regardless of APOE genotype, as well as in APOE ɛ3/ɛ4 controls. Downregulation of leptin may reflect an adaptive response to insulin resistance since, although leptin inhibits tyrosine phosphorylation of the insulin receptor substrate 1 (IRS-1) protein and interactions between IRS-1 and growth factor receptor-bound protein 2 (GRB2), its positive effects include stimulation of PI3K, which promotes metabolism, cell survival, neuronal plasticity, and other critical neuronal and glial brain functions [65].
Ghrelin is an endogenous ligand of the growth hormone secretagogue receptor 1a that regulates growth hormone secretion and energy balance. Ghrelin is expressed in the brain, including hypothalamus and besides its physiological role in glucose and lipid metabolism, ghrelin has functional roles in memory, reward, sleep, and neurogenesis [66], which are known to be disrupted in AD [67]. Therefore, reductions in ghrelin, either in the CNS or periphery, could reflect a pathophysiological state that mediates neurobehavioral features of neurodegeneration. Furthermore, evidence suggests that ghrelin has an important role in neuroprotection and may help remediate cognitive dysfunction and neurodegeneration [68]. This study showed no significant alteration of ghrelin expression in relation to AD in APOE ɛ3/ɛ3 or ɛ3/ɛ4 cases. However, ghrelin was significantly reduced in both B3–4 (moderate) and B5–6 (severe) APOE ɛ4/ɛ4 AD. This observation is novel and could reflect significantly impaired neuroprotective mechanisms and metabolic dysfunction linked to APOE ɛ4 dose.
Glucagon increases gluconeogenesis and decrea-ses glycolysis, raising plasma glucose in response to insulin-induced hypoglycemia and likely plays an important role in initiating and maintaining hyperglycemic conditions in diabetes mellitus. Only the APOE ɛ4/ɛ4 AD had significantly reduced frontal lobe glucagon expression. This response could not be attributed to GLP-1 suppression since GLP-1 expression was also downregulated in B3–4 and B5–6 APOE ɛ4/ɛ4. One potential explanation for the finding is that GLP-1/glucagon regulation may be uncoupled. A chronic brain diabetic state (Type 3 diabetes) [16, 25, 69] together with impaired capacity for glucose and lipid utilization could potentially lead to brain starvation.
The adipokine, resistin, promotes insulin resistance [64] and activates pro-inflammatory cytokines [70]. Correspondingly, central deficiency of resistance was found to ameliorate hypothalamic inflammation and increase whole body insulin sensitivity [71]. Elevated resistin in APOE ɛ3/ɛ4 B3–4 relative to all other groups except APOE ɛ3/ɛ4 controls suggests that interactive effects of a single APOE4 allele and early or intermediate-stage AD contribute to brain insulin resistance. In contrast, reductions in brain resistin expression with increasing severity of AD among APOE ɛ3/ɛ3 cases, as well as the lower levels in more advanced stages of disease in APOE ɛ3/ɛ4 or APOE ɛ4/ɛ4 cases may reflect compensatory or adaptive responses, reducing neuroinflammation and increasing insulin sensitivity to support brain energy balance.
Visfatin is also an adipokine but, contrary to the effects of resistin, it increases insulin sensitivity [64], but like resistin, it activates pro-inflammatory cytokines [70]. Visfatin mediates its stimulatory ef-fects on insulin responsiveness via activation of the insulin receptor with attendant lowering of blood glucose [70]. Visfatin, also known as ‘nicotinamide phosphoribosyltransferase’ (NAmPRTase or Nampt), is the rate-limiting enzyme in the nicotinamide adenine dinucleotide (NAD+) salvage pathway that converts nicotinamide to nicotinamide mononucleotide and enables NAD+ biosynthesis [70]. Visfatin-mediated increases in NAD+ have anti-aging and neuroprotective actions [72–78]. Although there were no significant effects of AD on visfatin expression among APOE ɛ3/ɛ3 cases, in both APOE ɛ3/ɛ4 and APOE ɛ4/ɛ4, the significant linear trend effects reflect increasing levels with AD severity. Therefore, in addition to the interactive effects of APOE ɛ4 dose and AD grade, the results suggest that compensatory mechanisms may help preserve glucose utilization and energy metabolism vis-à-vis brain insulin resistance and deficiency.
PAI-1 is a serine protease inhibitor of tissue plas-minogen activator, urokinase, Protein C, and matrip-tase-3/TMPRSS7, and functionally inhibits fibrinolysis [79]. Elevated levels of PAI-1 are strongly associated with insulin resistance, including in diabetes mellitus [80, 81], and have been deemed independent risk factors for type 2 diabetes [81]. Elevated PAI-1 is associated with increased risk for thrombotic cardiovascular [82] and cerebrovascular [79] diseases and ischemic stroke [83]. In this study we observed significantly increased PAI-1 expression in AD relative to control in APOE ɛ3/ɛ3 cases, but similarly elevated PAI-1 in B0–1, B3–4, and B5–6 APOE ɛ3/ɛ4, indicating independent effects of AD severity and APOE /ɛ4. The similarly elevated PAI-1 levels in B5–6 APOE ɛ4/ɛ4 compared with B3–4 or B5–6 APOE ɛ3/ɛ3 and APOE ɛ3/ɛ4 cases indicates that in this instance, APOE ɛ4 dosage did not additively affect PAI-1 expression, and instead, APOE and AD independent upregulated PAI-1. Mechanistically, pro-inflammatory cytokine activation has been linked to increased PAI-1 expression [80], and in earlier reports we showed increased pro-inflammatory and reduced anti-inflammatory cytokine/chemokine levels in AD [40, 42].
Conclusions
This study provides strong evidence that insulin-related endocrine pathways are dysregulated in AD, and in relation to APOE4, particularly APOE ɛ4/ɛ4. Dominant APOE4-independent abnormalities included reductions in insulin, incretin (GIP-1), leptin, and resistin, and increases in PAI-1. Major interactive effects of APOE ɛ4/ɛ4 and AD included reductions in insulin, C-peptide, GIP-1, GLP-1, leptin, ghrelin, glucagon, and resistin, and increases in PAI-1. Leptin expression was broadly inhibited in relation to AD severity and APOE4, independent of ɛ4 dose. Altogether, these findings provide exciting new information about the complexity of insulin-linked metabolic dysfunction in AD and the additive adverse impact of APOE ɛ4, particularly ɛ4/ɛ4. One limitation of this study is that the case series is small and some subgroups had few or no cases. However, the research was entirely human-based and therefore fully dependent upon available tissue. Nonetheless, the data and interpretations support the concepts that: 1) AD pathogenesis and progression are linked to insulin deficiency together with insulin resistance, i.e., Type 3 diabetes [16, 17, 84]; 2) APOE4, particularly ɛ4/ɛ4, interacts with AD to significantly alter expression of insulin network polypeptides that have roles in energy metabolism and neuroinflammation; and 3) broadly reduced leptin expression, along with insulin deficiency, may be a critical mediator of brain hypometabolism in AD. Since it appears that multiple neuroendocrine abnormalities contribute to insulin deficiency and insulin resistance, eventual remediation of metabolic derangements in AD will likely require multi-pronged treatment approaches.
CONFLICT OF INTEREST
The authors have no conflict of interest to report.
ACKNOWLEDGMENTS
This work was supported by AA-011431, AA024018, AA-019072, AA-024092, and HD-078515 from the National Institutes of Health.
REFERENCES
[1] | Cunnane SC , Trushina E , Morland C , Prigione A , Casadesus G , Andrews ZB , Beal MF , Bergersen LH , Brinton RD , de la Monte S , Eckert A , Harvey J , Jeggo R , Jhamandas JH , Kann O , la Cour CM , Martin WF , Mithieux G , Moreira PI , Murphy MP , Nave KA , Nuriel T , Oliet SHR , Saudou F , Mattson MP , Swerdlow RH , Millan MJ ((2020) ) Brain energy rescue: An emerging therapeutic concept for neurodegenerative disorders of ageing. Nat Rev Drug Discov 19: , 609–633. |
[2] | Sperling RA , Aisen PS , Beckett LA , Bennett DA , Craft S , Fagan AM , Iwatsubo T , Jack CR Jr. , Kaye J , Montine TJ , Park DC , Reiman EM , Rowe CC , Siemers E , Stern Y , Yaffe K , Carrillo MC , Thies B , Morrison-Bogorad M , Wagster MV , Phelps CH ((2011) ) Toward defining the preclinical stages of Alzheimer’s disease: Recommendations from the National Institute on Aging-Alzheimer’s Association workgroups on diagnostic guidelines for Alzheimer’s disease. Alzheimers Dement 7: , 280–292. |
[3] | An Y , Varma VR , Varma S , Casanova R , Dammer E , Pletnikova O , Chia CW , Egan JM , Ferrucci L , Troncoso J , Levey AI , Lah J , Seyfried NT , Legido-Quigley C , O’Brien R , Thambisetty M ((2018) ) Evidence for brain glucose dysregulation in Alzheimer’s disease. Alzheimers Dement 14: , 318–329. |
[4] | Vinters HV , Beck DW , Bready JV , Maxwell K , Berliner JA , Hart MN , Cancilla PA ((1985) ) Uptake of glucose analogues into cultured cerebral microvessel endothelium. J Neuropathol Exp Neurol 44: , 445–458. |
[5] | Hertz MM , Paulson OB , Barry DI , Christiansen JS , Svendsen PA ((1981) ) Insulin increases glucose transfer across the blood-brain barrier in man. J Clin Invest 67: , 597–604. |
[6] | Clarke DW , Boyd FT Jr. , Kappy MS , Raizada MK ((1984) ) Insulin binds to specific receptors and stimulates 2-deoxy-D-glucose uptake in cultured glial cells from rat brain. J Biol Chem 259: , 11672–11675. |
[7] | Wei JW , Yeh SR ((1991) ) Effects of insulin on glucose uptake in cultured cells from the central nervous system of rodent. Int J Biochem 23: , 851–856. |
[8] | de la Monte SM ((2017) ) Insulin resistance and neurodegeneration: Progress towards the development of new therapeutics for Alzheimer’s disease. Drugs 77: , 47–65. |
[9] | Talbot K , Wang HY , Kazi H , Han LY , Bakshi KP , Stucky A , Fuino RL , Kawaguchi KR , Samoyedny AJ , Wilson RS , Arvanitakis Z , Schneider JA , Wolf BA , Bennett DA , Trojanowski JQ , Arnold SE ((2012) ) Demonstrated brain insulin resistance in Alzheimer’s disease patients is associated with IGF-1 resistance, IRS-1 dysregulation, and cognitive decline. J Clin Invest 122: , 1316–1338. |
[10] | de la Monte SM ((2009) ) Insulin resistance and Alzheimer’s disease. BMB Rep 42: , 475–481. |
[11] | Freiherr J , Hallschmid M , Frey WH 2nd , Brunner YF , Chapman CD , Holscher C , Craft S , De Felice FG , Benedict C ((2013) ) Intranasal insulin as a treatment for Alzheimer’s disease: A review of basic research and clinical evidence. CNS Drugs 27: , 505–514. |
[12] | Reger MA , Watson GS , Green PS , Wilkinson CW , Baker LD , Cholerton B , Fishel MA , Plymate SR , Breitner JC , DeGroodt W , Mehta P , Craft S ((2008) ) Intranasal insulin improves cognition and modulates beta-amyloid in early AD. Neurology 70: , 440–448. |
[13] | Reger MA , Watson GS , Frey WH 2nd , Baker LD , Cholerton B , Keeling ML , Belongia DA , Fishel MA , Plymate SR , Schellenberg GD , Cherrier MM , Craft S ((2006) ) Effects of intranasal insulin on cognition in memory-impaired older adults: Modulation by APOE genotype. Neurobiol Aging 27: , 451–458. |
[14] | de la Monte SM ((2013) ) Intranasal insulin therapy for cognitive impairment and neurodegeneration: Current state of the art. Expert Opin Drug Deliv 10: , 1699–1709. |
[15] | de la Monte SM , Wands JR ((2005) ) Review of insulin and insulin-like growth factor expression, signaling, and malfunction in the central nervous system: Relevance to Alzheimer’s disease. J Alzheimers Dis 7: , 45–61. |
[16] | Steen E , Terry BM , Rivera EJ , Cannon JL , Neely TR , Tavares R , Xu XJ , Wands JR , de la Monte SM ((2005) ) Impaired insulin and insulin-like growth factor expression and signaling mechanisms in Alzheimer’s disease–is this type 3 diabetes? J Alzheimers Dis 7: , 63–80. |
[17] | Lester-Coll N , Rivera EJ , Soscia SJ , Doiron K , Wands JR , de la Monte SM , ((2006) ) Intracerebral streptozotocin model of type 3 diabetes: Relevance to sporadic Alzheimer’s disease. J Alzheimers Dis 9: , 13–33. |
[18] | de la Monte SM , Tong M , Schiano I , Didsbury J ((2017) ) Improved brain insulin/IGF signaling and reduced neuroinflammation with T3D-959 in an experimental model of sporadic Alzheimer’s disease. J Alzheimers Dis 55: , 849–864. |
[19] | de la Monte SM , Tong M , Bowling N , Moskal P ((2011) ) si-RNA inhibition of brain insulin or insulin-like growth factor receptors causes developmental cerebellar abnormalities: Relevance to fetal alcohol spectrum disorder. Mol Brain 4: , 13. |
[20] | Rivera EJ , Goldin A , Fulmer N , Tavares R , Wands JR , de la Monte SM ((2005) ) Insulin and insulin-like growth factor expression and function deteriorate with progression of Alzheimer’s disease: Link to brain reductions in acetylcholine. J Alzheimers Dis 8: , 247–268. |
[21] | Cholerton B , Baker LD , Craft S ((2011) ) Insulin resistance and pathological brain ageing. Diabet Med 28: , 1463–1475. |
[22] | Kim B , Feldman EL ((2015) ) Insulin resistance as a key link for the increased risk of cognitive impairment in the metabolic syndrome. Exp Mol Med 47: , e149. |
[23] | Cole GM , Frautschy SA ((2007) ) The role of insulin and neurotrophic factor signaling in brain aging and Alzheimer’s disease. Exp Gerontol 42: , 10–21. |
[24] | de la Monte SM ((2012) ) Metabolic derangements mediate cognitive impairment and Alzheimer’s disease: Role of peripheral insulin-resistance diseases. Panminerva Med 54: , 171–178. |
[25] | de la Monte SM ((2014) ) Type 3 diabetes is sporadic Alzheimer’s disease: Mini-review. Eur Neuropsychopharmacol 24: , 1954–1960. |
[26] | de la Monte SM , Tong M ((2014) ) Brain metabolic dysfunction at the core of Alzheimer’s disease. Biochem Pharmacol 88: , 548–559. |
[27] | Jha NK , Jha SK , Kumar D , Kejriwal N , Sharma R , Ambasta RK , Kumar P ((2015) ) Impact of insulin degrading enzyme and neprilysin in Alzheimer’s disease biology: Characterization of putative cognates for therapeutic applications. J Alzheimers Dis 48: , 891–917. |
[28] | Viola KL , Klein WL ((2015) ) Amyloid beta oligomers in Alzheimer’s disease pathogenesis, treatment, and diagnosis. Acta Neuropathol 129: , 183–206. |
[29] | de la Monte SM ((2012) ) Contributions of brain insulin resistance and deficiency in amyloid-related neurodegeneration in Alzheimer’s disease. Drugs 72: , 49–66. |
[30] | Sridhar GR , Lakshmi G , Nagamani G ((2015) ) Emerging links between type 2 diabetes and Alzheimer’s disease. World J Diabetes 6: , 744–751. |
[31] | de la Monte SM , Neusner A , Chu J , Lawton M ((2009) ) Epidemiological trends strongly suggest exposures as etiologic agents in the pathogenesis of sporadic Alzheimer’s disease, diabetes mellitus, and non-alcoholic steatohepatitis. J Alzheimers Dis 17: , 519–529. |
[32] | Li X , Song D , Leng SX ((2015) ) Link between type 2 diabetes and Alzheimer’s disease: From epidemiology to mechanism and treatment. Clin Interv Aging 10: , 549–560. |
[33] | Butterfield DA , Di Domenico F , Barone E ((2014) ) Elevated risk of type 2 diabetes for development of Alzheimer disease: A key role for oxidative stress in brain. Biochim Biophys Acta 1842: , 1693–1706. |
[34] | Dhamoon MS , Noble JM , Craft S ((2009) ) Intranasal insulin improves cognition and modulates beta-amyloid in early AD. Neurology 72: , 292–293; author reply 293-294. |
[35] | Claxton A , Baker LD , Hanson A , Trittschuh EH , Cholerton B , Morgan A , Callaghan M , Arbuckle M , Behl C , Craft S ((2015) ) Long-acting intranasal insulin detemir improves cognition for adults with mild cognitive impairment or early-stage Alzheimer’s disease dementia. J Alzheimers Dis 44: , 897–906. |
[36] | Chen Y , Zhang J , Zhang B , Gong CX ((2016) ) Targeting insulin signaling for the treatment of Alzheimer’s disease. Curr Top Med Chem 16: , 485–492. |
[37] | Cardoso S , Santos R , Correia S , Carvalho C , Zhu X , Lee HG , Casadesus G , Smith MA , Perry G , Moreira PI ((2009) ) Insulin and insulin-sensitizing drugs in neurodegeneration: Mitochondria as therapeutic targets. Pharmaceuticals (Basel) 2: , 250–286. |
[38] | Ng TP , Feng L , Yap KB , Lee TS , Tan CH , Winblad B ((2014) ) Long-term metformin usage and cognitive function among older adults with diabetes. J Alzheimers Dis 41: , 61–68. |
[39] | Jauch-Chara K , Friedrich A , Rezmer M , Melchert UH , G Scholand-Engler H , Hallschmid M , Oltmanns KM ((2012) ) Intranasal insulin suppresses food intake via enhancement of brain energy levels in humans. Diabetes 61: , 2261–2268. |
[40] | de la Monte SM , Daiello LA , Hapel AJ , Tong M , Ott BR ((2017) ) Altered serum and cerebrospinal fluid inflammatory cascades in mild cognitive impairment and Alzheimer’s disease. J Neuroinflam Neurodegen 1: , 100004. |
[41] | de la Monte SM , Tong M , Daiello LA , Ott BR ((2019) ) Early-stage Alzheimer’s disease is associated with simultaneous systemic and central nervous system dysregulation of insulin-linked metabolic pathways. J Alzheimers Dis 68: , 657–668. |
[42] | Johanson CE , Stopa EG , Daiello LA , de la Monte SM , Keane M , Ott BR ((2018) ) Disrupted blood-CSF barrier to urea and creatinine in mild cognitive impairment and Alz-heimer’s disease. J Alzheimers Dis Parkinsonism 08: , 435. |
[43] | Ott BR , Jones RN , Daiello LA , de la Monte SM , Stopa EG , Johanson CE , Denby C , Grammas P ((2018) ) Blood-cerebrospinal fluid barrier gradients in mild cognitive impairment and Alzheimer’s disease: Relationship to inflammatory cytokines and chemokines. Front Aging Neurosci 10: , 245. |
[44] | Delikkaya B , Moriel N , Tong M , Gallucci G , de la Monte SM ((2019) ) Altered expression of insulin-degrading enzyme and regulator of calcineurin in the rat intracerebral streptozotocin model and human apolipoprotein E-epsilon4-associated Alzheimer’s disease. Alzheimers Dement (Amst) 11: , 392–404. |
[45] | Cedazo-Minguez A ((2007) ) Apolipoprotein E and Alzhei-mer’s disease: Molecular mechanisms and therapeutic opportunities. J Cell Mol Med 11: , 1227–1238. |
[46] | Corder EH , Saunders AM , Strittmatter WJ , Schmechel DE , Gaskell PC , Small GW , Roses AD , Haines JL , Pericak-Vance MA ((1993) ) Gene dose of apolipoprotein E type 4 allele and the risk of Alzheimer’s disease in late onset families. Science 261: , 921–923. |
[47] | Yamazaki Y , Zhao N , Caulfield TR , Liu CC , Bu G ((2019) ) Apolipoprotein E and Alzheimer disease: Pathobiology and targeting strategies. Nat Rev Neurol 15: , 501–518. |
[48] | Reiman EM , Chen K , Alexander GE , Caselli RJ , Bandy D , Osborne D , Saunders AM , Hardy J ((2004) ) Functional brain abnormalities in young adults at genetic risk for late-onset Alzheimer’s dementia. Proc Natl Acad Sci U S A 101: , 284–289. |
[49] | Zhao N , Liu CC , Van Ingelgom AJ , Martens YA , Linares C , Knight JA , Painter MM , Sullivan PM , Bu G ((2017) ) Apolipoprotein E4 impairs neuronal insulin signaling by trapping insulin receptor in the endosomes. Neuron 96: , 115–129 e115. |
[50] | Herz J , Chen Y ((2006) ) Reelin, lipoprotein receptors and synaptic plasticity. Nat Rev Neurosci 7: , 850–859. |
[51] | Lane-Donovan C , Philips GT , Herz J ((2014) ) More than cholesterol transporters: Lipoprotein receptors in CNS function and neurodegeneration. Neuron 83: , 771–787. |
[52] | de Chaves EP , Narayanaswami V ((2008) ) Apolipoprotein E and cholesterol in aging and disease in the brain. Future Lipidol 3: , 505–530. |
[53] | Xu J , Yeon JE , Chang H , Tison G , Chen GJ , Wands J , de la Monte S ((2003) ) Ethanol impairs insulin-stimulated neuronal survival in the developing brain:Role of PTENphosphatase. J Biol Chem 278: , 26929–26937. |
[54] | Marquer C , Laine J , Dauphinot L , Hanbouch L , Lemercier-Neuillet C , Pierrot N , Bossers K , Le M , Corlier F , Benstaali C , Saudou F , Thinakaran G , Cartier N , Octave JN , Duyckaerts C , Potier MC ((2014) ) Increasing membrane cholesterol of neurons in culture recapitulates Alzheimer’s disease early phenotypes. Mol Neurodegener 9: , 60. |
[55] | Liu CC , Hu J , Tsai CW , Yue M , Melrose HL , Kanekiyo T , Bu G ((2015) ) Neuronal LRP1 regulates glucose metabolism and insulin signaling in the brain. J Neurosci 35: , 5851–5859. |
[56] | Fernandez CG , Hamby ME , McReynolds ML , Ray WJ ((2019) ) The role of APOE4 in disrupting the homeostatic functions of astrocytes and microglia in aging and Alzheimer’s disease. Front Aging Neurosci 11: , 14. |
[57] | de la Monte SM ((2014) ) Relationships between diabetes and cognitive impairment. Endocrinol Metab Clin North Am 43: , 245–267. |
[58] | Chang TY , Yamauchi Y , Hasan MT , Chang C ((2017) ) Cellular cholesterol homeostasis and Alzheimer’s disease. J Lipid Res 58: , 2239–2254. |
[59] | Miners JS , Baig S , Tayler H , Kehoe PG , Love S ((2009) ) Neprilysin and insulin-degrading enzyme levels are increased in Alzheimer disease in relation to disease severity. J Neuropathol Exp Neurol 68: , 902–914. |
[60] | Messier C , Teutenberg K ((2005) ) The role of insulin, insulin growth factor, and insulin-degrading enzyme in brain aging and Alzheimer’s disease. Neural Plast 12: , 311–328. |
[61] | Joao AL , Reis F , Fernandes R ((2016) ) The incretin system ABCs in obesity and diabetes - novel therapeutic strategies for weight loss and beyond. Obes Rev 17: , 553–572. |
[62] | Tramutola A , Arena A , Cini C , Butterfield DA , Barone E ((2017) ) Modulation of GLP-1 signaling as a novel therapeutic approach in the treatment of Alzheimer’s disease pathology. Expert Rev Neurother 17: , 59–75. |
[63] | Irwin N , Gault V , Flatt PR ((2010) ) Therapeutic potential of the original incretin hormone glucose-dependent insulinotropic polypeptide: Diabetes, obesity, osteoporosis and Alzheimer’s disease? Expert Opin Investig Drugs 19: , 1039–1048. |
[64] | Smitka K , Maresova D ((2015) ) Adipose tissue as an endocrine organ: An update on pro-inflammatory and anti-inflammatory microenvironment. Prague Med Rep 116: , 87–111. |
[65] | Cohen B , Novick D , Rubinstein M ((1996) ) Modulation of insulin activities by leptin. Science 274: , 1185–1188. |
[66] | Stoyanova II ((2014) ) Ghrelin: A link between ageing, metabolism and neurodegenerative disorders. Neurobiol Dis 72 Pt A: , 72–83. |
[67] | Shi L , Du X , Jiang H , Xie J ((2017) ) Ghrelin and neurodegenerative disorders-a review. Mol Neurobiol 54: , 1144–1155. |
[68] | Moon M , Choi JG , Nam DW , Hong HS , Choi YJ , Oh MS , Mook-Jung I ((2011) ) Ghrelin ameliorates cognitive dysfunction and neurodegeneration in intrahippocampal amyloid-beta1-42 oligomer-injected mice. J Alzheimers Dis 23: , 147–159. |
[69] | Chalichem NSS , Gonugunta C , Krishnamurthy PT , Duraiswamy B ((2017) ) DPP4 inhibitors can be a drug of choice for type 3 diabetes: A mini review. Am J Alzheimers Dis Other Demen 32: , 444–451. |
[70] | Stofkova A ((2010) ) Resistin and visfatin: Regulators of insulin sensitivity, inflammation and immunity. Endocr Regul 44: , 25–36. |
[71] | Rodriguez M , Pintado C , Molto E , Gallardo N , Fernandez-Martos CM , Lopez V , Andres A , Arribas C ((2018) ) Central s-resistin deficiency ameliorates hypothalamic inflammation and increases whole body insulin sensitivity. Sci Rep 8: , 3921. |
[72] | Erfani S , Khaksari M , Oryan S , Shamsaei N , Aboutaleb N , Nikbakht F ((2015) ) Nampt/PBEF/visfatin exerts neuroprotective effects against ischemia/reperfusion injury via modulation of Bax/Bcl-2 ratio and prevention of caspase-3 activation. J Mol Neurosci 56: , 237–243. |
[73] | Jing Z , Xing J , Chen X , Stetler RA , Weng Z , Gan Y , Zhang F , Gao Y , Chen J , Leak RK , Cao G ((2014) ) Neuronal NAMPT is released after cerebral ischemia and protects against white matter injury. J Cereb Blood Flow Metab 34: , 1613–1621. |
[74] | LoCoco PM , Risinger AL , Smith HR , Chavera TS , Berg KA , Clarke WP ((2017) ) Pharmacological augmentation of nicotinamide phosphoribosyltransferase (NAMPT) protects against paclitaxel-induced peripheral neuropathy. Elife 6: , e29626. |
[75] | Schondorf DC , Ivanyuk D , Baden P , Sanchez-Martinez A , De Cicco S , Yu C , Giunta I , Schwarz LK , Di Napoli G , Panagiotakopoulou V , Nestel S , Keatinge M , Pruszak J , Bandmann O , Heimrich B , Gasser T , Whitworth AJ , Deleidi M ((2018) ) The NAD+precursor nicotinamide riboside rescues mitochondrial defects and neuronal loss in iPSC and fly models of Parkinson’s disease. Cell Rep 23: , 2976–2988. |
[76] | Wang P , Xu TY , Guan YF , Tian WW , Viollet B , Rui YC , Zhai QW , Su DF , Miao CY ((2011) ) Nicotinamide phosphoribosyltransferase protects against ischemic stroke through SIRT1-dependent adenosine monophosphate-activated kinase pathway. Ann Neurol 69: , 360–374. |
[77] | Wang SN , Xu TY , Wang X , Guan YF , Zhang SL , Wang P , Miao CY ((2016) ) Neuroprotective efficacy of an aminopropyl carbazole derivative P7C3-A20 in ischemic stroke. CNS Neurosci Ther 22: , 782–788. |
[78] | Zhao Y , Liu XZ , Tian WW , Guan YF , Wang P , Miao CY ((2014) ) Extracellular visfatin has nicotinamide phosphoribosyltransferase enzymatic activity and is neuroprotective against ischemic injury. CNS Neurosci Ther 20: , 539–547. |
[79] | Tjarnlund-Wolf A , Brogren H , Lo EH , Wang X ((2012) ) Plasminogen activator inhibitor-1 and thrombotic cerebrovascular diseases. Stroke 43: , 2833–2839. |
[80] | Juhan-Vague I , Alessi MC , Mavri A , Morange PE ((2003) ) Plasminogen activator inhibitor-1, inflammation, obesity, insulin resistance and vascular risk. J Thromb Haemost 1: , 1575–1579. |
[81] | Yarmolinsky J , Bordin Barbieri N , Weinmann T , Ziegelmann PK , Duncan BB , Ines Schmidt M ((2016) ) Plasminogen activator inhibitor-1 and type 2 diabetes: A systematic review and meta-analysis of observational studies. Sci Rep 6: , 17714. |
[82] | Bastard JP , Pieroni L ((1999) ) Plasma plasminogen activator inhibitor 1, insulin resistance and android obesity. Biomed Pharmacother 53: , 455–461. |
[83] | Haapaniemi E , Tatlisumak T , Soinne L , Syrjala M , Kaste M ((2000) ) Plasminogen activator inhibitor-1 in patients with ischemic stroke. Acta Neurochir Suppl 76: , 277–278. |
[84] | de la Monte SM , Wands JR ((2008) ) Alzheimer’s disease is type 3 diabetes: Evidence reviewed. J Diabetes Sci Technol 2: , 1101–1113. |


