
Correlative Microscopy to Localize and Characterize Iron Deposition in Alzheimer’s Disease
Abstract
Background:
Recent evidence suggests that the accumulation of iron, specifically ferrous Fe2+, may play a role in the development and progression of neurodegeneration in Alzheimer’s disease (AD) through the production of oxidative stress.
Objective:
To localize and characterize iron deposition and oxidation state in AD, we analyzed human hippocampal autopsy samples from four subjects with advanced AD that have been previously characterized with correlative MRI-histology.
Methods:
We perform scanning electron microscopy (SEM), energy dispersive spectroscopy (EDS), and electron energy loss spectroscopy (EELS) in the higher resolution transmission electron microscope on the surface and cross-sections of specific iron-rich regions of interest.
Results:
Specific previously analyzed regions were visualized using SEM and confirmed to be iron-rich deposits using EDS. Subsequent analysis using focused ion beam cross-sectioning and SEM characterized the iron deposition throughout the 3-D volumes, confirming the presence of iron throughout the deposits, and in two out of four specimens demonstrating colocalization with zinc. Analysis of traditional histology slides showed the analyzed deposits overlapped both with amyloid and tau deposition. Following higher resolution analysis of a single iron deposit using scanning transmission electron microscope (STEM), we demonstrated the potential of monochromated STEM-EELS to discern the relative oxidation state of iron within a deposit.
Conclusion:
These findings suggest that iron is present in the AD hippocampus and can be visualized and characterized using combined MRI and EM techniques. An altered relative oxidation state may suggest a direct link between iron and oxidative stress in AD. These methods thus could potentially measure an altered relative oxidation state that could suggest a direct link between iron and oxidative stress in AD. Furthermore, we have demonstrated the ability to analyze metal deposition alongside commonly used histological markers of AD pathology, paving the way for future insights into the molecular interactions between Aβ, tau, iron, and other putative metals, such as zinc.
INTRODUCTION
Alzheimer’s disease (AD) is characterized by the presence of abnormal accumulations of amyloid-β (Aβ) within plaques and phosphorylated tau within neurofibrillary tangles. Many hypotheses describe these two pathologies as mechanistically responsible for neurodegeneration, and the associated synaptic and neuronal loss, ultimately manifesting as the memory loss and cognitive impairment characteristic of AD. Although clinical AD requires the presence of both Aβ and tau deposition, the interaction of these pathologies and the resultant dementia still occurs by unknown mechanisms.
Recent work has led investigators to suggest that pathological accumulation of iron in the AD brain may constitute a mechanistic link between Aβ patho-logy and tau-associated neurodegeneration (see [1], for review). Iron accumulation has been shown in the hippocampus substantia nigra, globus pallidus, caudate nucleus, and cortex of the AD brain [1–5]. Elevations in iron and iron-storage proteins, measured through in vivo cerebrospinal fluid analyses and post-mortem analyses, have been shown to correlate with Braak stage [6, 7] and cognitive decline [8] in AD patients. Additionally, elevated levels of iron have been shown to decrease furin activity, which favors β-secretase activity and promotes amyloid production [9, 10]. Likewise, iron increases amyloid-β protein precursor (AβPP) translation due to an in-teraction of iron regulatory proteins with a putative iron-responsive element in the AβPP mRNA, further suggesting that excessive iron promotes the amyloidogenic pathway [11]. Through these mechanisms, a positive feedback cycle allowing iron to further potentiate Aβ pathological progression may exist.
In addition to the accumulation of iron being implicated in AD, a growing body of evidence suggests that the oxidation state of iron deposits in the brain may be important and may be directly linked to a neu-roinflammatory role. Importantly, rather than being mineralized as the typical storage form of ferric Fe3+ within ferrihydrite, iron that accumulates in the brain in AD is more composed of magnetite and wüstite, both of which possess ferrous Fe2+ [12–14], a catalyst for the production of toxic free radicals via Fenton chemistry. Several in vitro studies have shown that Aβ may even be the source of this toxic iron via an interaction with ferric Fe3+ to produce ferrous Fe2+ [15, 16]. The resultant abnormal production of free radicals may cause oxidative damage and ant-ioxidant depletion, leading to neurodegeneration. Additionally, free radicals have been shown to induce mitochondrial stress, which can lead to hyperphosphorylation of tau [17]. Finally, our prior ex vivo work in AD localized abnormal iron accumulation to within hippocampal microglia [18], further suggesting that iron is mechanistically linked to chronic neuroinflammation, which may be related to neuronal death and subsequent tau protein release and aggregation [19]. Preclinical and preliminary clinical studies have shown that pharmacological chelation of iron may reduce pathological and clinical decline in AD [20–22], suggesting that iron may serve as a potential therapeutic target.
However, at present, we do not understand the relationship of iron and inflammation to amyloid and tau pathology, and we lack conclusive evidence that the oxidation state of iron (e.g., Fe2+ versus Fe3+) correlates with microglial activity in AD. Additionally, an analysis of the possible role of other elements, such as zinc, has not been performed alongside investigations of iron deposition, limiting our understanding of the complex interplay of these elements. These outstanding questions limit our understanding of the mechanistic role of iron accumulation and our ability to develop targeted therapies and to identify the appropriate stage of disease at which to intervene.
Traditional histology can localize the presence of iron and iron-related proteins in ex vivo samples (e.g., ferritin and transferrin). However, these techniques are unable to provide quantitative information regarding iron, its microscopic spatial overlap with other elements, and its oxidative state, all of which are necessary to fully characterize the role of iron deposition in disease pathology. While prior work [3, 5, 23, 24] has used X-ray microscopy techniques to analyze iron in AD human tissue [3, 24], and specifically the hippocampus [5], and aimed to assess iron oxidation state in amyloid plaque cores [24], the present study aims to build on and integrate this prior work by analyzing iron accumulation in the subiculum, an important region known to accumulate iron in the AD hippocampus, and assessing oxidation state of individual iron deposits in human brain tissue. Moreover, while these methods, and other EM methods, have the ability to interrogate samples with nanoscale resolution, they are often limited in the field-of-view that they are able to image, precluding correlation with in vivo imaging modalities. The present study aims to bridge this gap to provide evidence for the presence of iron within the hippocampus in AD, and to perform a detailed characterization of iron in AD by correlating our previously described high-resolution ex vivo specimen MRI and traditional histology methods with advanced electron microscopy. We previously acquired ultra-high resolution (0.1 mm isotropic) 7T gradient echo (GRE) MRI of four AD human hippocampal specimens. To identify the histological cor-relate of MRI hypointensity, the same specimens were previously sectioned and underwent optical microscopy using DAB (3,3’-diaminobenzidine tet-rahydrochloride)-enhanced Perls’ stain for iron and immunohistochemistry for Aβ and phospho-tau. In the current study, we perform scanning electron mi-croscopy (SEM), energy dispersive spectroscopy (EDS), and electron energy loss spectroscopy (EELS) in the higher resolution transmission electron microscope (TEM) on the surface and cross-sections of specific iron-rich regions of interest to confirm the presence of iron, explore the presence of zinc, and interrogate the underlying oxidation state of these deposits. The coregistration of this data provides an opportunity to localize and comprehensively analyze the progression of inflammatory iron in AD, and can be applied in human post-mortem studies across the different stages of disease. This approach provides data necessary to facilitate the development of novel imaging-based biomarkers or therapeutic targets surrounding iron and inflammation.
MATERIALS AND METHODS
Tissue acquisition, specimen MR, and histology
Human brain tissue from four subjects with advanced AD (aged 83–89, average 85.75, see Supplementary Table 1 for full details) was utilized from our prior work [18]. Specimen acquisition and handling was approved by our neuropathology procedure and was compliant with the Health Insurance Portability and Accountability Act. As fully described in [18], each specimen consisted of 3 cm by 3 cm by 4 mm thick formalin-fixed slabs from the medial temporal lobe (specifically at the level of the hippocampal body, including the hippocampus, subiculum, and parahippocampal gyrus). These specimens were previously immersed in Fluorinert (3M, USA) to undergo high-resolution MRI at 7T (GE/Agilent Discovery MR901) at room temperature. A GRE sequence (repetition time 21, echo time 10.5, flip angle 20, number of excitations 8, 0.1 mm isotropic voxels, field-of-view (FOV) 3 cm, 256 slices, bandwidth 8 kHz, total scan time 3 hours 37 minutes each), sensitive to iron, was acquired (see Supplementary Table 2 for full sequence parameters). Following MRI, the specimens were paraffin-embedded and sectioned at 10μm with alternating sections either serially triple-stained for iron, microglia, and then amyloid, or single-stained for phospho-tau. Specimens A1, A3, and A5, as well as three new specimens from control subjects (N6, N7, and N8), were double-stained for ferritin and microglia. This allowed us to localize iron deposits without potentially altering the underlying chemical state, which is otherwise possible with DAB-enhanced Perl’s staining directly for iron. The control specimens N6, N7, and N8 showed limited staining for ferritin and microglia (and on other slides very little iron), so while efforts to find deposits using SEM-EDS and to analyze them using STEM-EELS were attempted multiple times, these efforts proved unsuccessful at identifying and confirming true iron deposits. After each stain was applied, whole-slide optical microscopy scanning was performed. Histology slides were co-registered to corresponding MRI slices using a landmark-based approach to colocalize iron deposits on both modalities.
Scanning electron microscopy (Fig. 1)
SEM was performed on all four specimens to identify iron deposits based on the optical microscopy images. In order to prepare previously stained and whole-slide scanned microscopy slides for investigation, selected triple-stained slides were soaked in Clear-Rite 3 (Thermo Fisher Scientific) solution for several days, and the coverslip was gently removed. Samples were then clipped onto conductive aluminum stubs (Pelco SEMclip, Ted Pella Inc.) and AuPd sputter coated prior to imaging in a FEI Helios NanoLab 600i DualBeam FIB/SEM (FEI Thermo Fisher, Hillsboro, OR).
Regions of interest (ROIs) were first identified in the optical microscopy image, based on the presence of brown spots from the DAB-enhanced Perls’ iron stain, or in the case of the tested control cases, the overlap of ferritin and microglia staining. Those same positions were then located with secondary electron (SE) SEM imaging in the Helios dual-beam operating at 2 kV. All SEM images presented herein are secondary electron images, which is sensitive to sample topography, to allow for co-registration with optical micrographs. While backscattered electron imaging is sensitive to variations in atomic number, it was found to be insufficient to reliably locate iron deposits and was not applied in this work. Notably, the tissue samples possess natural fiducial marks across various scales, which were used to align the SEM and optical microscopy images. These include the edges of the tissue section, tears which occur during the sectioning process and blood vessels (Fig. 1c, d).
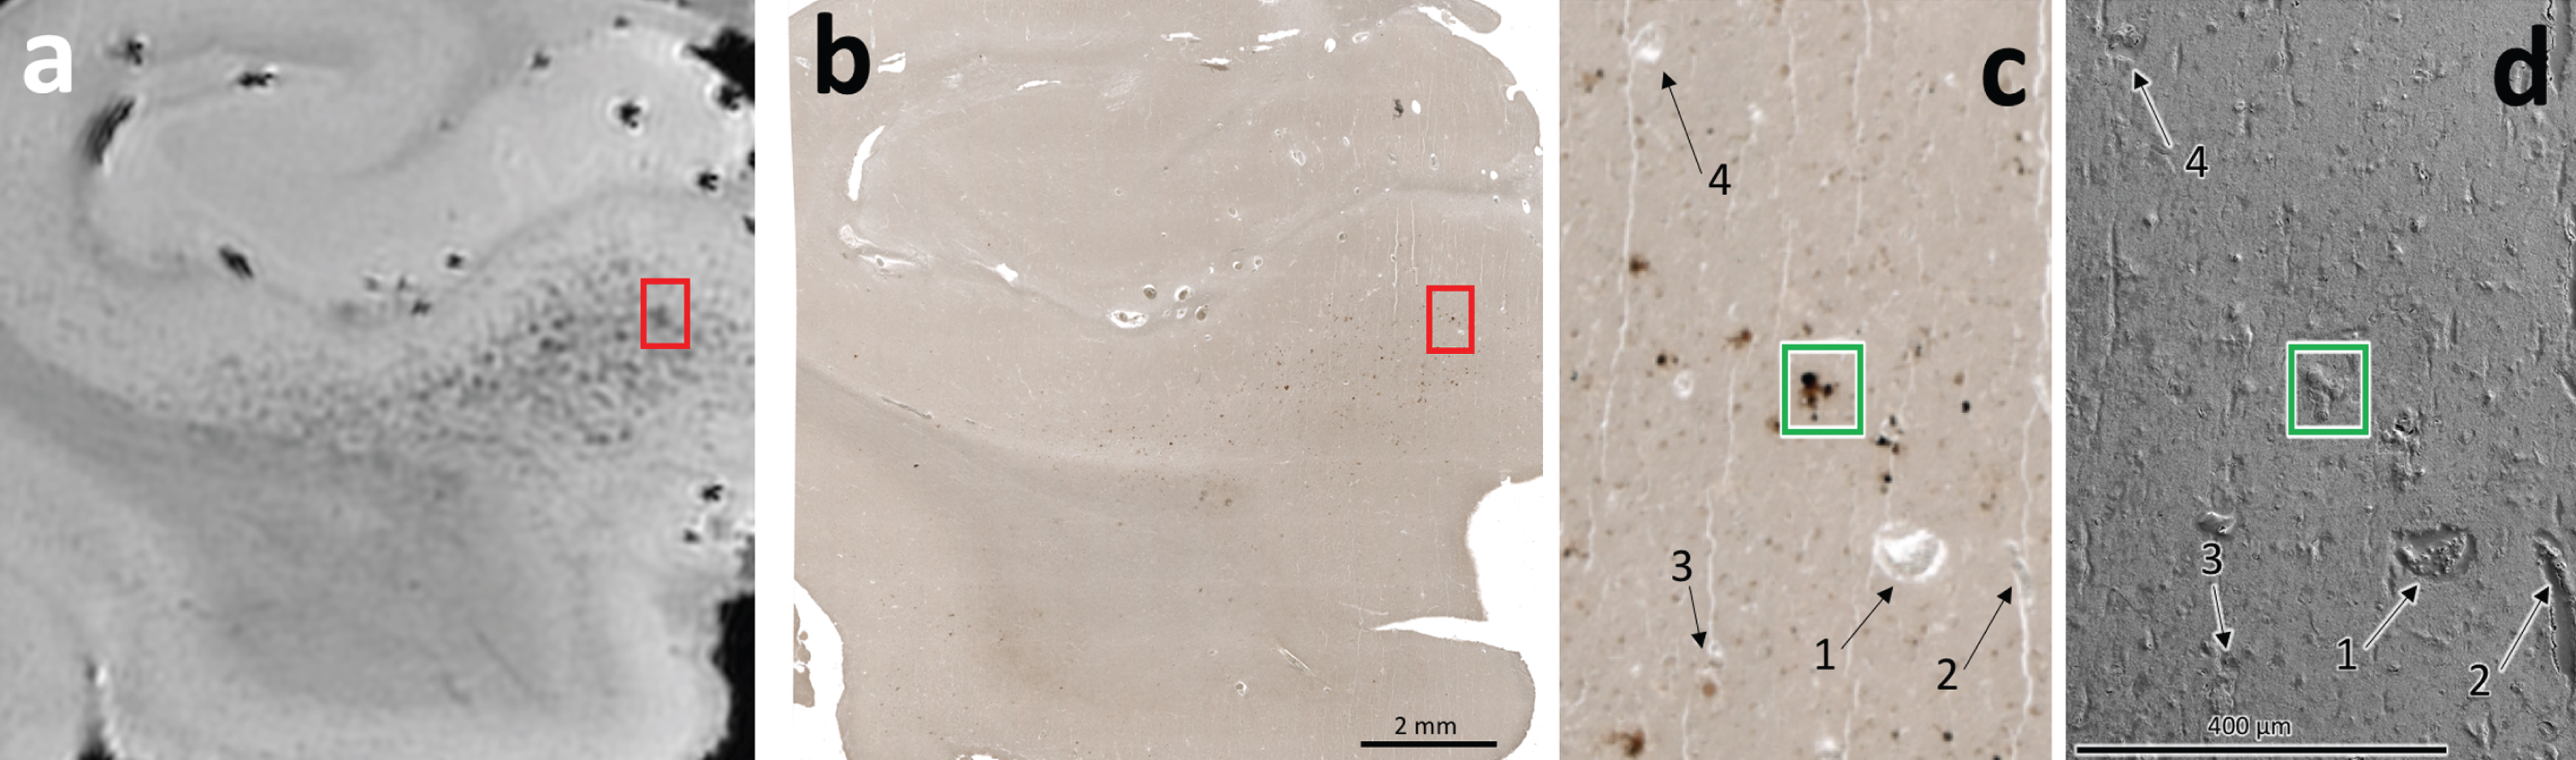
Fig. 1
Correlative MRI (a), optical microscopy (b, c), and SEM (d) demonstrating presence of iron deposits in specimen A5. a) MRI hypointensities can be seen throughout the subiculum, as marked by the red box. b) Iron-positive staining can be seen on optical microscopy. These iron deposits coregister with the hypointensities in the visually aligned MRI in (a). The region indicated by the red box was selected for further analysis. c) Higher-resolution optical microscopy of the boxed region in (a) and (b) demonstrates clear iron-positive foci. d) SE-SEM micrographs of the boxed region in (a) and (b). The numbered features 1–4 demonstrate example fiducial markers found within the specimen and can be found at the same positions in both images. The location of a dark stained region in the optical micrograph (green box) was identified in the SEM for energy dispersive X-ray spectroscopy to identify the elements present.
SEM energy dispersive spectroscopy (Fig. 2)
SEM-EDS spectra and spectrum images (in which each pixel contains a spectrum) were collected from identified regions of interest from all four specimens to determine with specificity the distribution of iron and other elements in these putative deposits. For each pixel in the SEM-EDS spectrum image, the electron beam is focused to a point on the sample. Some atoms in the sample are locally excited to elevated energy states. Characteristic X-rays can be generated as these states relax after excitation, and have fixed energies based on the element and the transition that occurs (e.g., 6.4 keV for iron (Fe) Kα, the L to K transition in iron). Some of these X-rays impinge on a detector (EDAX TEAM silicon drift detector) and their energies and counts are collected to generate a spectrum. The beam is moved to the next position on the sample and the process is repeated until the image is completed. Multiple passes (between 50–70 depending on the apparent signal-to-noise of the region) over the same region are summed to improve the signal intensity.
An accelerating voltage of 15 kV was selected to ensure that the electron energy was more than double the Fe Kα peak energy, in order to provide sufficient signal intensity. A beam current of 2.7 nA was applied. Under these conditions, the spectrum image run time was approximately 20–30 minutes to generate an image with, e.g., 64x50 pixels and 600 frames. Elemental maps were generated by assigning each pixel an intensity based on the integrated counts of the characteristic peaks (e.g., Fe Kα for iron) after background subtraction of Bremsstrahlung radiation.
Focused ion beam (FIB) cross-sectioning (Fig. 3)
The focused ion beam capabilities of the Helios dual beam FIB-SEM were employed on all four specimens to take cross sections of several of the identified iron deposits for additional spectroscopic characterization. First, the stage was tilted by 52° to orient the sample surface normal to the Ga+ ion beam. The ion beam was operated at an accelerating voltage of 30 kV and a current of 2.5 nA for the initial milling. A wedge-shaped trench was produced to expose a cross sectional face of the iron deposit. A second clean-up milling with a beam current of 0.79 nA was used to produce a more planar surface and remove damaged material. Imaging and elemental mapping were performed on the exposed faces.
FIB liftout and thinning, scanning transmission electron microscopy, and electron energy loss spectroscopy (Fig. 6)
FIB liftout and thinning
To further investigate one metal-containing deposit from one specimen, the FIB was used to extract and thin a lamella of the sample for STEM and EELS (Fig. 6a). Details of the ion beam liftout and thinning procedure are included in the Supplementary Material for further review.
Fig. 2
SEM (a) and SEM-EDS (b) of a single ROI in specimen A5 confirming presence of iron-rich feature. a) High-resolution SEM image of the region marked with the green box in Fig. 1c and d. The red line specifies the region where cross-sectional FIB-SEM was subsequently performed, described below. b) EDS iron map of the region marked with the green box in Fig. 1c and d, with an incoming electron energy of 15 keV and a measured X-ray energy of 6.4 keV, identifying a roughly 10μm region with elevated iron content. The scale is the same for both images.
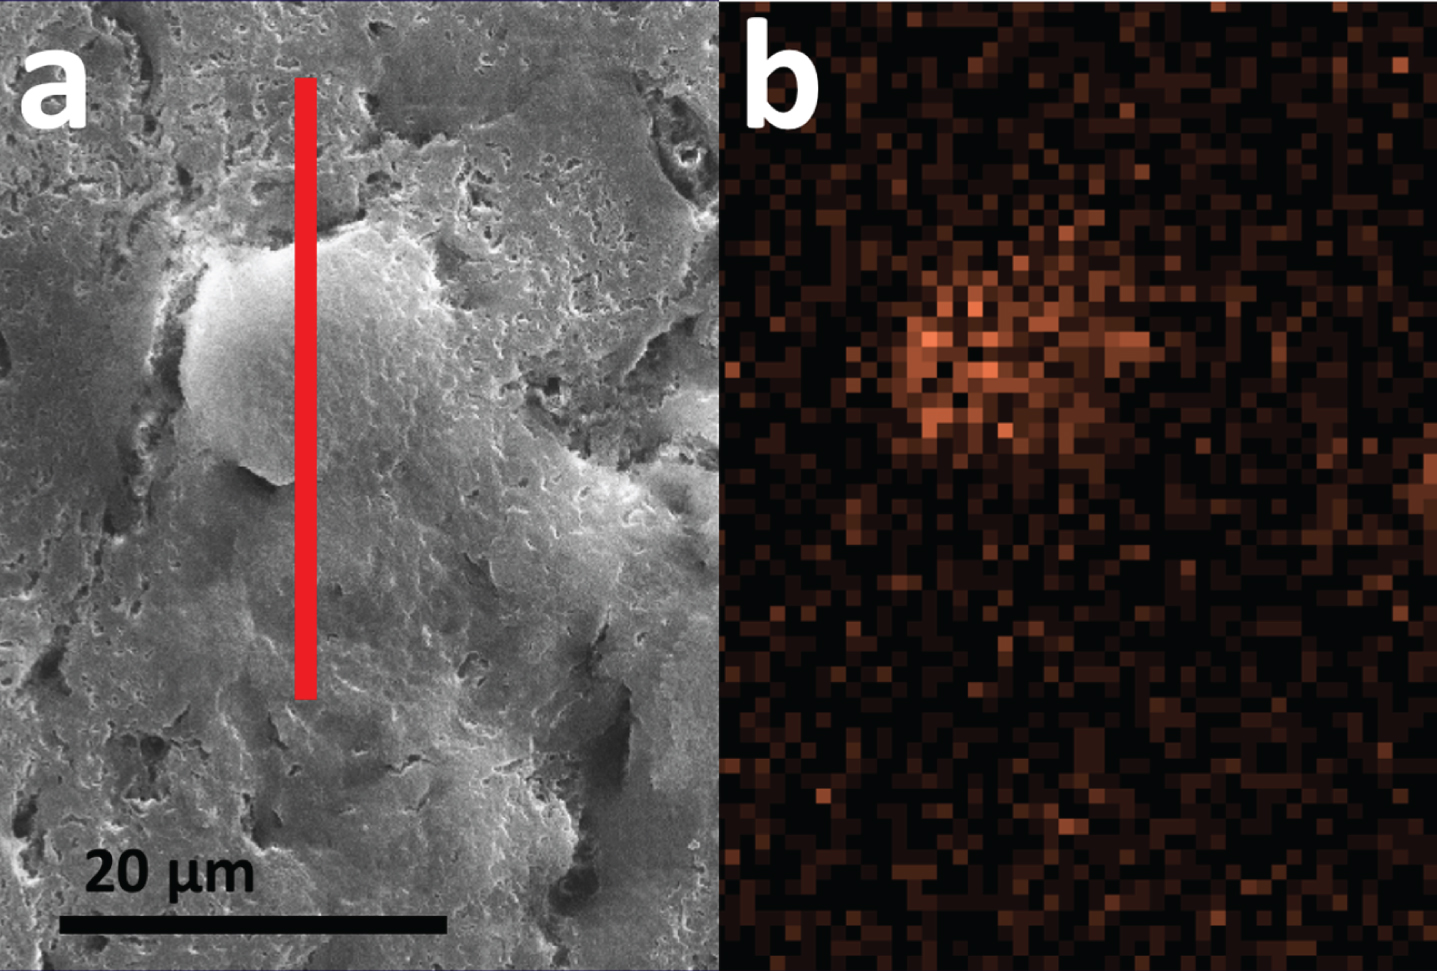
Fig. 3
FIB-SEM cross-sectioning (a) and SEM-EDS (b-d) of specimen A5 confirming presence of iron (Fe) and zinc (Zn). a) SE-SEM image of the exposed cross section, with the glass slide/substrate visible below. The scale bar is the same for a-c, but is only accurate in the indicated direction as the sample is viewed at an angle. This cross section was acquired at the position of the red line in Fig. 2a. b) EDS iron map at 6.4 keV acquired on the boxed region from (a), confirming the presence of an iron-rich feature. c) EDS zinc map at 8.6 keV acquired on the boxed region from (a), confirming the partially-overlapping presence of a zinc-rich feature. d) Overview EDS spectrum integrated across the tissue cross section, showing iron as well as zinc. Peaks for common organic elements (carbon (C), phosphorus (P), sodium (Na), sulfur (S)) are present, as well as silicon (Si) and oxygen (O) from the glass. The blue box indicates the energy space relevant for identifying iron and zinc in our specimens. This spectral range is shown for the remaining specimens in Fig. 4. The blue line depicts a background fit.
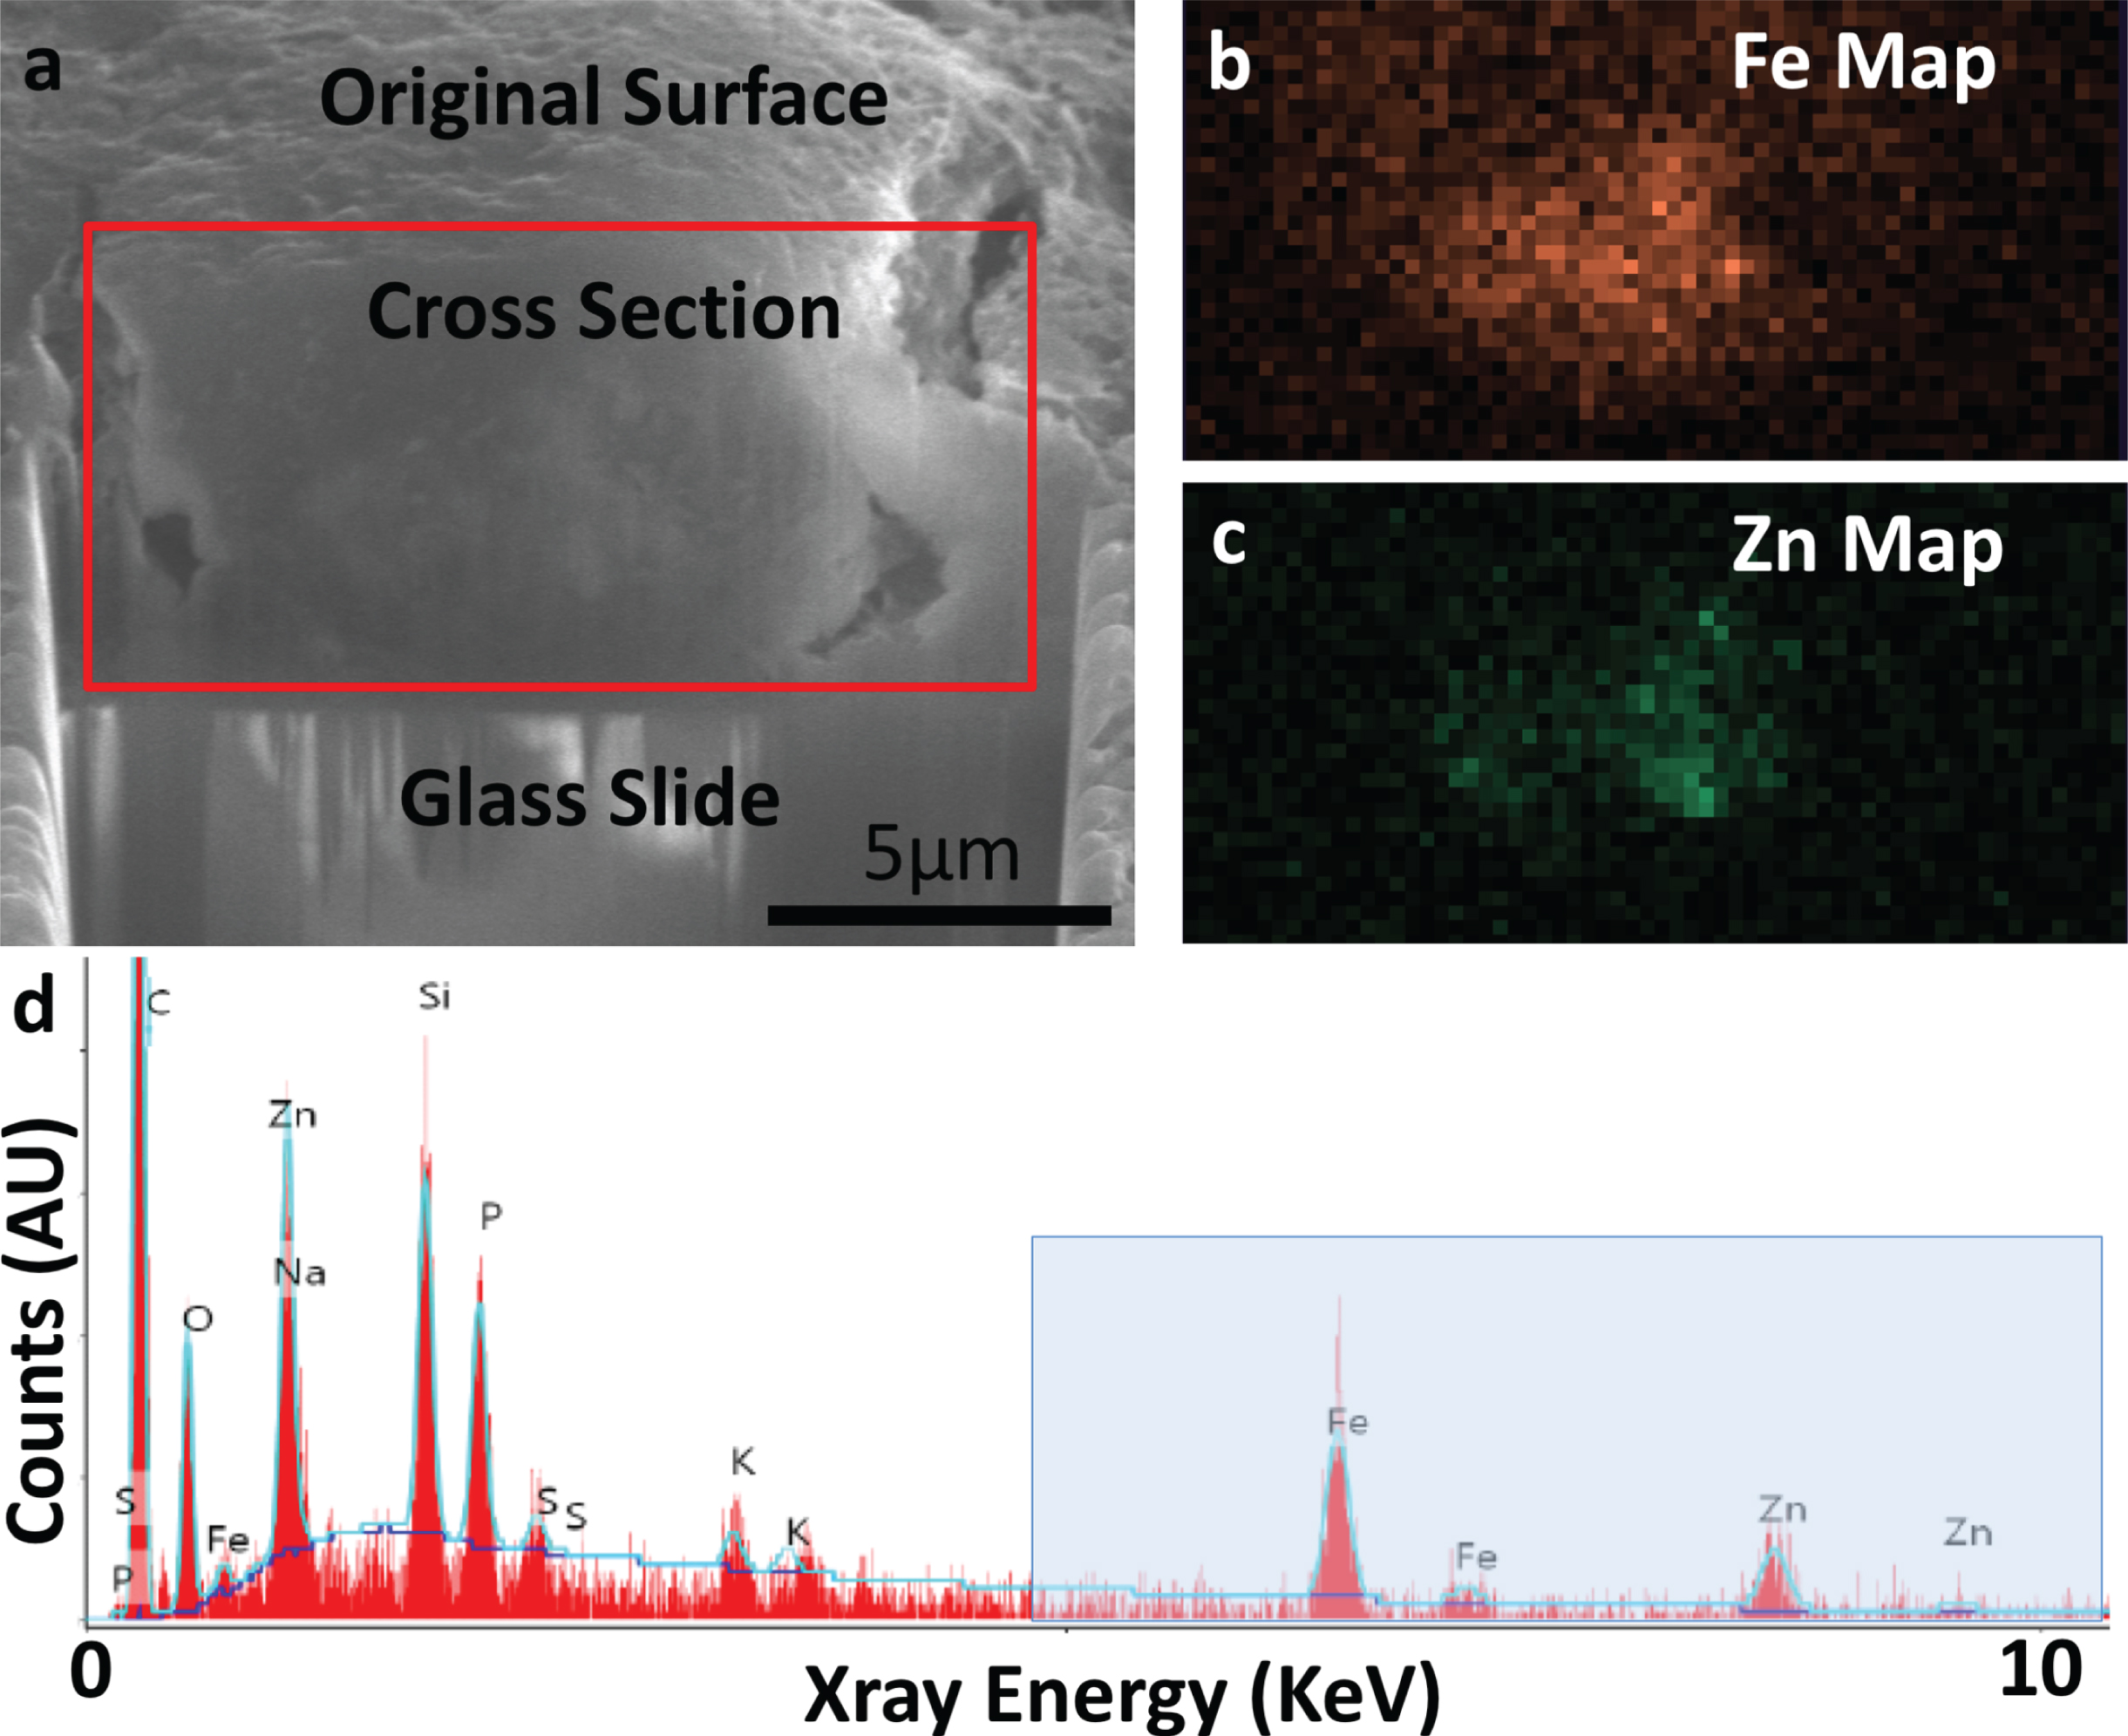
Fig. 4
MRI, optical microscopy, SEM, cross-sectional SEM and EDS of specimens A1, A3, and A4 demonstrating the presence of iron in each. MRI: High-resolution MRI demonstrates clear hypointensities concentrated in the subiculum. OM: Optical microscopy of each specimen, with the yellow box visualizing a higher-resolution inset of iron-positive foci highlighted by the yellow arrow(s). SEM: Top-down SEM of the region in yellow box from OM, demonstrating matching regions across modality. The green box shows a higher resolution inset of visible raised features, rotated to match the plane of SEM/EDS. For A3, the SEM is rotated 90 degrees compared to OM. SEM/EDS: Cross-sectional FIB-SEM and SEM-EDS iron map proving the presence of iron in each raised feature. Spectra: Overview EDS spectrum from region outlined by blue circle in SEM/EDS, showing the presence of iron (Fe) in all specimens, as well as zinc (Zn) in A1 and A4.
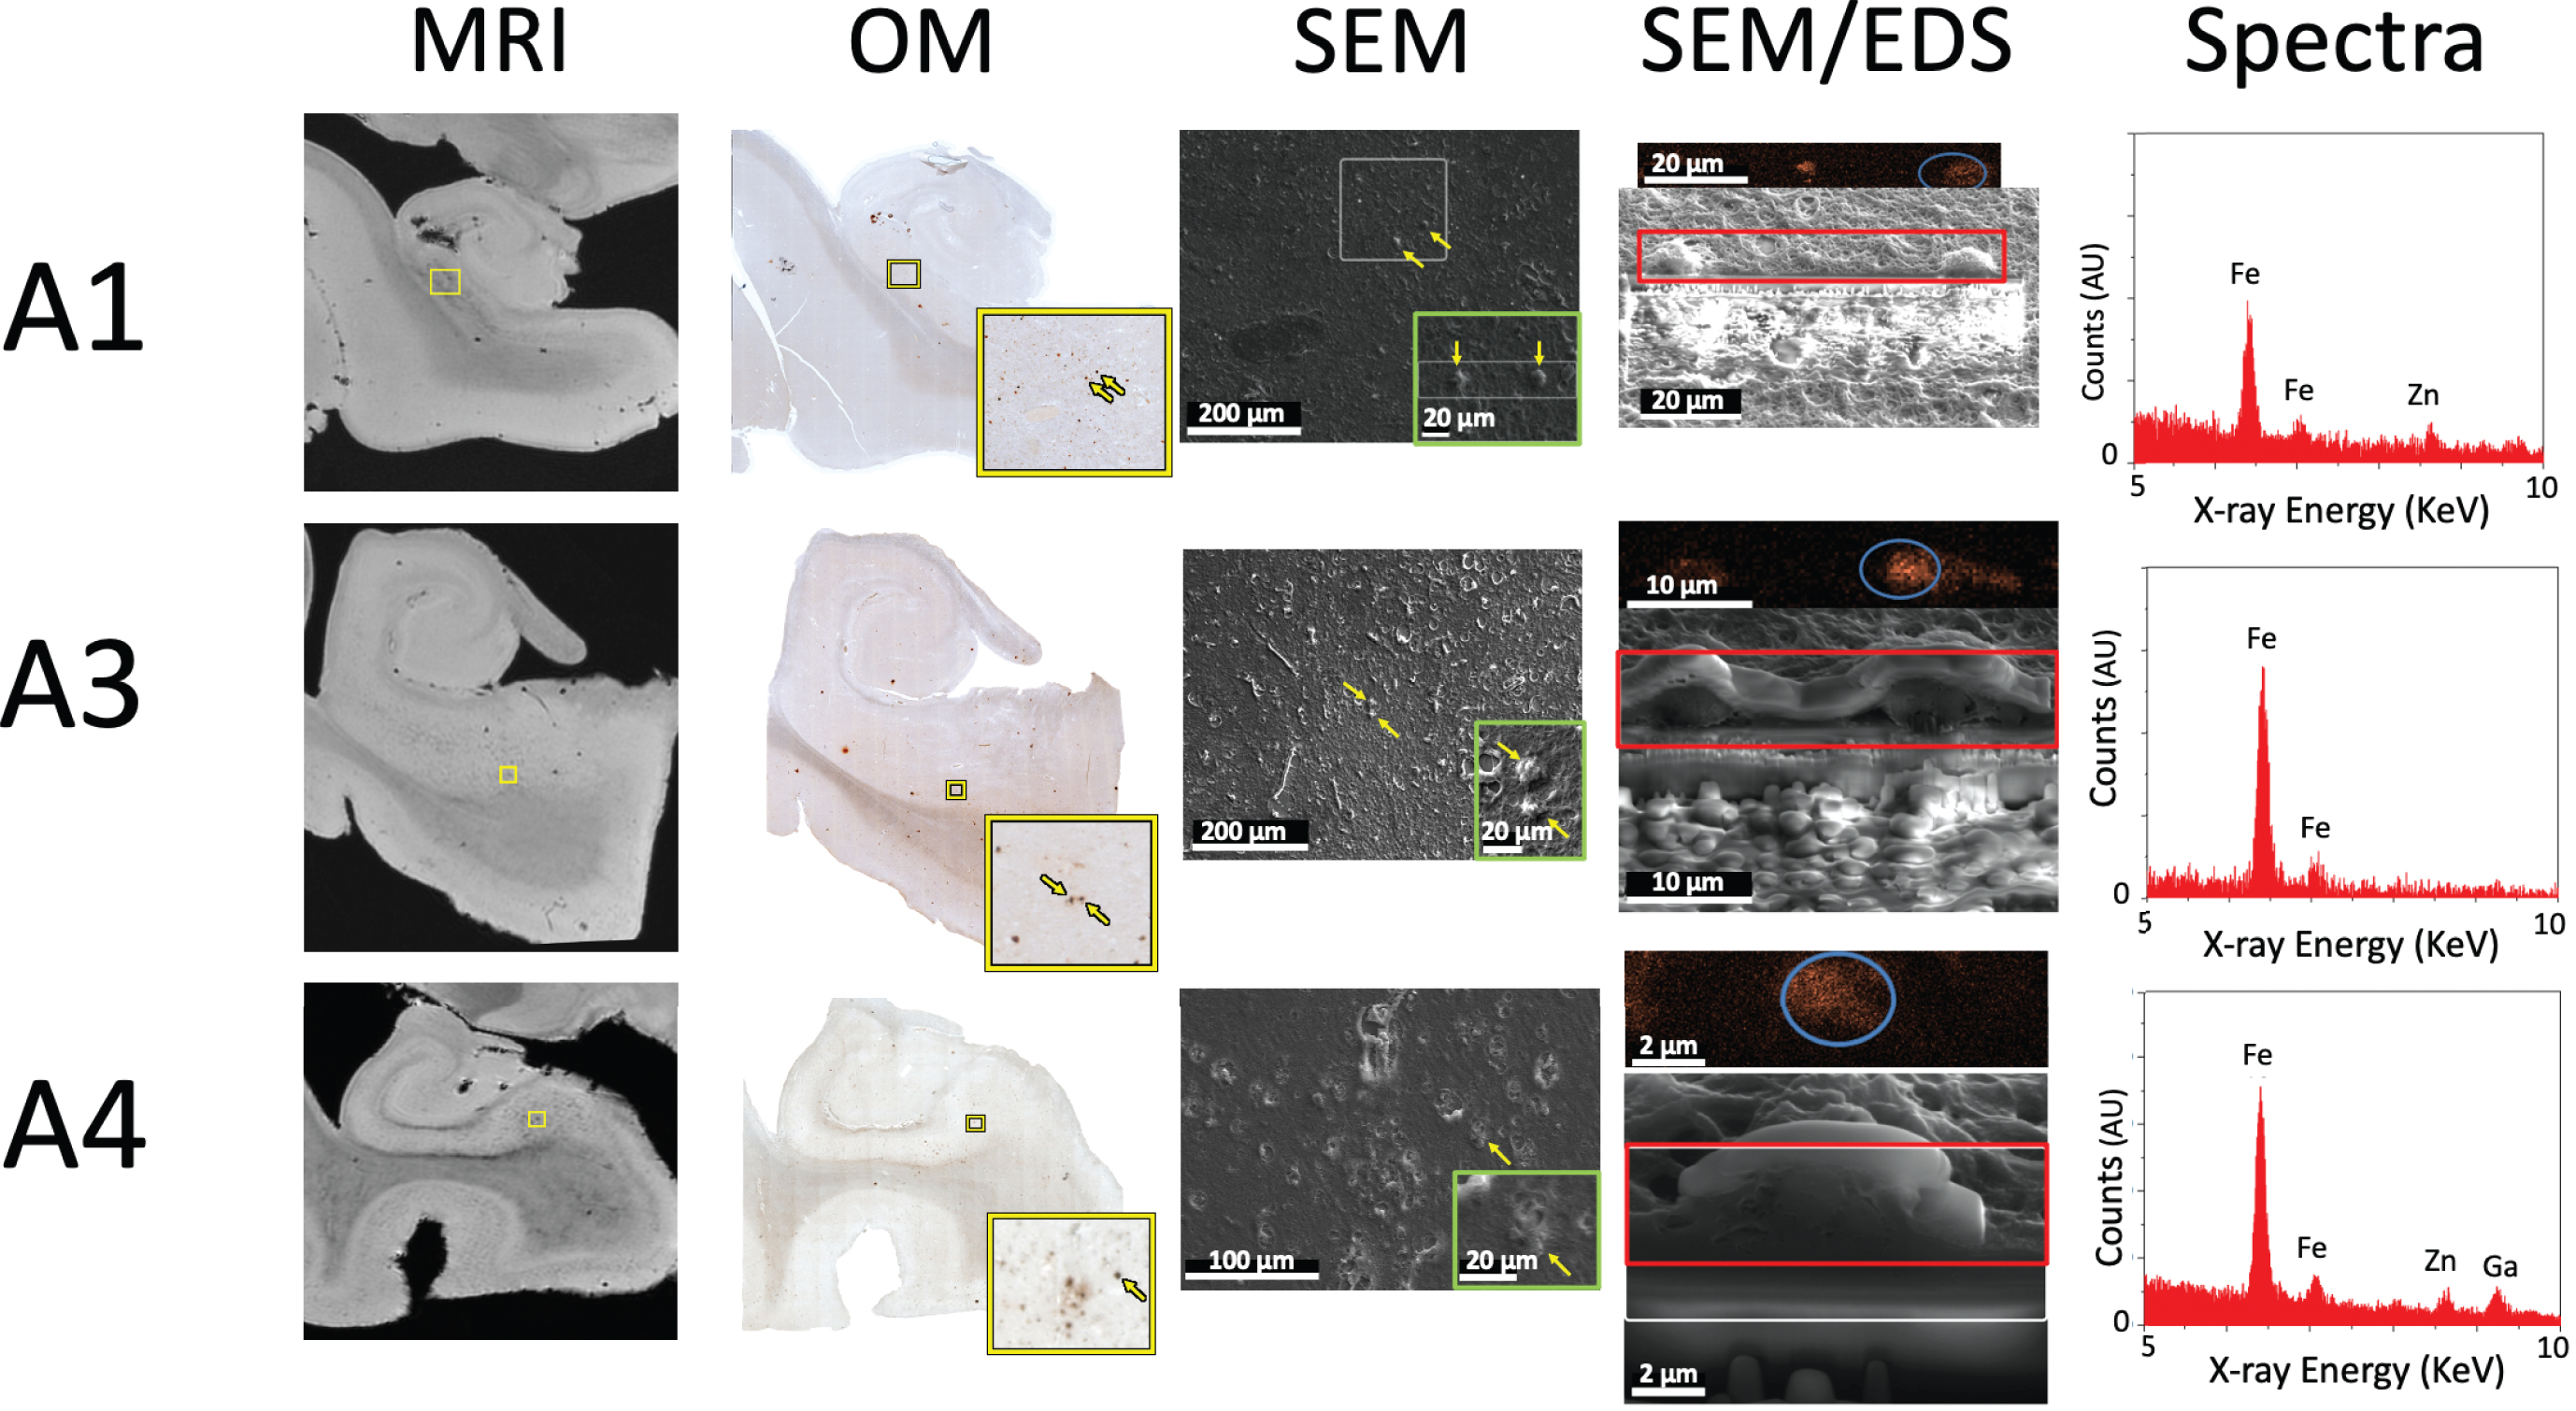
Fig. 5
a) Optical microscopy of each specimen from the same locations as in Figs. 1 and 4, with brown indicating iron, red indicating Aβ, and blue indicating CD163-positive microglia. The yellow arrows specify the specific iron deposits analyzed using electron microscopy techniques in Figs. 1–4 above and are displayed at higher magnification in the yellow box. b) Optical microscopy of the approximate same location on adjacent tissue sections visualizing phospho-tau (brown stain) in the expected vicinity of metal deposits analyzed in this study. The higher resolution images in the yellow boxes depict clear tau-positive stain reflective of neurofibrillary tangles and neuropil threads. Scale bars in main images are 100μm; scale bars in insets are 50μm.
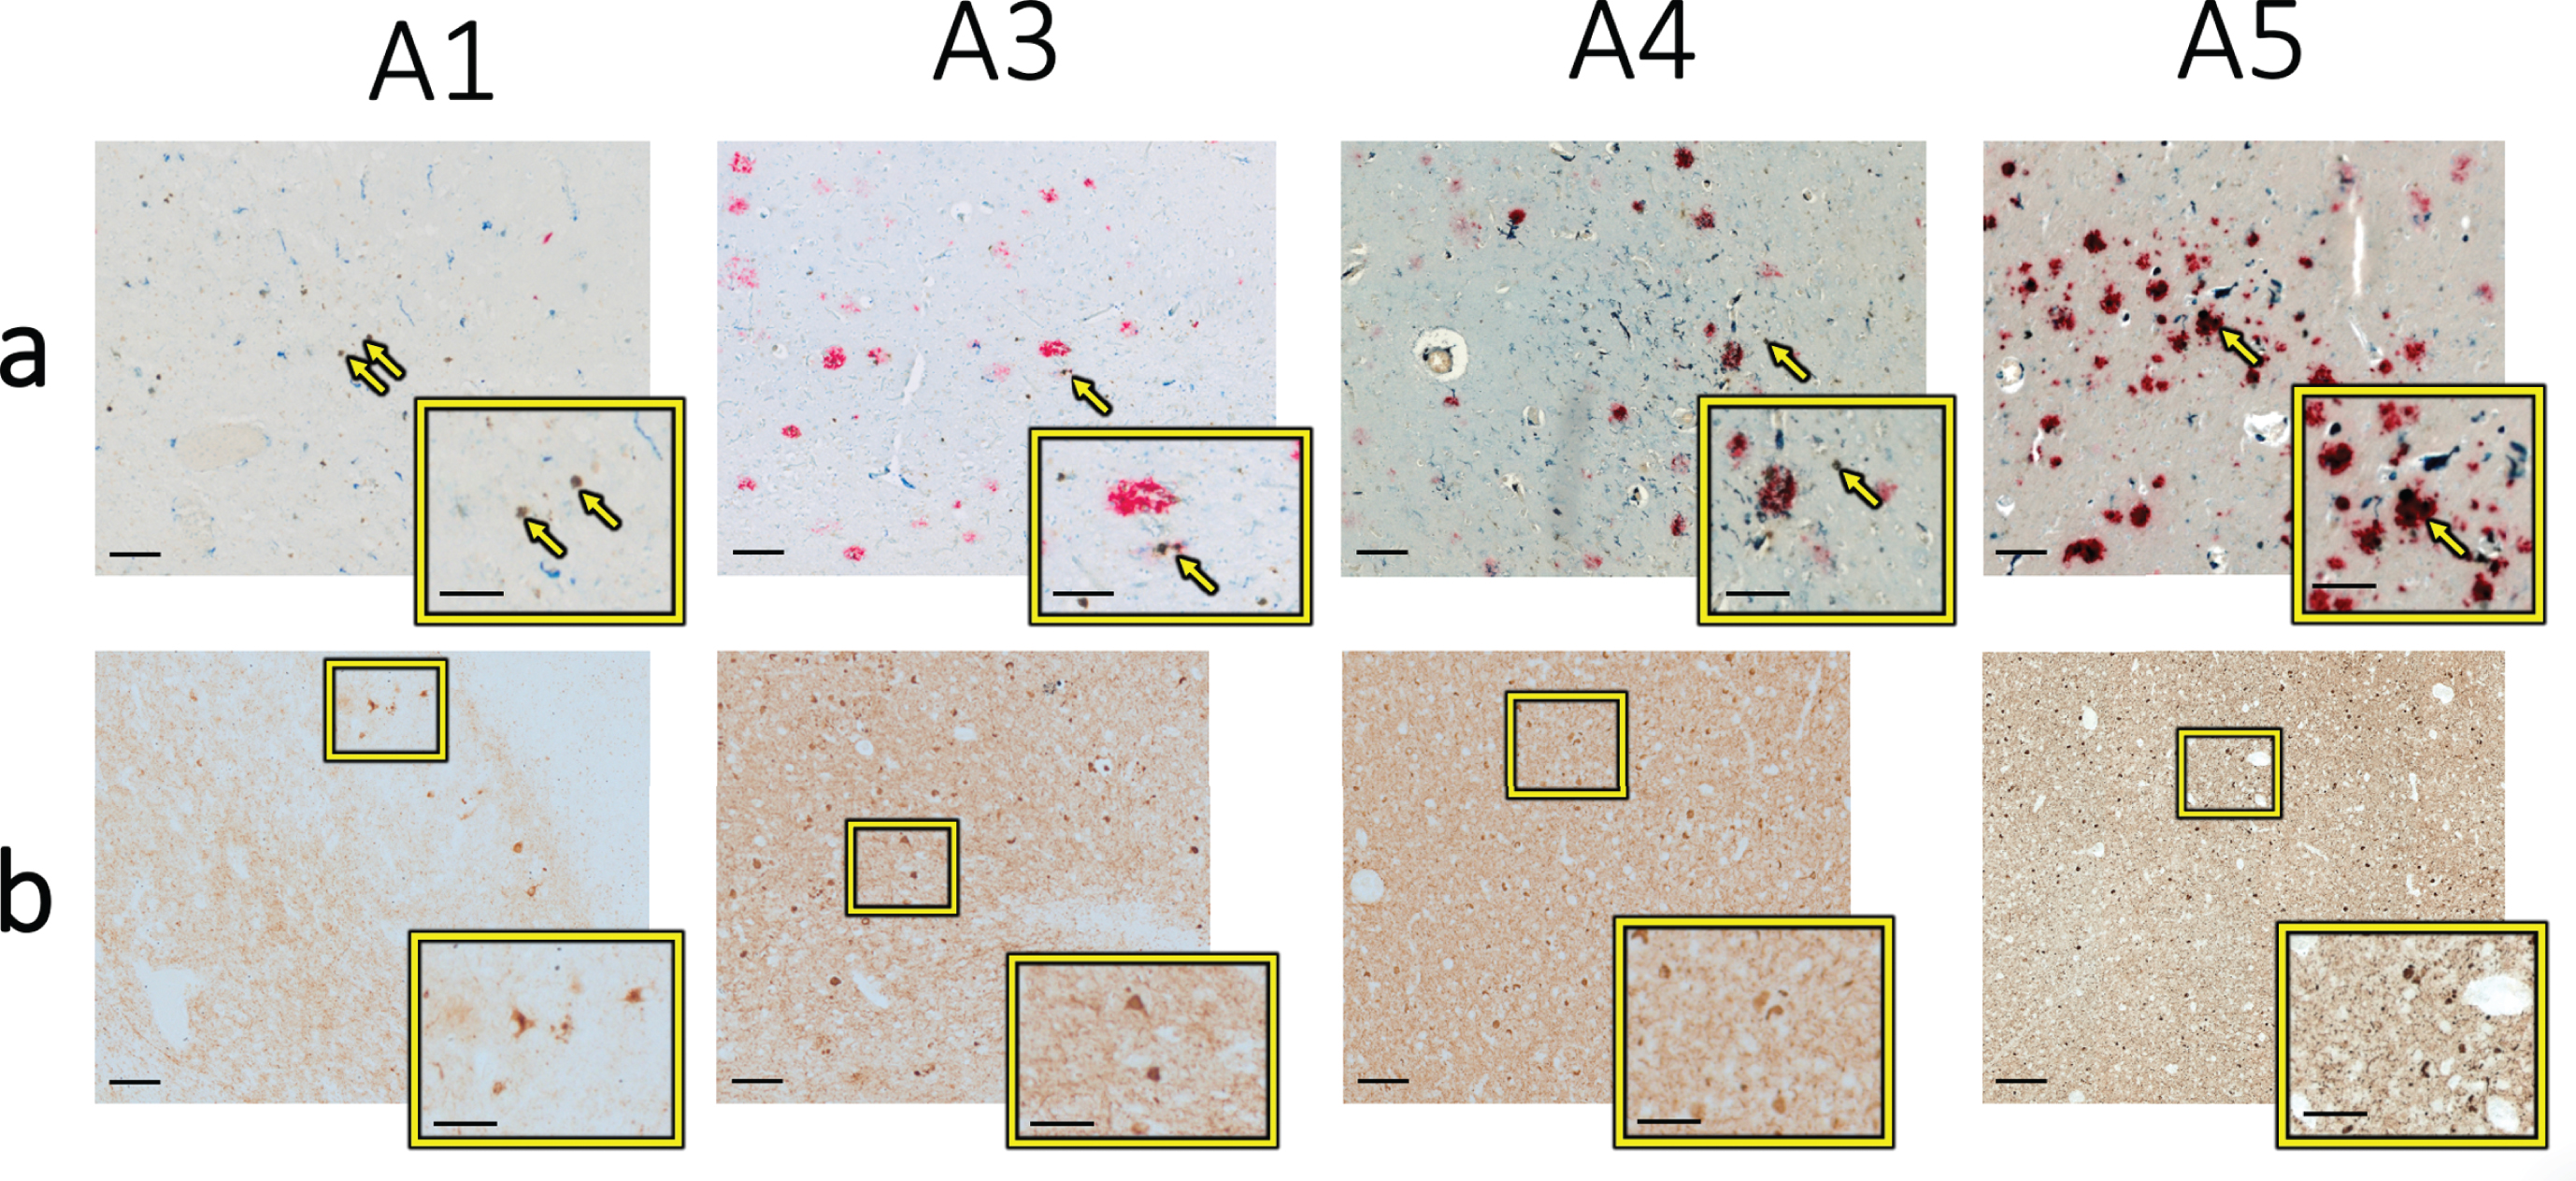
Fig. 6
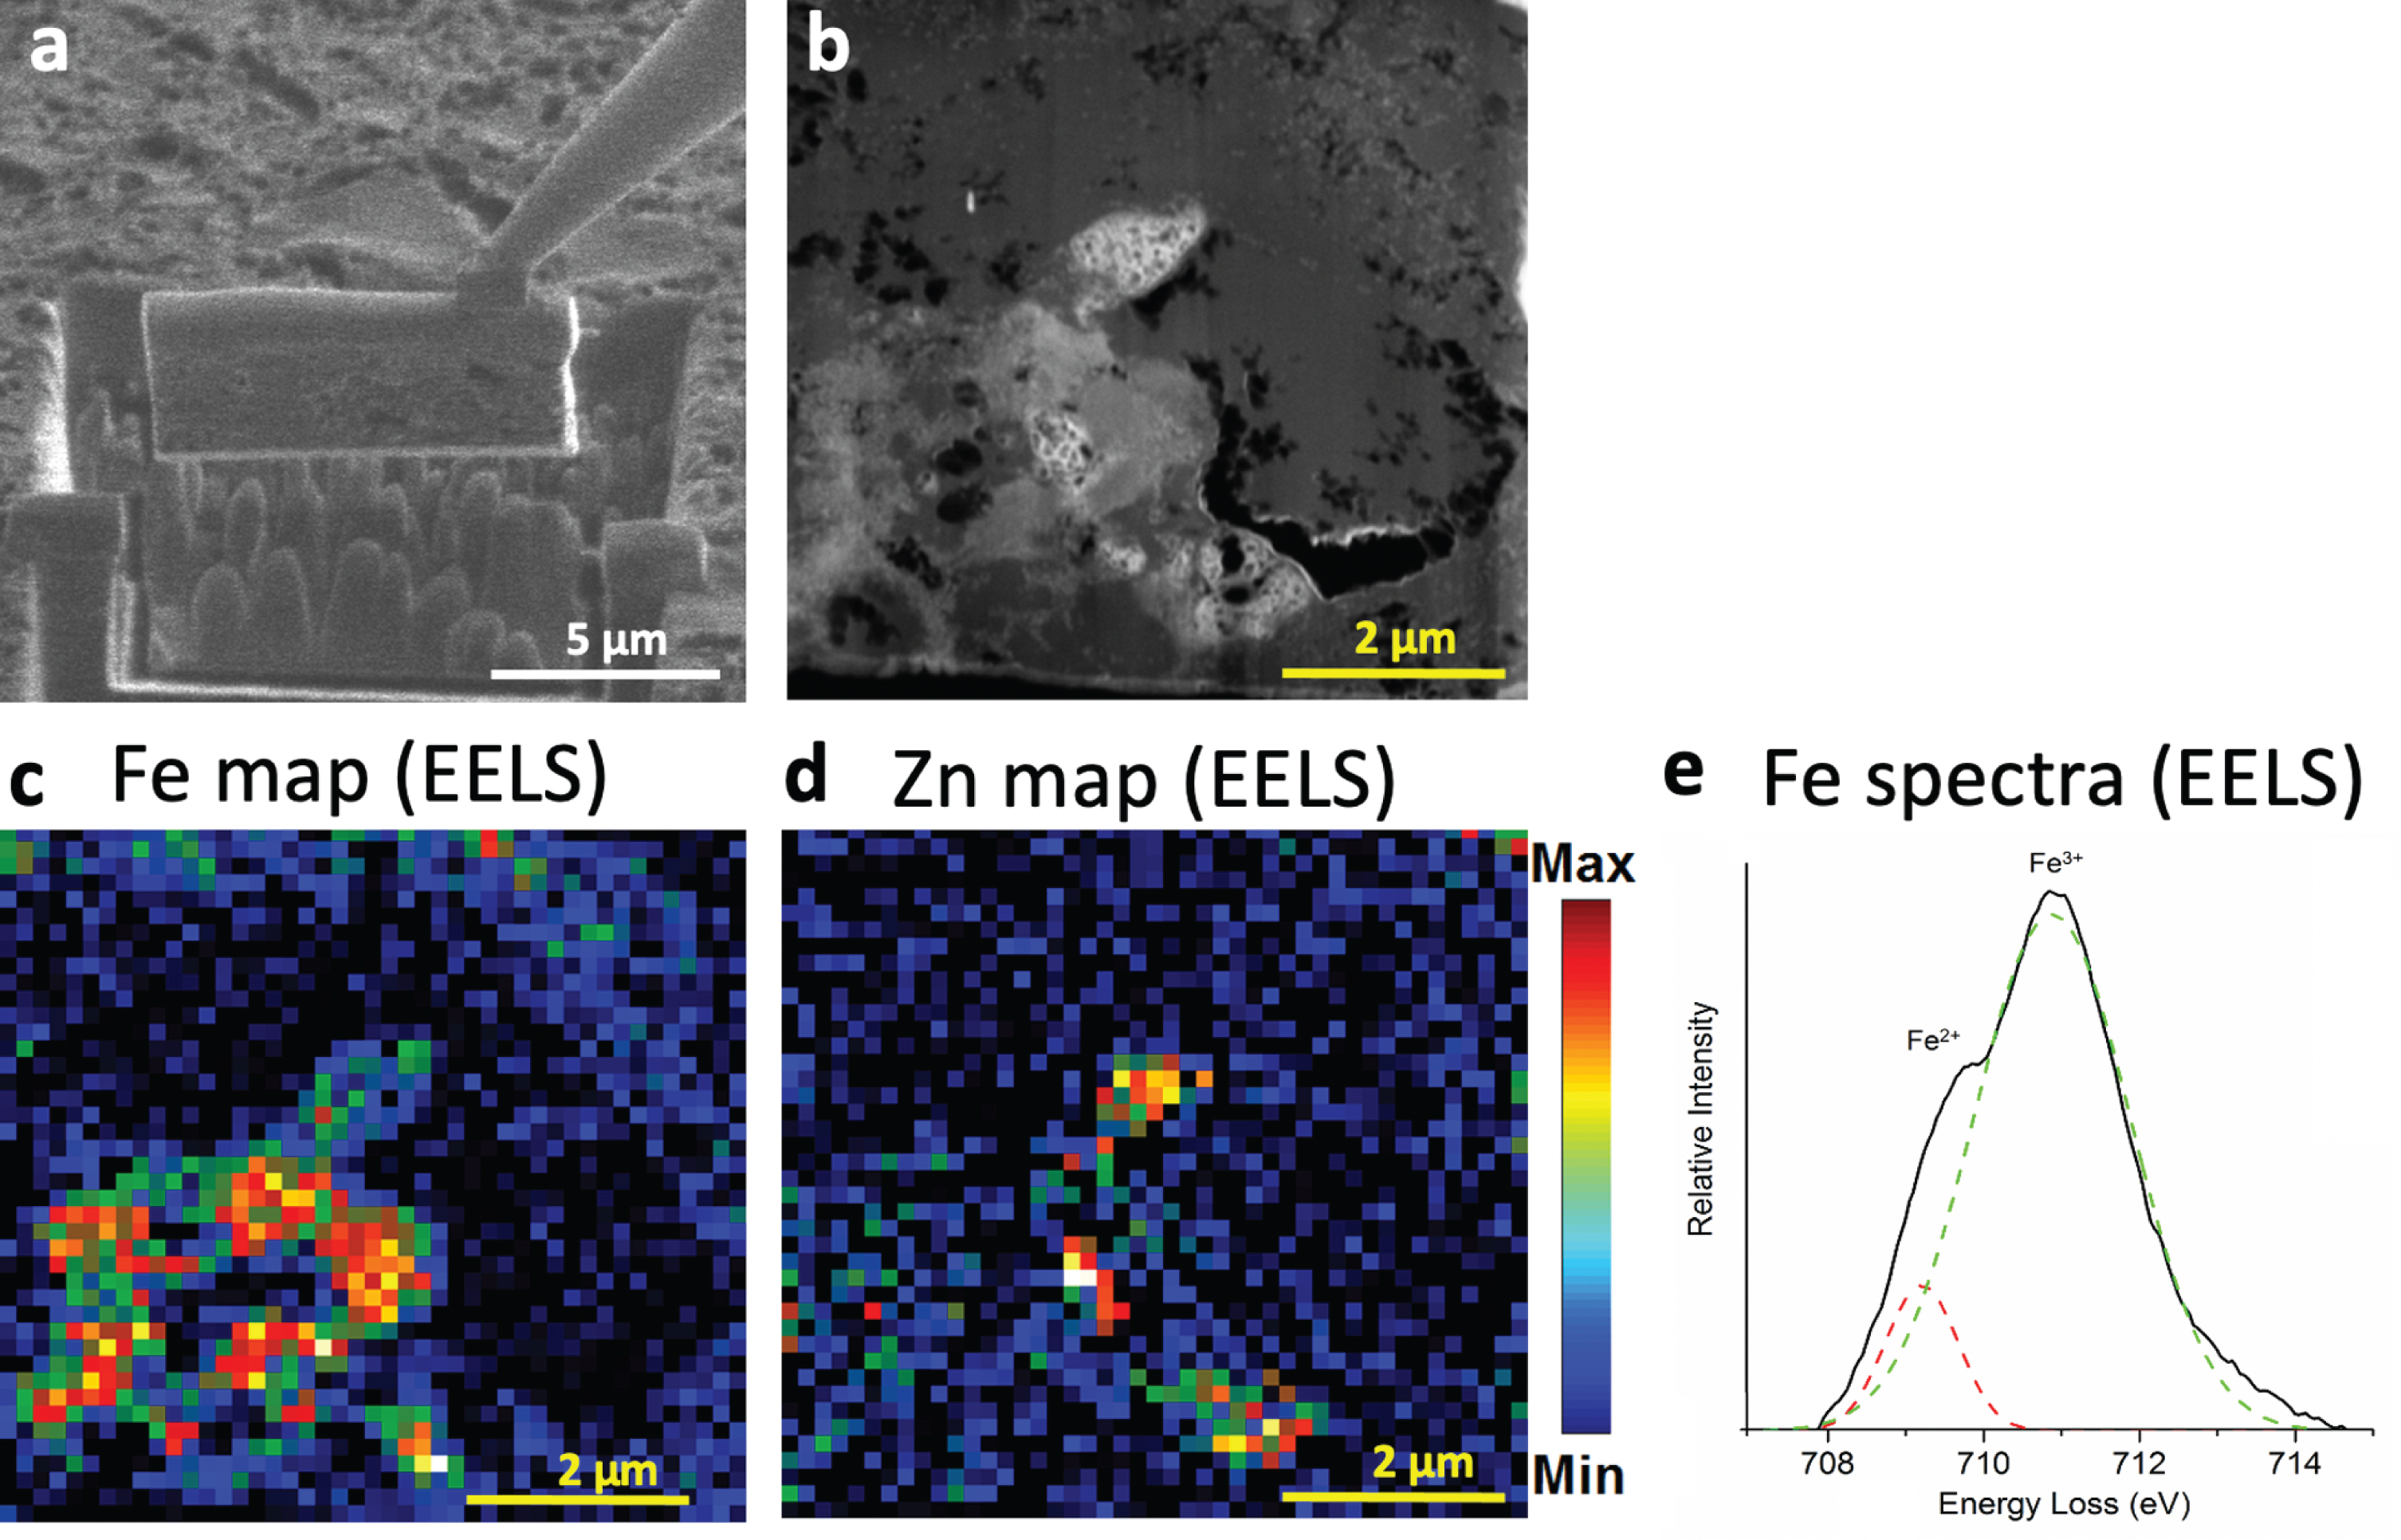
FIB liftout and STEM-EELS of specimen A5 providing higher-resolution mapping of iron and zinc distributions. a) Visualization of the FIB extraction procedure from the red line in Fig. 3a. b) Annular dark field STEM micrograph of the thinned tissue containing the metal deposit. The black regions are holes or pores in the tissue. Brighter regions contain more high Z elements. c) iron (Fe) and (d) zinc (Zn) EELS maps of the region outlined in B. Both metals are present, but unevenly distributed with low amounts of overlap. Monochromated EELS spectra of the same iron rich region from Fig. 5 is shown in (e). Peak fitting shows splitting of the L3 peak of iron preliminarily suggesting the presence of Fe2+.
STEM
A FEI Titan 80–300 monochromated environmental (scanning) transmission electron microscope (FEI Thermo Fisher, Hillsboro, OR) was used to obtain more detailed spectroscopic images of iron deposits on this FIB-extracted and thinned specimen (Fig. 6b).
STEM-EELS
The FEI Titan microscope was used to perform STEM-EELS spectrum imaging to generate high-resolution (roughly 150 nm in the current experiments) elemental distribution maps of iron and zinc from this one specimen (Fig. 6c, d). Then, for each specimen, the monochromator was excited to collect a spectrum image of an iron deposit from with greater energy resolution (measured full width at half maximum through the sample was 0.2 eV) (Figs. 6e and 7). Fourier log deconvolution was performed on the spectra in DigitalMicrograph software to remove plural scattering effects [25]. 120 spectra were summed and power-law background subtracted. Further background subtraction was performed using an arctan fit, according to [26]. Two Gaussian functions were fitted to the data using OriginPro software to illustrate the splitting of the Fe L peak by oxidation state into Fe2+ and Fe3 + . The total dose for each specimen is approximately 106-107 electrons/nm2. We did not observe sample damage during acquisition, likely due to the fine electron probe and a large step size allowing proper heat dissipation [27].
Fig. 7
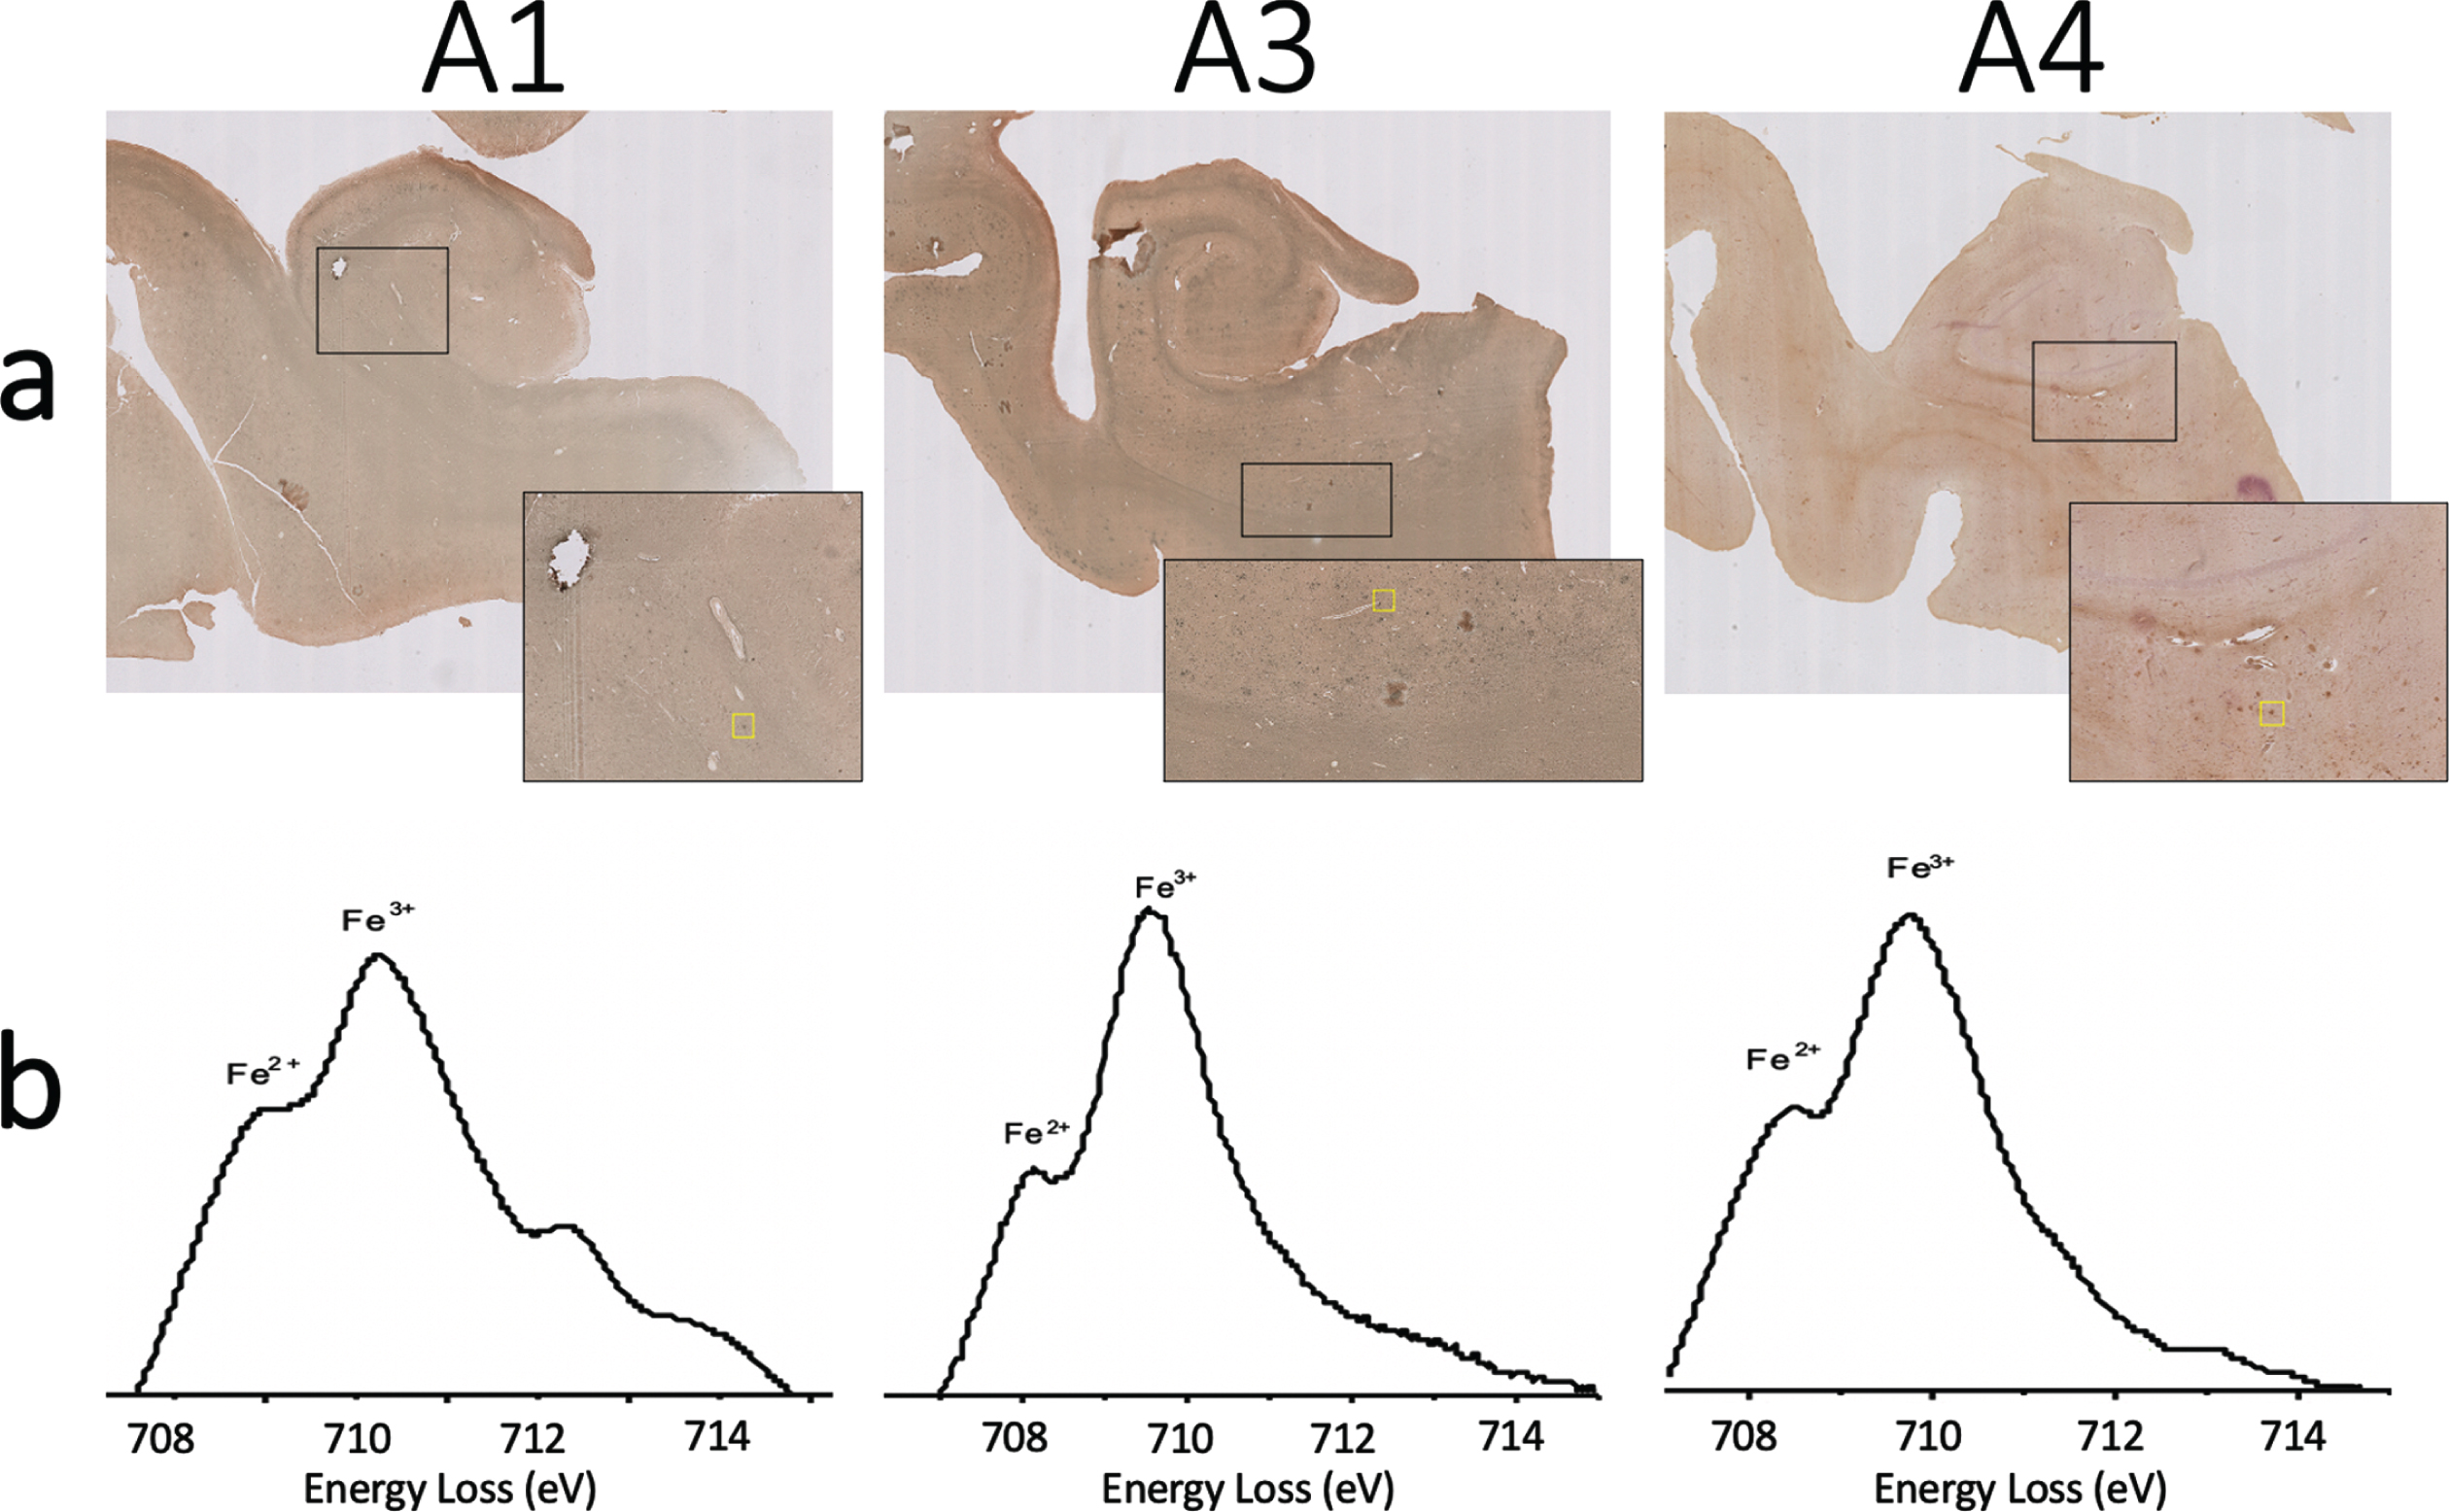
a) Iba-1 and ferritin immunohistochemistry double stain and (b) monochromated EELS spectra of the iron rich regions shown in yellow box from (a) for specimens A1 (left), A2 (center), and A3 (right). Splitting of the L3 peak of iron suggests the presence of Fe
RESULTS
SEM can identify iron deposits visualized on MRI and optical microscopy
Figure 1a-c shows coregistered high resolution MRI and optical microscopy of specimen A5. The MRI depicts subicular iron deposits that are seen in greater detail in the histology stains [18]. While the contrast mechanisms for electron and optical mi-croscopy are substantially different, the same features can be identified manually with visual inspection across both techniques, with iron deposits, vessels, and tissue tears indicative of an approximate coregistration (Fig. 1c, d). The heavily stained region identified in the histology image (marked by the green box in Fig.1c, d) was selected for further SEM-EDS elemental analysis.
SEM-EDS confirms presence of iron seen on histology
A higher magnification SEM image of the boxed region from Fig. 1c and d is shown in Fig. 2a. An SEM-EDS spectrum image was collected from this region. A map of the signal intensity at 6.4 keV, corr-esponding to the characteristic energy of Fe Kα X-rays, confirms with specificity that the selected region contains iron (Fig. 2b), providing further validation of the accumulation of iron in the AD hippocampus.
FIB-SEM can cross section and characterize iron and zinc using EDS on individual iron deposits
The dual-beam capabilities of the FIB-SEM al-low for ion-beam cutting and SEM respectively, and these were employed to take a cross section of the iron deposit in Fig. 2 and examine the deposit along its depth (Fig. 3a). The exposed face was imaged with the electron beam and SEM-EDS mapping was performed, again confirming the presence of iron (Fig. 3b). Examining other elements showed the presence of zinc partially overlapping with iron within the same deposit (Fig. 3c). A spectrum integrated across the whole image confirmed peaks corresponding to Fe Kα X-rays at 6.4 keV and Zn Kα X-rays at 8.6 keV (Fig. 3d, the most clearly separable and easily quantified peaks are seen at right).
Similar correlations between MR hypointensities in the subiculum, iron deposits on optical microscopy, and iron using EDS, were found in the other three samples (Fig. 4). Thus, across the four specimens, hypointensities found on MRI and histology were confirmed to represent iron with electron microscopy. This supports the potential use of MRI as an in vivo measure of iron in the AD brain.
Because zinc (like iron) can be related to oxidative stress in AD (see [28], for review) and zinc is measurable with EM, we also examined zinc across the four specimens. Two of the four contained measurable quantities of zinc, as shown by a defined EDS peak above the noise floor, and low iron-to-zinc ratios (A1:3.0, A5:1.5), while the other two did not show a clearly defined peak and had higher ratios (A3:10.9, A4:4.8).
Correlative microscopy can enable detailed spatial analysis of metal deposition and hallmarks of molecular AD pathology
Sections from each of these specimens had previously been stained for Aβ plaques [18]. Because iron is known to interact with Aβ directly (see [1], for review) we subsequently analyzed the spatial ove-rlap of Aβ plaques with iron identified here by EM (Fig. 5a). In specimen A5, there is clear spatial ove-rlap of intense Aβ staining and the analyzed iron deposition, while in the other three specimens (A1, A3, and A4) only mildly intense overlapping or nea-rby staining is seen. In comparison, there was clear overlap with microglia staining, as previously published [18]. Likewise, adjacent sections from each specimen analyzed here had been previously stained for phospho-tau and coregistered to the iron stain (Fig. 5b). In all four specimens, phospho-tau positive staining was visualized in the approximate same location as the iron deposits on the adjacent section, with both neurofibrillary tangles and neuropil threads present. Together, these findings suggest that the iron deposits analyzed here may be localized to microglia and that these microglia accumulate around Aβ plaques in some cases, but that a stronger visual correlation exists between iron deposition and tau pathology.
Because zinc has also been shown to bind Aβ dir-ectly and affect aggregation and plaque formation [29, 30], there may be a molecular interaction bet-ween cortical zinc, neuronal iron accumulation and Aβ pathology, so we also assessed the spatial overlap of iron and Aβ with zinc. In the two specimens where zinc was not found at measurable levels (A3 and A4), Aβ was found in the vicinity of, but only minimally directly overlying, the analyzed iron deposit. In specimen A1 where low levels of zinc were found, minimal levels of Aβ were found in the vicinity of the analyzed iron deposit. In specimen A5 where high levels of zinc were found, high levels of Aβ were found directly overlying and surrounding the analyzed iron deposit. Thus, only one specimen was found to have a high level of zinc-amyloid overlap in this limited initial analysis.
Liftout from FIB cross-sectioning can undergo detailed characterization with STEM-EELS to assess oxidation state
In order to examine the metal-containing deposit from one specimen in more detail and at higher resolution, the FIB was used to extract and thin the deposit shown from Fig. 3a for STEM and spectro-scopy (Fig. 6a). We obtained an annular dark field STEM image (Fig. 6b), in which regions which have greater thickness or atomic number are more highly scattering, causing them to appear bright, and tissue pores appear dark. The thickness of the sample was relatively uniform as a consequence of using the FIB thinning approach (aside from holes in the section, seen as black contrast in the image), so brighter regions indicated the presence of higher Z elements.
We then used EELS image to perform elemental mapping at higher resolution than SEM-EDS. The EELS analysis of sample A5 illustrates that iron and zinc are both present but not evenly distributed (Fig. 6c, d). The moderately bright areas in the dark field STEM are shown to contain primarily iron, whereas the three regions with the brightest contrast are enriched in zinc, with less overlap between the distributions observed at this high resolution compared to the relatively coarse resolution of Fig. 3.
In order to assess oxidation state, monochromated EELS spectra were collected from the same field of view as Fig. 6. This spectral data provides greater energy resolution to enable discrimination of ferric Fe3+ from ferrous Fe2+ iron (Fig. 6e). Previous studies have shown splitting of the iron L3 peak, with the ratio of the two component peak intensities reflecting oxidation state [26]. The higher energy peak intensity is larger in Fe3+ containing minerals, while the lower energy peak intensity dominates for Fe2+. Fitting of the peaks in specimen A5 suggests the partial presence of Fe2+ (Fig. 6e). These same methods were performed to acquire spectra on deposits identified using the double-stain ferritin/microglia slides (without Perl’s iron staining or DAB enhancement) acquired on specimens A1, A3, and A4. Fitting of the peaks on the monochromated EELS spectra from each of these specimens also suggests partial presence of Fe2+ (Fig. 7). Thus, all AD specimens studied were confirmed by EELS to have partial presence of Fe2+. This provides support for the hypothesis that the accumulation of ferrous iron in the AD brain may be a source of toxic reactive oxygen species and subsequent oxidative stress and neurotoxicity.
DISCUSSION
Building upon our prior work, which showed that hypointensities located in AD hippocampal specimens identified using ultra-high field 7T ex vivo MRI represented iron deposits in microglia, this study utilized surface and cross-sectional SEM-EDS on selected foci in four AD specimens to validate the presence of iron. A similar analysis was able to identify measurable quantities of zinc in two of the four specimens. Aβ plaques were identified directly spatially overlapping the analyzed iron deposit in one specimen, and adjacent but not overlapping to the iron deposits in the other three specimens. Phospho-tau positive staining was colocalized in the approximate same location as iron deposits on adjacent histology sections in all specimens. Higher-resolution analysis using STEM-EELS confirmed the presence of iron, and on a single specimen demonstrated distinct localization patterns of iron and zinc. An analysis of all four AD specimens with monochromated EELS spectra resolved the oxidation state of iron-rich features in these specimens and suggested the presence of Fe2+.
The presence of iron, and in particular the suggestion of any amount of ferrous Fe2+, in our samples provides further support for the hypothesis that elevated amounts of ferrous Fe2+ in AD [12–14] can produce free radicals via Fenton chemistry and cause oxidative damage and antioxidant depletion leading to neurodegeneration. These prior studies did not integrate iron accumulation and oxidation state with the context of Aβ and tau pathology to assess the mechanistic link with ferrous Fe2+ [31, 32]. Our current work preserves the biological structures within human tissue to enable combined EM and optical microscopy, making it possible to relate the presence of iron with other signs of pathology with high spatial specificity. Although there are studies producing samples for TEM analysis by ultramicrotomy of fixed and embedded tissues [14], that method is less efficient and reproducible as these iron deposits are rare events even in pathological brain tissues. Furthermore, our work bridges MRI and electron microscopy, justifying the development of MRI as a method to measure iron, a meaningful micropathological feature of AD.
The spatial overlap between these well-characte-rized iron deposits and Aβ and tau preliminarily suggests a link that is strongest with tau-based neurodegeneration. While there was a strong visual ove-rlap of iron and Aβ staining in one specimen (A5), the overlap of these two features is limited in the other analyzed three specimens. However, with traditional histology we are able to visualize only Aβ plaques, not oligomers or protofibrils. Exploration of the relationship between these other Aβ species and iron deposition may help decipher the link at the earliest stages of disease. Likewise, there are certainly microglia present around Aβ plaques and Aβ is also known to bind iron directly, so determining whether iron found in or near Aβ plaques is contained within microglia or is extracellular may provide additional understanding of the role of iron in AD. Nevertheless, because we see a stronger overlap with tau, we can speculate that iron deposition is more directly linked to tau-related neurodegeneration and disease phenotype [33–36]. Because the accumulation of free radicals has been shown to induce tau hyperphosphorylation through mitochondrial stress, the correlation we observe of iron and tau provides support for iron serving as a possible link between Aβ pathology and tau-based neurodegeneration. However, it must be noted that the specimens analyzed in this study were from subjects with more advanced disease. To further test this hypothesis, future work will need to investigate iron progression and its spatial overlap with tau throughout the stages of disease. Additionally, due to limitations in our tissue processing, the correlation between tau and iron deposition is across adjacent sections. Our future work will analyze these pathologies in the same section.
The present methods demonstrate their ability to analyze with high spatial specificity the overlap of iron with other redox metals, such as zinc. This preliminary work suggests that zinc and iron are sometimes present adjacent to one another in AD. Cortical zinc has been shown to bind with Aβ and is enriched in Aβ plaques in the AD brain and preliminary work has shown that the binding of zinc with amyloid may cause the production of toxic species, which may accelerate pathological spread and disease progression [29, 30]. In the present work, specimen A5 demonstrated the highest levels of overlapping Aβ and zinc along with dense deposition of iron. The interaction between Aβ and zinc and potential synergy with iron accumulation will be the subject of future investigation. Given the limited sample size and the variability in staining across the specimens, it is difficult to draw strong conclusions from this analysis, but these preliminary data suggest there may be an interaction between Aβ and zinc which may result in greater iron accumulation and associated toxicity, warranting further investigation. Further characterization of zinc deposition in a greater sample size of AD and control samples utilizing zinc staining and EM could more specifically elucidate mechanistic links between iron, zinc, and AD progression.
Each of the four specimens analyzed in this study possessed advanced AD pathology, but accumulation of iron-containing microglia may be variable in and across the stages of AD. While we aimed to analyze control specimens in this study, the present methods did not identify suitable control iron deposits for quantitative analysis because with limited or no prior knowledge of the positions of relatively rare metal deposits in the tissue, SEM-EDS is a cumbersome method to locate deposits. Future work involving a larger sample size composed of different pathological stages of AD and different brain sites with an age-matched control population and the development of alternative strategies to identify iron deposits in control specimens could clarify these issues. One alternative is to use nanoscale resolution X-ray fluorescence imaging (XFI) [37–39] to iron-rich regions, and use FIB-SEM to locate and extract these regions for high resolution imaging and spectroscopy in the TEM, though the resolution of XFI is considerably lower, at most approximately 2μm. Similarly, other spectroscopic techniques, such as X-ray absorption spectroscopy (XAS) could be used to validate our EM findings and guide location selection for FIB-SEM.
While we purposefully utilized a staining pro-tocol that did not directly stain for iron, the proce-ssing and preparation of samples, including fixing, staining, dehydrating, mounting, and leaving at room temperature during MRI scanning can influence the accurate measurement of iron and its oxidation state [40, 41], as well as electron microscopy itself [42]. Future work will involve frozen specimens to avoid many of these confounders (which similarly exists for zinc). Additionally, frozen control tissue from the basal ganglia, a region that is known to have iron deposition, will be used for comparison.
This work confirms that iron deposits identified via MRI and histology can be localized and analyzed using EM techniques and proven to represent iron, and undergo nanoscale spatial analysis and discernment of oxidation state. Such analyses may enable novel basic research into the molecular mechanisms linking iron accumulation, neuroinflammation, and hallmark AD pathology. Future studies will utilize reference standards to quantify the relative oxidation state of these iron deposits and of zinc content across the stages of AD, as well as more sophisticated MRI techniques, including R2* and quantitative susceptibility mapping (QSM), which may foster the discovery of novel molecular targets for therapeutic intervention or translational imaging biomarkers.
CONFLICT OF INTEREST
The authors have no conflict of interest to report.
ACKNOWLEDGMENTS
The authors would like to acknowledge the continued support of the Stanford Alzheimer’s Disease Research Center (ADRC) for this research. Dr. Zeineh has been supported by the Doris Duke Charitable Foundation and the Dana Foundation. Steven Madsen was supported by the Center for Cancer Nanotechnology Excellence for Translational Diagnostics (CCNE-TD) at Stanford University through an award (grant no: U54 CA199075) from the National Cancer Institute (NCI) of the National Institutes of Health (NIH).
SUPPLEMENTARY MATERIAL
[1] The supplementary material is available in the electronic version of this article: https://dx.doi.org/10.3233/ADR-200234.
REFERENCES
[1] | Ward RJ , Zucca FA , Duyn JH , Crichton RR , Zecca L ((2014) ) The role of iron in brain ageing and neurodegenerative disorders. Lancet Neurol 13: , 1045–1060. |
[2] | Connor JR , Snyder BS , Beard JL , Fine RE , Mufson EJ ((1992) ) Regional distribution of iron and iron-regulatory proteins in the brain in aging and Alzheimer’s disease. J Neurosci Res 31: , 327–335. |
[3] | Collingwood JF , Mikhaylova A , Davidson M , Batich C , Streit WJ , Terry J , Dobson J ((2005) ) In situ characterization and mapping of iron compounds in Alzheimer’s disease tissue. J Alzheimers Dis 7: , 267–272. |
[4] | Rodrigue KM , Haacke EM , Raz N ((2011) ) Differential effects of age and history of hypertension on regional brain volumes and iron. Neuroimage 54: , 750–759. |
[5] | Antharam V , Collingwood JF , Bullivant JP , Davidson MR , Chandra S , Mikhaylova A , Finnegan M , Batich C , Forden JR , Dobson J ((2012) ) High field magnetic resonance microscopy of the human hippocampus in Alzheimer’s disease: Quantitative imaging and correlation with iron. Neuroimage 59: , 1249–1260. |
[6] | Szabo ST , Harry GJ , Hayden KM , Szabo DT , Birnbaum L ((2015) ) Comparison of metal levels between postmortem brain and ventricular fluid in Alzheimer’s disease and nondemented elderly controls. Toxicol Sci 150: , 292–300. |
[7] | Ayton S , Fazlollahi A , Bourgeat P , Raniga P , Ng A , Lim YY , Diouf I , Farquharson S , Fripp J , Ames D , Doecke J , Desmond P , Ordidge R , Masters CL , Rowe CC , Maruff P , Villemagne VL , AIBL Research Group, Salvado O , Bush AI ((2017) ) Cerebral quantitative susceptibility mapping predicts amyloid-β-related cognitive decline. Brain 140: , 2112–2119. |
[8] | Ayton S , Faux NG , Bush AI , Alzheimer’s Disease Neuroimaging Initiative ((2015) ) Ferritin levels in the cerebrospinal fluid predict Alzheimer’s disease outcomes and are regulated by APOE. Nat Commun 6: , 6760. |
[9] | Silvestri L , Pagani A , Camaschella C ((2008) ) Furin-mediated release of soluble hemojuvelin:Anewlink between hypoxia and iron homeostasis. Blood 111: , 924–931. |
[10] | Guillemot J , Canuel M , Essalmani R , Prat A , Seidah NG ((2013) ) Implication of the proprotein convertases in iron homeostasis: Proprotein convertase 7 sheds human transferrin receptor 1 and furin activates hepcidin. Hepatology 57: , 2514–2524. |
[11] | Rogers JT , Randall JD , Cahill CM , Eder PS , Huang X , Gunshin H , Leiter L , McPhee J , Sarang SS , Utsuki T , Greig N , Debomoy KL , Tanzi RE , Bush AI , Giordano T , Gullans SR ((2002) ) An iron-responsive element type II in the 5’untranslated region of the Alzheimer’s amyloid precursor protein transcript. J Biol Chem 277: , 45518–45528. |
[12] | Collingwood JF , Chong RK , Kasama T , Cervera-Gontard L , Dunin-Borkowski RE , Perry G , Pósfai M , Siedlak SL , Simpson ET , Smith MA , Dobson J ((2008) ) Three-dimensional tomographic imaging and characterization of iron compounds within Alzheimer’s plaque core material. J Alzheimers Dis 14: , 235–245. |
[13] | Pankhurst Q , Hautot D , Khan N , Dobson J ((2008) ) Increased levels of magnetic iron compounds in Alzheimer’s disease. J Alzheimers Dis 13: , 49–52. |
[14] | Quintana C , Cowley JM , Marhic C ((2004) ) Electron nanodiffraction and high-resolution electron microscopy studies of the structure and composition of physiological and pathological ferritin. J Struct Biol 147: , 166–178. |
[15] | Huang X , Atwood CS , Hartshorn MA , Multhaup G , Goldstein LE , Scarpa RC , Cuajungco MP , Gray DN , Lim J , Moir RD , Tanzi RE , Bush AI ((1999) ) The Aβ peptide of Alzheimer’s disease directly produces hydrogen peroxide through metal ion reduction. Biochemistry 38: , 7609–7616. |
[16] | Everett J , Céspedes E , Shelford LR , Exley C , Collingwood JF , Dobson J , van der Laan G , Jenkins CA , Arenholz E , Telling ND ((2014) ) Ferrous iron formation following the co-aggregation of ferric iron and the Alzheimer’s disease peptide β-amyloid (1–42). J R Soc Interface 11: , 20140165. |
[17] | Mondragón-Rodríguez S , Perry G , Zhu X , Moreira PI , Acevedo-Aquino MC , Williams S ((2013) ) Phosphorylation of tau protein as the link between oxidative stress, mitochondrial dysfunction, and connectivity failure: Implications for Alzheimer’s disease. Oxid Med Cell Longev 2013: , 940603. |
[18] | Zeineh MM , Chen Y , Kitzler HH , Hammond R , Vogel H , Rutt BK ((2015) ) Activated iron-containing microglia in the human hippocampus identified by magnetic resonance imaging in Alzheimer disease. Neurobiol Aging 36: , 2483–2500. |
[19] | Morales I , Guzmán-Martínez L , Cerda-Troncoso C , Farías GA , Maccioni RB ((2014) ) Neuroinflammation in the pathogenesis of Alzheimer’s disease. A rational framework for the search of novel therapeutic approaches. Front Cell Neurosci 8: , 112. |
[20] | Guo C , Wang T , Zheng W , Shan ZY , Teng WP , Wang ZY ((2013) ) Intranasal deferoxamine reverses iron-induced memory deficits and inhibits amyloidogenic APP processing in a transgenic mouse model of Alzheimer’s disease. Neurobiol Aging 34: , 562–575. |
[21] | McLachlan DC , Kruck TPA , Kalow W , Andrews DF , Dalton AJ , Bell MY , Smith WL ((1991) ) Intramuscular desferrioxamine in patients with Alzheimer’s disease. Lancet 337: , 1304–1308. |
[22] | Kupershmidt L , Amit T , Bar-Am O , Youdim MB , Weinreb O ((2012) ) The novel multi-target iron chelating-radical scavenging compound M30 possesses beneficial effects on major hallmarks of Alzheimer’s disease. Antioxid Redox Signal 17: , 860–877. |
[23] | Everett J , Collingwood JF , Tjendana-Tjhin V , Brooks J , Lermyte F , Plascencia-Villa G , Hands-Portman I , Dobson J , Perry G , Telling ND ((2018) ) Nanoscale synchrotron X-ray speciation of iron and calcium compounds in amyloid plaque cores from Alzheimer’s disease subjects. Nanoscale 10: , 11782–11796. |
[24] | Finnegan ME , Visanji NP , Romero-Canelon I , House E , Rajan S , Mosselmans JFW , Hazrati LN , Dobson J , Collingwood JF ((2019) ) Synchrotron XRF imaging of Alzheimer’s disease basal ganglia reveals linear dependence of high-field magnetic resonance microscopy on tissue iron concentration. J Neurosci Methods 319: , 28–39. |
[25] | Egerton RF ((2008) ) Electron energy-loss spectroscopy in the TEM. Rep Prog Phys 72: , 016502. |
[26] | Van Aken PA , Liebscher B ((2002) ) Quantification of ferrous/ferric ratios in minerals: New evaluation schemes of Fe L 23 electron energy-loss near-edge spectra. Phys Chem Miner 29: , 188–200. |
[27] | Pan YH , Vaughan G , Brydson R , Bleloch A , Gass M , Sader K , Brown A ((2010) ) Electron-beam-induced reduction of Fe3+in iron phosphate dihydrate, ferrihydrite, hemosiderin and ferritin as revealed by electron energy-loss spectroscopy. Ultramicroscopy 110: , 1020–1032. |
[28] | Sensi SL , Granzotto A , Siotto M , Squitti R ((2018) ) Copper and zinc dysregulation in Alzheimer’s disease. Trends Pharmacol Sci 39: , 1049–1063. |
[29] | Miller Y , Ma B , Nussinov R ((2010) ) Zinc ions promote Alzheimer Aβ aggregation via population shift of polymorphic states. Proc Natl Acad Sci U S A 107: , 9490–9495. |
[30] | Lee MC , Yu WC , Shih YH , Chen CY , Guo ZH , Huang SJ , Chan JCC , Chen YR ((2018) ) Zinc ion rapidly induces toxic, off-pathway amyloid-β oligomers distinct from amyloid-β derived diffusible ligands in Alzheimer’s disease. Sci Rep 8: , 1–16. |
[31] | Quintana C , Bellefqih S , Laval JY , Guerquin-Kern JL , Wu TD , Avila J , Ferrer I , Arranz R , Patiño C ((2006) ) Study of the localization of iron, ferritin, and hemosiderin in Alzheimer’s disease hippocampus by analytical microscopy at the subcellular level. J Struct Biol 153: , 42–54. |
[32] | Plascencia-Villa G , Ponce A , Collingwood JF , Arellano-Jiménez MJ , Zhu X , Rogers JT , Betancourt T , José-Yacamán M , Perry G ((2016) ) High-resolution analytical imaging and electron holography of magnetite particles in amyloid cores of Alzheimer’s disease. Sci Rep 6: , 24873. |
[33] | Braak H , Braak E ((1991) ) Neuropathological stageing of Alzheimer-related changes. Acta Neuropathol 82: , 239–259. |
[34] | Duyckaerts C , Colle MA , Dessi F , Piette F , Hauw JJ ((1998) ) Progression of Alzheimer histopathological changes. Acta Neurol Belg 98: , 180–185. |
[35] | Giannakopoulos P , Herrmann FR , Bussière T , Bouras C , Kövari E , Perl DP , Morrison JH , Gold G , Hof PR ((2003) ) Tangle and neuron numbers, but not amyloid load, predict cognitive status in Alzheimer’s disease. Neurology 60: , 1495–1500. |
[36] | Ingelsson M , Fukumoto H , Newell KL , Growdon JH , Hedley-Whyte ET , Frosch MP , Albert MS , Hyman BT , Irizarry MC ((2004) ) Early Aβ accumulation and progressive synaptic loss, gliosis, and tangle formation in AD brain. Neurology 62: , 925–931. |
[37] | Robison G , Zakharova T , Fu S , Jiang W , Fulper R , Barrea R , Zheng W , Pushkar Y ((2013) ) X-ray fluorescence imaging of the hippocampal formation after manganese exposure. Metallomics 5: , 1554–1565. |
[38] | Carboni E , Nicolas JD , Töpperwien M , Stadelmann-Nessler C , Lingor P , Salditt T ((2017) ) Imaging of neuronal tissues by x-ray diffraction and x-ray fluorescence microscopy: Evaluation of contrast and biomarkers for neurodegenerative diseases. Biomed Opt Express 8: , 4331–4347. |
[39] | Collingwood JF , Adams F ((2017) ) Chemical imaging analysis of the brain with X-ray methods. Spectrochim Acta Part B At Spectrosc 130: , 101–118. |
[40] | Morris CM , Candy JM , Oakley AE , Bloxham CA , Edwardson JA ((1992) ) Histochemical distribution of non-haem iron in the human brain. Cells Tissues Organs 144: , 235–257. |
[41] | Gał ązka-Friedman J , Bauminger ER , Friedman A , Barcikowska M , Hechel D , Nowik I ((1996) ) Iron in parkinsonian and control substantia nigra—A Mössbauer spectroscopy study. Mov Disord 11: , 8–16. |
[42] | Garvie LA , Zega TJ , Rez P , Buseck PR ((2004) ) Nanometer-scale measurements of Fe3+/ΣFe by electron energy-loss spectroscopy: A cautionary note. Am Mineral 89: , 1610–1616. |


