
Glioma and Alzheimer’s Disease
Abstract
Background:
Cancer mortality and Alzheimer’s disease (AD) mortality increase with age, but some studies have shown an inverse relationship of the two diseases, that is, older persons with cancer have a reduced risk of AD and vice versa. However, other analyses suggest that AD and brain tumor might be positively correlated.
Objective:
In the current study, we wished to determine the relationship of AD mortality to malignant brain tumor mortality in US states and counties.
Methods:
Data and maps of malignant brain tumor mortality and Alzheimer’s disease mortality (1999–2016) are from the CDC Wonder tool (https://wonder.cdc.gov/cmf-icd10.html). Data on malignant brain tumor types and their frequencies are from the Surveillance, Epidemiology, and End Results Program (SEER, https://seer.cancer.gov). Data on the genetics of lower grade glioma are from the TCGA Lower Grade Glioma (LGG) dataset in TCGA (The Cancer Genome Atlas).
Results:
SEER data indicate that astrocytomas make up 58.2% of malignant brain tumors in patients 65 and older; glioblastoma and anaplastic astrocytoma make up 41.6%. We found a significant positive correlation between AD mortality rate and malignant brain tumor mortality rate 1999–2016 in persons age 65 and older in A) 1,101 US counties, p < 0.001 and B) 50 US states, p < 0.001.
Conclusion:
Adult malignant brain tumors may share some environmental risks with AD. Malignant brain tumors and AD also have some genes in common: TREM2, SPI1, CD33, and INPP5D. The interaction of environment and genetics is complex and overlaps in malignant brain tumors and AD.
INTRODUCTION
Both Alzheimer’s disease (AD) and cancer are characterized by abnormal, but opposing, cellular behavior: increased cell death in AD, excessive cell growth in cancer [1]. Yet AD and cancer share a pathway in gene transcription, a process essential for cell reproduction and growth. Liu et al. report that the ERK/MAPK signaling pathway is upregulated in glioblastoma, while the angiopoietin signaling pathway is reciprocally upregulated in AD, connecting glioblastoma and AD [2].
Cancer mortality and AD mortality increase with age, but some studies have shown an inverse relationship of the two diseases, that is, older persons with cancer have a reduced risk of AD and vice versa. A recent nationwide population-based study of 6,960 patients with AD in Taiwan showed that patients with AD had a reduced risk of developing cancer [3]. A case control analysis with 1,278 participants concluded that patients with probable AD had a 61% decreased risk of incident cancer while cancer survivors (including GBM) had a 33% decreased risk of developing AD [4]. Roe et al. have reported a significantly lower rate of hospitalization for cancer among AD patients and reduced AD among cancer patients in two prospective studies [1, 5]. A cohort study within a population-based sample of adults aged 60 years and older in Northern Italy found that persons with incident AD were less likely to develop cancer in the future, and persons with incident cancer were less likely to develop AD. When compared to the general population of persons of the same age and sex, the risk of cancer in patients with AD dementia was decreased by 43%, while the risk of AD dementia in patients with cancer was reduced by 35% [6].
However, another analysis of malignant brain tumors and AD in 19 US states found that AD and malignant brain tumor were positively correlated [7]. Moreover, some of the same genes are overexpressed in both diseases, for example, TREM2 [8]. Gliomas are comprised of neoplastic glial cells, while microglia are central to the link between inflammation and neurodegeneration that characterizes AD [9].
In the current study, we examined the relationship of AD mortality to malignant brain tumor mortality in US states and counties.
METHODS
AD mortality rate definition is from Centers for Disease Control and Prevention, National Center for Health Statistics, Compressed Mortality File 1999–2016 on CDC WONDER Online Database, released June 2017.
CDC WONDER manages nearly 20 collections of public-use data for U.S. births, deaths, cancer diagnoses, tuberculosis cases, vaccinations, environmental exposures, and population estimates, among many other topics. These data collections are available as online databases, which provide public access to ad-hoc queries, summary statistics, maps, charts, and data extracts. Most of the data are updated annually; some collections are updated monthly or weekly [10].
Malignant brain tumor data are from the Compressed Mortality File 1999–2016 Series 20 No. 2U, 2016, as compiled from data provided by the 57 vital statistics jurisdictions through the Vital Statistics Cooperative Program. (Accessed at http://wonder.cdc.gov/cmf-icd10.html on Jul 22, 2018 9:44:35 AM).
Data and maps of malignant brain tumor mortality and AD mortality (1999–2016) are from the CDC Wonder Tool (https://wonder.cdc.gov/cmf-icd10.html) [11]. Mortality rate has been defined elsewhere [10].
Data on malignant brain tumor types and their frequencies are from the Surveillance,Epidemiology, and End Results Program (SEER, https://seer.cancer.gov).
Data on the genetics of lower grade glioma are from the TCGA Lower Grade Glioma (LGG) dataset in TCGA (The Cancer Genome Atlas). To access and analyze data we used the Genomic Data Commons Data Portal (https://portal.gdc.cancer.gov) and the UCSC Xena browser (https://xenabrowser.net).
CDC Wonder Tool does not provide the AD stage of the subjects evaluated (early, mild, or severe), nor the results of Mini-Mental Status Examinations for the AD cases, nor the neuropathological findings for the AD cases.
RESULTS
SEER data indicate that lower grade gliomas (Astrocytoma, astrocytoma NOS (not otherwise specified), specified low grade astrocytic tumors and other glioma) make up 58.2% of malignant brain tumors in patients 65 and older; glioblastoma and anaplastic astrocytoma make up 41.6%. Proportion of malignant brain tumor types is illustrated in Fig. 1.
Fig.1
Malignant brain tumor types in persons 65 and older, data from SEER (74,389 cases). Astrocytoma, astrocytoma NOS (not otherwise specified), specified low grade astrocytic tumors and other glioma comprise the lower grade gliomas.
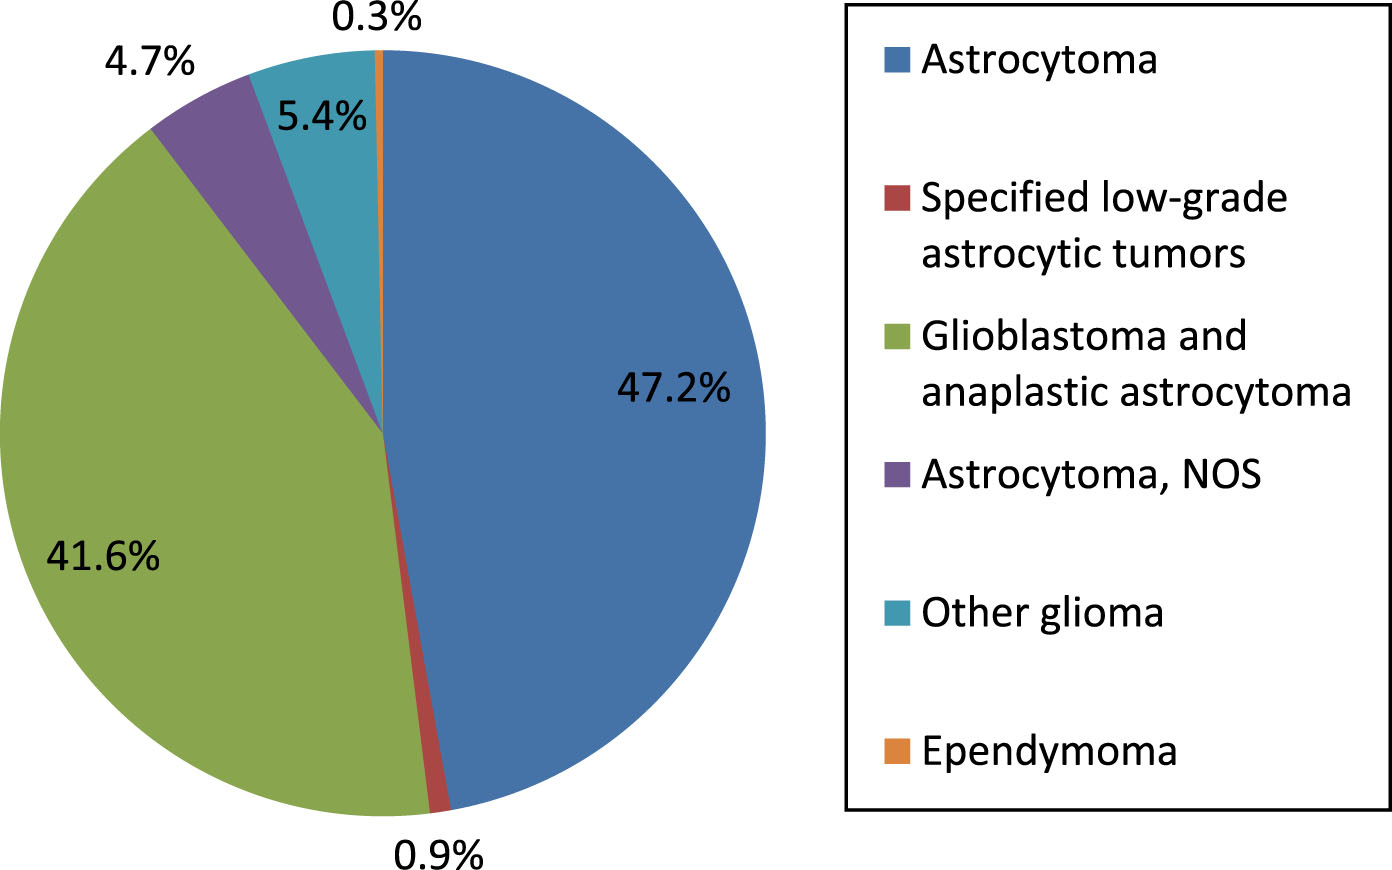
Figure 2 displays AD demographics for age and sex. The disease is most common in women age 85 and above.
Fig.2
Alzheimer’s disease demographics, crude death rate by age group and gender (per 100,000) of persons in this study.
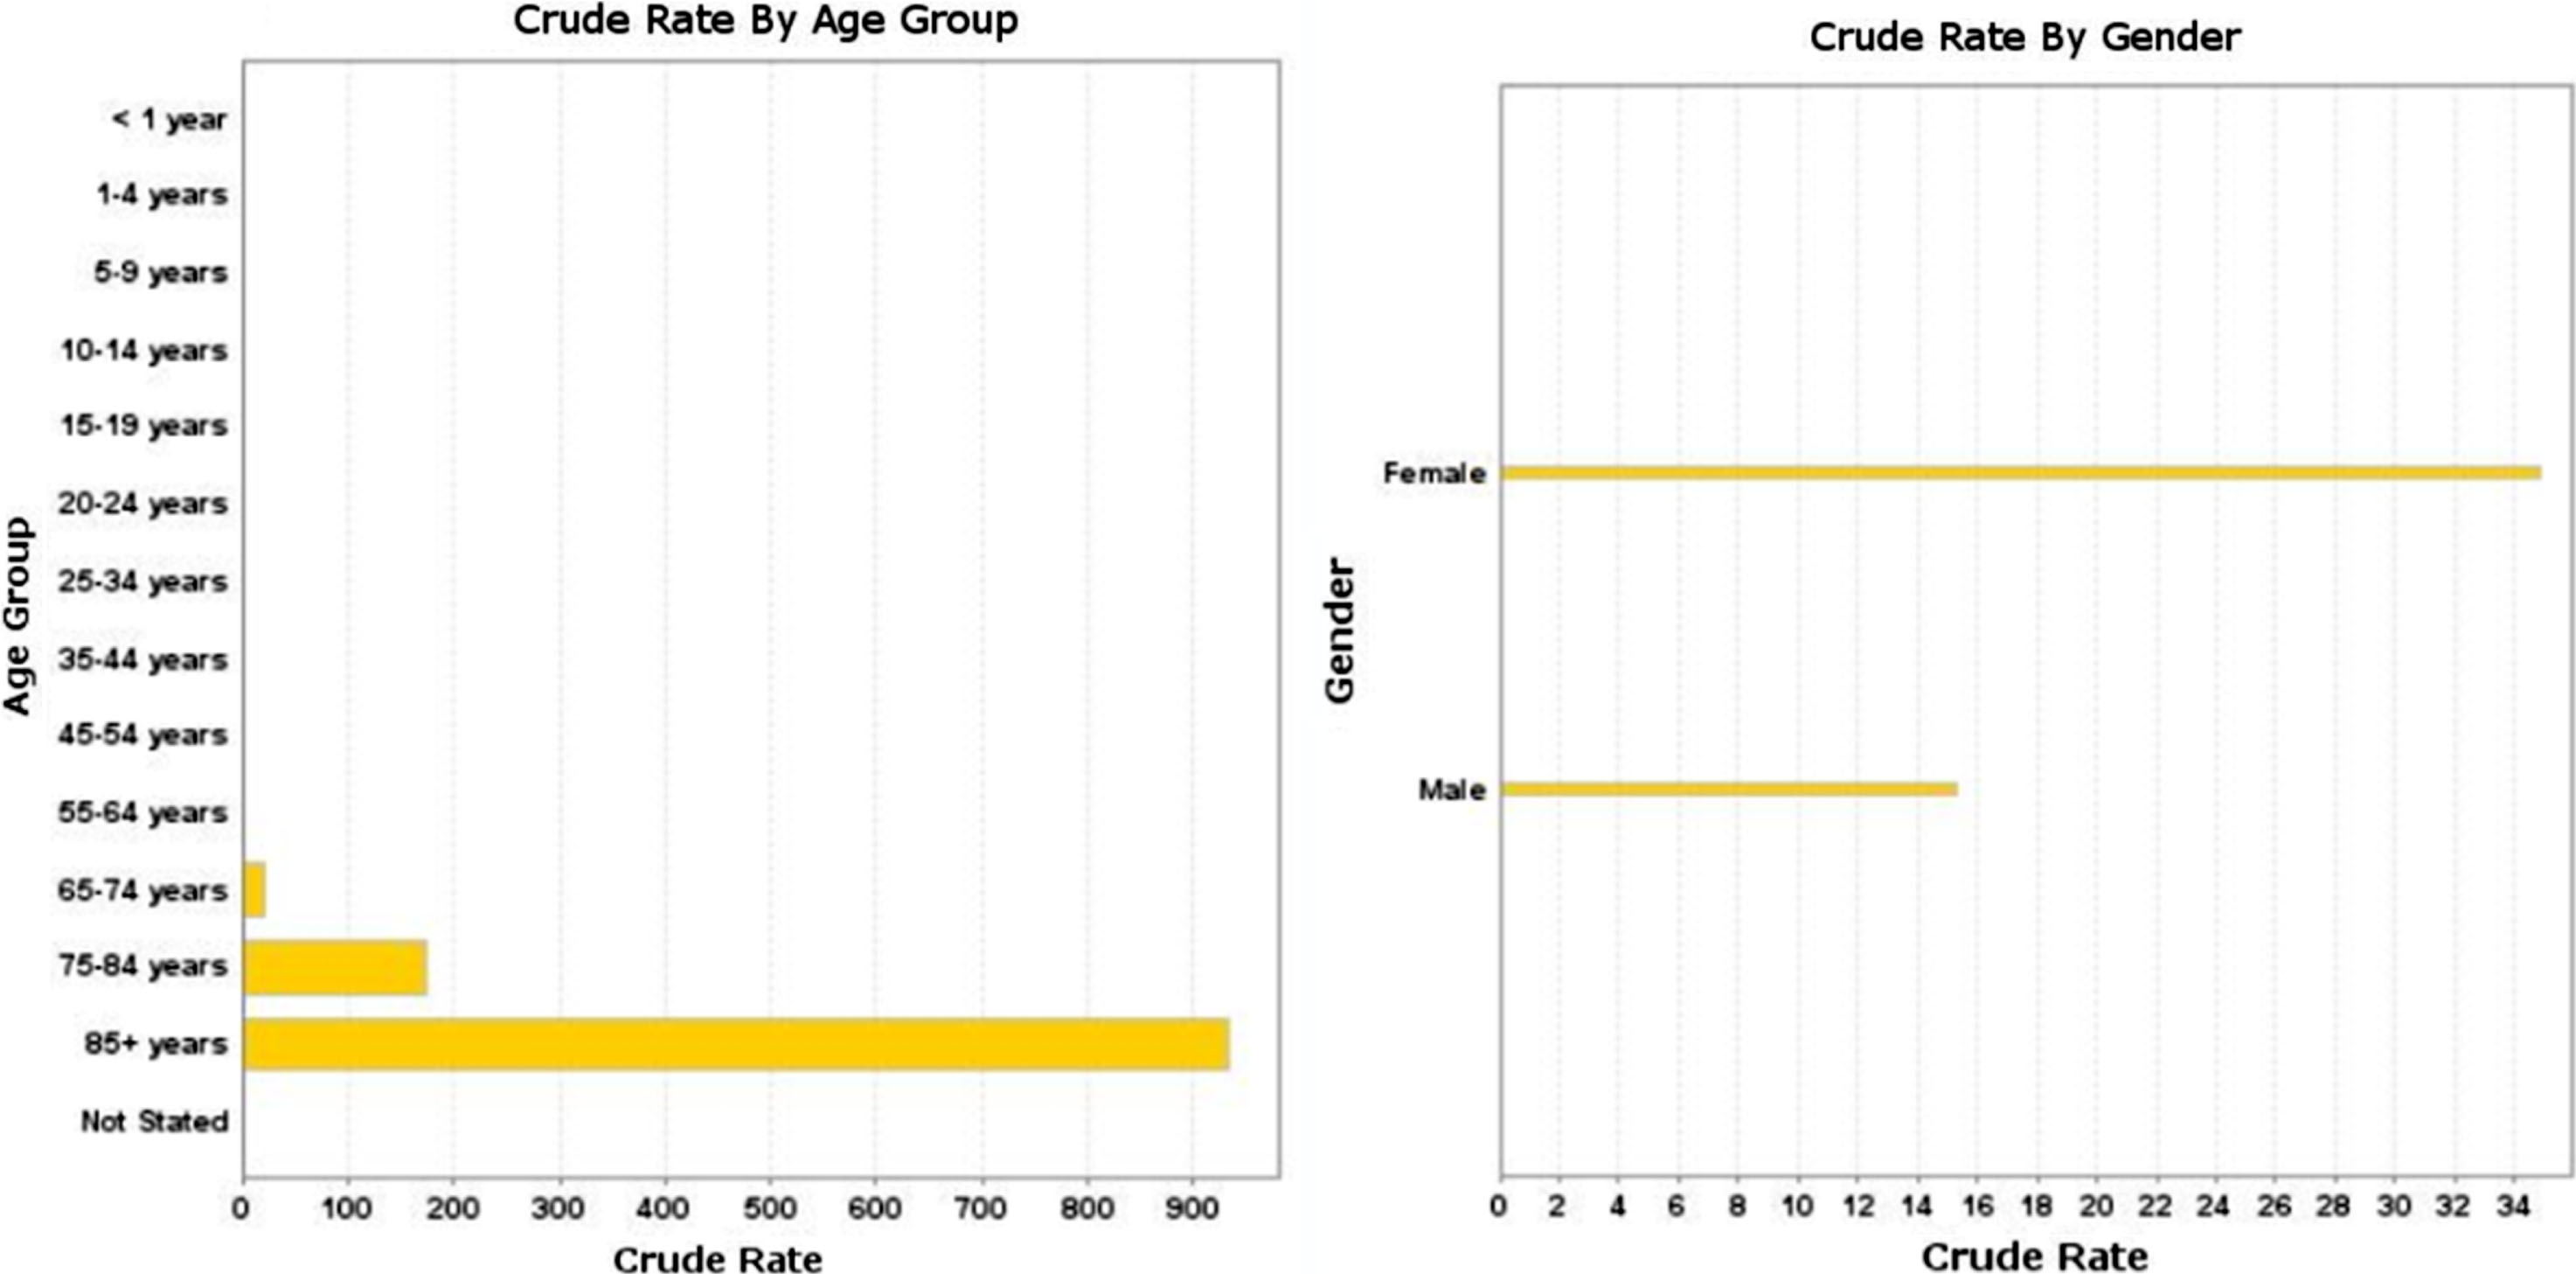
Figure 3 shows the significant positive correlation between AD mortality rate and malignant brain tumor mortality rate 1999–2016 in persons age 65 and older in A) 1101 US counties, p < 0.001 and B) 50 US states and the District of Columbia, p < 0.001. Linear regression was used to calculate p value; p value < 0.05 is considered statistically significant. Multivariate linear regression on state data showed a significant positive correlation between AD mortality rate and malignant brain tumor mortality rate (β= 0.352, p < 0.001) that was independent of the effect of gender (β= 1.0, p < 0.001), with males having the higher brain tumor mortality rate.
Fig.3
Alzheimer’s disease mortality rate versus malignant brain tumor mortality rate 1999–2016 in persons age 65 and older: A) 1101 US counties, r-squared = 0.021, p < 0.001 and B) 50 US states and the District of Columbia, r-squared = 0.348, p < 0.001.
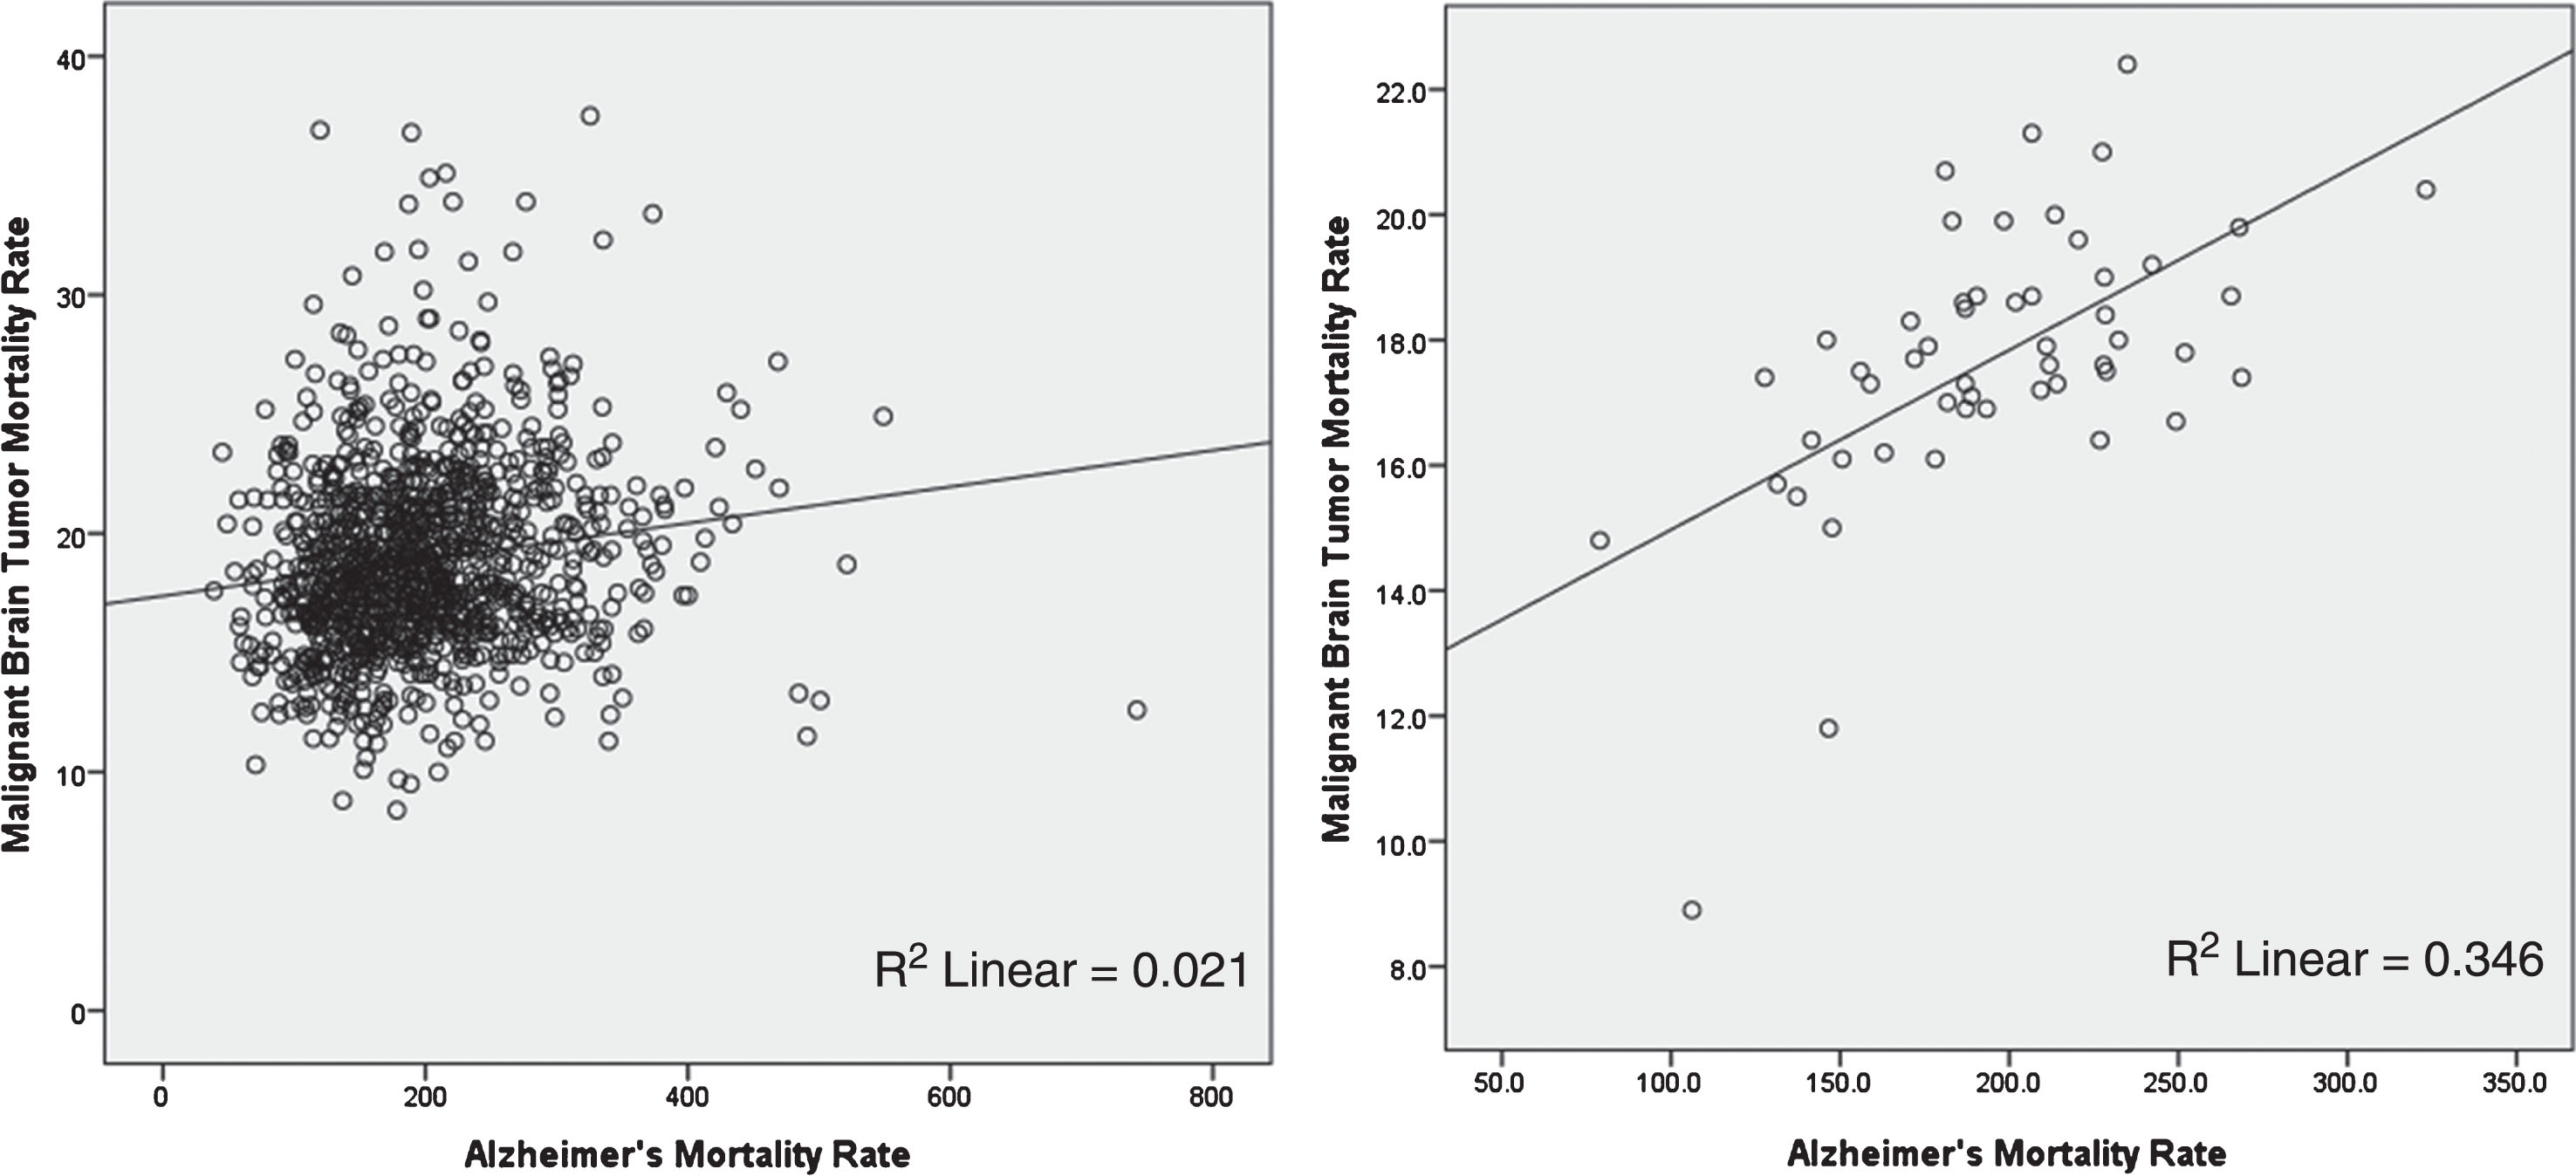
Figure 4 shows AD and malignant brain tumor age adjusted mortality rates for 50 US states and the District of Columbia in persons age 65 and older. Note the similarity in the two distributions, although there are mismatches. Washington State has the highest AD age adjusted rate, New York the lowest; whereas in the case of malignant brain tumors, South Dakota has the highest age adjusted rate, Hawaii the lowest, for reasons not entirely clear.
Fig.4
Alzheimer’s disease and malignant brain tumor age adjusted mortality rates for 50 US states and the District of Columbia in persons age 65 and older. Note the similarity in the two distributions, although there are mismatches. Washington State has the highest AD age adjusted rate, New York the lowest; whereas in the case of malignant brain tumors, South Dakota has the highest age adjusted rate, Hawaii the lowest, for reasons not entirely clear (https://wonder.cdc.gov/cmf-icd10.html).
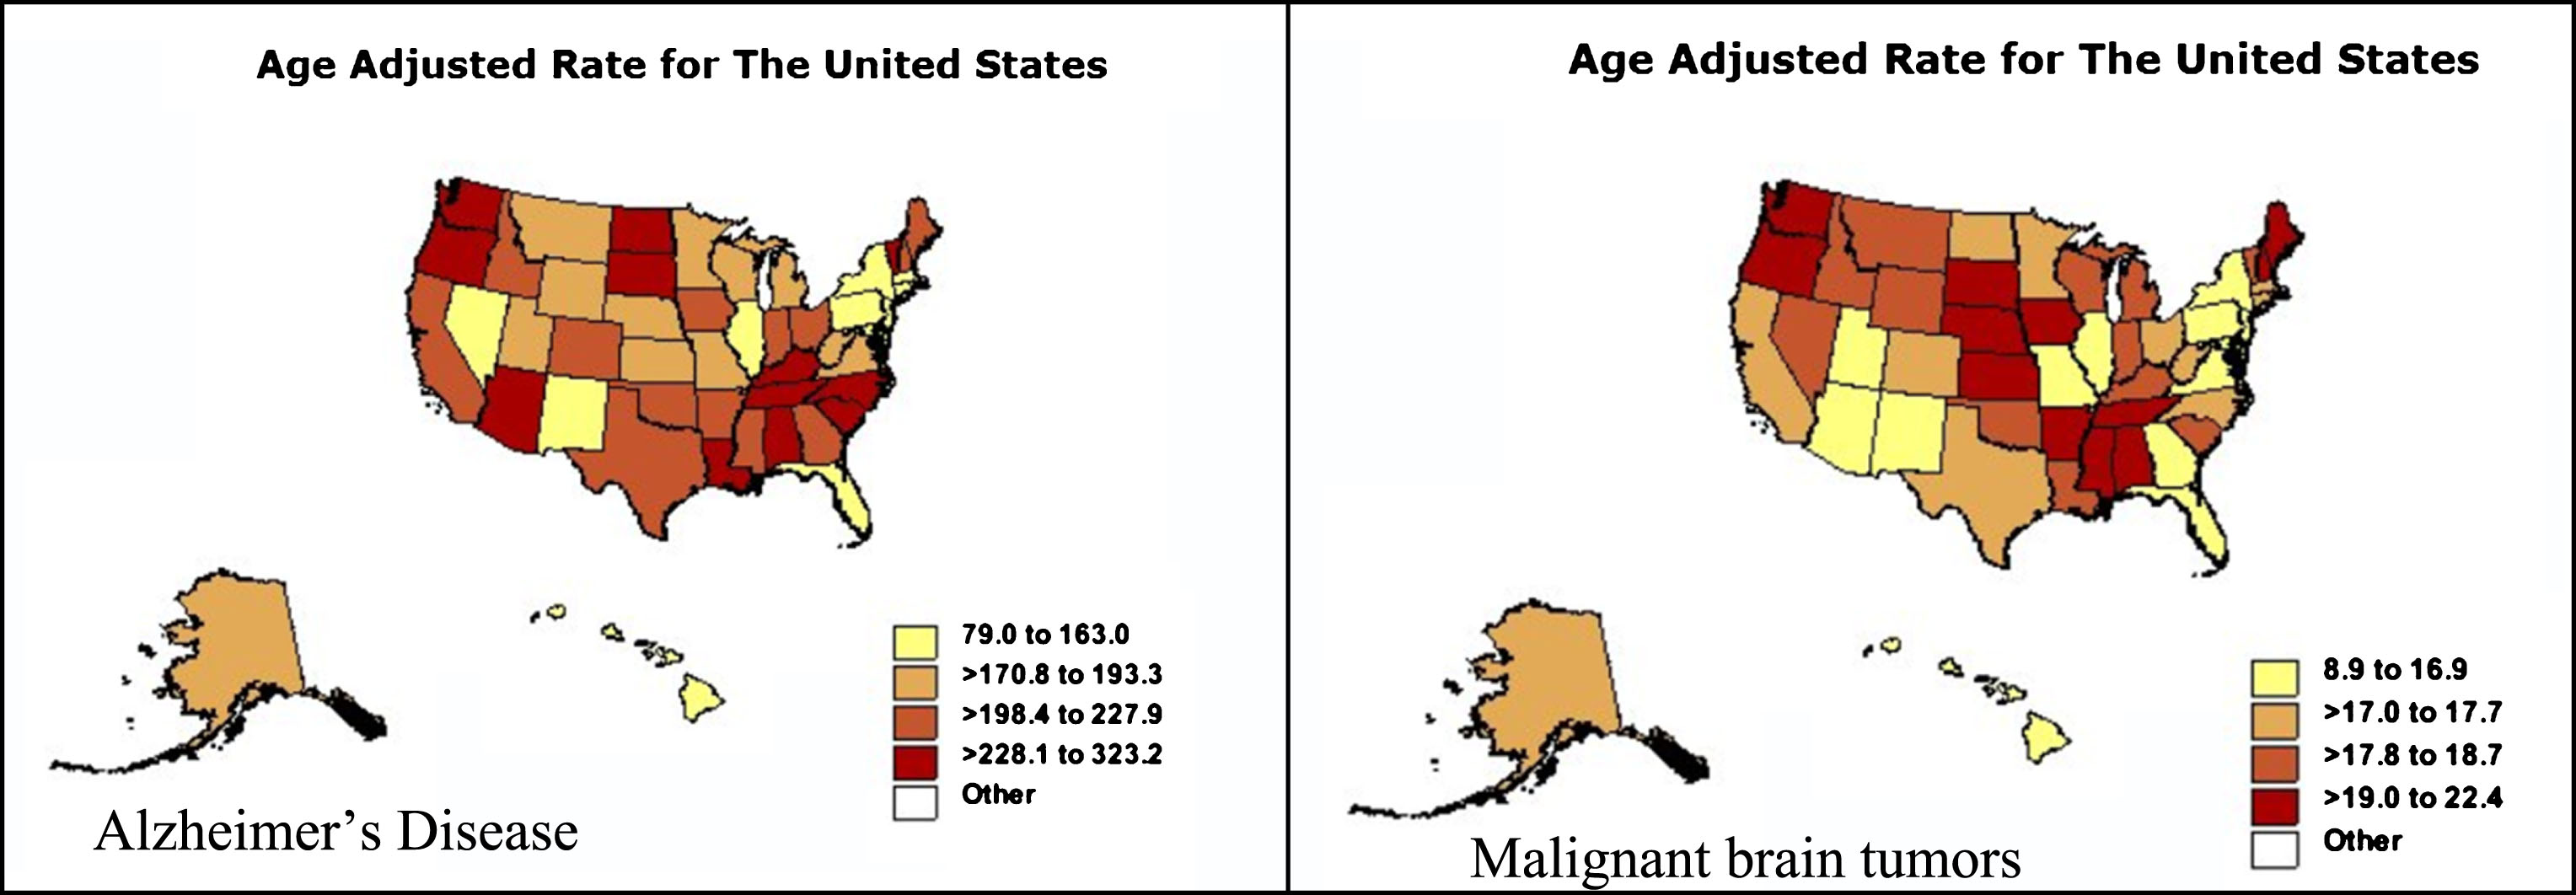
Figure 5 illustrates genetic separation of lower grade gliomas into two disease groups in 526 TCGA patients studied. TREM2 overexpression falls into the poorer prognosis group.
Fig.5
Genetic separation of lower grade gliomas into two disease groups in 526 TCGA patients studied. Group 1 is characterized by loss of chromosome arms 1p and 19q (blue blocks, columns A and B) and TERT over-expression (column E); group 2 by TP53 and ATRX mutations (columns C and D). TREM2 gene expression is in column G. Astrocytoma histology (column F) and TREM2 high expression (column G) fall into group 2, the poorer prognosis group. Each row contains data from a single sample. Row order is determined by sorting the rows by their column values (UCSC Xena, http://xena.ucsc.edu). Mutation abbreviations: Frame shift del, frame shift deletion; Frame shift ins, frame shift insertion; in frame del, in frame deletion. Color codes: red, high expression, blue, low or no expression.
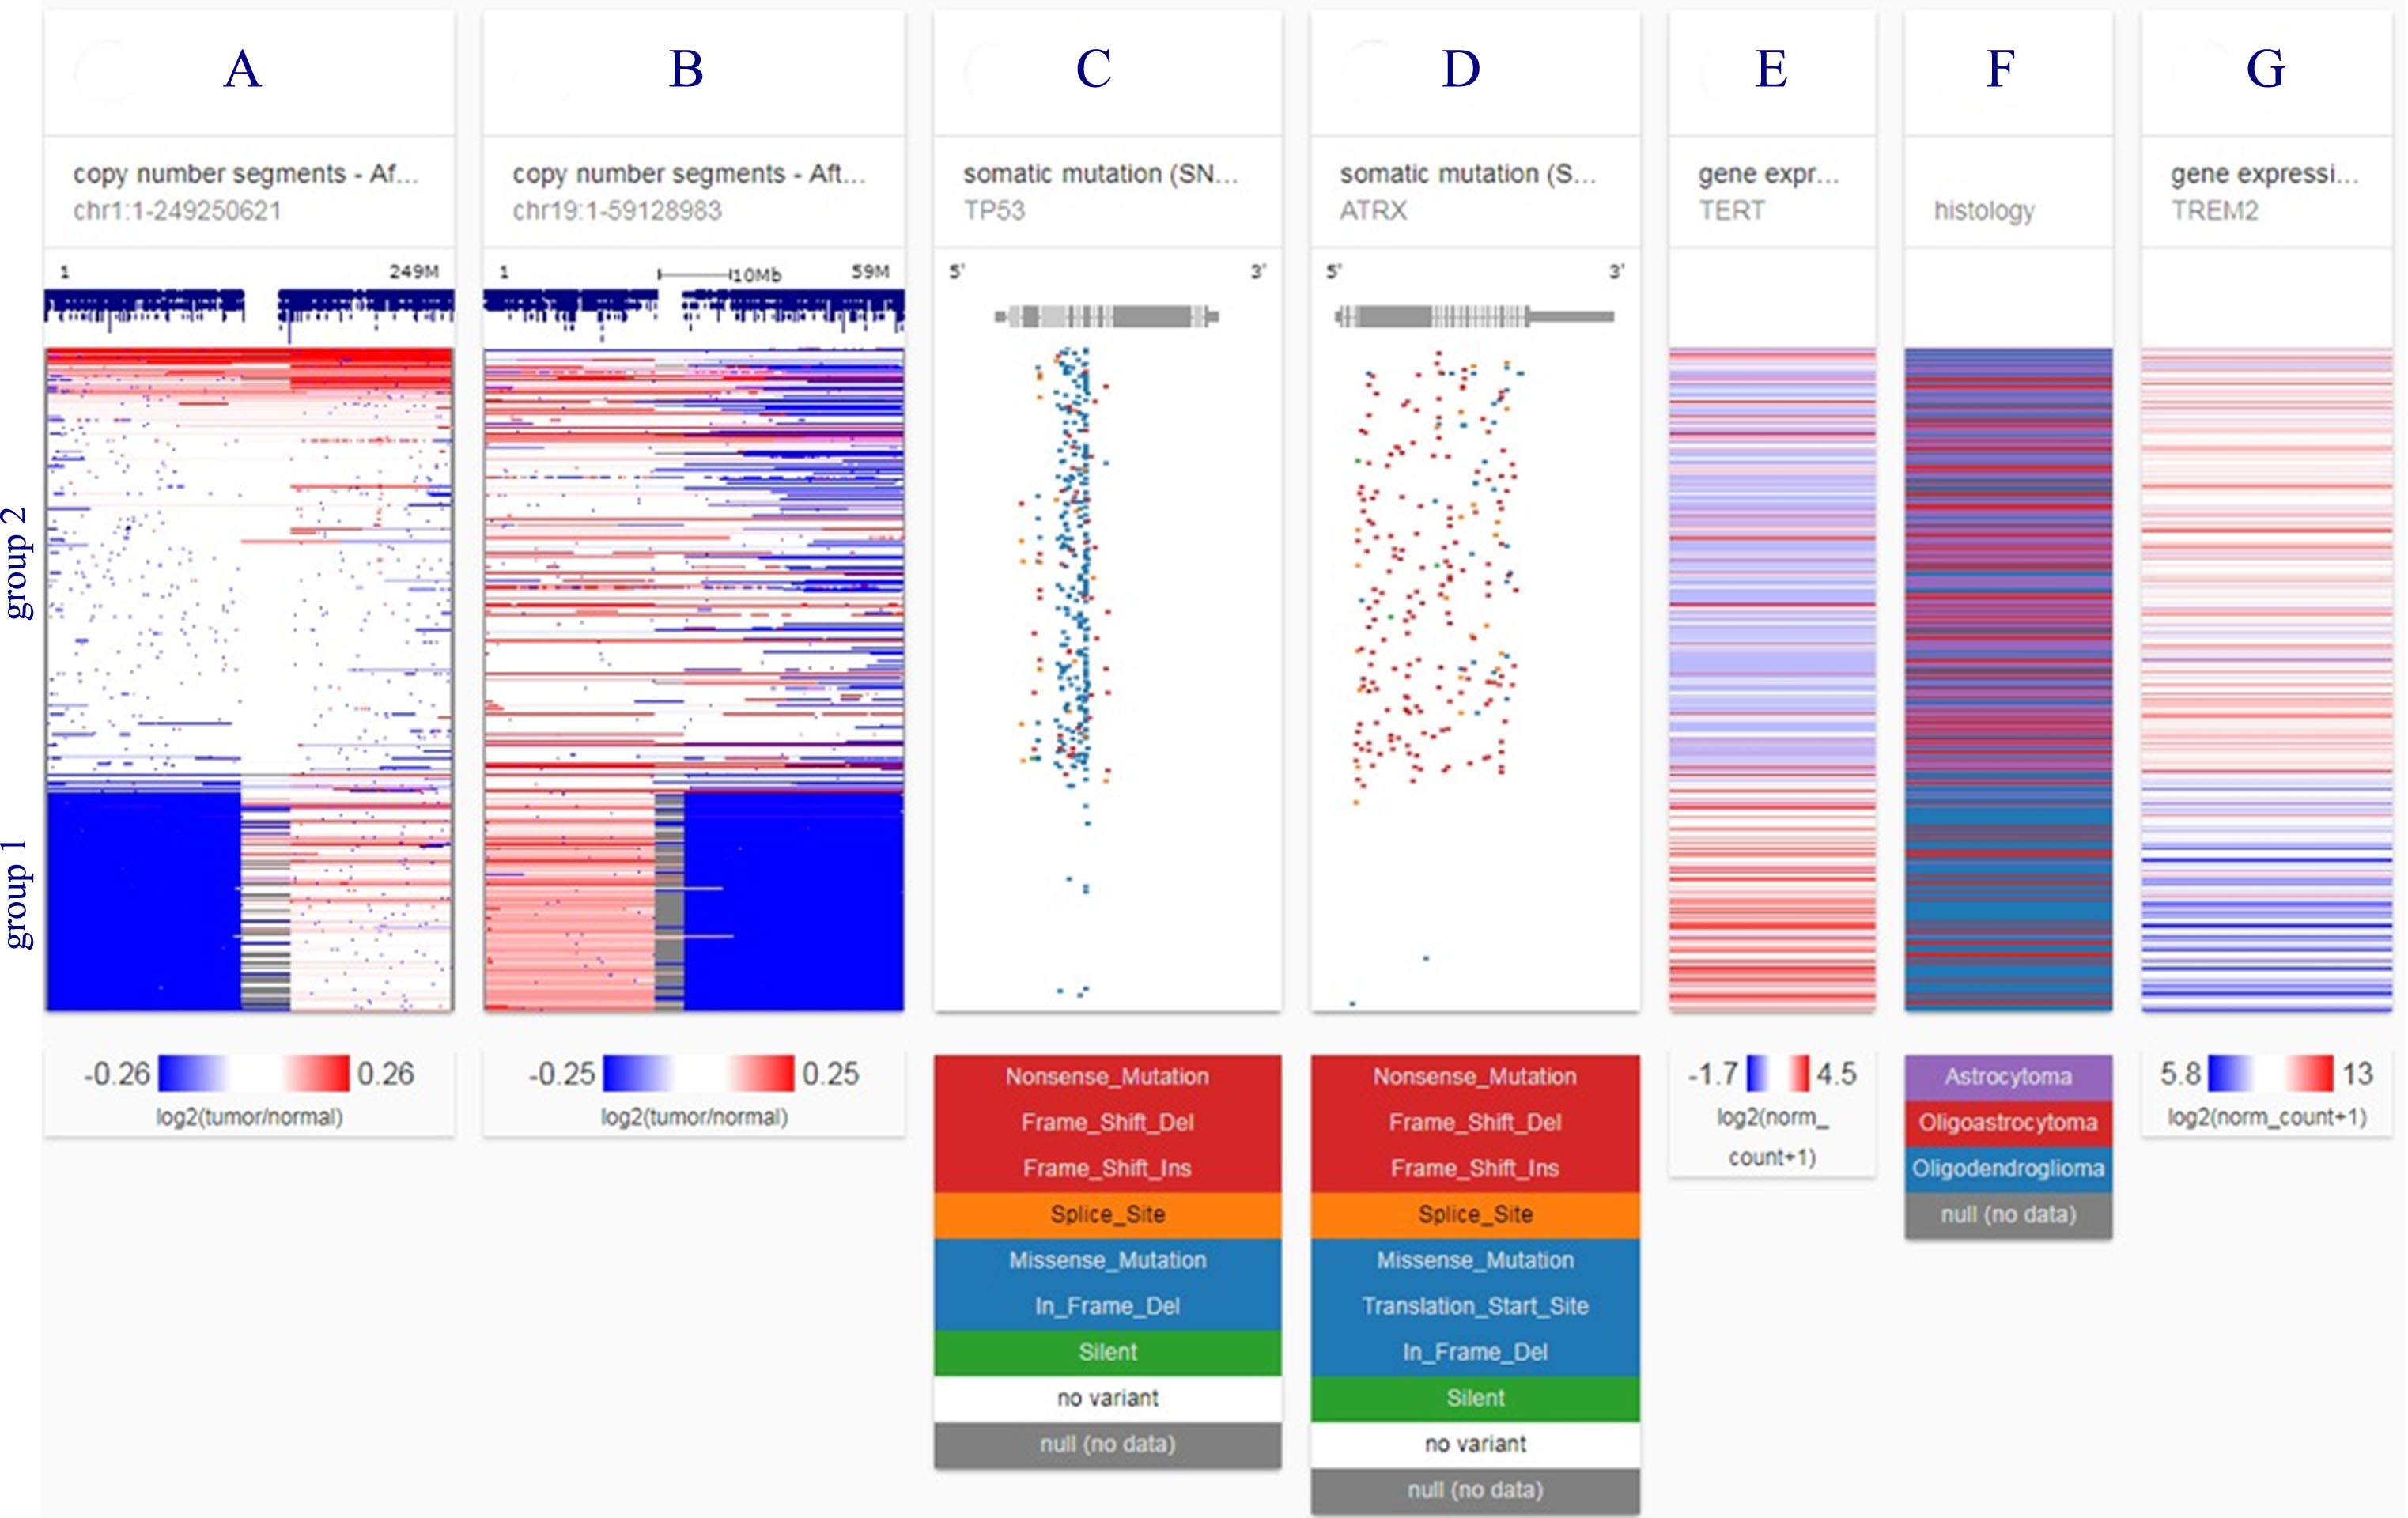
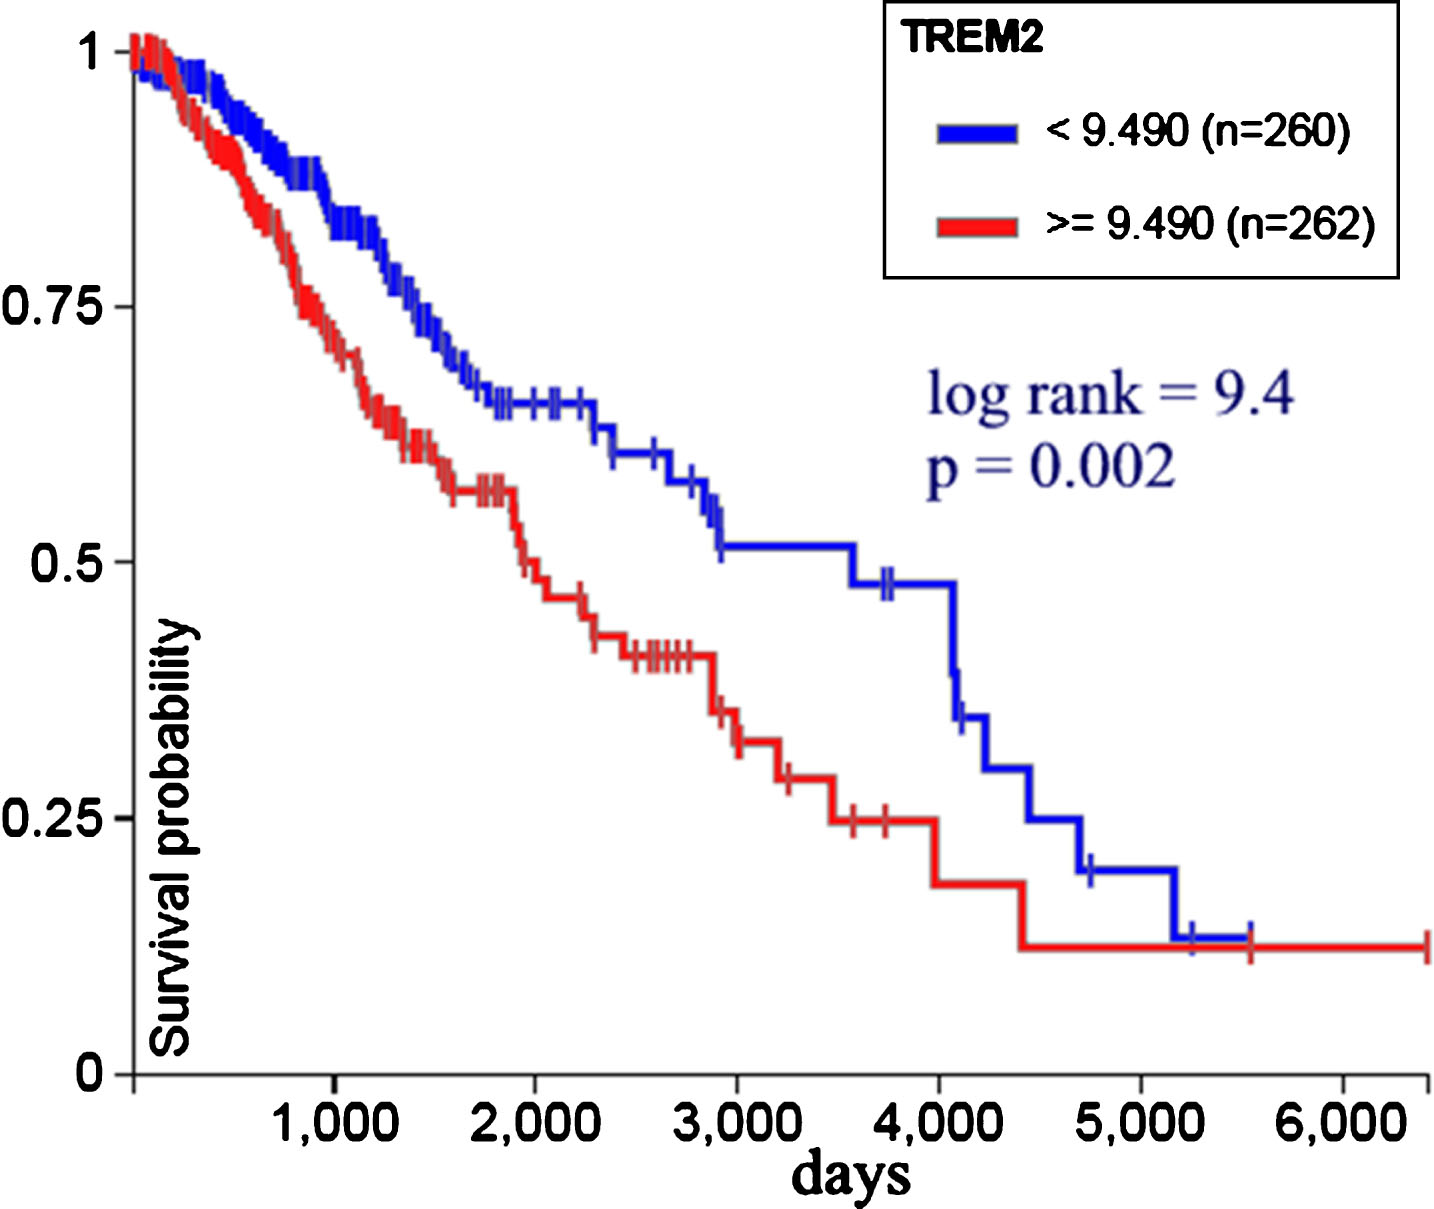
Figure 6 shows TREM2 expression versus survival probability in 522 low grade glioma patients from TCGA. Less expression is associated with bettersurvival. Log rank test was used to calculate statistical significance; p value < 0.05 is considered statistically significant.
Fig.6
TREM2 gene expression versus survival probability in 522 low grade glioma patients from TCGA. Less expression is associated with better survival (UCSC Xena, http://xena.ucsc.edu).
DISCUSSION
Many previous studies take into account both genetics and environmental factors [1, 3–6]. But the data we have analyzed here reflect mainly environmental influences [12], and our documentation of a positive correlation of glioma and AD is unique.
AD environmental risk has been attributed to smoking, air pollution, aluminum, silicon, selenium, pesticides, and electromagnetic fields. Less risk is apparently due to metals such as aluminum and other trace elements, occupational exposure to lead, inks/dyes, paints/stains/varnishes, gasoline/fuels/oils, liquid plastics/rubbers, vibratory tools, or climate [12]. Nasal inhalation of radon has also been implicated [13].
Adult malignant brain tumors may share part of the AD environmental risks [14]: Electromagnetic fields; hair dyes; occupational exposures to benzene, lubricating oil, wood dust, arsenic, mercury, petroleum products, lead, pesticides; and smoking.
Some of the same risk genes for AD [15] are involved in gliomas. TREM2 is a prime example [8, 16], though TREM2 is associated with only a relatively limited number of AD cases. Recent findings have shown that TREM2 protein levels are unchanged during the progression of AD in cortex [17]. Other putative AD genes include SPI1 [18], CD33 [19], and INPP5D [20].
We found that malignant brain tumor TREM2 overexpression falls into the poorer prognosis group and less TREM2 expression is associated with bettersurvival (Figs. 5 and 6). This finding is consistent with cellular studies suggesting that TREM2 may work as an oncogene and could be a new therapeutic target for glioma treatment [16].
A plausible unification of apparently contradictory results—cancer and AD having overexpressed genes in common but negatively associated prevalence— is that competing genotypes of the same gene are associated with the respective diseases. This is consistent with both AD and cancer being characterized by abnormal, but opposing, cellular behavior.
A weakness in our study is possible confounding by the ecological fallacy (or ecological inference fallacy), a logical fallacy in the interpretation of statistical data where inferences about the nature of individuals are derived from inference for the group to which those individuals belong [21]. In this case, inferences about AD and brain tumors in individuals are being drawn from the characteristics of US states where they reside, rather than from the individuals themselves. Moreover, administrative records including from the CDC and National Death Index severely underestimate the prevalence of AD mortality, which can profoundly affect findings. As a rule of thumb, careful studies on the matter have reported a prevalence of dementia of about 10–14%, while prevalence of AD according to the NDI was 0.9%.
In sum, the interaction of environment and genetics is complex and overlaps in malignant brain tumors and AD. Further study, including analysis of National Alzheimer’s Coordinating Center data, may elucidate this complex relationship.
CONFLICT OF INTEREST
The authors have no conflict of interest to report.
REFERENCES
[1] | Roe CM , Behrens MI , Xiong C , Miller JP , Morris JC ((2005) ) Alzheimer disease and cancer. Neurology 64: , 895–898. |
[2] | Liu T , Ren D , Zhu X , Yin Z , Jin G , Zhao Z , Robinson D , Li X , Wong K , Cui K , Zhao H , Wong ST ((2013) ) Transcriptional signaling pathways inversely regulated in Alzheimer’s disease and glioblastoma multiform. Sci Rep 3: , 3467. |
[3] | Ou SM , Lee YJ , Hu YW , Liu CJ , Chen TJ , Fuh JL , Wang SJ ((2013) ) Does Alzheimer’s disease protect against cancers? A nationwide population-based study. Neuroepidemiology 40: , 42–49. |
[4] | Driver JA , Beiser A , Au R , Kreger BE , Splansky GL , Kurth T , Kiel DP , Lu KP , Seshadri S , Wolf PA ((2012) ) Inverse association between cancer and Alzheimer’s disease: Results from the Framingham Heart Study. BMJ 344: , e1442. |
[5] | Roe CM , Fitzpatrick AL , Xiong C , Sieh W , Kuller L , Miller JP , Williams MM , Kopan R , Behrens MI , Morris JC ((2010) ) Cancer linked to Alzheimer disease but not vascular dementia. Neurology 74: , 106–112. |
[6] | Musicco M , Adorni F , Di SS , Prinelli F , Pettenati C , Caltagirone C , Palmer K , Russo A ((2013) ) Inverse occurrence of cancer and Alzheimer disease: A population-based incidence study. Neurology 81: , 322–328. |
[7] | Lehrer S ((2010) ) Glioblastoma and dementia may share a common cause. Med Hypotheses 75: , 67–68. |
[8] | Abbott A ((2018) ) Is ‘friendly fire’ in the brain provoking Alzheimer’s disease? Nature 556: , 426–428. |
[9] | Sevenich L ((2018) ) Brain-resident microglia and blood-borne macrophages orchestrate central nervous system inflammation in neurodegenerative disorders and brain cancer. Front Immunol 9: , 697. |
[10] | Hebert LE , Weuve J , Scherr PA , Evans DA ((2013) ) Alzheimer disease in the United States (2010-2050) estimated using the 2010 census. Neurology 80: , 1778–1783. |
[11] | Friede A , Rosen DH , Reid JA ((1994) ) CDC WONDER: A cooperative processing architecture for public health. J Am Med Inform Assoc 1: , 303–312. |
[12] | Killin LO , Starr JM , Shiue IJ , Russ TC ((2016) ) Environmental risk factors for dementia: A systematic review. BMC Geriatr 16: , 175. |
[13] | Lehrer S , Rheinstein PH , Rosenzweig KE ((2017) ) Association of radon background and total background ionizing radiation with Alzheimer’s disease deaths in U.S. states. J Alzheimers Dis 59: , 737–741. |
[14] | Connelly JM , Malkin MG ((2007) ) Environmental risk factors for brain tumors. Curr Neurol Neurosci Rep 7: , 208–214. |
[15] | Efthymiou AG , Goate AM ((2017) ) Late onset Alzheimer’s disease genetics implicates microglial pathways in disease risk. Mol Neurodegener 12: , 43. |
[16] | Wang XQ , Tao BB , Li B , Wang XH , Zhang WC , Wan L , Hua XM , Li ST ((2016) ) Overexpression of TREM2 enhances glioma cell proliferation and invasion: A therapeutic target in human glioma. Oncotarget 7: , 2354–2366. |
[17] | Jay TR , von Saucken VE , Landreth GE ((2017) ) TREM2 in neurodegenerative diseases. Mol Neurodegener 12: , 56. |
[18] | Guan H , Cai J , Zhang N , Wu J , Yuan J , Li J , Li M ((2012) ) Sp1 is upregulated in human glioma, promotes MMP-2-mediated cell invasion and predicts poor clinical outcome. Int J Cancer 130: , 593–601. |
[19] | Gielen PR , Schulte BM , Kers-Rebel ED , Verrijp K , Petersen-Baltussen HM , ter LM , Wesseling P , Adema GJ ((2015) ) Increase in both CD14-positive and CD15-positive myeloid-derived suppressor cell subpopulations in the blood of patients with glioma but predominance of CD15-positive myeloid-derived suppressor cells in glioma tissue. J Neuropathol Exp Neurol 74: , 390–400. |
[20] | Wu G , Diaz AK , Paugh BS , Rankin SL , Ju B , Li Y , Zhu X , Qu C , Chen X , Zhang J , Easton J , Edmonson M , Ma X , Lu C , Nagahawatte P , Hedlund E , Rusch M , Pounds S , Lin T , Onar-Thomas A , Huether R , Kriwacki R , Parker M , Gupta P , Becksfort J , Wei L , Mulder HL , Boggs K , Vadodaria B , Yergeau D , Russell JC , Ochoa K , Fulton RS , Fulton LL , Jones C , Boop FA , Broniscer A , Wetmore C , Gajjar A , Ding L , Mardis ER , Wilson RK , Taylor MR , Downing JR , Ellison DW , Zhang J , Baker SJ ((2014) ) The genomic landscape of diffuse intrinsic pontine glioma and pediatric non-brainstem high-grade glioma. Nat Genet 46: , 444–450. |
[21] | Schwartz S ((1994) ) The fallacy of the ecological fallacy: The potential misuse of a concept and the consequences. Am J Public Health 84: , 819–824. |


