
Validation of the English Version of the Multimodal Assessment of Capacities in Severe Dementia (MAC-SD): A Cognitive and Functional Scale for Use in Severe Dementia
Abstract
Background:
Most existing screening instruments that assess cognition and functioning in dementia suffer from floor effects, limiting their utility in severely demented patients. In 2015, the first author devised a new instrument, The Multimodal Assessment of Capacities in Severe Dementia (MAC-SD), to address this need. The MAC-SD Spanish version proved reliable, valid, and useful for evaluating patients with severe dementia.
Objective:
This report presents the results of a field trial of the English version of the MAC-SD in a U.S. population.
Methods:
The MAC-SD was administered to 40 participants with severe dementia along with gold standard measures of cognition and functioning in dementia (the Severe Mini-Mental State Exam, the Severe Impairment Battery, the Global Deterioration Scale, and the Barthel Index of Activities of Daily Living). Data analysis was performed to determine floor effects, reliability, validity, sensitivity to change, and clinical usefulness.
Results:
The MAC-SD showed no significant floor effects, acceptable reliability, convergent validity with control measures, internal validity, and known groups validity. Of participants who scored the lowest possible on control measures, MAC-SD scores ranged widely. The MAC-SD was highly sensitive to change, and was able to detect changes not seen on control measures.
Conclusions:
The MAC-SD English version is reliable and valid for use in the cognitive and functional assessment of patients with severe dementia. It gives more detailed information than control instruments about the cognitive and functional abilities of patients with the most severe dementia, and is able to detect changes in these patients not shown by control measures.
INTRODUCTION
Dementia is a growing healthcare problem. Alzheimer’s disease alone affects approximately 33.9 million people worldwide [1]. Severe dementia, the last stage of the disease progression, features extremely high levels of dependence as well as grave deficits in cognition and executive functioning. This stage poses unique and extremely difficult challenges in the care and treatment of patients [2]. There is relatively little literature on the subject of care and treatment of patients with severe dementia, mainly due to a lack of measures with acceptable psychometric properties. Many have called for a measure that is multidimensional— specifically covering cognition, communication and social interaction, activities of daily living (ADL) and behavior— and that is sensitive to change, reliable and valid, and requires 10 minutes or less to administer [3, 4]. For severe dementia in particular, calls have been made for a population-specific scale that does not demonstrate the floor effects of existing measures and is able to measure longitudinal changes [5].
In response to this unmet need, an assessment instrument was created, the Multimodal Assessment of Capacities in Severe Dementia (MAC-SD). The MAC-SD is a Spanish and English language psychometric tool to measure cognition and functioning in patients with severe dementia. The Spanish language version proved to be reliable, valid, and useful in the care and treatment of patients with severe dementia [6]. This study investigates the same parameters in the English language version of the MAC-SD with a United States cohort.
MATERIALS AND METHODS
Design
A multicenter, open, observational study was conducted with three evaluations across a one year period per participant; data was collected over a period of four years.
Setting
The study was conducted at Gurwin Jewish Nursing and Rehabilitation Center, a nursing home and rehabilitation facility in Commack, New York, as well as the outpatient office of a geriatric psychiatrist (AS) in Centereach, New York.
Participants
Inclusion criteria were a clinical diagnosis of dementia, a Mini-Mental State Exam (MMSE) score of 15 or less or a Brief Interview for Mental Status (BIMS) scores of 12 or less indicating moderate to severe dementia, and status as a patient at one of the two study sites.
Assessments
The MAC-SD was designed to identify the varied capacities retained by participants in the late stages of dementia, and to present that information in a manner conducive to creating care plans and therapeutic activities. The cognitive section was developed as a series of themed therapeutic encounters; it is administered directly to the patient and scored from 0–93, with higher scores indicating better cognition. There are three subsections: social/sensory stimulation, simple commands/interaction with objects, and automatic language. Each subsection additionally contains structured and unstructured qualitative observations of the patient’s behavior, language, and attention to/awareness of the evaluator and the environment. Answer choices distinguish between verbal and non-verbal responses, as well as between inappropriate or incorrect responses and the absence of a response. Scores on each subsection are added to form a subsection score, and the subsection scores are added to give the total cognitive score.
The functional section is administered to the caregiver(s) only, and is divided into seven items corresponding to ADLs: bathing, dressing, personal hygiene, toileting, incontinence, mobility, and feeding. Items are scored from 1–7, with a higher score indicating a greater degree of disability. Each score includes a description of both the amount of assistance (none, verbal cues, physical cues, both verbal and physical cues, complete physical assistance) and the amount of supervision (none, sporadic, constant) necessary for the patient to complete the task. Each item is scored independently, and all items are added to create a total functional score. The total functional and total cognitive scores are considered independent of each other and are not added together to create a single final score.
This study included two gold standard measures of cognition in severe dementia, the Severe Mini-Mental State Exam (SMMSE) and the Severe Impairment Battery (SIB), as well as two gold standard measures of functioning in all stages of dementia, the Global Deterioration Scale (GDS) and the Barthel Index of Activities of Daily Living (Barthel). The SMMSE [7] is scored out of 30 and the SIB [8] is scored out of 100, with higher scores indicating better cognition. The GDS [9] is scored from 1–7 with higher scores indicating more impairment, while the Barthel [10] is scored from 0–100 with higher scores indicating less impairment.
Procedure
Each participant underwent three evaluations: the first two within one week of each other and the third evaluation administered one year after the first. Each evaluation consisted of 1) a patient interview, in which the cognitive portion of the MAC-SD was administered along with the SMMSE and the SIB, and 2) a caregiver interview, in which the functional portion of the MAC-SD was administered along with the GDS and the Barthel. For the first two evaluations, one of the investigators administered the control scales and either a staff member of the nursing home or physician’s office or one of the investigators administered the MAC-SD. Half of the participants were randomly selected to have the MAC-SD administered by the same evaluator at both the first and second evaluations, in order to measure the test-retest reliability of the scale. The other half of the participants had the MAC-SD administered by a different evaluator at the first and second evaluations, in order to assess the scale’s inter-rater reliability. Randomization was carried out using a software-generated list of random numbers. At the third evaluation, all participants had the MAC-SD administered by one of the investigators. Evaluations lasted between 10 and 20 minutes.
Ethical aspects
The study was approved by the Human Subjects Committee of the Institutional Review Board of Stony Brook University School of Medicine. Written informed consent was obtained from the next of kin or legally authorized representative of each participant.
Data analysis
The same statistical protocol used to validate the Spanish language version of the MAC-SD was utilized, with the addition of comparisons between the MAC-SD and the control measures used in this trial but not in the previous one. This protocol is detailed below.
In addition to descriptive statistics, the following analyses were carried out:
1) For the cognitive section, factor analyses (principal components analysis (PCA)) with orthogonal (varimax) and oblique (promax) rotations were performed. Kaiser’s criteria (eigenvalues>1) was applied for factor extraction. A Kaiser-Meyer-Olkin measure of >0.60 for sampling adequacy was expected [11]. Factor loadings <0.40 were considered not significant [5]. Confirmatory factor analysis (CFA) was employed to substantiate the results of the PCA of the cognitive section, with root mean squared error of approximation (RMSEA), standardized root mean square residual (SRMR), and comparative fit index (CFI) employed as goodness of fit measures. Threshold values for acceptable fit were RMSEA and SRMR <0.08 and CFI >0.95 [12]. Neither PCA nor CFA were performed for the functional section as this subscale consists of only one conceptual domain, functionality, with seven different items.
2) Data quality was considered acceptable if more than 95% of the data was computable [12]. Floor and ceiling effects were computed and considered acceptable if <20%. Skewness was additionally calculated, with limits of acceptability defined as –1 to +1 [13].
3) Cronbach’s alpha was calculated to measure internal consistency, with acceptable values defined as >0.70 [14]. Corrected item–total correlation and item homogeneity (criterion values ≥0.30) were included in the reliability analysis as well [15].
4) Construct validity was determined using several different hypotheses-testing analyses. Non-parametric statistics were applied as assumptions for use of parametric tests were not met for the concerned variables. Convergent validity between the new instrument and the control measures (SMMSE, SIB, GDS, and Barthel) were calculated using the Spearman rank correlation, with a strong correlation defined as rs ≥ 0.50 [16]. Internal validity was defined in two ways. Firstly, correlations between the subscales of the cognitive section were investigated. Correlations between items of the functional scale were examined as well. Secondly, correlations between the total scores of the cognitive and functional sections (standard value rs = 0.30–0.70) [17] were explored. Participants were grouped by age, gender, and into several different categories expected to differ in cognition and functioning in predictable ways [12] in order to calculate known-groups validity. Mann-Whitney and Kruskal-Wallis tests were used for group comparisons.
5) Domain precision was estimated using the standard error of measurement (SEM), using the formula SEM = SD x √1 –ICC where ICC represents the test-retest reliability coefficient. An acceptable SEM value was defined as less than half of the baseline standard deviation [5]. Sensitivity to change was further determined by analyzing the differences between each patient’s scores on the first and third evaluations using the Mann-Whitney test. Effect size (ES = mean difference/SDbaseline) [18, 19] was additionally calculated, with values of 0.20–0.49 considered small changes, values of 0.50–0.79 moderate changes, and values ≥0.80 large changes. Relative difference (mean difference/baseline score x 100) [20] was determined as well.
6) Inter-rater and test-retest reliability were calculated using the intra-class correlation coefficient (2-way and 1-way, respectively; both: random effect, individual), with acceptable values ≥0.70 [21].
RESULTS
A total of 40 participants participated in the study, of which a majority were women and were over 85 years of age. The average BIMS score at baseline was 5.50±4.19. Complete participant demographics are detailed in Table 1.
Table 1
Characteristics of sample
| Mean±SD | Min–Max | |
| Age | 89.08±12.66 | 54–107 |
| Baseline BIMS | 5.50±4.19 | 0–12 |
| n | % | |
| Female | 32 | 80.00% |
| Male | 8 | 20.00% |
n = 40; SD, standard deviation; Min, minimum; Max, maximum; BIMS, Brief Interview for Mental Status.
Cognitive section
PCA with orthogonal rotation revealed four factors that accounted for 80.02% of the variance (Table 2). The three factors outlined in the previous validation study were delineated similarly, with items relating to responding to commands and interacting with the rater about the environment loading into one factor (factor 1: called simple commands/interaction with objects), items involving the production of stereotyped language loading into another factor (factor 3: called automatic language), and items requiring responses to social stimuli loading into a separate factor (factor 2). Items involving the response to sensory stimuli loaded into an additional factor in this analysis (factor 4). Several items, “give hand”, “identify card”, “interact with animal”, “use cup”, “count 1–10”, and “days of the week” did not load clearly into one category. The oblique rotation (not shown) displayed the same results as the orthogonal.
Table 2
Factor analysis of the cognitive section of the MAC-SD
| Factor | ||||
| 1 | 2 | 3 | 4 | |
| Greeting | 0.772 | |||
| “How are you” | 0.694 | |||
| Cold/Hot/Vibration | 0.172 | 0.190 | 0.053 | 0.924 |
| Sound | 0.251 | 0.360 | 0.227 | 0.821 |
| Give hand | 0.546 | 0.596 | ||
| Take card | 0.846 | |||
| Identify card | 0.558 | 0.565 | ||
| Return card | 0.740 | 0.512 | ||
| Take toy animal | 0.801 | |||
| Interact with animal | 0.391 | 0.720 | ||
| Return animal | 0.833 | |||
| Take cup | 0.871 | |||
| Use cup | 0.391 | 0.669 | ||
| Return cup | 0.782 | |||
| Give a kiss/hug | 0.489 | 0.483 | ||
| Give name | 0.552 | 0.655 | ||
| Count 1–10 | 0.532 | 0.539 | 0.537 | |
| Sing song | 0.888 | |||
| Days of the week | 0.588 | 0.573 | ||
| Say goodbye | 0.712 | 0.404 | ||
In bold, variables included in each factor. Extraction Method: Principal Component Analysis. Rotation Method: Varimax with Kaiser Normalization.
Confirmatory factor analysis (Table 3; only the final scale structure shown) showed correlation coefficients >0.45 when items were grouped into the four factors delineated above, when factors 2 and 4 were combined into one subscale, and when all items were grouped together into a single scale, with a significant chi-squared value each time (p < 0.001). Combining factors 2 and 4 to create three subscales produced a significantly lower chi-sqaured value than both four subscales and a single scale (p < 0.05). Adjusting factors 1 and 3 did not show any significant changes. Goodness of fit measures (RMSEA, CFI, SRMR) did not meet threshold values for adequate fit regardless of how many factors were specified.
Table 3
Confirmatory factor analysis of the cognitive section of the MAC-SD
| Coef. | OIM* Std. Err. | z | p > |z| | 95% Confidence Interval | |
| Greeting Factor 2 | 0.6937175 | 0.0936778 | 7.41 | 0.000 | 0.5101124–0.8773226 |
| “How are you” Factor 2 | 0.8000528 | 0.0693376 | 11.54 | 0.000 | 0.6641537–0.9359519 |
| Cold/hot/vibration Factor 2 | 0.4973467 | 0.1315129 | 3.78 | 0.000 | 0.2395863–0.755107 |
| Sound Factor 2 | 0.6573681 | 0.1021641 | 6.43 | 0.000 | 0.4571302–0.8576061 |
| Say goodbye Factor 2 | 0.8062392 | 0.0666294 | 12.10 | 0.000 | 0.675648–0.9368305 |
| Give hand Factor 1 | 0.7469163 | 0.0731531 | 10.21 | 0.000 | 0.6035389–0.8902938 |
| Take card Factor 1 | 0.9099374 | 0.0307906 | 29.55 | 0.000 | 0.8495889–0.9702858 |
| Identify card Factor 1 | 0.8191073 | 0.055418 | 14.78 | 0.000 | 0.71049–0.9277246 |
| Return card Factor 1 | 0.902248 | 0.0329971 | 27.34 | 0.000 | 0.8375749–0.9669211 |
| Take animal Factor 1 | 0.8410698 | 0.0498341 | 16.88 | 0.000 | 0.7433967–0.9387429 |
| Interact with animal Factor 1 | 0.6254078 | 0.0993702 | 6.29 | 0.000 | 0.4306457–0.8201698 |
| Return animal Factor 1 | 0.8627001 | 0.0436965 | 19.74 | 0.000 | 0.7770566–0.9483436 |
| Take cup Factor 1 | 0.9117493 | 0.0300985 | 30.29 | 0.000 | 0.8527574–0.9707412 |
| Use cup Factor 1 | 0.4994958 | 0.1217001 | 4.10 | 0.000 | 0.2609679–0.7380236 |
| Return cup Factor 1 | 0.9199212 | 0.0277027 | 33.21 | 0.000 | 0.8656249–0.9742175 |
| Give kiss/hug/handshake Factor 1 | 0.6336011 | 0.0973228 | 6.51 | 0.000 | 0.4428518–0.8243503 |
| Give name Factor 3 | 0.9433108 | 0.0218006 | 43.27 | 0.000 | 0.9005824–0.9860391 |
| Count 1–10 Factor 3 | 0.9564361 | 0.0191431 | 49.96 | 0.000 | 0.9189164–0.9939558 |
| Sing song Factor 3 | 0.6385694 | 0.0967161 | 6.60 | 0.000 | 0.4490093–0.8281294 |
| Days of the week Factor 3 | 0.9540164 | 0.0189452 | 50.36 | 0.000 | 0.9168844–0.9911483 |
*OIM, observed information matrix. Root mean squared error of approximation = 0.19; Comparative fit index = 0.74; Standard root mean squared residual = 0.09; χ2 = 411.79, Prob > χ2 = 0.0000; difference between 4 factor and 1 factor χ2 values ≤ 77.32 p < 0.005.
Table 4 contains the psychometric data for the cognitive section. Data was computable in 100% of the participants. There were no significant floor effects or skewness in any subscale or in the section in total. The only domain to exhibit ceiling effects was automatic language. Each subscale as well as the total score had a Cronbach’s alpha of >0.70, with item-total correlations ≥ 0.78 and item homogeneity ranging from 0.47 to 0.73.
Table 4
Psychometric properties of the cognitive section of the MAC-SD
| Social/sensory | Interaction with objects | Automatic language | Total | |
| Acceptability | ||||
| Fully Computable | 100% | 100% | 100% | 100% |
| Mean±SD | 14.34±5.77 | 29.15±12.94 | 14.95±8.87 | 58.44±25.79 |
| Median | 14 | 34 | 20 | 70 |
| Range | 0–29 | 0–45 | 0–23 | 0–93 |
| Skewness | –0.37 | –0.89 | –0.78 | –0.84 |
| Floor effect (%) | 2.44 | 2.44 | 14.63 | 2.44 |
| Ceiling effect (%) | 2.44 | 2.44 | 17.07 | 2.44 |
| Internal consistency | ||||
| Cronbach’s alpha | 0.83 | 0.94 | 0.92 | |
| Item-total correlation | 0.78 | 0.76 | 0.90 | |
| Item homogeneity | 0.47 | 0.60 | 0.73 | |
| Convergent validity* | ||||
| Correlation with MMSE | 0.78 | 0.86 | 0.70 | 0.89 |
| Correlation with SIB | 0.74 | 0.86 | 0.71 | 0.87 |
| Correlation with Barthel | 0.66 | 0.78 | 0.43 | 0.71 |
| Correlation with GDS | –0.75 | –0.79 | –0.63 | –0.80 |
| Internal validity | ||||
| Correlation cognitive –functional* | –0.74 | –0.86 | –0.51 | –0.81 |
| Inter-subscale correlation* | 0.65–0.80 | 0.56–0.80 | 0.56–0.64 | |
| Precision | ||||
| SEM (SD/2) (n = 43) | 2.38 (2.89) | 3.17 (6.47) | 2.51 (4.43) | 5.16 (12.90) |
| Inter-rater reliability** | ||||
| ICC | 0.92 | 0.92 | 0.92 | 0.93 |
| Test-retest reliability** | ||||
| ICC | 0.98 | 0.99 | 0.99 | 0.99 |
| Change** | ||||
| Mean difference: 1st eval–3rd eval±SDdiff*** | 0.75±5.16a | 3.45±7.89 | 3.75±5.86 | 7.95±15.62 |
| Relative difference | 5.23% | 11.84% | 25.08% | 13.60% |
| Effect size (difference/SDbaseline) | 0.13 | 0.27 | 0.42 | 0.31 |
*Spearman rank correlation coefficient (all, p < 0.001); **n = 20; ***p≤0.05 except for a, p≥0.06.
Each subscale and the section as a whole showed correlation coefficients ≥0.74 with the SMMSE and the SIB; correlation coefficients with the Barthel and GDS ranged from 0.43–0.80. Inter-subscale correlations fell within the target range, with values ranging from 0.56–0.80. Inter-rater and test-retest reliability analyses for each subsection and the total score revealed ICC values ≥0.92, far surpassing the threshold values. SEM values for the individual subscales and the entire section as well were less than half of the standard deviation of the baseline mean score, which was the threshold for significance used (Table 4).
Significant changes between the first and third evaluations were seen in the total section score and in each subscale score except social/sensory stimulation (Δ= 0.75). Small effect sizes were observed in the simple commands/interaction with objects and automatic language subscales (ES = 0.27 and 0.42) respectively and the section total (ES = 0.31). The effect size seen in the social/sensory stimulation subscale was considered not significant (ES = 0.13). The automatic language subscale displayed the greatest relative difference, 25.08%, while the social/sensory stimulation subscale showed the smallest relative difference (5.23%). The total score displayed a relative difference of 13.60% (Table 4).
Table 6 contains the data on known-groups validity. The cognitive subsection scores and total score were able to distinguish between high, medium, and low SMMSE, SIB, baseline BIMS and Barthel scores (with the exception of automatic language scores not differing significantly among groups of different Barthel scores), and between different GDS scores. No significant differences between ages or genders were found (Table 6).
Table 5
Psychometric properties of the functional section of the MAC-SD
| Bathing | Dressing | Personal hygiene | Toileting | Incontinence | Mobility | Feeding | Total | |
| Acceptability | ||||||||
| Fully Computable | 100% | 100% | 100% | 100% | 100% | 100% | 100% | 100% |
| Mean±SD | 6.1±1.13 | 5.68±1.40 | 5.25±1.78 | 5.50±1.96 | 5.00±2.34 | 5.18±1.95 | 4.05±2.18 | 36.75±11.23 |
| Median | 6 | 6 | 6 | 6 | 6.5 | 6 | 4 | 40 |
| Range | 3–7 | 1–7 | 1–7 | 1–7 | 1–7 | 1–7 | 1–7 | 13–49 |
| Skewness | –1.28 | –1.55 | –0.80 | –1.32 | –0.53 | –0.84 | 0.14 | –0.67 |
| Floor effect (%) | 5.00 | 2.50 | 2.50 | 10.00 | 7.50 | 8.57 | 10.00 | 2.50 |
| Ceiling effect (%) | 47.50 | 27.50 | 32.50 | 42.50 | 50.00 | 31.43 | 22.50 | 20.00 |
| Internal Consistency | ||||||||
| Cronbach’s alpha | 0.94 | 0.94 | 0.93 | 0.92 | 0.93 | 0.93 | 0.94 | |
| Item-total correlation | 0.82 | 0.85 | 0.89 | 0.93 | 0.90 | 0.91 | 0.84 | |
| Item homogeneity | 0.73 | 0.73 | 0.80 | 0.79 | 0.80 | 0.74 | 0.75 | |
| Convergent validity* | ||||||||
| Correlation with GDS | 0.63 | 0.79 | 0.82 | 0.75 | 0.79 | 0.77 | 0.78 | 0.87 |
| Correlation with Barthel | –0.80 | –0.84 | –0.89 | –0.87 | –0.79 | –0.84 | –0.87 | –0.95 |
| Correlation with MMSE | –0.59 | –0.74 | –0.75 | –0.75 | –0.69 | –0.67 | –0.67 | –0.78 |
| Correlation with SIB | –0.62 | –0.80 | –0.77 | –0.76 | –0.70 | –0.70 | –0.73 | –0.83 |
| Precision | ||||||||
| SEM (SD/2) (n = 43) | 0.28 (0.57) | 0.34 (0.70) | 0.47 (0.89) | 0.55 (0.98) | 0.62 (1.17) | 0.52 (0.98) | 0.53 (1.09) | 2.75 (5.62) |
| Inter-rater reliability** | ||||||||
| ICC | 0.97 | 0.99 | 0.95 | 0.98 | 0.99 | 0.98 | 0.98 | 0.99 |
| Test-retest reliability** | ||||||||
| ICC | 0.99 | 0.99 | 0.99 | 0.99 | 0.99 | 0.99 | 0.99 | 0.99 |
| Change** | ||||||||
| Mean difference –1st eval–3rd eval±SDdiff*** | –0.3±0.80a | –0.45±1.43 | –0.45±1.79a | –0.15±1.79a | –0.8±2.12a | –0.4±1.43a | –1.2±1.36 | –3.75±8.45 |
| Relative difference | 4.91% | 7.92% | 8.57% | 2.72% | 16.00% | 6.90% | 29.63% | 10.20% |
| Effect size (difference/SDbaseline) | 0.27 | 0.32 | 0.25 | 0.08 | 0.34 | 0.21 | 0.55 | 0.33 |
*Spearman rank coefficient (all, p < 0.0001); **n = 20; ***All differences were p≤0.05 except a, p≥0.09.
Table 6
Known-groups validity of the MAC-SD
| Functional section | Cognitive section | |||||||||||
| Categories | Bathing | Dressing | Personal hygiene | Toileting | Incontinence | Mobility | Feeding | Total | Social/sensory | Simple orders/interaction | Automatic language | Total |
| Sexa | n.s. | n.s. | n.s. | n.s. | n.s. | n.s. | n.s. | n.s. | n.s. | n.s. | n.s. | n.s. |
| Females | 6.16±1.02 | 5.63±1.52 | 5.41±1.70 | 5.59±1.80 | 5.03±2.29 | 5.44±1.76 | 4.06±2.08 | 37.31±10.93 | 14.00±5.84 | 27.83±13.83 | 14.81±8.86 | 56.66±27.30 |
| Males | 5.88±1.55 | 5.88±0.83 | 4.63±2.07 | 5.13±2.64 | 4.88±2.70 | 4.13±2.42 | 4.00±2.73 | 34.50±12.90 | 14.88±5.77 | 32.88±8.10 | 14.88±9.89 | 62.63±19.60 |
| Ageb, * | n.s. | n.s. | n.s. | n.s. | n.s. | n.s. | n.s. | n.s. | n.s. | n.s. | n.s. | n.s. |
| <80 y | 6.50±0.84 | 6.33±0.52 | 5.67±1.63 | 6.67±0.52 | 7.00±0.00 | 5.67±1.86 | 5.00±2.76 | 42.83±5.53 | 9.17±7.14 | 22.17±14.88 | 11.00±11.42 | 42.33±30.36 |
| 80–90 y | 6.36±0.92 | 6.00±1.34 | 5.91±1.22 | 5.91±1.45 | 4.91±2.59 | 5.73±1.68 | 4.36±2.29 | 39.19±10.60 | 13.09±6.61 | 24.91±14.91 | 13.00±9.72 | 51.00±30.40 |
| >90 y | 5.87±1.25 | 5.35±1.53 | 4.83±1.97 | 5.00±2.26 | 4.52±2.31 | 4.78±2.07 | 3.65±1.97 | 34.00±12.03 | 16.00±4.16 | 32.48±10.62 | 16.70±7.74 | 65.17±20.21 |
| Baseline BIMSa, * | p < 0.0065 | p < 0.0001 | p < 0.0001 | p < 0.0002 | p < 0.0001 | p < 0.0002 | p < 0.0010 | p < 0.0001 | p < 0.0001 | p < 0.0003 | p < 0.0015 | p < 0.0001 |
| 0–6 | 6.64±0.61 | 6.53±0.62 | 6.53±0.72 | 6.71±0.59 | 6.76±0.75 | 6.47±0.80 | 5.47±2.00 | 45.11±5.15 | 9.88±4.01 | 20.65±12.69 | 9.41±9.14 | 39.94±23.37 |
| 6–12 | 5.70±1.26 | 5.04±1.49 | 4.30±1.74 | 4.60±2.15 | 3.70±2.27 | 4.22±1.95 | 3.00±1.68 | 30.57±10.50 | 17.35±4.73 | 34.91±9.50 | 18.83±6.46 | 71.09±18.83 |
| Barthelb, ** | p < 0.0001 | p < 0.0001 | p < 0.0001 | p < 0.0001 | p < 0.0001 | p < 0.0002 | p < 0.0001 | p < 0.0001 | p < 0.0053 | p < 0.0004 | n.s. | p < 0.0017 |
| 0–10 | 6.77±0.43 | 6.50±0.51 | 6.37±1.05 | 6.68±0.48 | 6.59±1.05 | 6.23±1.20 | 5.68±1.46 | 44.86±4.17 | 11.63±5.47 | 21.86±13.36 | 11.36±9.85 | 44.82±27.10 |
| 10–40 | 5.75±1.03 | 5.13±1.13 | 4.88±0.99 | 5.63±1.06 | 4.00±1.93 | 5.35±1.04 | 2.13±0.99 | 32.75±6.69 | 16.25±4.95 | 36.63±3.85 | 18.63±6.78 | 71.50±12.76 |
| >40 | 4.90±1.20 | 4.30±1.70 | 3.10±1.45 | 2.80±1.93 | 2.30±1.78 | 2.70±1.57 | 2.00±0.67 | 22.10±7.58 | 18.10±4.25 | 38.10±5.51 | 19.40±4.38 | 75.60±10.99 |
| GDSb | p < 0.0003 | p < 0.0001 | p < 0.0001 | p < 0.0001 | p < 0.0001 | p < 0.0001 | p < 0.0001 | p < 0.0001 | p < 0.0001 | p < 0.0001 | p < 0.0003 | p < 0.0001 |
| 4 | 5.40±0.89 | 4.00±1.87 | 2.20±1.10 | 2.80±2.05 | 1.80±0.84 | 2.60±1.14 | 1.6±0.55 | 20.40±6.80 | 20.60±3.58 | 40.60±2.88 | 21.40±1.82 | 82.60±5.46 |
| 5 | 5.40±1.30 | 5.07±1.28 | 4.60±1.30 | 4.80±2.01 | 3.60±2.06 | 4.27±1.91 | 2.74±1.58 | 30.47±8.40 | 16.40±4.45 | 36.20±4.34 | 19.00±5.99 | 71.60±11.12 |
| 6 | 6.83±0.39 | 6.33±0.49 | 6.25±0.87 | 6.56±0.52 | 6.75±0.45 | 6.25±0.87 | 5.17±1.59 | 44.08±3.83 | 14.08±2.84 | 28.42±9.91 | 15.50±8.02 | 58.00±18.17 |
| 7 | 6.75±0.46 | 6.88±0.35 | 6.86±0.35 | 7.00±0.00 | 7.00±0.00 | 6.88±0.35 | 6.38±1.06 | 47.75±2.43 | 6.13±3.34 | 8.38±6.67 | 1.88±3.23 | 16.38±11.24 |
| SMMSEb, ** | p < 0.0193 | p < 0.0007 | p < 0.0003 | p < 0.0003 | p < 0.0015 | p < 0.0008 | p < 0.0023 | p < 0.0001 | p < 0.0001 | p < 0.0001 | p < 0.0001 | p < 0.0001 |
| 0–5 | 6.75±0.42 | 6.67±0.49 | 6.67±0.65 | 6.92±0.29 | 6.92±0.29 | 6.75±0.45 | 5.75±1.86 | 46.42±3.65 | 7.92±4.23 | 13.75±10.88 | 3.17±5.63 | 24.83±17.18 |
| 5–10 | 6.40±0.89 | 6.00±0.71 | 6.00±0.71 | 5.80±1.64 | 5.60±2.07 | 5.20±1.48 | 4.80±1.30 | 39.80±8.23 | 14.40±1.94 | 32.60±1.82 | 18.60±5.03 | 65.60±6.67 |
| >10 | 5.70±1.26 | 5.09±1.53 | 4.35±1.80 | 4.70±2.12 | 3.87±2.34 | 4.35±2.04 | 3.00±1.88 | 31.04±10.84 | 17.39±4.12 | 35.91±7.63 | 20.07±3.87 | 73.39±12.91 |
| SIBb, ** | p < 0.0009 | p < 0.0001 | p < 0.0001 | p < 0.0001 | p < 0.0001 | p < 0.0001 | p < 0.0001 | p < 0.0001 | p < 0.0001 | p < 0.0001 | p < 0.0001 | p < 0.0001 |
| 0–30 | 6.73±0.46 | 6.73±0.46 | 6.67±0.62 | 6.93±0.26 | 6.93±0.26 | 6.73±0.59 | 5.87±1.73 | 46.60±3.68 | 8.80±4.28 | 15.53±11.34 | 5.40±7.34 | 29.73±19.59 |
| 30–60 | 6.25±1.49 | 5.88±0.35 | 5.25±1.83 | 5.25±2.12 | 5.00±2.27 | 4.50±2.20 | 4.25±1.91 | 36.38±9.67 | 15.88±3.48 | 33.50±2.45 | 19.13±4.94 | 68.50±7.17 |
| >60 | 5.47±1.07 | 4.65±1.54 | 4.00±1.54 | 4.35±2.00 | 3.29±2.11 | 4.12±1.76 | 2.35±1.11 | 28.23±9.29 | 18.12±3.81 | 38.41±4.47 | 21.12±1.62 | 77.65±7.35 |
Values represent the mean score±standard deviation on each subscale and the entire scale for each category. aMann-Whitney test; b Kruskal-Wallis test; *Categories based on the median and interquartile ranges; **categories based on the media.
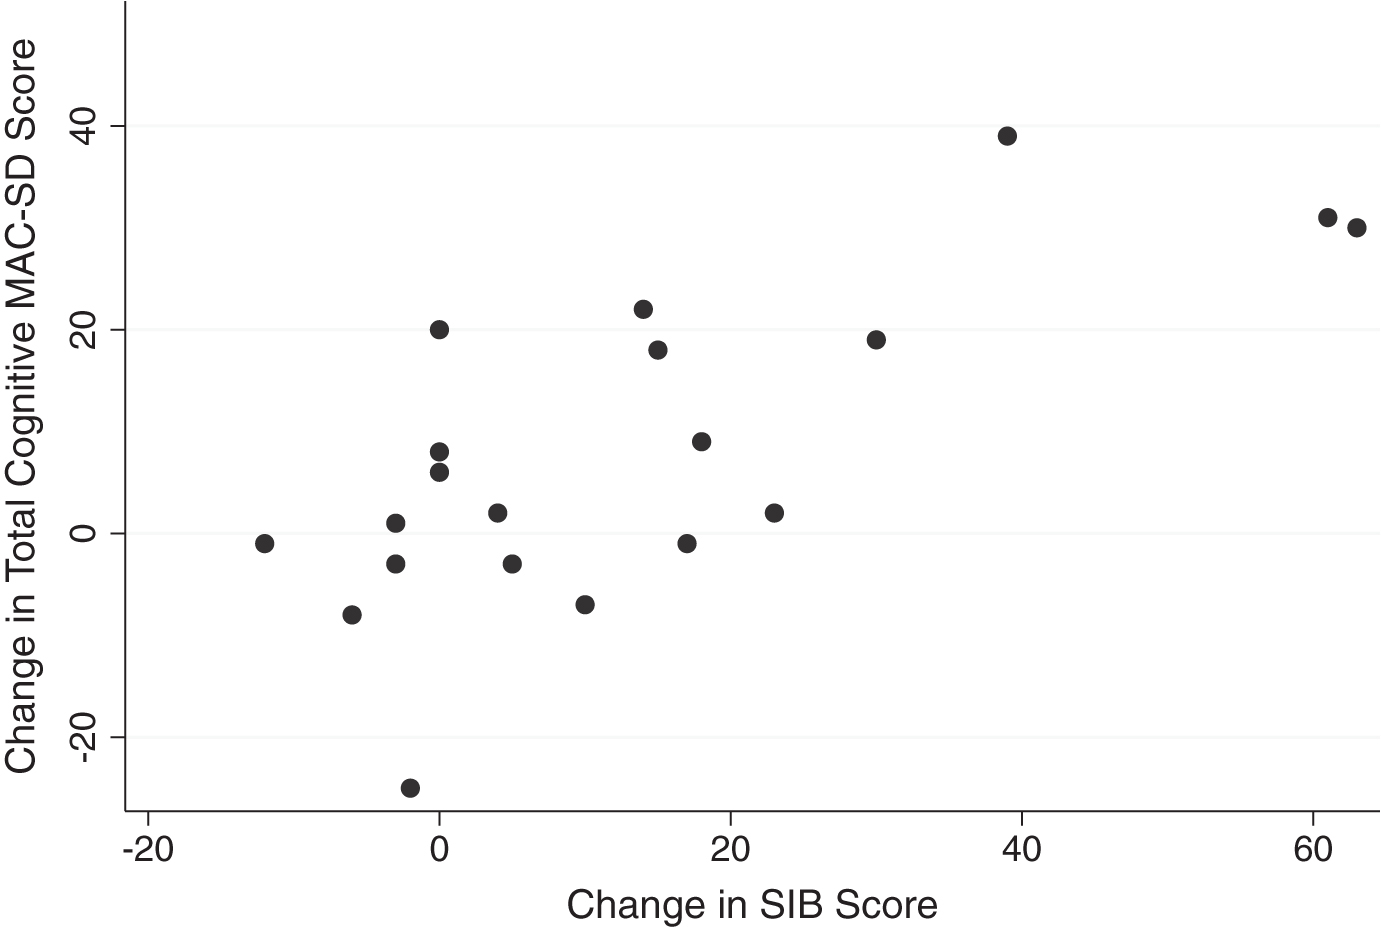
Graphic comparisons between the cognitive section total scores and the SMMSE and SIB scores reveal that those who scored 0 on the control measures had wide ranges of scores on the MAC-SD (Figs. 1 and 2, MAC-SD cognitive scores from 0–45). Additionally, those participants whose SMMSE and/or SIB scores did not change from the first to the third evaluation showed a change of up to 20 points on the MAC-SD cognitive section (Figs. 3 and 4).
Fig.1
Range of MAC-SD cognitive scores by Severe Mini-Mental State Exam (SMMSE) Score. Note the range of MAC-SD scores at SMMSE = 0.
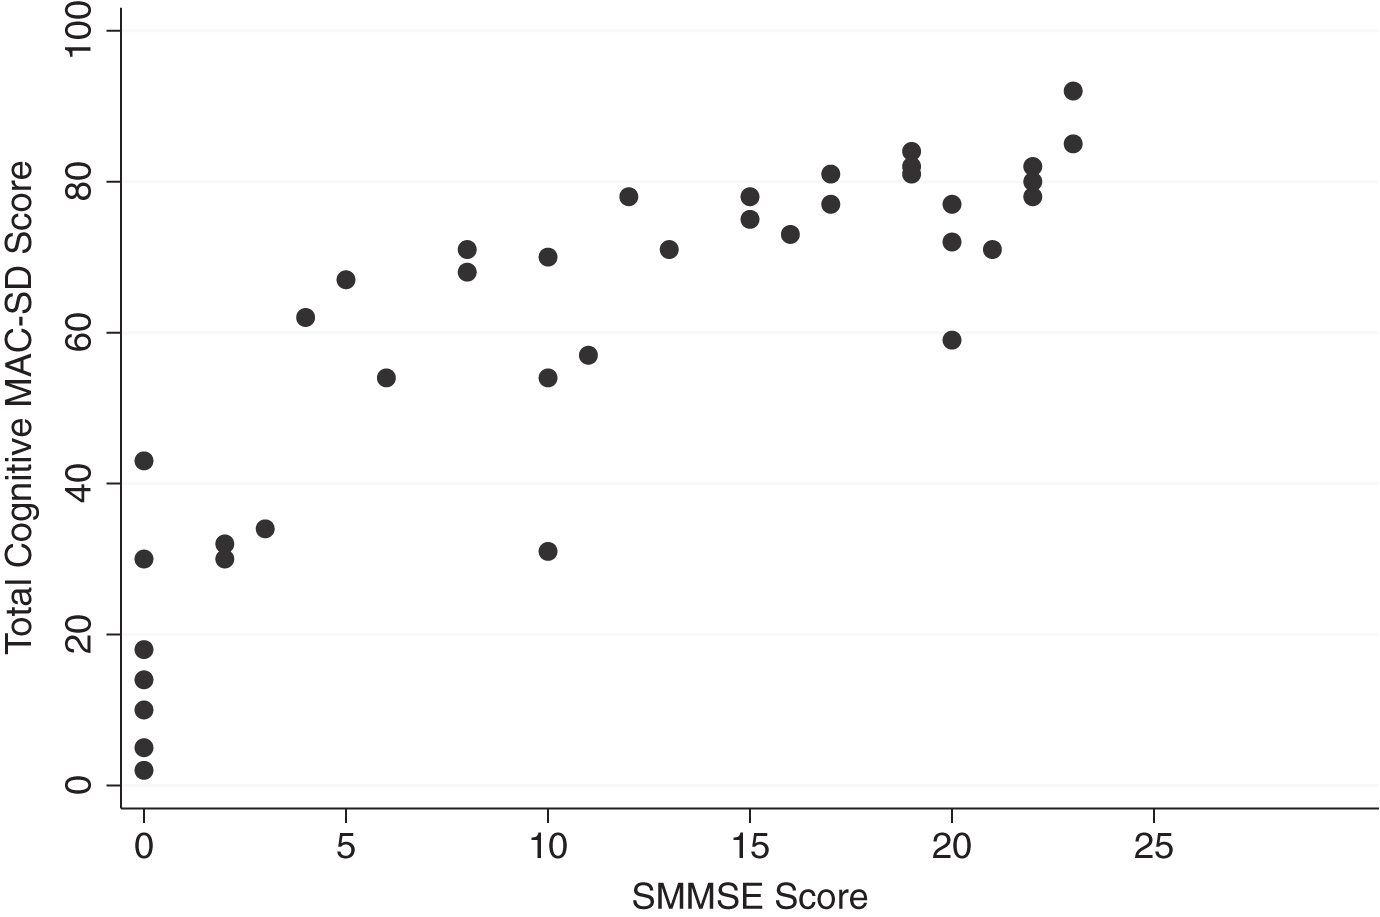
Fig.2
Range of MAC-SD cognitive scores by Severe Impairment Battery (SIB) score. Note the range of MAC-SD scores at SIB = 0.
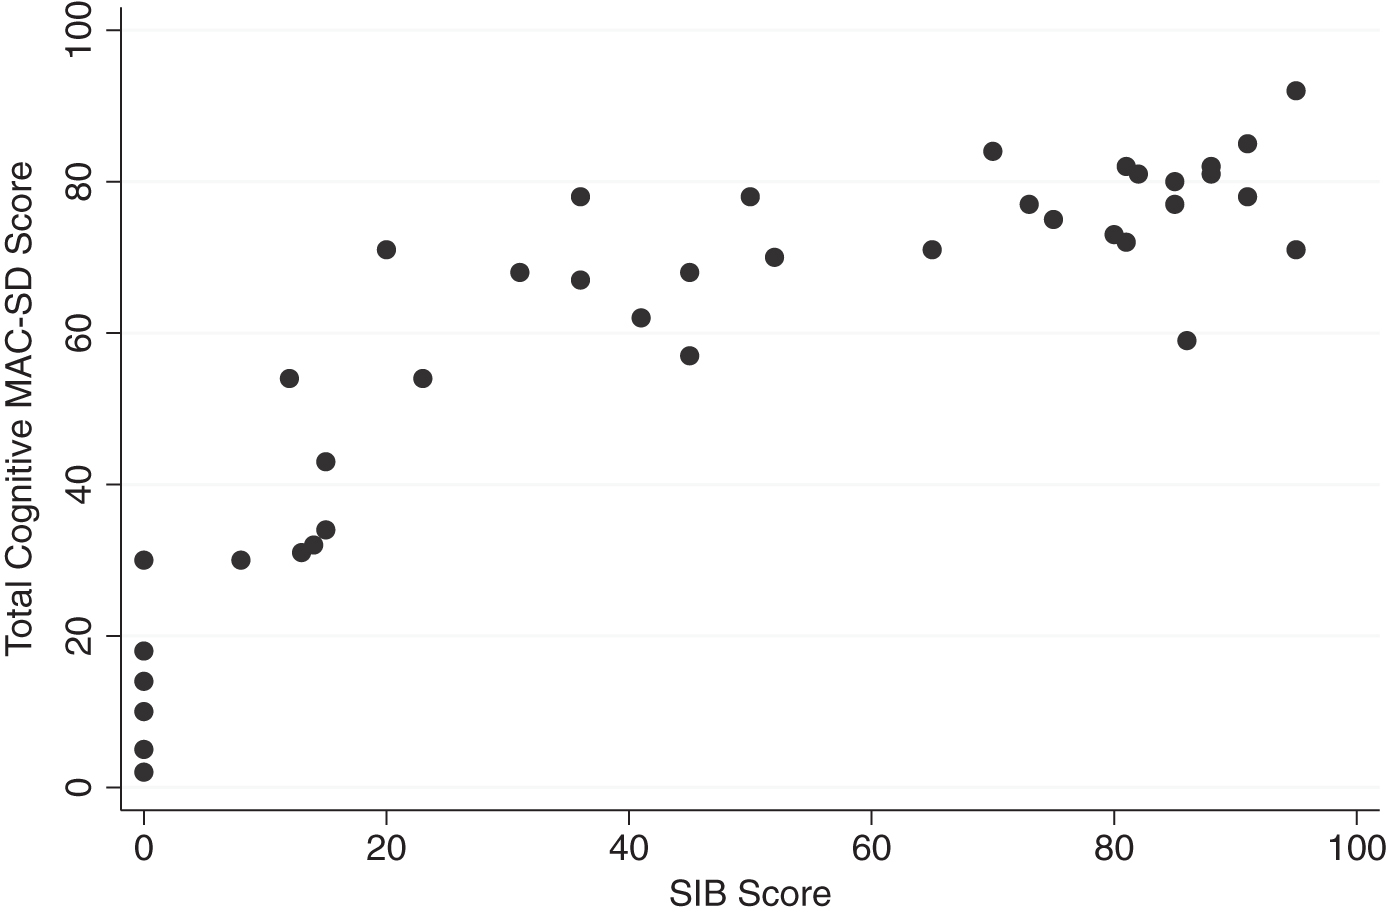
Fig.3
Change in MAC-SD cognitive score by change in Severe Mini-Mental State Exam (SMMSE) score. Note the range of change in MAC-SD scores when change in SMMSE = 0 (change = 1st evaluation score-3rd evaluation score).
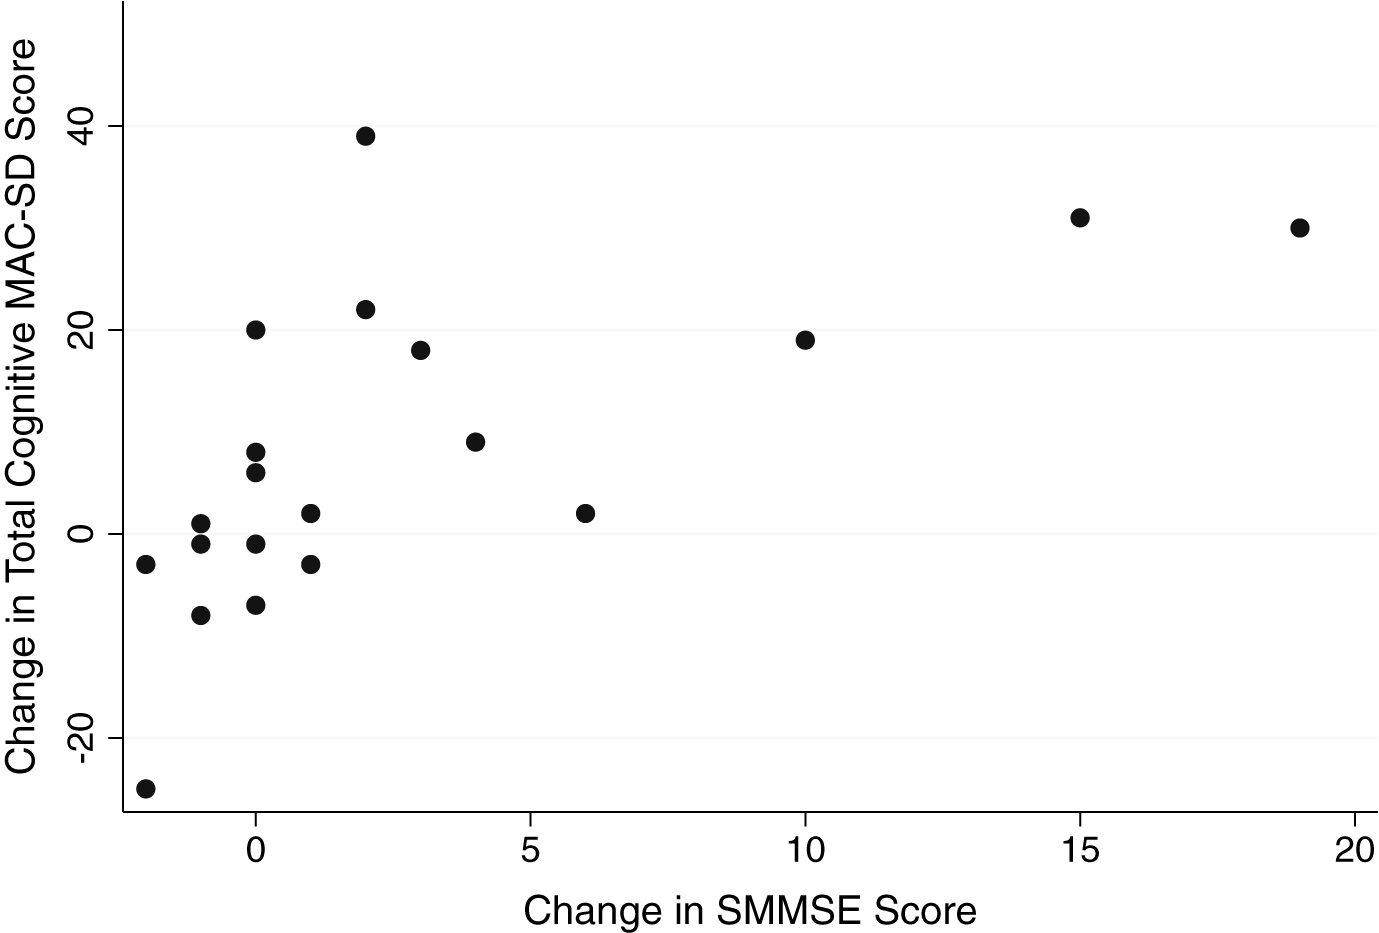
Fig.4
Change in MAC-SD cognitive score by change in Severe Impairment Battery (SIB) score. Note the range of change in MAC-SD scores when change in SIB score = 0 (change = 1st evaluation score-3rd evaluation score).
Functional section
100% of the data was fully computable for the functional section. There were no significant floor effects, while ceiling effects were significant for each subscale but not the total score. Some items showed a slight negative skewness, however, the total score did not display any skew (Table 5).
Threshold values were reached for inter-rater and test-retest reliability as well as internal consistency benchmarks, with ICC values ≥0.95, Cronbach’s alpha and item homogeneity >0.70, and item-total correlations ≥0.82. Correlations between the functional items and the section total and the Barthel and GDS were ≥ |0.75|, while correlations with the SMMSE and SIB ranged from –0.59––0.83. Precision, as measured by SEM values, fell below threshold for all functional items and the section total (Table 5). Internal validity, as measured by correlations with the cognitive subscales and total scores, ranged from 0.51–0.86 (Table 4).
Known groups validity data for the functional section can be found in Table 6. The individual items and the section overall were able to distinguish between high, medium, and low SMMSE, SIB, baseline BIMS and Barthel scores and between different GDS scores. No significant differences between ages or genders were found. Participants who scored 0 on the Barthel displayed MAC-SD total functional scores ranging from 42–49 (Fig. 5).
Fig.5
Change in MAC-SD functional score by change in Barthel Index of Activities of Daily Living (Barthel) score. Note the range of change in MAC-SD scores when change in Barthel score = 0 (change = 1st evaluation score-3rd evaluation score).
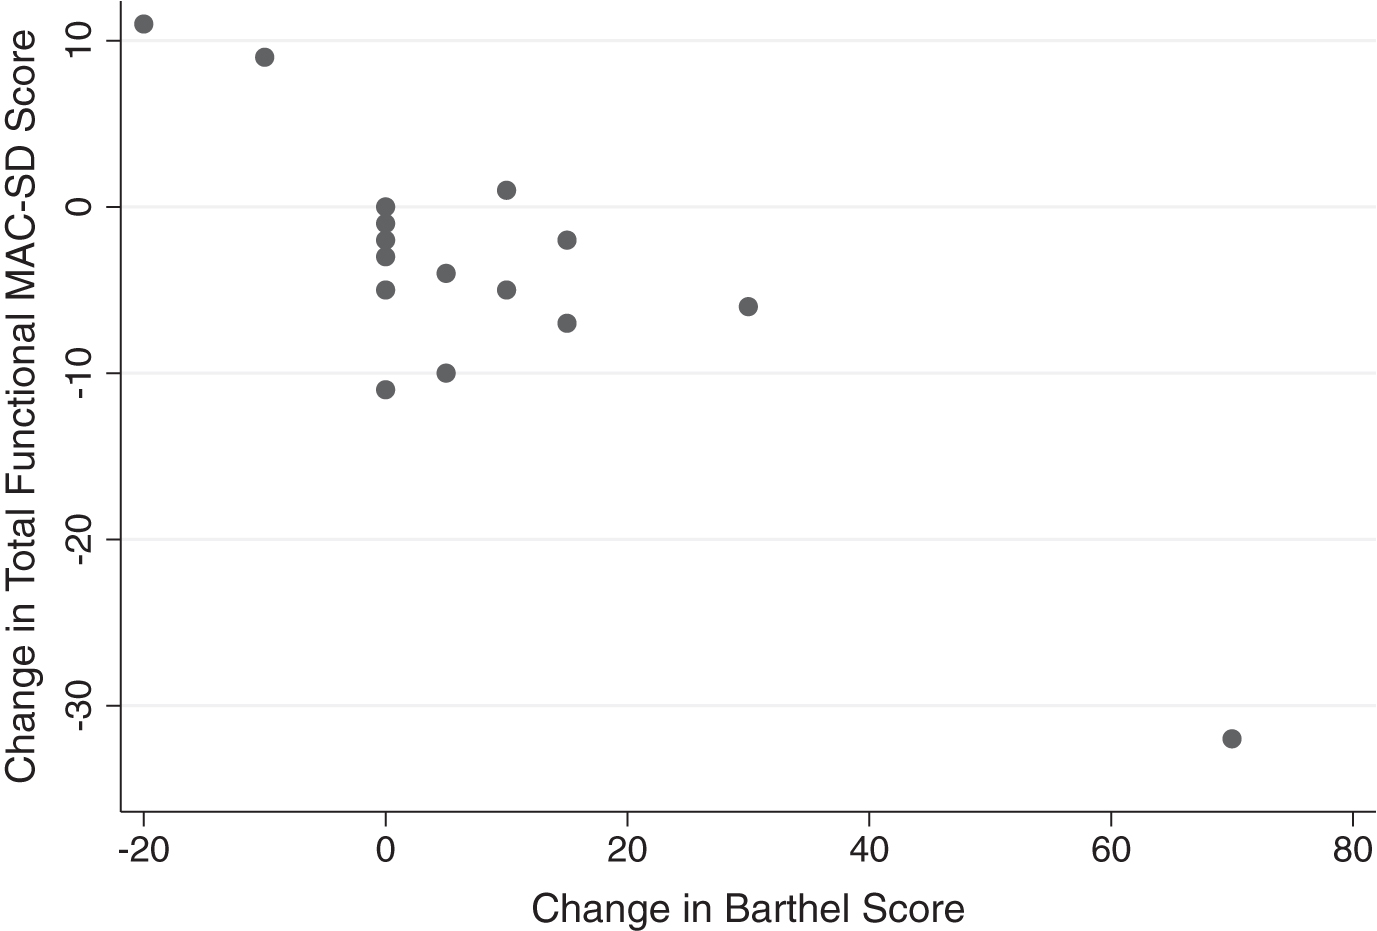
Significant changes between the first and third evaluations were found in the section total and the dressing and feeding items only. Small effect sizes (ES = 0.21–0.55) were found in every item except for toileting (ES = 0.08, not significant) and in the section overall. Relative differences ranged from 2.72% –29.63%. The largest change was seen in the feeding item (ES = 0.55, relative difference = 29.63%). While the absolute changes measured by the functional section of the MAC-SD were small or negligible, participants whose scores on the Barthel did not change at all from the first to the third evaluation showed changes of up to 11 points on the MAC-SD functional section (Fig. 5).
DISCUSSION
The aim of this study was to determine the reliability, validity, and clinical utility of the English version of the MAC-SD. The results of this preliminary investigation, explained in detail below, reveal that the English MAC-SD can function as a reliable, valid, and clinically useful tool to evaluate cognition and functioning in severe dementia.
Cognitive section
PCA revealed that the three factors delineating the cognitive section subscales found in the analysis of the Spanish version were also present in the English version, with the addition of a fourth factor containing the sensory stimulation items. As in the previous analysis, several items did not clearly load into one factor. However, the three subscales (social/sensory stimulation, simple commands/interaction with objects, and automatic language) were retained because they simplify the application of scores on the MAC-SD cognitive section to the development and selection of therapeutic goals. Items that loaded into more than one factor were placed into the subscale in which they fit conceptually and had high internal consistency. The sensory stimulation items that loaded into their own factor were combined with the social stimulation items to for the social/sensory stimulation subscale, because those items had their second-highest factor loadings in the same factor as the social stimulation items (Table 2) and because combining the two factors would make scoring the exam easier. The internal consistency and validity of the social/sensory stimulation subscale was very high (Table 4), indicating that this combination is acceptable. CFA additionally confirmed the above structure (Table 3), as the chi-squared value was significantly smaller with three subscales compared to chi-squared values for four subscales or no subscales at all, and there were no significant differences in correlation coefficients or other measures of goodness of fit with 3 versus 4 or 0 subscales. Chi-squared values were significant in all analyses, while goodness of fit metrics did not meet threshold values for acceptable fit in any of the analyses, which would seem to indicate a poor fit. However, considering that there were no indicators of acceptable fit regardless of how many combinations of factors were used, there is no evidence that the proposed structure is less statistically sound than any other. Additionally, the subscales were designed to allow easy translation of the numeric scores into therapeutic targets. Each subscale correlates with different types of therapeutic activities and scores on those subscales then provide information to therapists on what cognitive skills patients retain and what they might need improvement upon, as well as which types of therapeutic activities might work best for each patient. For example, a patient with a low score on the automatic language subscale might benefit from language stimulation and music therapy; a patient with a higher score on the social/sensory stimulation subscale than the interaction with objects/simple commands subscale might do better in group programs while a patient with the opposite pattern might benefit more from one on one sessions. Considering the clinical utility of the subscales, they were retained. However, confirmation of the structure with further research is necessary.
Data quality and acceptability were satisfactory, which indicates that the scale is appropriate for use in the target population. No floor or ceiling effects were seen in any of the subsections or in the total score. The absence of floor effects has large implications for the clinical utility of the MAC-SD, considering that every other scale intended for use in this population does exhibit floor effects [4, 22]. In fact, one of the motivations for developing the MAC-SD was the need for a measure without floor effects. That the MAC-SD can provide meaningful information about patients with even the most severe dementia opens the door for research into effective therapy and care practices with this population, which is so difficult in large part due to a lack of appropriate measures.
Measures of internal consistency and validity were acceptable (Table 4). As in the Spanish version, the cognitive section subscales were shown to be very highly related but not redundant, as illustrated by the internal consistency analysis. Known groups validity analysis revealed that there are significant differences in the cognitive subscale and section total MAC-SD scores between groups of patients expected to differ in cognition based on their performance on control measures [7–10]. Additionally, there was no difference in MAC-SD cognitive scores between male and female participants and between participants of different ages, which was expected as these variables have not been shown to have any effect on cognition [23–25]. Analysis of the Spanish version appeared to show that older participants’ cognitive scores were higher than their younger counterparts’; however, that finding was not replicated.
Inter-rater and test-retest reliability values far surpassed threshold values (Table 4), which implies that the MAC-SD is easy to use and interpret. This is another point in favor of the clinical utility of the scale. Convergent validity was additionally satisfactory, with strong correlations to both the cognitive tests used as controls (SMMSE, SIB) and the functional control measures (Barthel, GDS).
Precision, as measured by SEM, was satisfactory, indicating a high sensitivity to change [26, 27]. This is confirmed by the change analysis, in which significant differences between MAC-SD cognitive scores obtained one year apart (1st and 3rd evaluations) were found in every subsection except social/sensory stimulation and in the total score. All sections showed modest relative differences between their first and third evaluations, with the largest change seen in the automatic language subscale (relative difference = 25.08%, effect size = 0.42). This alteration in language production is likely due to the complexity of language. Language is affected earlier in the course of dementia, when the rate of decline is steepest, and is therefore more likely to change in a shorter period of time [28, 29]. Language is also more likely to be deteriorated in more severely demented patients, which explains why the analysis of the Spanish version revealed floor effects in the automatic language subscale that were not seen in this analysis: the participant population who participated in the validation of the Spanish version of the MAC-SD were more severely cognitively impaired at baseline (mean SMMSE = 4.15) than the participant population in this study (mean SMMSE = 11.05).
Although the amount of change detected by the MAC-SD cognitive section was small, Figs. 3 and 4 reveal that the MAC-SD was able to detect a change in cognitive performance that was not seen in the SMMSE or the SIB. This is yet another indication of the clinical utility of the MAC-SD. This patient demographic is often unresponsive and uncommunicative, forcing care providers to use alterations in behavior and mental state to distinguish the effects of medications and/or indicate illnesses. The MAC-SD cognitive section provides a way to detect and quantify subtle changes in these patients, making it a useful evaluative tool.
Several features of the MAC-SD cognitive section make it unique, and uniquely useful, as a tool for evaluation of patients with severe dementia. The possible responses differentiate between lack of a response, a nonverbal response, a verbal response, a verbal response with words, and a verbal response with appropriate words. This allows a much finer tuned description of the severely impaired patient’s capabilities than most, if not all, existing measures for this population. The SIB, for instance, has proven to be a poor indicator of cognitive state, and especially of change in cognitive state, in the last stages of dementia; both the SIB and the SMMSE boast significant floor effects not seen in the MAC-SD, especially in populations with low levels of education [30, 31]. The Spanish version of the MAC-SD showed no floor effects despite the overall low level of education of the participant pool [6], indicating that it is an appropriate measure regardless of participant education level.
Additionally, several items are targeted toward patients with the severest degree of dementia (i.e., sensory stimulation), assuring that some information about any and all possible behavior is captured. This is illustrated in Fig. 1, which compares participants’ scores on the MAC-SD cognitive section to their scores on the SMMSE, and Fig. 2, which compares cognitive MAC-SD scores to SIB scores. In both graphs, participants who scored 0 on the SMMSE and/or the SIB had wide ranges of scores on the MAC-SD.
This distinction between the MAC-SD and other similar measures holds true even when looking at factor analysis or item response theory analyses, which explore the ceiling and floor effects in greater detail than many other techniques. These approaches allow for a more fine-tuned interpretation of the lower bounds of the scales by breaking down the total score into factors or individual items, allowing patterns about dementia severity and loss of specific cognitive domain to become clear [32–34]. However, this method does not address the population scoring zero, nor does it provide any ideas about what cognitive abilities that group retains— it only discusses what those patients cannot do. Additionally, the majority of these analyses do not include the most severely demented patients, and no such analysis has been constructed for the SMMSE.
In contrast, the MAC-SD is designed to reflect what capacities remain, in the hopes of guiding therapy and treatment plans. The overall structure of the cognitive section is geared towards the design of therapeutic activities, as the subscales are grouped as themed therapeutic encounters. Scores on each subscale can help therapists understand what skills the patient has, what skills can be targeted for improvement, and/or how the patient can be appropriately stimulated. Activities that are tailored to the appropriate cognitive and functional level for each patient can then be developed, ensuring the highest level of care for the most incapacitated and vulnerable patients.
Looking at Figs. 1 and 2, it appears that the MAC-SD yields the most information about patients with SMMSE scores ≤12 and/or SIB scores ≤40. Below these cutoffs, MAC-SD scores for a given SMMSE or SIB scores range wildly, indicating that the MAC-SD is more sensitive than either control measure, while above this cutoff MAC-SD scores tend to cluster at the higher ends. However, these are suggestions only; there is no evidence to suggest that the MAC-SD would be completely invaluable at any point, and more research is needed to further define the ideal demographic.
Functional section
Acceptable data quality and acceptability in this section as well further confirms the appropriateness of the instrument. Slight negative skew was noted in several items, but not in the overall section score. No floor effects were detected; however, ceiling effects were found in all functional items (but not the section total) (Table 5). This is a replication of the findings from the validation study of the Spanish version, and is likely due to the same cause. Both validation trials were carried out with a majority of participants consisting of nursing home residents, who have a higher level of functional dependence as a group than community dwelling older adults [35]. Other scales that measure levels of functioning display similar or higher ceiling effects to the MAC-SD, and most existing measures of functioning show significant floor effects when they are applied to this population [36].
Reliability and internal consistency analyses all proved satisfactory. Inter-rater and test-retest reliability were exceptionally high, indicating as in the cognitive section that the MAC-SD functional section is easy to use and interpret. Internal validity was acceptable as well, as measured by the strong correlations between cognitive and functional subscales. Analysis of convergent validity with control measures revealed strong correlations between all functional items and the total functional score and all control measures (Table 5). Each item and the section total showed a very strong ability to differentiate between participant groups expected to differ based on scores on control measures, and did not detect differences between groups not expected to differ, i.e. age and gender [22–24] (Table 6). This combined with the convergent validity results indicate satisfactory validity overall.
SEM values fell within target ranges, which as stated previously indicates a potential high sensitivity to change. Significant differences between the first and third evaluations were found only in the dressing and feeding items, and in the section total as well. However, small effects (ES = 0.21–0.34) were found in most items (bathing, dressing, hygiene, incontinence, mobility) and in the section total; a moderate effect was detected in the feeding item (ES = 0.55) and no significant effect was measured in the toileting item (ES = 0.08) (Table 5). While the lack of change in the toileting item is a replication of the Spanish version validity trial, the previous analysis revealed no change in participants’ feeding scores over 6 months. It is unclear what would cause either result in the feeding item, as well as the lack of change in the toileting item. Further investigation is needed.
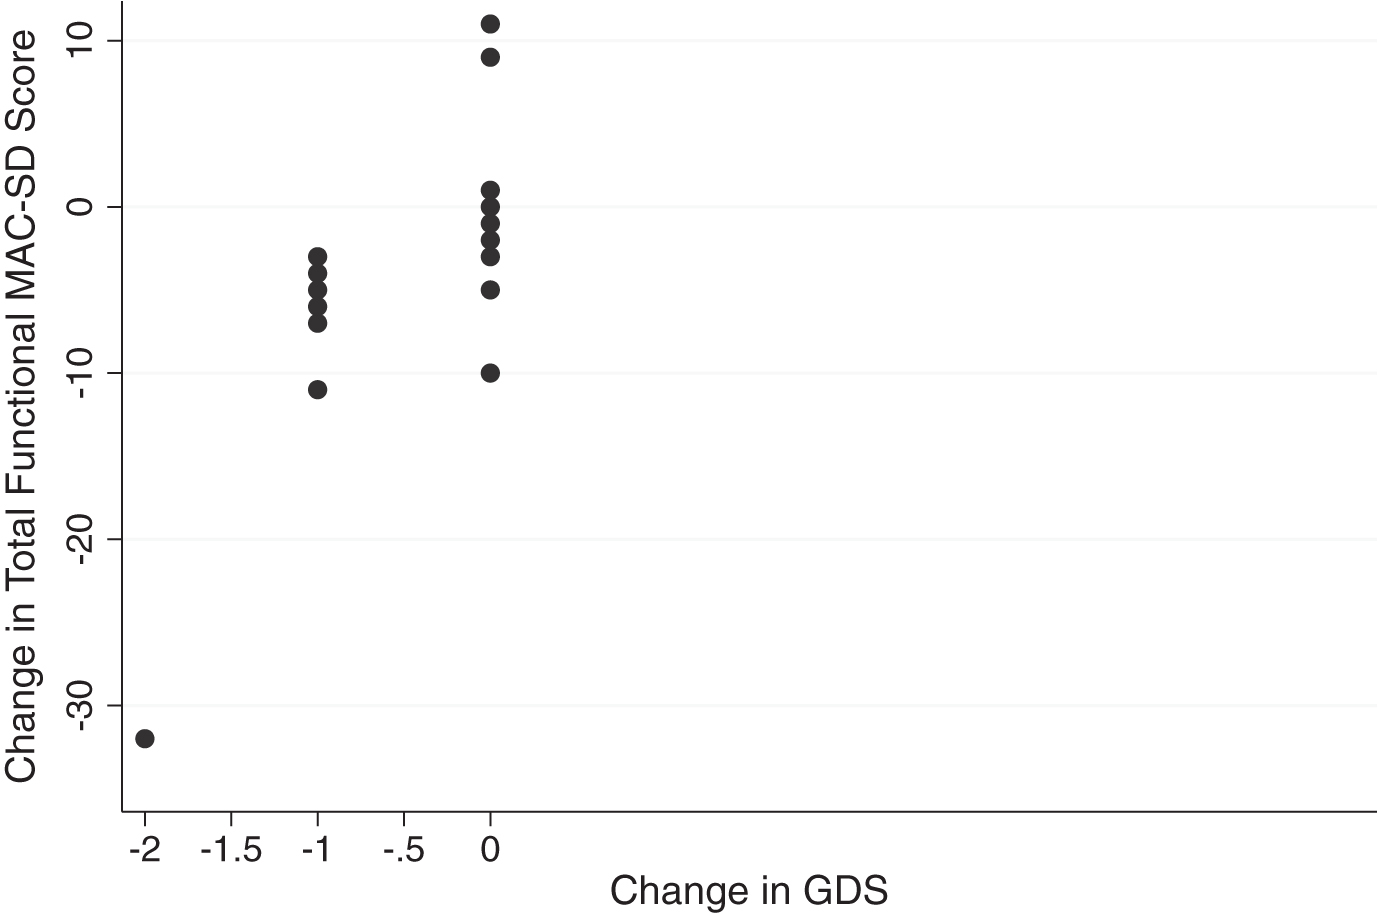
Overall effect sizes were small, again, as seen in the previous trial. This is likely due to the fact that the participant pool is in the last stages of dementia, where progression through the course of the disease slows [37]; it is not unreasonable for the level of functioning to not change much within one year. That being said, the MAC-SD functional section was able to detect change that the control measures were not. As seen in Figs. 5 and 6, participants whose scores on the Barthel or GDS did not change showed changes of up to 10 points on the MAC-SD functional section total. As with the cognitive section, this confirms the clinical utility of the MAC-SD.
Fig.6
Change in MAC-SD functional score by change in Global Deterioration Score (GDS). Note the range of change in MAC-SD scores when change in GDS = 0 (change = 1st evaluation score-3rd evaluation score).
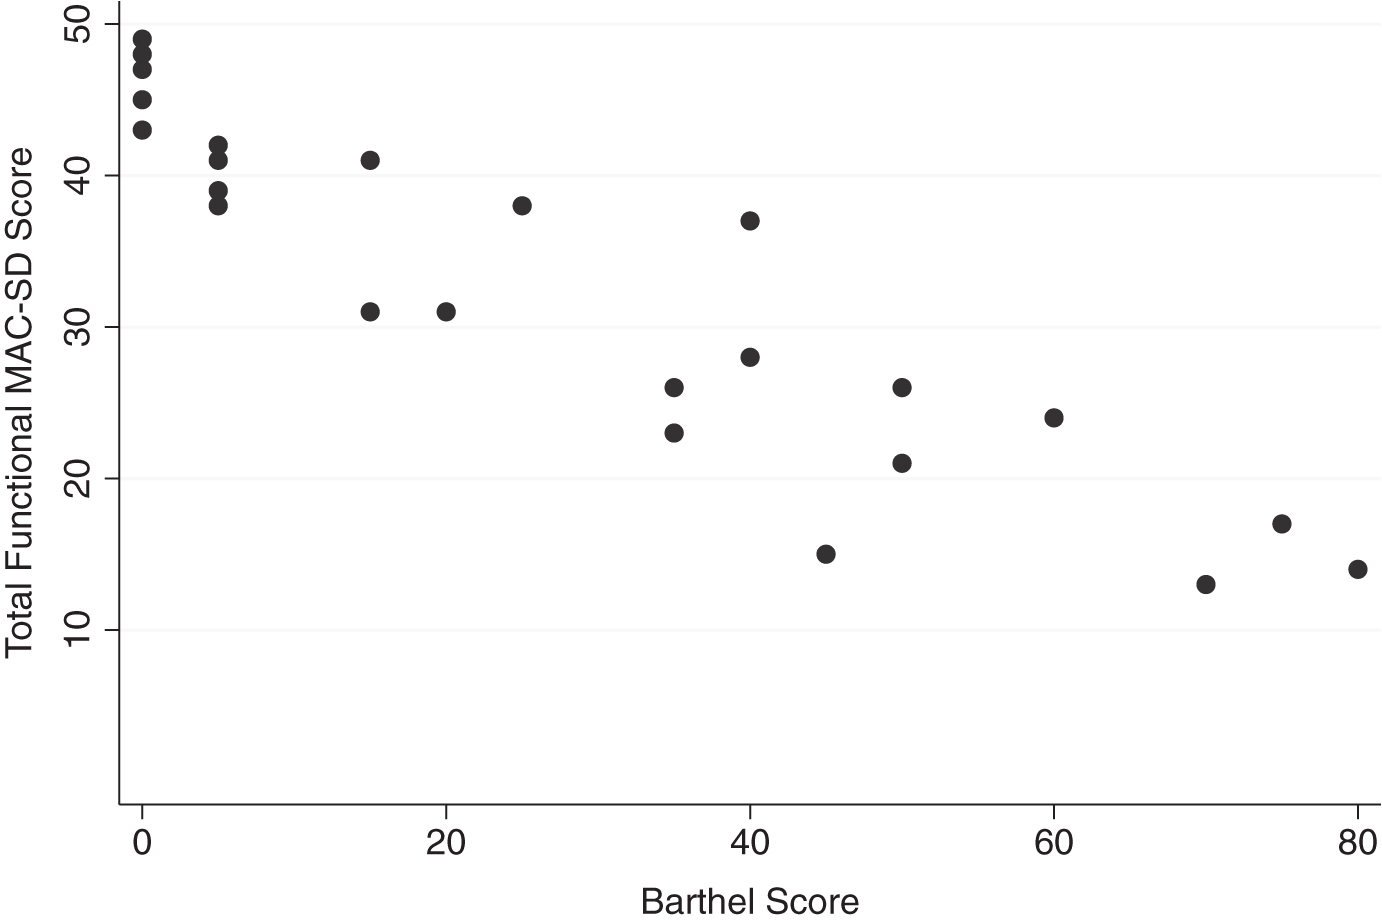
The functional section of the MAC-SD is distinct from other, similar measures in its high level of detail and its practical value. It combines the ability to score patients at different levels of ability on each ADL independently with extremely detailed information on the amount of supervision and assistance patients need for each task. For each of the seven ADLs included in the section, scoring options include completely independent, needing assistance with beginning and ending the task, needing to be checked on while performing the task, needing constant supervision and verbal cues or assistance, needing constant supervision and physical cues or assistance, almost completely dependent but able to assist with the task enough so that mechanical aids (i.e., lifts) are not necessary, and completely dependent. This amount of information both promotes independence by alerting caregivers not to provide more help than is absolutely necessary to patients, and provides a helpful structure for planning and timing daily care tasks. This is an especially valuable organizational tool for professional caregivers in institutions, who have to accomplish ADLs with many patients in a limited time. Additionally, all the detail given by the MAC-SD functional section provides a more nuanced assessment of patient functioning, and does so for more patients due to the lack of floor effects, than most (if not all) existing functional measures, as illustrated in Fig. 7. This then allows healthcare providers and caregivers to detect subtle changes in patients that may indicate illness or other medical issue. In fact, as Fig. 7 reveals, the large range of MAC-SD functional scores for a given Barthel score indicates that the MAC-SD is more sensitive than the Barthel over a large range of patient functionality, meaning that there does not appear to be a cutoff for a group of patients for whom the MAC-SD would be useful. The largest range of MAC-SD scores for a given Barthel score is at Barthel ≤15, however, which signifies that the MAC-SD yields the most information about patients with the most severe functional impairments. Further research is needed to confirm this, however.
Fig.7
Range of MAC-SD functional scores by Barthel Index of Activities of Daily Living (Barthel) Score. Note the range of MAC-SD scores at each Barthel score, especially Barthel = 0.
In addition to serving as a useful tool for directing the care and therapeutic programs of individual patients, the MAC-SD can facilitate research with this patient population. Historically, research with this group has been difficult, due in large part to the lack of appropriate measures with which to measure the effects of any intervention [38]. Not only does the MAC-SD not have detectable floor effects, it is also highly sensitive to change, making it an ideal research tool. This opens up many possibilities for future investigation, both furthering medical understand of the last phases of dementia and potentially improving the lives of millions.
Limitations of this study include a small sample size. While many of the findings from the previous validation study of the Spanish version of the MAC-SD were replicated here, further work is needed to ensure the reproducibility and generalizability of these findings. Additionally, a more longitudinal study of the MAC-SD is warranted, to further determine its ability to detect change in a population that changes very slowly. The authors believe that the sensitivity to change demonstrated by the MAC-SD in this analysis is significant, and that the MAC-SD is picking up on changes in subjects that other, less sensitive measures are missing. However, considering that there are no measures as sensitive in this population as the MAC-SD, it is difficult to verify that claim. Future research should include a comparison of MAC-SD scores to clinician and/or caregiver opinions of changes in cognition and functioning in subjects.
Overall, the MAC-SD appears to be a reliable, valid, sensitive, useful and clinically useful tool, that is easy to use in the evaluation of cognition and functioning in patients with severe dementia. We suggest that the MAC-SD is most useful in patients with SMMSE ≤12, SIB ≤40, and/or Barthel ≤15, i.e., the most severely impaired patients.
CONFLICT OF INTEREST
The authors have no conflicts of interest to report.
ACKNOWLEDGMENTS
The authors would like to thank the staff of Gurwin Jewish Nursing and Rehabilitation Center for their collaboration, without which this research would have been impossible, and Harris Eppsteiner for his assistance with data analysis.
REFERENCES
[1] | Barnes D , Yaffe K ((2011) ) The projected effect of risk factor reduction on Alzheimer’s disease prevalence. Lancet Neurol 10: , 819–828. |
[2] | Bonnel WB ((1996) ) Not gone and not forgotten: A spouse’s experience of late-stage Alzheimer’s disease. J Psychosoc Nurs Ment Health Serv 34: , 23–27. |
[3] | Voisin T , Reynish E , Portet F , Feldman H , Vellas B ((2004) ) What are the treatment options for patients with severe AD? CNS Drugs 18: , 575–583. |
[4] | Holthoff VA , Ferris S , Ihl R , Robert P , Winblad B , Gauthier S , Sternberg K , Tennigkeit F ((2011) ) Validation of the relevant outcomes scale for Alzheimer’s disease: A novel multidomain assessment for daily medical practice. Alzheimers Res Ther 3: , 27. |
[5] | Olazarán J , Agüera-Ortiz L , Osorio RS , León-Salas B , Dobato JL , Cruz-Orduña I , González B , Valentí M , Gil-Ruiz N , Frades B , Ramos García MI , Martínez-Martín P ((2012) ) Promoting clinical research in advanced dementia: Early clinical results of the Alzheimer Center Reina Sofia Foundation. J Alzheimers Dis 28: , 211–222. |
[6] | Heller S , Mendoza Rebolledo C , Rodríguez Blázquez C , Carrasco Chillón L , Pérez Muñoz A , Rodríguez Pérez I , Martínez-Martin P ((2015) ) Validation of the multimodal assessment of capacities in severe dementia: A novel cognitive and functional scale for use in severe dementia. J Neurol 262: , 1198–1208. |
[7] | Harrell LE , Marson D , Chatterjee A , Parrish JA ((2000) ) The Severe Mini-Mental State Examination: A new neuropsychological instrument for the bedside assessment of severely impaired patients with Alzheimer disease. Alzheimer Dis Assoc Disord 14: , 168–175. |
[8] | Saxton J , McGonigle-Gibson KL , Swihart AA , Miller VJ , Boller F ((1990) ) Assessment of the severely impaired patient: Description and validation of a new neuropsychological test battery. Psychol Assess 2: , 298–303. |
[9] | Auer S , Reisberg B ((1997) ) The GDS/FAST staging system. Int Psychogeriatr 9: , 167–171. |
[10] | Mahoney FI , Barthel D ((1965) ) Functional evaluation: The Barthel Index. Md State Med J 14: , 56–61. |
[11] | Martinez-Martin P , Frades-Payo B , Agüera-Ortiz L , Ayuga-Martinez A ((2012) ) A short scale for evaluation of neuropsychiatric disorders in Parkinson’s disease: First psychometric approach. J Neurol 259: , 2299–2308. |
[12] | Byrne BM ((1994) ) Structural equation modeling with EQS and EQS/Windows: Basic concepts, applications, and programming, Sage. |
[13] | Martinez Martin P , Forjaz MJ ((2012) ) How to evaluate validation data. In Rating scales in Parkinson’s disease, Sampaio C , Goetz CG , Schrag A , eds. Oxford University Press, Oxford, pp. 16–41. |
[14] | Ware JE , Gandek B ((1998) ) Methods for testing data quality, scaling assumptions, and reliability: The IQOLA Project approach. International Quality of Life Assessment. J Clin Epidemiol 51: , 945–952. |
[15] | Martinez-Martin P , Rodriguez-Blazquez C , Alvarez-Sanchez M , Arakaki T , Bergareche-Yarza A , Chade A , Garretto N , Gershanik O , Kurtis MM , Martínez-Castrillo JC , Mendoza-Rodriguez A , Moore HP , Rodriguez-Violante M , Singer C , Tilley BC , Huang J , Stebbins GT , Goetz CG ((2013) ) Expanded and independent validation of the Movement Disorder Society – Unified Parkinson’s Disease Rating Scale (MDS-UPDRS). J Neurol 260: , 228–236. |
[16] | Juniper EF , Guyatt GH , Jaeschke R ((1996) ) How to develop and validate a new health-related quality of life instrument. In Quality of life and pharmacoeconomics in clinical trials, 2nd edn., Spilker B , ed. Lippincott-Raven Publishers, Philadelphia, pp. 49–56. |
[17] | Martinez-Martin P , Rodriguez-Blazquez C , Abe K , Bhattacharyya KB , Bloem BR , Carod-Artal FJ , Prakesh R , Esselink RA , Falup-Pecurariu C , Gallardo M , Mir P , Naidu Y , Nicoletti A , Sethi K , Tsuboi Y , van Hilten JJ , Visser M , Zappia M , Chaudhuri KR ((2009) ) International study on the psychometric attributes of the Non-Motor Symptoms Scale in Parkinson disease. Neurology 73: , 1584–1591. |
[18] | Middel B , van Sonderen E ((2002) ) Statistical significant change vs. relevant or important change in (quasi) experimental design: Some conceptual and methodological problems in estimating the magnitude of intervention-related change in health services research. Int J Integr Care 2: , e15. |
[19] | Cohen J ((1977) ) Statistical power analysis for the behavioral sciences. Academic Press, New York. |
[20] | Deyo RA , Centor RM ((1986) ) Assessing the responsiveness of functional scales to clinical change: An analogy to diagnostic test performance. J Chronic Dis 39: , 897–906. |
[21] | Terwee CB , Bot SD , de Boer MR , van der Windt DA , Knol DL , Dekker J , Bouter LM , de Vet HC ((2007) ) Quality criteria were proposed for measurement properties of health status questionnaires. J Clin Epidemiol 60: , 34–42. |
[22] | Robert P , Ferris S , Gauthier S , Ihl R , Winblad B , Tennigkeit F ((2010) ) Review of AD Scales: Is there a need for a new multi-domain scale for therapy evaluation in medical practice? Alzheimers Res Ther 22: , 24. |
[23] | Schmidt R , Kienbacher E , Benke T , Dal-Bianco P , Delazer M , Ladurner G , Jellinger K , Ransmayer G , Schmidt H , Stögmann E , Friedrich J , Wehringer C ((2008) ) Sex differences in Alzheimer’s disease. Neuropsychiatr 22: , 1–15. |
[24] | Xing Y , Wei C , Chu C , Zhou A , Li P , Wu L , Song H , Zuo X , Wang F , Qin W , Li D , Tang Y , Jia XF , Jia J ((2012) ) Stage-specific gender differences in cognitive and neuropsychiatric manifestations of vascular dementia. Am J Alzheimers Dis Other Demen 27: , 433–438. |
[25] | Reed BR , Mungas DM , Kramer JH , Ellis W , Vinters HV , Zarow C , Jagust WJ , Chui HC ((2007) ) Profiles of neuropsychological impairment in autopsy-defined Alzheimer’s disease and cerebrovascular disease. Brain 130: , 731–739. |
[26] | Beckerman H , Roebroeck ME , Lankhorst GJ , Becher JG , Bezemer PD , Verbeek AL ((2001) ) Smallest real difference, a link between reproducibility and responsiveness. Qual Life Res 10: , 571–578. |
[27] | Maheswaran H , Weich S , Powell J , Stewart-Brown S ((2012) ) Evaluating the responsiveness of the Warwick Edinburgh Mental Well-Being Scale (WEMWBS): Group and individual level analysis. Health Qual Life Outcomes 10: , 156. |
[28] | McKhann G , Drachmann D , Folstein M , Katzman R , Price D , Stadlan EM ((1984) ) Clinical Diagnosis of Alzheimer’s disease: Report of the NINCDS-ADRA Work Group under the auspices of Department of Health and Human Services Task Force on Alzheimer’s Disease. Neurology 34: , 939–944. |
[29] | Benke T , Andree B , Hittmair M , Gerstenbrand F ((1990) ) Speech changes in dementia. Fortschr Neurol Psychiatr 58: , 215–223. |
[30] | Schmitt FA ((1997) ) SIB: Current validity and assessment of longitudinal change in AD. Alzheimer Dis Assoc Dis 11: , S51–S56. |
[31] | Chaves MLF ((2014) ) Cognitive assessment in severe dementia and lower levels of education: Reducing negligence. Arq Neuro-Psiquiatr 72: , 267–268. |
[32] | McGrory S , Doherty J , Austin E , Starr J , Shenkin S ((2013) ) Item response theory analysis of cognitive tests in people with dementia: A systematic review. BMC Psychiatry 14: , 47. |
[33] | Soubelet A , Salthouse TA ((2011) ) Correlates of level and change in the Mini Mental State Examination. Psychol Assess 23: , 811–818. |
[34] | Ferris S , Karantzoulis S , Somogyi M , Meng X ((2013) ) Rivastigmine in moderately severe-to-severe Alzheimer’s disease: Severe Impairment Battery Factor Analysis. Alzheimers Res Ther 5: , 63. |
[35] | Rapp MA , Schnaider-Beeri M , Schmeidler J , Sano M , Silverman JM , Haroutunian V ((2005) ) Relationship of neuropsychological performance to functional status in nursing home residents and community-dwelling older adults. Am J Geriatr Psychiatry 13: , 450–459. |
[36] | Sikkes SAM , de Lange-de Klerk ESM , Pijnenburg YAL , Scheltens P , Uitdehaag BMJ ((2009) ) A systematic review of Instrumental Activities of Daily Living scales in dementia: Room for improvement. J Neurol Neurosurg Psychiatr 80: , 7–12. |
[37] | Handels RL , Xu W , Rizzuto D , Caracciolo B , Wang R , Winblad B , Verhey FR , Severens JL , Fratiglioni L , Joore MA , Wimo ((2013) ) Natural progression model of cognition and physical functioning among people with mild cognitive impairment and Alzheimer’s disease. J Alzheimers Dis 14: , 357–365. |
[38] | Schmitt FA , Cragar D , Ashford JW , Reisberg B , Ferris S , Möbius HJ , Stöffler A ((2002) ) Measuring cognition in advanced AD for clinical trials. J Neural Transm Suppl 62: , 135–148. |

